time-resolved analysis of fmri signal changes using brain...
TRANSCRIPT

A
etpasppib©
K
1
apadbt
Vf
0d
Journal of Neuroscience Methods 169 (2008) 222–230
Time-resolved analysis of fMRI signal changes usingBrain Activation Movies
Christian Windischberger a,b, Ross Cunnington c, Claus Lamm d, Rupert Lanzenberger e,Herbert Langenberger f, Luder Deecke g, Herbert Bauer d, Ewald Moser a,b,f,h,∗
a MR Center of Excellence, Medical University of Vienna, Lazarettgasse 14,A-1090 Vienna, Austria
b Center for Biomedical Engineering and Physics, Medical University of Vienna, Austriac Howard-Florey-Institute, University of Melbourne, Australia
d Brain Research Lab, Department of Psychology, University of Vienna, Austriae Department of Psychiatry and Psychotherapy, Medical University of Vienna, Austria
f Department of Radiology, Medical University of Vienna, Austriag Department of Neurology, Medical University of Vienna, Austria
h Department of Psychiatry, University of Pennsylvania, Philadelphia, USA
Received 16 September 2007; received in revised form 27 November 2007; accepted 29 November 2007
bstract
Conventional fMRI analyses assess the summary of temporal information in terms of the coefficients of temporal basis functions. Based onstablished finite impulse response (FIR) analysis methodology we show how spatiotemporal statistical parametric maps may be concatenatedo form Brain Activation Movies (BAMs), dynamic activation maps representing the temporal evolution of brain activation throughout taskerformance. These BAMs enable comprehensive assessment of the dynamics in functional topology without restriction to predefined regionsnd without detailed information on the stimulus paradigm. We apply BAM visualization to two fMRI studies demonstrating the additionalpatiotemporal information available compared to standard fMRI result presentation. Here we show that BAMs allow for unbiased data visualizationroviding dynamic activation maps without assumptions on the neural activity except reproducibility across trials. It may thus be useful in
roceeding from static to dynamic brain mapping, widening the range of fMRI in neuroscience. In addition, BAMs might be helpful toolsn visualizing the temporal evolution of activation in “real-time” for better and intuitive understanding of temporal processes in the humanrain. 2007 Elsevier B.V. All rights reserved.dc
iio
eywords: fMRI; Topology; Motor; Cognition; Mental rotation
. Introduction
In fMRI analyses performed with validated software pack-ges (e.g. SPM, FSL, fmristat, AFNI, BrainVoyager) temporalarameters of the haemodynamic response are most oftenccounted for during model estimation by using carefully
esigned temporal basis functions. The overwhelming num-er of published studies does not, however, explicitly target theemporal dimension of fMRI, restricting analysis results to non-∗ Corresponding author at: MR Center of Excellence, Medical University ofienna, Lazarettgasse 14, A-1090 Vienna, Austria. Tel.: +43 1 40400 3773;
ax: +43 1 40400 7631.E-mail address: [email protected] (E. Moser).
spv2ia
p
165-0270/$ – see front matter © 2007 Elsevier B.V. All rights reserved.oi:10.1016/j.jneumeth.2007.11.033
ynamic brain activation maps during different experimentalonditions.
On the other hand, studies assessing fMRI activation dynam-cs typically extract time courses from predefined regions ofnterest and assess temporal parameters, such as activationnsets and durations, from those time courses. In particular,tudies on mental chronometry have used temporal fMRI signalarameters to examine interregional activation characteristicsia time-resolved fMRI (Menon et al., 1998; Richter et al.,000; Weilke et al., 2001). These studies were, however, lim-
ted to predefined brain regions, from which activation onsetsnd durations were calculated.A different approach to display activation dynamics is toerform repeated correlation of fMRI signal changes with
euros
taesmrndc1
tif1uttpsdreC2d
tftrDWgcaiifFsrwmiavtrifB
eici
atsatar
2
eFmeeauscaita
2
2pept
(amVtawrp“pmmtedlow
C. Windischberger et al. / Journal of N
ime-shifted versions of either boxcar functions (Wildgruber etl., 1997) or the expected haemodynamic response (Cunningtont al., 2003; Hulsmann et al., 2003). Although such an analy-is approach can reach a temporal sensitivity of a few hundredilliseconds (Hernandez et al., 2002), it relies on predefined
esponse functions which are most often based on a presumedeural activity pattern convolved with an expected haemo-ynamic response function to account for the physiologicaloupling of neural activity and vascular changes (Friston et al.,995).
Friston et al. suggested the use of temporal derivatives ofhe expected haemodynamic response as additional regressorsn the general linear model (GLM) as an elegant way to allowor differential latencies among brain areas (Friston et al.,998). Differences in these temporal derivatives can then besed to make statistical inferences about the timing of activa-ion between conditions (Cunnington et al., 2002). Althoughhis method enables a straightforward assessment of temporalarameters, it requires very strong assumptions on the expectedignal changes and will obviously fail if the actual brain activityiffers from what is anticipated. Even more, the haemodynamicesponse function (HRF) itself has been shown to vary consid-rably between subjects and brain regions (Aguirre et al., 1998;unnington et al., 2003; Duann et al., 2002; Handwerker et al.,004; Lee et al., 1995) which might render temporal parameterserived from analysis with a canonical HRF erroneous.
With reduced requirements for detailed model specifica-ion, finite impulse response (FIR) approaches represent toolsor calculating unbiased and statistically efficient estimates ofhe underlying haemodynamic responses associated with event-elated fMRI experiments (Boynton et al., 1996; Burock andale, 2000; Dale and Buckner, 1997; Ollinger et al., 2001a;ildgruber et al., 2002). In FIR analysis signal changes are
enerally modeled by a set of orthogonal basis functions whichan fit and describe a wide range of possible time courses. Asresult, separate activation maps are obtainable for each time
nstance within a trial. FIR methodology is readily implementedn many fMRI analysis software packages and forms the basisor the concept presented in this paper. Previous applications ofIR analyses have used F-tests over all regressors to calculatetatic statistical maps (Burock and Dale, 2000). Such approacheseveal voxels which show significant signal differences over thehole experiment. Here we calculate separate statistical para-etric maps for each FIR regressor and concatenate these maps
nto a 4D matrix representing the temporal evolution of brainctivation in every voxel of the data set. Each map reflects acti-ation at a specific time instance after trial onset. Replayinghese activation maps at a frame rate similar to the acquisitionate yields an animated Brain Activation Movie (BAM) visual-zing the temporal evolution of brain activation in “real-time”or the whole data set without restriction to certain ROIs (seeAMs provided as Supplementary material).
We apply the BAM visualization approach in two fMRI
xperiments demonstrating the additional information and novelnsights gained. The first experiment examines the temporalharacteristics of brain activation on a single subject basis dur-ng externally cued finger movements, in particular investigatingt
ad
cience Methods 169 (2008) 222–230 223
ctivation in M1 and SMA. In the second experiment we extendhe BAM technique to second-level random effects group analy-is showing the temporal evolution of fronto-parietal activity incognitive paradigm where 12 subjects had to decide whether
heir mental representation of a geometric object was identical topresented stimuli, a task requiring visual imagery and mental
otation.
. Materials and methods
FIR analysis with BAM visualization can be implementedasily within the common GLM-based analysis packages (SPM,SL, fmristat, AFNI, BrainVoyager). It involves creating aodel with a series of non-overlapping box-car regressors at
ach TR interval around the time of each stimulus event. Instimating the model, these box-car regressors are fitted to thectual BOLD response occurring around the time of each stim-lus event. Maps of activation at each TR interval relative to thetimulus event can then be obtained by specifying a series of t-ontrasts individually for each box-car regressor. As such, therere no assumptions on the individual HRF or even the underly-ng neuronal activity other than reproducibility across repeatedrials, i.e. arbitrary time courses after trial onset can be modeledppropriately.
.1. fMRI study I: motor paradigm
A group of six subjects (three male, three female; mean age:4a) without a history of neurological or psychiatric disordersarticipated in this study. The study was approved by the localthics committee and all subjects gave written informed consentrior to participation. All subjects were right-handed accordingo the Edinburgh handedness inventory (Oldfield, 1971).
Measurements were performed on a 3 Tesla Medspec scannerBruker Biospin, Germany) using gradient-recalled EPI. Fourxial slices of 5 mm thickness (1 mm gap) were acquired with aatrix size of 64 × 64 voxels, a TE of 40 ms and a TR of 300 ms.oxel size was 2.96 × 2.96 mm. Slices were positioned to cover
he primary motor cortex (M1), the lateral premotor (PM) areasnd the supplementary motor area (SMA). The very short TRas chosen to ensure appropriate coverage of the haemodynamic
esponse. In each of the 12 trials the subjects listened via head-hones to a voice that counted down from “10” to “0” and back to5”. Subjects were asked to closely attend to the countdown anderform a brief finger movement as soon as they heard “0”. Theovement consisted of three brief button-presses with the index-iddle-index finger of the right hand. Subjects were instructed
o perform these movements as rapidly as possible. Followingach trial there was a pause of 18 s which allowed the haemo-ynamic response to return to baseline. Accordingly, each trialasted 33 s (110 time instances) and during the 12 trials a totalf 1320 part-brain images were acquired per subject. Also, T1-eighted images were acquired using a 3D-MDEFT sequence
o allow for definition of ROIs.Data sets were slice timing corrected within SPM. To ensure
ll four acquired slices are available for analysis, only two-imensional motion correction was performed using the FSL

2 Neur
ssirsds
ecrrAi3cdwoat
lMmaa
2
aestfiSss
t
2owittdrwwotibrmrsttto
ns2Spppmw3
aus
Frs
24 C. Windischberger et al. / Journal of
oftware package (http://www.fmrib.ox.ac.uk/fsl/). As the lasttep of preprocessing data were spatially smoothed with ansotropic Gaussian kernel of 6 mm FWHM with SPM. Due to theeduced cortical coverage common to all six subjects (only fourlices were acquired) fMRI data were not normalized to stan-ard stereotactic space and analysis was performed on a singleubject basis exclusively.
A set of 110 non-overlapping regressors was constructed cov-ring each TR interval (300 ms duration) from the onset of theountdown to the onset of the next countdown. The first box-caregressor had “1” on the first TR interval of each trial (0–300 mselative to countdown onset) and “0” for all other time points.ll other regressors were then generated by progressively shift-
ng the first regressor by one TR interval, thereby covering every00 ms time interval with sequential but non-overlapping box-ar regressors. This set of regressors was used to construct aesign matrix in SPM and contrast images for each regressorere calculated. Single subject activation maps were thresh-lded at a t-value of 4.5 (p < 0.05, FWE corrected) and overlaid ton unsaturated echo-planar image. These activation maps werehen concatenated to yield a single BAM per subject.
To allow group inferences, ROIs were defined for M1 contra-ateral to the side of movement execution and for the SMA.
ean time courses were calculated per subject and scaled to aaximum value of 1 before averaging across subjects to enabledirect comparison of the temporal activation features in M1
nd SMA.
.2. fMRI study II: mental rotation paradigm
For this experiment a group of 12 healthy male subjects (meange: 25a) was recruited. The study was approved by the localthics committee and all subjects gave written informed con-ent before participation. All subjects had normal or correctedo normal vision and were right-handed according to a modi-ed version of the Annett handedness inventory (Annett, 1985).timuli were presented via a video beamer that projected to a
creen positioned behind the subjects which was visible via amall mirror mounted on the head coil.Each trial consisted of three parts—encoding, mental rota-ion, and comparison periods (see Fig. 1). Trials began with a
ftss
ig. 1. Stimulation paradigm used in study II. After a geometrical object was preseotation position. Then the screen was blanked for 5 s and subjects were required to peubjects responded by button-press. (For interpretation of the references to colour in
oscience Methods 169 (2008) 222–230
s encoding period during which an abstract, two-dimensionalbject was presented in an arbitrary orientation and subjectsere required to memorize the object’s geometric features and
ts orientation. Following the 2 s encoding period, one edge ofhe object was indicated by a red bar for 1 s. The screen washen blanked and the object replaced by a fixation cross for 5 suration. During this period subjects were required to mentallyotate the encoded object so that it should stand on the edge thatas indicated by the red bar. After 5 s a test object was presentedhich was either an identical or horizontally mirrored versionf the original object. Subjects were then required to comparehe presented object with their mental image of the rotated orig-nal object and were given 2 s to respond by pressing one of twouttons with the right index finger on a panel mounted on theight thigh, indicating whether the test object was the same orirror-reversed compared with the original object. The subject’s
esponse caused the object to immediately disappear from thecreen. A rest period varying randomly between 8 and 12 s dura-ion followed each trial, allowing the haemodynamic responseo return to baseline before presentation of the next trial. Thirty-wo trials were presented per subject leading to a total run timef approximately 10 min.
This study was performed on a 3 Tesla Medspec scan-er (Bruker Biospin, Germany), using a gradient-recalled EPIequence with a matrix size of 64 × 64 voxels and a FOV of10 mm × 250 mm, leading to a voxel size of 3.3 mm × 3.9 mm.ix axial slices with a thickness of 4 mm (1 mm gap) wereositioned to cover PM, SMA and M1 areas and the superiorart of the parietal lobe. Slices were tilted to be approximatelyarallel to the line connecting the anterior and posterior com-issure. One thousand nine hundred and four image slabsere acquired at a TE of 30 ms with a repetition time TR of50 ms.
Reconstructed images were corrected for slice timing effectsnd motion artifacts, as well as transformed to standard spacesing SPM, where spatial smoothing with an isotropic Gaus-ian kernel of 9 mm FWHM was also performed. Regressors
or the FIR analysis were constructed for each subject usingiming information recorded during the functional runs. Thehortest trial had a length of 18 s, corresponding to 51 imagelabs acquired. Accordingly, the SPM design matrix was formednted for a 2 s encoding period one edge was highlighted indicating the finalrform the mental rotation. Finally, an object was presented for comparison and
this figure legend, the reader is referred to the web version of the article.)

euroscience Methods 169 (2008) 222–230 225
btteTvai
3
3
tdibaaicaScrFiTiTr
ifictaMMawdiaimraiids
sia
Fig. 2. BAM in a single subject performing a cued movement (study I) overlaidon a high-resolution echo planar image. Subsequent BAM frames show thedynamic spatio-temporal pattern of functional activation during preparation andexecution of movement. Note that every third frame is shown only, i.e. the timeperiod between frames is 900 ms. The complete movie encompassing all 110BAM frames is available as Supplementary material. Numbers indicate the timedelay from movement execution. BAM analysis shows an early signal increase inthe SMA (green arrows) which is followed by activation in M1 (yellow arrows).(r
aIoee
C. Windischberger et al. / Journal of N
y 51 regressors, each with only a single time instance perrial being a non-zero value. After parameter estimation con-rast images were calculated for each regressor and werentered to a random effects analysis over all 12 subjects.he resulting group activation maps were thresholded at a t-alue of 5.4 (p = 0.0001, uncorrected) and concatenated to formBAM of trial-related activity over the whole group stud-
ed.
. Results
.1. Study I: motor paradigm
For each of the six subjects studied a sequence of 110 activa-ion maps was calculated and combined to gain a BAM. Fig. 2isplays 9 out of 110 maps from a single subject. Because of lim-ted space every third frame is shown only, i.e. the time periodetween subsequent maps is 900 ms. The complete BAM givingcomprehensive, real-time representation of brain activation is
vailable as Supplementary material. Next to the activation mapsn Fig. 2 the corresponding time with respect to movement exe-ution is given. In the uppermost map (2.4 s after movement)ctivation in the SMA is clearly visible. In fact the onset of thisMA activity occurs concomitantly with the start of the auditoryountdown (shifted by the haemodynamic delay) and remainsather constant throughout the movement preparation period (cp.igs. 3 and 4). At 3.3 s after movement execution SMA activation
ncreases considerably with only sparse activation in M1. ThreeRs later, i.e. 4.2 s after movement, SMA activation approaches
ts peak value, while activity in M1 is just beginning to rise.he maximum M1 activation level for this particular subject is
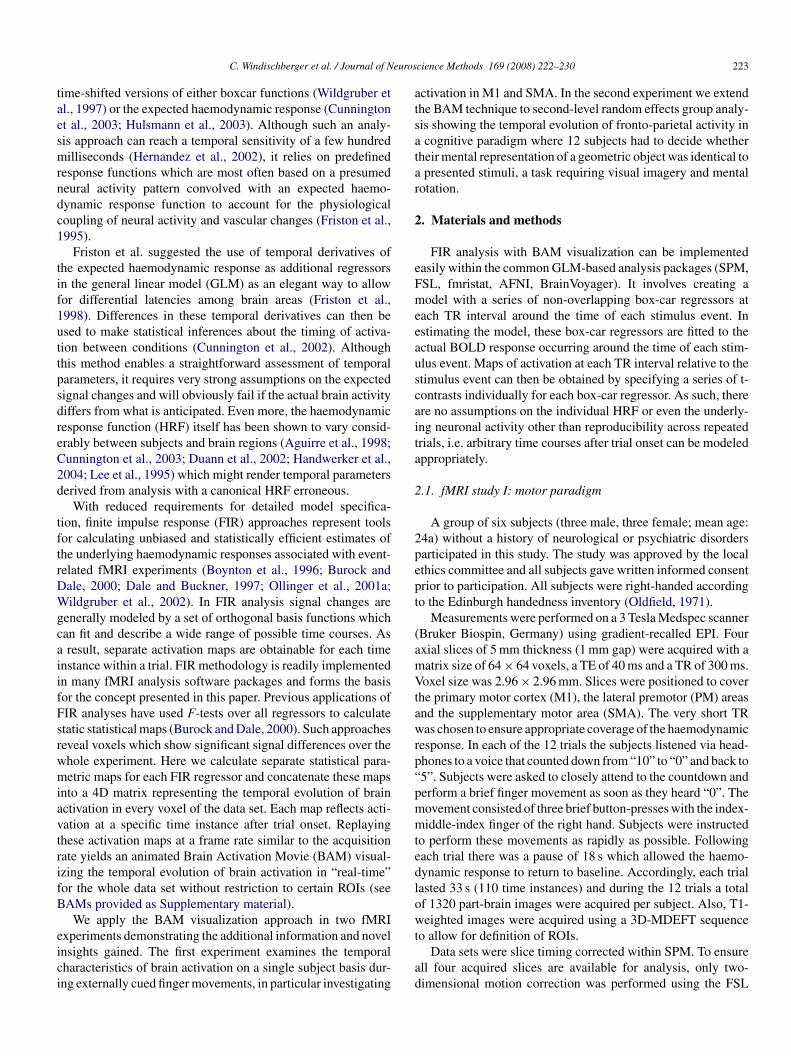
eached at 6.2 s after movement onset.In Fig. 3 we show BAM data from the same subject, present-
ng the evolution of brain activation (i.e. 4D data) in a singlegure. We have limited our display to a single slice (slice 3)ontaining both SMA and M1. Closer inspection of the activa-ion maps in Fig. 2 shows that projecting the BAM data alongnterior–posterior lines still allows discrimination of SMA and1 activation, as there is no spatial overlap in this direction.ean activation was therefore calculated along sagittal lines for
ll 110 BAM activation maps, resulting in the lower part of Fig. 3hich we denote as a BAM plane. The position in left–rightirection is shown on the horizontal axis, with chain-dotted linesndicating M1 and SMA areas. The temporal evolution of brainctivation can be observed in vertical direction, the numbers giv-ng the time with respect to movement execution. Green lines
ark the start of the auditory cue and the onset of movement,espectively. Similar to Fig. 2 it can be seen that significant SMActivation occurs early within a trial, about 10 s before reachingts maximum. This indicates preparatory activity in the SMAmmediately after countdown onset. Fig. 3 also shows a clearifferentiation of peak SMA and M1 activities (green arrows),uperior to the standard display as seen in Fig. 2.
As mentioned before, Figs. 2 and 3 show BAM results from aingle subject without spatial normalization. To still allow groupnferences, ROIs of SMA and M1 were defined in all six subjectsnd mean time courses were calculated. The results of this ROI
atAt
For interpretation of the references to colour in this figure legend, the reader iseferred to the web version of the article.)
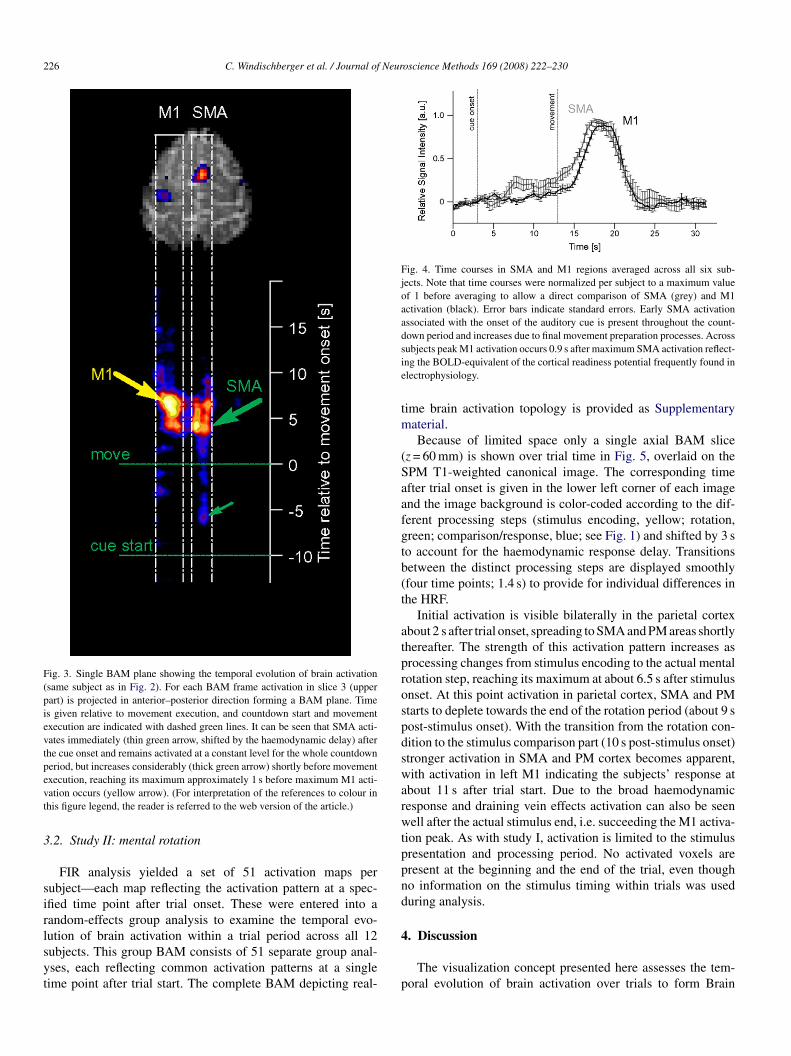
nalysis in terms of mean and standard error can be seen in Fig. 4.t is apparent that both ROI time courses exhibit a high degreef baseline stability, both before cue onset and after movementxecution. In concordance with the single subject results thearly onset of SMA activation (grey line) is consistently observ-ble across all subjects studied. As suggested in Figs. 2 and 3
he activation peak in the SMA clearly precedes M1 activation.veraged across the group the timing difference was calculatedo be 0.9 s.
226 C. Windischberger et al. / Journal of Neuroscience Methods 169 (2008) 222–230
Fig. 3. Single BAM plane showing the temporal evolution of brain activation(same subject as in Fig. 2). For each BAM frame activation in slice 3 (upperpart) is projected in anterior–posterior direction forming a BAM plane. Timeis given relative to movement execution, and countdown start and movementexecution are indicated with dashed green lines. It can be seen that SMA acti-vates immediately (thin green arrow, shifted by the haemodynamic delay) afterthe cue onset and remains activated at a constant level for the whole countdownperiod, but increases considerably (thick green arrow) shortly before movementevt
3
sirlsyt
Fig. 4. Time courses in SMA and M1 regions averaged across all six sub-jects. Note that time courses were normalized per subject to a maximum valueof 1 before averaging to allow a direct comparison of SMA (grey) and M1activation (black). Error bars indicate standard errors. Early SMA activationassociated with the onset of the auditory cue is present throughout the count-down period and increases due to final movement preparation processes. Acrosssie
tm
(Saafgtb(t
atprospdswarwtppnd
xecution, reaching its maximum approximately 1 s before maximum M1 acti-ation occurs (yellow arrow). (For interpretation of the references to colour inhis figure legend, the reader is referred to the web version of the article.)
.2. Study II: mental rotation
FIR analysis yielded a set of 51 activation maps perubject—each map reflecting the activation pattern at a spec-fied time point after trial onset. These were entered into aandom-effects group analysis to examine the temporal evo-
ution of brain activation within a trial period across all 12ubjects. This group BAM consists of 51 separate group anal-ses, each reflecting common activation patterns at a singleime point after trial start. The complete BAM depicting real-4
p
ubjects peak M1 activation occurs 0.9 s after maximum SMA activation reflect-ng the BOLD-equivalent of the cortical readiness potential frequently found inlectrophysiology.
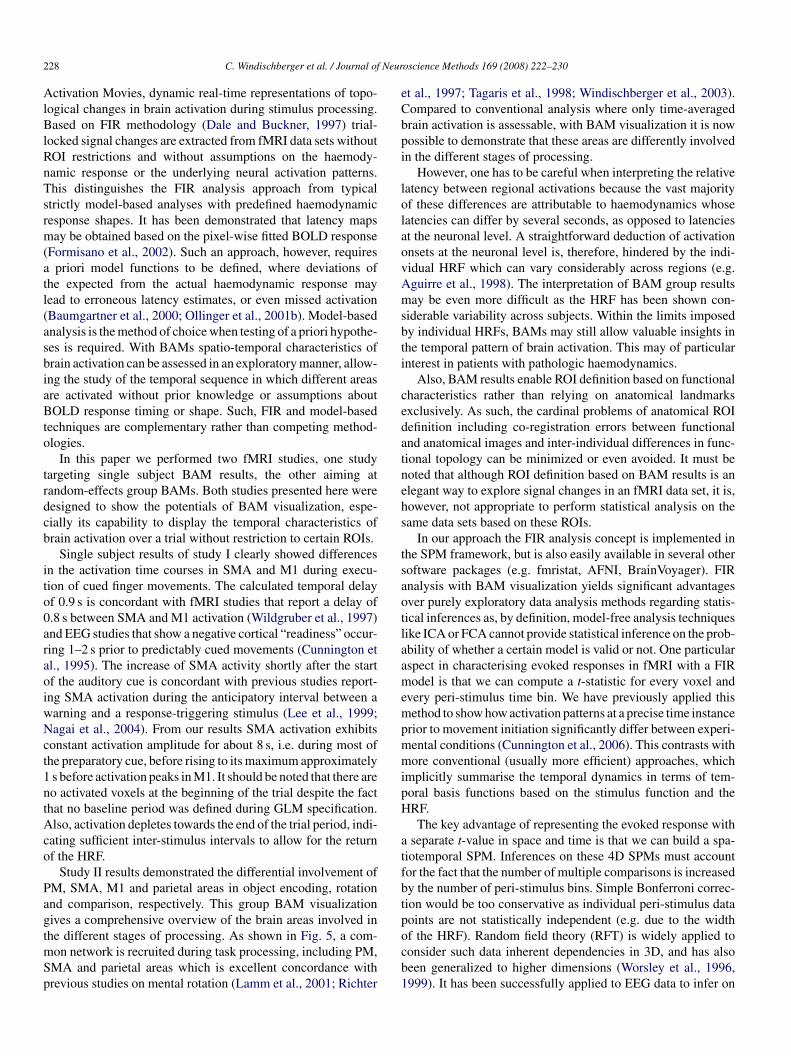
ime brain activation topology is provided as Supplementaryaterial.Because of limited space only a single axial BAM slice
z = 60 mm) is shown over trial time in Fig. 5, overlaid on thePM T1-weighted canonical image. The corresponding timefter trial onset is given in the lower left corner of each imagend the image background is color-coded according to the dif-erent processing steps (stimulus encoding, yellow; rotation,reen; comparison/response, blue; see Fig. 1) and shifted by 3 so account for the haemodynamic response delay. Transitionsetween the distinct processing steps are displayed smoothlyfour time points; 1.4 s) to provide for individual differences inhe HRF.
Initial activation is visible bilaterally in the parietal cortexbout 2 s after trial onset, spreading to SMA and PM areas shortlyhereafter. The strength of this activation pattern increases asrocessing changes from stimulus encoding to the actual mentalotation step, reaching its maximum at about 6.5 s after stimulusnset. At this point activation in parietal cortex, SMA and PMtarts to deplete towards the end of the rotation period (about 9 sost-stimulus onset). With the transition from the rotation con-ition to the stimulus comparison part (10 s post-stimulus onset)tronger activation in SMA and PM cortex becomes apparent,ith activation in left M1 indicating the subjects’ response at
bout 11 s after trial start. Due to the broad haemodynamicesponse and draining vein effects activation can also be seenell after the actual stimulus end, i.e. succeeding the M1 activa-
ion peak. As with study I, activation is limited to the stimulusresentation and processing period. No activated voxels areresent at the beginning and the end of the trial, even thougho information on the stimulus timing within trials was useduring analysis.
. Discussion
The visualization concept presented here assesses the tem-oral evolution of brain activation over trials to form Brain

C. Windischberger et al. / Journal of Neuroscience Methods 169 (2008) 222–230 227
Fig. 5. BAM group analysis results in a single plane. Colors of the image background (extracerebral) correspond to the three different processing steps as described inFig. 1, shifted by 3 s to account for the haemodynamic delay. Initial stimulus encoding activates a network of cortical areas including the SMA and lateral PM regionswhich modulates in strength and size during the mental rotation period. In the comparison period strong activation is visible in the left PM area which decreases asSMA and M1 activation increases in the advent of responding. The complete BAM is available as Supplemental material. (For interpretation of the references tocolour in this figure legend, the reader is referred to the web version of the article.)
2 Neur
AlBlRnTsrm(atl(asbiaBto
trdcb
ito0araoiwNct1ntAco
PagtmSp
eCbpi
lolaovAmsbti
cedatnehs
tsaotlaamempmmipH
atfbtp
28 C. Windischberger et al. / Journal of
ctivation Movies, dynamic real-time representations of topo-ogical changes in brain activation during stimulus processing.ased on FIR methodology (Dale and Buckner, 1997) trial-
ocked signal changes are extracted from fMRI data sets withoutOI restrictions and without assumptions on the haemody-amic response or the underlying neural activation patterns.his distinguishes the FIR analysis approach from typicaltrictly model-based analyses with predefined haemodynamicesponse shapes. It has been demonstrated that latency mapsay be obtained based on the pixel-wise fitted BOLD response
Formisano et al., 2002). Such an approach, however, requirespriori model functions to be defined, where deviations of
he expected from the actual haemodynamic response mayead to erroneous latency estimates, or even missed activationBaumgartner et al., 2000; Ollinger et al., 2001b). Model-basednalysis is the method of choice when testing of a priori hypothe-es is required. With BAMs spatio-temporal characteristics ofrain activation can be assessed in an exploratory manner, allow-ng the study of the temporal sequence in which different areasre activated without prior knowledge or assumptions aboutOLD response timing or shape. Such, FIR and model-based
echniques are complementary rather than competing method-logies.
In this paper we performed two fMRI studies, one studyargeting single subject BAM results, the other aiming atandom-effects group BAMs. Both studies presented here wereesigned to show the potentials of BAM visualization, espe-ially its capability to display the temporal characteristics ofrain activation over a trial without restriction to certain ROIs.
Single subject results of study I clearly showed differencesn the activation time courses in SMA and M1 during execu-ion of cued finger movements. The calculated temporal delayf 0.9 s is concordant with fMRI studies that report a delay of.8 s between SMA and M1 activation (Wildgruber et al., 1997)nd EEG studies that show a negative cortical “readiness” occur-ing 1–2 s prior to predictably cued movements (Cunnington etl., 1995). The increase of SMA activity shortly after the startf the auditory cue is concordant with previous studies report-ng SMA activation during the anticipatory interval between aarning and a response-triggering stimulus (Lee et al., 1999;agai et al., 2004). From our results SMA activation exhibits
onstant activation amplitude for about 8 s, i.e. during most ofhe preparatory cue, before rising to its maximum approximatelys before activation peaks in M1. It should be noted that there areo activated voxels at the beginning of the trial despite the facthat no baseline period was defined during GLM specification.lso, activation depletes towards the end of the trial period, indi-
ating sufficient inter-stimulus intervals to allow for the returnf the HRF.
Study II results demonstrated the differential involvement ofM, SMA, M1 and parietal areas in object encoding, rotationnd comparison, respectively. This group BAM visualizationives a comprehensive overview of the brain areas involved in
he different stages of processing. As shown in Fig. 5, a com-on network is recruited during task processing, including PM,MA and parietal areas which is excellent concordance withrevious studies on mental rotation (Lamm et al., 2001; Richter
ocb1
oscience Methods 169 (2008) 222–230
t al., 1997; Tagaris et al., 1998; Windischberger et al., 2003).ompared to conventional analysis where only time-averagedrain activation is assessable, with BAM visualization it is nowossible to demonstrate that these areas are differently involvedn the different stages of processing.
However, one has to be careful when interpreting the relativeatency between regional activations because the vast majorityf these differences are attributable to haemodynamics whoseatencies can differ by several seconds, as opposed to latenciest the neuronal level. A straightforward deduction of activationnsets at the neuronal level is, therefore, hindered by the indi-idual HRF which can vary considerably across regions (e.g.guirre et al., 1998). The interpretation of BAM group resultsay be even more difficult as the HRF has been shown con-
iderable variability across subjects. Within the limits imposedy individual HRFs, BAMs may still allow valuable insights inhe temporal pattern of brain activation. This may of particularnterest in patients with pathologic haemodynamics.
Also, BAM results enable ROI definition based on functionalharacteristics rather than relying on anatomical landmarksxclusively. As such, the cardinal problems of anatomical ROIefinition including co-registration errors between functionalnd anatomical images and inter-individual differences in func-ional topology can be minimized or even avoided. It must beoted that although ROI definition based on BAM results is anlegant way to explore signal changes in an fMRI data set, it is,owever, not appropriate to perform statistical analysis on theame data sets based on these ROIs.
In our approach the FIR analysis concept is implemented inhe SPM framework, but is also easily available in several otheroftware packages (e.g. fmristat, AFNI, BrainVoyager). FIRnalysis with BAM visualization yields significant advantagesver purely exploratory data analysis methods regarding statis-ical inferences as, by definition, model-free analysis techniquesike ICA or FCA cannot provide statistical inference on the prob-bility of whether a certain model is valid or not. One particularspect in characterising evoked responses in fMRI with a FIRodel is that we can compute a t-statistic for every voxel and
very peri-stimulus time bin. We have previously applied thisethod to show how activation patterns at a precise time instance
rior to movement initiation significantly differ between experi-ental conditions (Cunnington et al., 2006). This contrasts withore conventional (usually more efficient) approaches, which
mplicitly summarise the temporal dynamics in terms of tem-oral basis functions based on the stimulus function and theRF.The key advantage of representing the evoked response with
separate t-value in space and time is that we can build a spa-iotemporal SPM. Inferences on these 4D SPMs must accountor the fact that the number of multiple comparisons is increasedy the number of peri-stimulus bins. Simple Bonferroni correc-ion would be too conservative as individual peri-stimulus dataoints are not statistically independent (e.g. due to the width
f the HRF). Random field theory (RFT) is widely applied toonsider such data inherent dependencies in 3D, and has alsoeen generalized to higher dimensions (Worsley et al., 1996,999). It has been successfully applied to EEG data to infer on
euros
t2vre
asplailitwpanvfmmioim
A
FP
A
i
R
A
A
B
B
B
B
C
C
C
C
D
D
F
F
F
F
H
H
H
K
K
K
L
L
L
M
N
O
O
O
R
R
T
C. Windischberger et al. / Journal of N
ime-frequency SPMs (Kiebel and Friston, 2004a,b; Kilner et al.,005). RFT would therefore be the method of choice for pro-iding adjusted p-values for spatiotemporal inference in BAMesults, assessing both where and when peak responses werelicited.
In conclusion, BAM visualization based on FIR analysis isform of exploratory analysis and yields a large number of
tatistical parametric maps enabling the examination of the tem-oral evolution of brain activation. Although FIR analysis is notimited to fMRI studies with high temporal resolution, BAMsre most useful with short-TR data sets as dynamic changesn activation can be explored with finer time resolution. Withong TR, BAM methodology would be most suited for explor-ng slow changes in brain activation patterns for long durationasks. It is a powerful method for visualizing dynamic changes inhole-brain activation patterns over trials or tasks. BAM resultsotentially provide much more information on the actual neuralctivity patterns than standard analysis techniques as detection isot limited to where activation is located but also when this acti-ation occurs. Moreover, they might serve as a basis for definingunctional areas for connectivity analyses like dynamic causalodeling (DCM, Friston et al., 2003) or structural equationodeling (SEM, Buchel and Friston, 1997). Therefore, visual-
zation topology dynamics using BAMs might further improveur understanding of the brain’s processing strategies by rais-ng new hypotheses that can then be tested for with specific
odel-driven analysis methods.
cknowledgements
This study was financially supported by the Austrian Scienceund (FWF P-16669-B02), the Austrian National Bank (OeNB10943) and the HSJS (1472/2002).
ppendix A. Supplementary data
Supplementary data associated with this article can be found,n the online version, at doi:10.1016/j.jneumeth.2007.11.033.
eferences
guirre GK, Zarahn E, D’Esposito M. The variability of human, BOLD hemo-dynamic responses. Neuroimage 1998;8:360–9.
nnett M. Left, right, hand, and brain: the right shift theory. London: Erlbaum;1985.
aumgartner R, Somorjai R, Summers R, Richter W, Ryner L. Correlatorbeware: correlation has limited selectivity for fMRI data analysis. Neuroim-age 2000;12:240–3.
oynton GM, Engel SA, Glover GH, Heeger DJ. Linear systems analy-sis of functional magnetic resonance imaging in human V1. J Neurosci1996;16:4207–21.
uchel C, Friston KJ. Modulation of connectivity in visual pathways by atten-tion: cortical interactions evaluated with structural equation modelling andfMRI. Cereb Cortex 1997;7:768–78.
urock MA, Dale AM. Estimation and detection of event-related fMRI sig-
nals with temporally correlated noise: a statistically efficient and unbiasedapproach. Hum Brain Mapp 2000;11:249–60.unnington R, Iansek R, Bradshaw JL, Phillips JG. Movement-related potentialsin Parkinson’s disease. Presence and predictability of temporal and spatialcues. Brain 1995;118(Pt 4):935–50.
W
cience Methods 169 (2008) 222–230 229
unnington R, Windischberger C, Deecke L, Moser E. The preparation andexecution of self-initiated and externally-triggered movement: a study ofevent-related fMRI. Neuroimage 2002;15:373–85.
unnington R, Windischberger C, Deecke L, Moser E. The preparation andreadiness for voluntary movement: a high-field event-related fMRI study ofthe Bereitschafts-BOLD response. Neuroimage 2003;20:404–12.
unnington R, Windischberger C, Robinson S, Moser E. The selection ofintended actions and the observation of others’ actions: a time-resolved fMRIstudy. Neuroimage 2006;29:1294–302.
ale AM, Buckner RL. Selective averaging of rapidly presented individual trialsusing fMRI. Hum Brain Mapp 1997;5:329–40.
uann JR, Jung TP, Kuo WJ, Yeh TC, Makeig S, Hsieh JC, et al. Single-trialvariability in event-related BOLD signals. Neuroimage 2002;15:823–35.
ormisano E, Linden DE, Di Salle F, Trojano L, Esposito F, Sack AT, et al. Track-ing the mind’s image in the brain I: time-resolved fMRI during visuospatialmental imagery. Neuron 2002;35:185–94.
riston KJ, Fletcher P, Josephs O, Holmes A, Rugg MD, Turner R. Event-relatedfMRI: characterizing differential responses. Neuroimage 1998;7:30–40.
riston KJ, Harrison L, Penny W. Dynamic causal modelling. Neuroimage2003;19:1273–302.
riston KJ, Holmes AP, Poline JB, Grasby PJ, Williams SC, Frackowiak RS, etal. Analysis of fMRI time-series revisited. Neuroimage 1995;2:45–53.
andwerker DA, Ollinger JM, D’Esposito M. Variation of BOLD hemodynamicresponses across subjects and brain regions and their effects on statisticalanalyses. Neuroimage 2004;21:1639–51.
ernandez L, Badre D, Noll D, Jonides J. Temporal sensitivity of event-relatedfMRI. Neuroimage 2002;17:1018–26.
ulsmann E, Erb M, Grodd W. From will to action: sequential cerebellar con-tributions to voluntary movement. Neuroimage 2003;20:1485–92.
iebel SJ, Friston KJ. Statistical parametric mapping for event-related potentials(II): a hierarchical temporal model. Neuroimage 2004a;22:503–20.
iebel SJ, Friston KJ. Statistical parametric mapping for event-related poten-tials. I. Generic considerations. Neuroimage 2004b;22:492–502.
ilner JM, Kiebel SJ, Friston KJ. Applications of random field theory to elec-trophysiology. Neurosci Lett 2005;374:174–8.
amm C, Windischberger C, Leodolter U, Moser E, Bauer H. Evidence forpremotor cortex activity during dynamic visuospatial imagery from single-trial functional magnetic resonance imaging and event-related slow corticalpotentials. Neuroimage 2001;14:268–83.
ee AT, Glover GH, Meyer CH. Discrimination of large venous vessels in time-course spiral blood-oxygen-level-dependent magnetic-resonance functionalneuroimaging. Magn Reson Med 1995;33:745–54.
ee KM, Chang KH, Roh JK. Subregions within the supplementary motorarea activated at different stages of movement preparation and execution.Neuroimage 1999;9:117–23.
enon RS, Luknowsky DC, Gati JS. Mental chronometry using latency-resolvedfunctional MRI. Proc Natl Acad Sci USA 1998;95:10902–7.
agai Y, Critchley HD, Featherstone E, Fenwick PB, Trimble MR, Dolan RJ.Brain activity relating to the contingent negative variation: an fMRI investi-gation. Neuroimage 2004;21:1232–41.
ldfield RC. The assessment and analysis of handedness: the Edinburgh inven-tory. Neuropsychologia 1971;9:97–113.
llinger JM, Corbetta M, Shulman GL. Separating processes within a trial inevent-related functional MRI. Neuroimage 2001a;13:218–29.
llinger JM, Shulman GL, Corbetta M. Separating processes within a trial inevent-related functional MRI. Neuroimage 2001b;13:210–7.
ichter W, Somorjai R, Summers R, Jarmasz M, Menon RS, Gati JS, et al. Motorarea activity during mental rotation studied by time-resolved single-trialfMRI. J Cogn Neurosci 2000;12:310–20.
ichter W, Ugurbil K, Georgopoulos A, Kim SG. Time-resolved fMRI of mentalrotation. Neuroreport 1997;8:3697–702.
agaris GA, Richter W, Kim SG, Pellizzer G, Andersen P, Ugurbil K, et al. Func-tional magnetic resonance imaging of mental rotation and memory scanning:
a multidimensional scaling analysis of brain activation patterns. Brain ResBrain Res Rev 1998;26:106–12.eilke F, Spiegel S, Boecker H, von Einsiedel HG, Conrad B, Schwaiger M,et al. Time-resolved fMRI of activation patterns in M1 and SMA duringcomplex voluntary movement. J Neurophysiol 2001;85:1858–63.

2 Neur
W
W
W
30 C. Windischberger et al. / Journal of
ildgruber D, Erb M, Klose U, Grodd W. Sequential activation of supple-mentary motor area and primary motor cortex during self-paced finger
movement in human evaluated by functional MRI. Neurosci Lett 1997;227:161–4.ildgruber D, Pihan H, Ackermann H, Erb M, Grodd W. Dynamic brain acti-vation during processing of emotional intonation: influence of acousticparameters, emotional valence, and sex. Neuroimage 2002;15:856–69.
W
W
oscience Methods 169 (2008) 222–230
indischberger C, Lamm C, Bauer H, Moser E. Human motor cortex activityduring mental rotation. Neuroimage 2003;20:225–32.
orsley K, Marrett S, Neelin P, Vandal AC, Friston KJ, Evans AC. A unifiedstatistical approach for determining significant signals in images of cerebralactivation. Hum Brain Mapp 1996;4:58–73.
orsley KJ, Andermann M, Koulis T, MacDonald D, Evans AC. Detectingchanges in nonisotropic images. Hum Brain Mapp 1999;8:98–101.