thu. 3 june 20041 an empirical study of the “healthy immigrant effect” with canadian community...
TRANSCRIPT
Thu. 3 June 2004Thu. 3 June 2004 11
An empirical study of theAn empirical study of the“healthy immigrant effect” with “healthy immigrant effect” with
Canadian Community Health Canadian Community Health SurveySurvey
Yimin (Gloria) Lou, M.A. CandidateYimin (Gloria) Lou, M.A. CandidateUniversity of Western OntarioUniversity of Western Ontario
• Presentation at Canadian Population Society 2004 Presentation at Canadian Population Society 2004 Annual Meetings, University of Manitoba, Winnipeg. Annual Meetings, University of Manitoba, Winnipeg.
• Session 1, Determinants of Health: Socio-Economic Session 1, Determinants of Health: Socio-Economic Status, Immigration and Other FactorsStatus, Immigration and Other Factors
Thu. 3 June 2004Thu. 3 June 2004 22
IntroductionIntroduction
• Observed phenomenon: the “healthy Observed phenomenon: the “healthy immigrant effect” in Canada, US and immigrant effect” in Canada, US and Australia Australia
• Brief features: Brief features: •the health of immigrants is better than that the health of immigrants is better than that
of the host populationof the host population•recent arrivals are more healthy than long-recent arrivals are more healthy than long-
term arrivalsterm arrivals•the health of immigrants is getting worse the health of immigrants is getting worse
over timeover time

Thu. 3 June 2004Thu. 3 June 2004 33
Previous ResearchPrevious Research
• the “healthy immigrant effect” has the “healthy immigrant effect” has been examined in terms of: been examined in terms of:
– Physical health: Physical health: Chen, Ng, and Wilkins 1996 (1994/95 NPHS)Chen, Ng, and Wilkins 1996 (1994/95 NPHS) Pérez 2002 (2000/01 CCHS)Pérez 2002 (2000/01 CCHS)
– Mental health: Mental health: Ali 2002 (2000/01 CCHS)Ali 2002 (2000/01 CCHS)

Thu. 3 June 2004Thu. 3 June 2004 44
Why “Healthy Immigrant Effect”?Why “Healthy Immigrant Effect”?
• Selectivity?Selectivity?
• Demographic and SES factors? Demographic and SES factors?
• Proficiency in official language?Proficiency in official language?
• Employment status?Employment status?
• Sense of belonging?Sense of belonging?
• Health behaviours? Health behaviours?

Thu. 3 June 2004Thu. 3 June 2004 55
Objectives of the StudyObjectives of the Study
• To verify the existence of the “healthy immigrant effect” To verify the existence of the “healthy immigrant effect” with a general health index: self-perceived health.with a general health index: self-perceived health.
• To explore the explanatory power of lifestyle to the To explore the explanatory power of lifestyle to the “healthy immigrant effect”. “healthy immigrant effect”.
Operationalization of lifestyleOperationalization of lifestyle
obesityobesity
drinking habitsdrinking habits
exerciseexercise
smoking habitssmoking habits
dietdiet
Thu. 3 June 2004Thu. 3 June 2004 66
MethodologyMethodology
• Data: cycle 1.1 of 2000/01 CCHSData: cycle 1.1 of 2000/01 CCHS
• The sample size is about 130,000. The The sample size is about 130,000. The Canadian-born population accounts for Canadian-born population accounts for 86.4%, new immigrants 2.8%, old immigrants 86.4%, new immigrants 2.8%, old immigrants 10.1%.10.1%.
• Techniques: Techniques: – Prevalence of self-perceived poor health by Prevalence of self-perceived poor health by
immigration status, sex or age is chartedimmigration status, sex or age is charted– Two logistic regression models are fitted (baseline Two logistic regression models are fitted (baseline
model and lifestyle model)model and lifestyle model)– All analyses are weightedAll analyses are weighted
Thu. 3 June 2004Thu. 3 June 2004 77
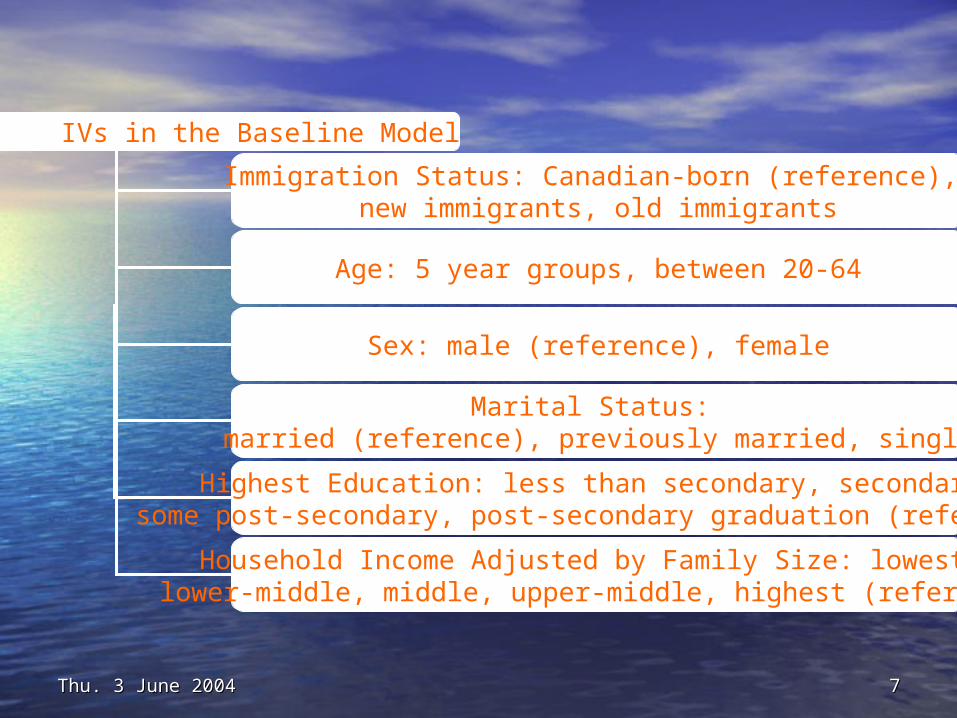
IVs in the Baseline Model
Immigration Status: Canadian-born (reference), new immigrants, old immigrants
Age: 5 year groups, between 20-64
Sex: male (reference), female
Highest Education: less than secondary, secondary,some post-secondary, post-secondary graduation (reference)
Marital Status: married (reference), previously married, single
Household Income Adjusted by Family Size: lowest, lower-middle, middle, upper-middle, highest (reference)
Thu. 3 June 2004Thu. 3 June 2004 88
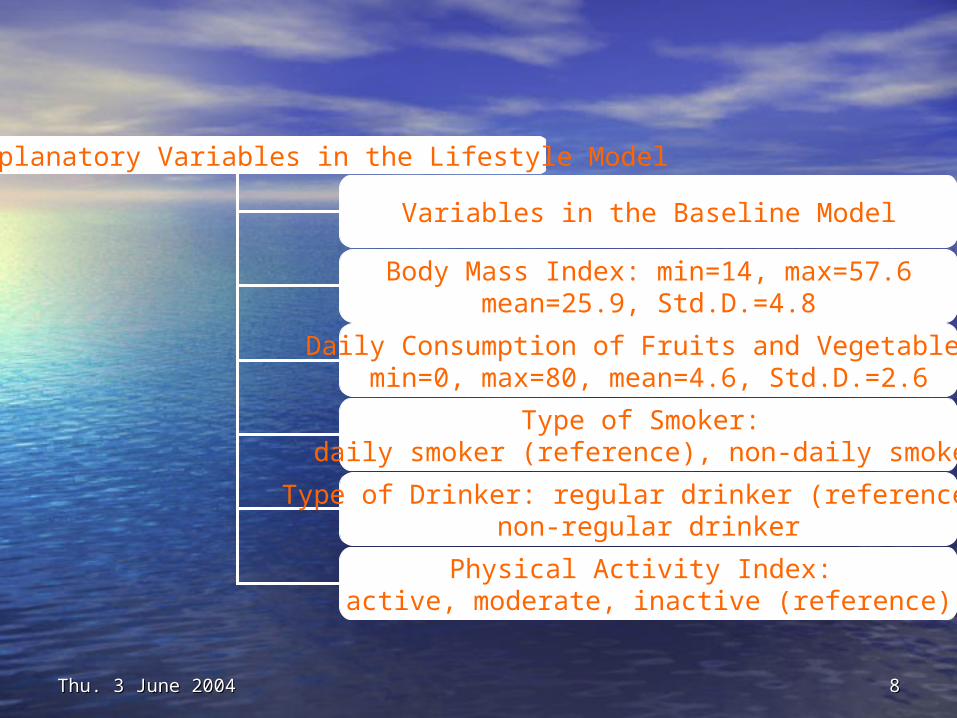
Explanatory Variables in the Lifestyle Model
Type of Drinker: regular drinker (reference), non-regular drinker
Physical Activity Index: active, moderate, inactive (reference)
Type of Smoker: daily smoker (reference), non-daily smoker
Daily Consumption of Fruits and Vegetables:min=0, max=80, mean=4.6, Std.D.=2.6
Body Mass Index: min=14, max=57.6mean=25.9, Std.D.=4.8
Variables in the Baseline Model

Thu. 3 June 2004Thu. 3 June 2004 99
RESULTSRESULTS
Thu. 3 June 2004Thu. 3 June 2004 1010
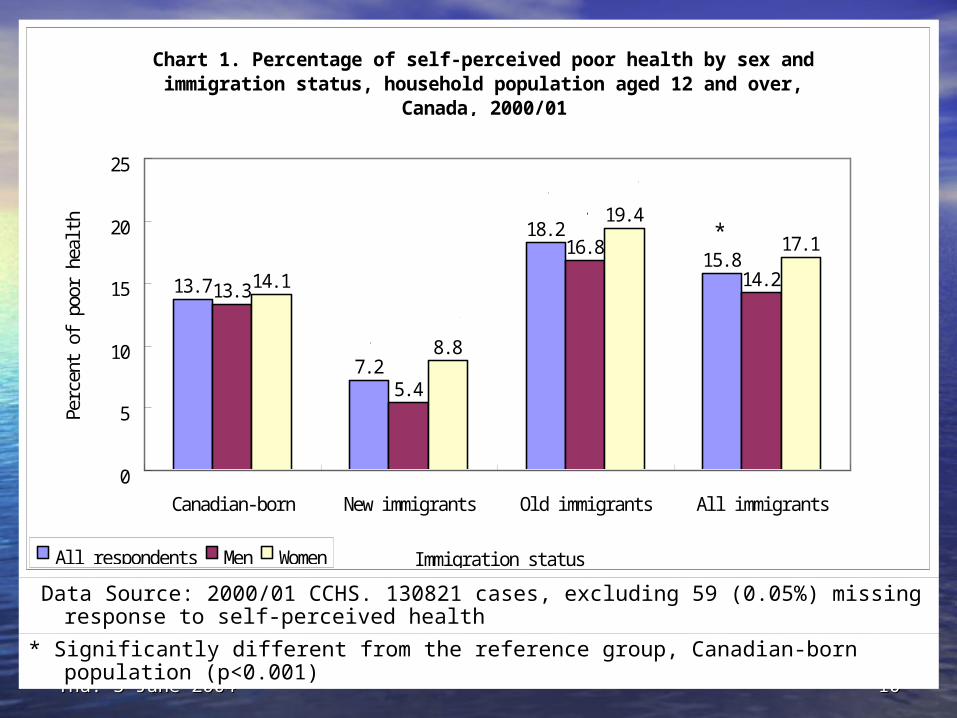
Data Source: 2000/01 CCHS. 130821 cases, excluding 59 (0.05%) missing response to self-perceived health
* Significantly different from the reference group, Canadian-born population (p<0.001)
Chart 1. Percentage of sel f -percei ved poor heal th by sex andi mmi grati on status, househol d popul ati on aged 12 and over,
Canada, 2000/ 01
13. 7
7. 2
18. 2
15. 8
13. 3
5. 4
16. 8
14. 214. 1
8. 8
19. 4
17. 1
0
5
10
15
20
25
Canadi an-born New i mmi grants Ol d i mmi grants Al l i mmi grants
I mmi grati on status
Perc
ent
of p
oor
heal
th
Al l respondents Men Women
**
*
*
**
*
*
Thu. 3 June 2004Thu. 3 June 2004 1111
• Immigrants as a whole were less healthy Immigrants as a whole were less healthy than the Canadian-born population, for all than the Canadian-born population, for all respondents and for women. respondents and for women.
• New immigrants were healthier, while old New immigrants were healthier, while old immigrants were less healthy, than their immigrants were less healthy, than their Canadian-born counterparts, for all Canadian-born counterparts, for all respondents and for both sexes respondents and for both sexes respectively. respectively.
• Lower prevalence of poor self-perceived Lower prevalence of poor self-perceived health of men compared to women was true health of men compared to women was true for the Canadian-born population as well as for the Canadian-born population as well as for immigrants, no matter length of for immigrants, no matter length of residence in Canada.residence in Canada.

Thu. 3 June 2004Thu. 3 June 2004 1212
Data Source: 2000/01 CCHS. 130821 cases, excluding 59 (0.05%) missing response to self-perceived health
* Significantly different from the reference group, Canadian-born population (p<0.001)
Chart 1. Percentage of sel f -percei ved poor heal th by sex andi mmi grati on status, househol d popul ati on aged 12 and over,
Canada, 2000/ 01
13. 7
7. 2
18. 2
15. 8
13. 3
5. 4
16. 8
14. 214. 1
8. 8
19. 4
17. 1
0
5
10
15
20
25
Canadi an-born New i mmi grants Ol d i mmi grants Al l i mmi grants
I mmi grati on status
Perc
ent
of p
oor
heal
th
Al l respondents Men Women
**
*
*
**
*
*

Thu. 3 June 2004Thu. 3 June 2004 1313
• Immigrants as a whole were less healthy Immigrants as a whole were less healthy than the Canadian-born population, for all than the Canadian-born population, for all respondents and for women. respondents and for women.
• New immigrants were healthier, while old New immigrants were healthier, while old immigrants were less healthy, than their immigrants were less healthy, than their Canadian-born counterparts, for all Canadian-born counterparts, for all respondents and for both sexes respondents and for both sexes respectively. respectively.
• Lower prevalence of poor self-perceived Lower prevalence of poor self-perceived health of men compared to women was true health of men compared to women was true for the Canadian-born population as well as for the Canadian-born population as well as for immigrants, no matter length of for immigrants, no matter length of residence in Canada.residence in Canada.

Thu. 3 June 2004Thu. 3 June 2004 1414
Data Source: 2000/01 CCHS. 130821 cases, excluding 59 (0.05%) missing response to self-perceived health
* Significantly different from the reference group, Canadian-born population (p<0.001)
Chart 1. Percentage of sel f -percei ved poor heal th by sex andi mmi grati on status, househol d popul ati on aged 12 and over,
Canada, 2000/ 01
13. 7
7. 2
18. 2
15. 8
13. 3
5. 4
16. 8
14. 214. 1
8. 8
19. 4
17. 1
0
5
10
15
20
25
Canadi an-born New i mmi grants Ol d i mmi grants Al l i mmi grants
I mmi grati on status
Perc
ent
of p
oor
heal
th
Al l respondents Men Women
**
*
*
**
*
*

Thu. 3 June 2004Thu. 3 June 2004 1515
• Immigrants as a whole were less healthy Immigrants as a whole were less healthy than the Canadian-born population, for all than the Canadian-born population, for all respondents and for women. respondents and for women.
• New immigrants were healthier, while old New immigrants were healthier, while old immigrants were less healthy, than their immigrants were less healthy, than their Canadian-born counterparts, for all Canadian-born counterparts, for all respondents and for both sexes respondents and for both sexes respectively. respectively.
• Lower prevalence of poor self-perceived Lower prevalence of poor self-perceived health of men compared to women was true health of men compared to women was true for the Canadian-born population as well as for the Canadian-born population as well as for immigrants, no matter length of for immigrants, no matter length of residence in Canada.residence in Canada.
Thu. 3 June 2004Thu. 3 June 2004 1616
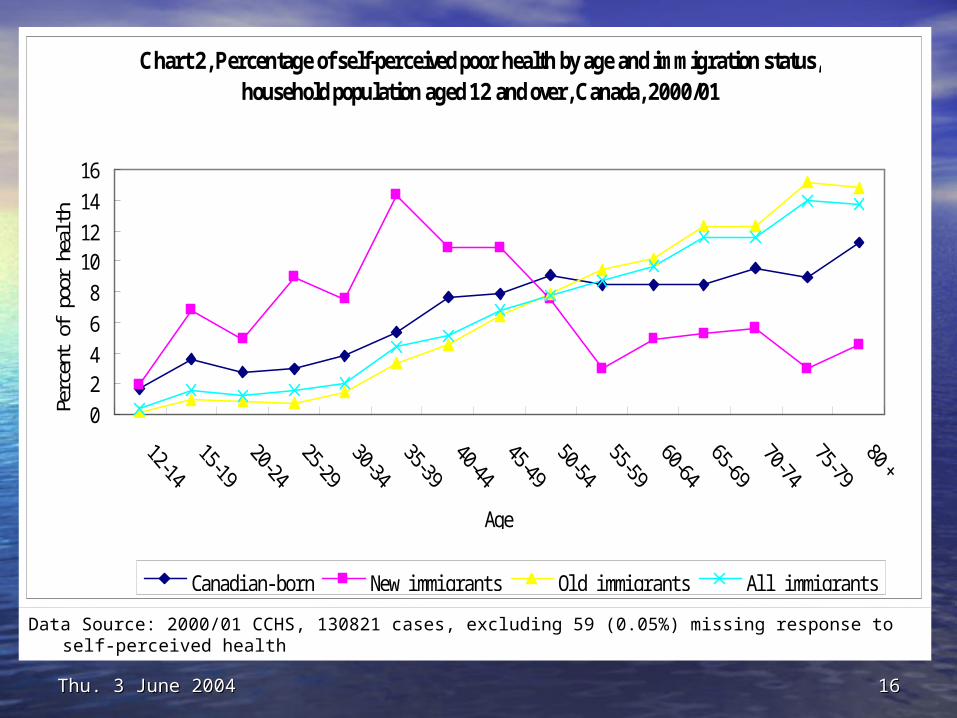
Data Source: 2000/01 CCHS, 130821 cases, excluding 59 (0.05%) missing response to self-perceived health
Chart 2, Percentage of self-perceived poor health by age and immigration status,household population aged 12 and over, Canada, 2000/01
0
24
6
8
1012
14
16
Age
Perc
ent
of p
oor
heal
th
Canadi an-born New i mmi grants Ol d i mmi grants Al l i mmi grants
Thu. 3 June 2004Thu. 3 June 2004 1717
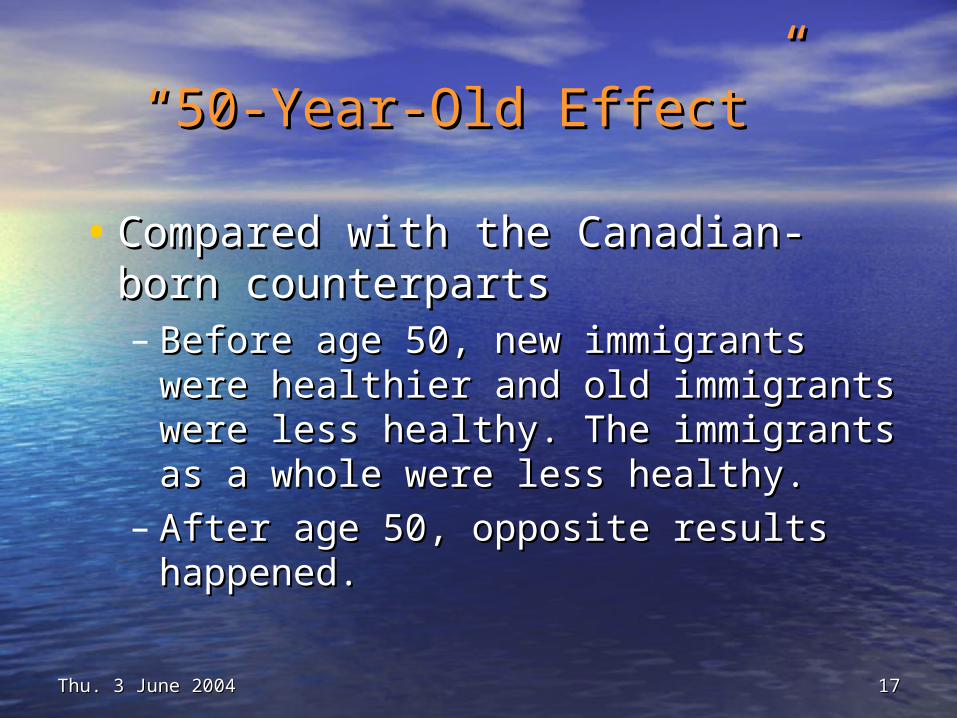
““ 50-Year-Old Effect”50-Year-Old Effect”
• Compared with the Canadian-born Compared with the Canadian-born counterparts counterparts – Before age 50, new immigrants were Before age 50, new immigrants were
healthier and old immigrants were less healthier and old immigrants were less healthy. The immigrants as a whole healthy. The immigrants as a whole were less healthy.were less healthy.
– After age 50, opposite results After age 50, opposite results happened.happened.
Thu. 3 June 2004Thu. 3 June 2004 1818
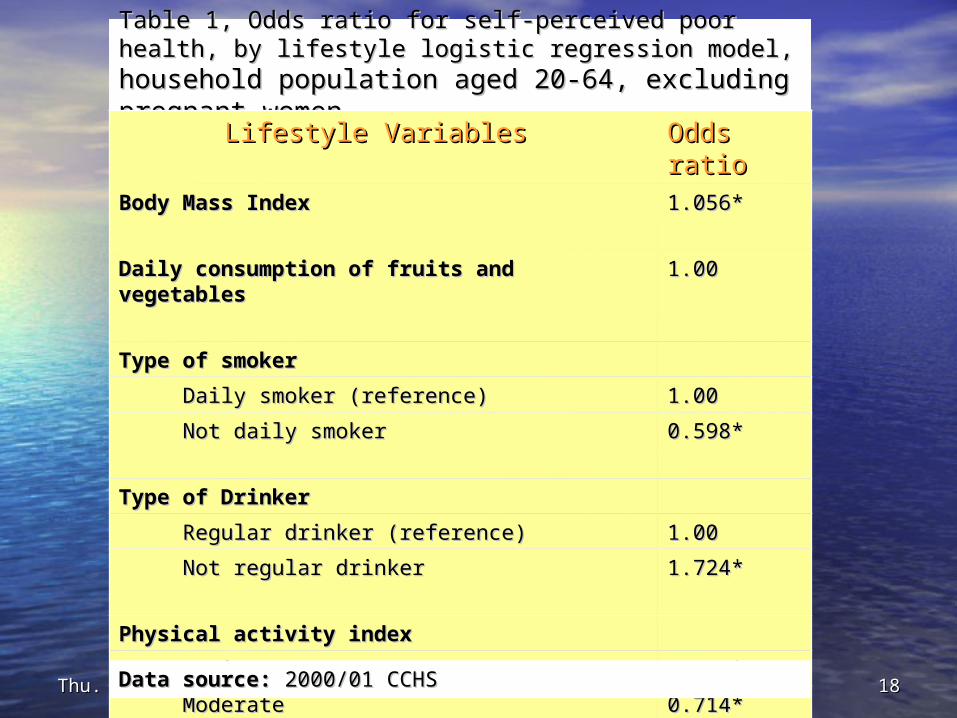
Table 1, Odds ratio for self-perceived poor health, by Table 1, Odds ratio for self-perceived poor health, by lifestyle logistic regression model, lifestyle logistic regression model, household household population aged 20-64, excluding pregnant population aged 20-64, excluding pregnant women.women...
Lifestyle Variables Lifestyle Variables Odds Odds ratio ratio
Body Mass IndexBody Mass Index
1.056* 1.056*
Daily consumption of fruits and vegetablesDaily consumption of fruits and vegetables 1.00 1.00
Type of smokerType of smoker
Daily smoker (reference) Daily smoker (reference) 1.00 1.00
Not daily smoker Not daily smoker 0.598* 0.598*
Type of DrinkerType of Drinker
Regular drinker (reference) Regular drinker (reference) 1.00 1.00
Not regular drinker Not regular drinker 1.724*1.724*
Physical activity indexPhysical activity index
Active Active 0.533* 0.533*
Moderate Moderate 0.714* 0.714*
Inactive (reference) Inactive (reference) 1.001.00
Data source: Data source: 2000/01 CCHS2000/01 CCHS

Thu. 3 June 2004Thu. 3 June 2004 1919
Table2, odds ratio for poor self-perceived health by sex and by Table2, odds ratio for poor self-perceived health by sex and by immigration status, household population aged 20-64, excluding immigration status, household population aged 20-64, excluding pregnant women.pregnant women.
Data source: Data source: 2000/01 CCHS (Canadian Community Health Survey)2000/01 CCHS (Canadian Community Health Survey)† † Odds ratios adjusted for age, sex, marital status, education, and household income.Odds ratios adjusted for age, sex, marital status, education, and household income.‡ ‡ Odds ratios adjusted for age, sex (excluded for men group or women group), marital status, Odds ratios adjusted for age, sex (excluded for men group or women group), marital status,
education, household income, body mass index, daily consumption of fruits and vegetables, education, household income, body mass index, daily consumption of fruits and vegetables, type of smoker, type of drinker, and physical activity index. type of smoker, type of drinker, and physical activity index.
§ Reference category. § Reference category. * Significantly different from reference category (p<0.05)* Significantly different from reference category (p<0.05)

Thu. 3 June 2004Thu. 3 June 2004 2020
Concluding RemarksConcluding Remarks
• The healthy immigrant effect did not hold The healthy immigrant effect did not hold for immigrant group as a whole. It applied for immigrant group as a whole. It applied to new immigrants over age 50 and old to new immigrants over age 50 and old immigrants under age 50. immigrants under age 50.
• There was significant difference in lifestyle There was significant difference in lifestyle between the Canadian-born population and between the Canadian-born population and immigrants. However, it was not associated immigrants. However, it was not associated with the difference in self-perceived health with the difference in self-perceived health between the two population groups. between the two population groups.

Thu. 3 June 2004Thu. 3 June 2004 2121
Contact InformationContact Information
• Yimin (Gloria) LouYimin (Gloria) Lou
• M.A. Candidate M.A. Candidate
• Department of SociologyDepartment of Sociology
• The University of Western OntarioThe University of Western Ontario
• London, ON, N6A 5C2London, ON, N6A 5C2
• Telephone: (519) 661-2111 ext. Telephone: (519) 661-2111 ext. 8510985109
• E-mail: [email protected]: [email protected]