through thick and thin: political risk and the
TRANSCRIPT
Through Thick and Thin:
Political Risk and the Interdependencies between MNCs and Host Countries
Jennifer L. Blouin
The Wharton School, University of Pennsylvania
Clare Wang
Tippie College of Business, University of Iowa
Laura A. Wellman
Smeal College of Business, Penn. State University
May 2018
Abstract
Using several unique datasets, we predict and find that multinational corporations’ (MNCs’) performance
abroad improves with the depth and strength of their local business relationships, particularly during periods
of heightened political risk in the host country. This evidence is consistent with the idea that MNCs rely on
local relationships in foreign jurisdictions to help navigate local institutions. While it is likely that MNCs
with the resources to invest in managing political risk do so with the expectation of some future economic
returns, it is less clear whether the nature of MNC engagement abroad generates positive or negative
externalities for the host country. We document that host country political risk is decreasing with the
aggregate level of relationships between MNCs and local companies, suggesting a positive externality in
the form of lower future political risk. Finally, we shed light on the potential mechanisms for institutional
change by identifying additional resources/expertise – beyond MNCs’ current economic activities – that
MNCs can draw on in their interactions with local government and non-government organizations.
We appreciate helpful comments from Phil Berger, Jonas Heese (discussant), Mark Lang, Christian Lundblad, Mark
Maffett, DJ Nanda, Erin Towery, Beverly Walther, and workshop participants at the 2018 FARS midyear meeting,
the University of Chicago Global Issues in Accounting Conference, the University of Georgia, and Arizona State
University.

1
Through Thick and Thin:
Political Risk and the Interdependencies between MNCs and Host Countries
1. Introduction
Ongoing political violence in Russia, Turkey, and Iraq; expropriation risk in Venezuela; tax
uncertainty in India; and debate over policies that threaten the development of intellectual property in
countries such as Brazil and China all represent highly unpredictable and nontrivial by-products of
internationalization. Understanding the nuances of host country political risk is less straightforward than
its economic counterpart, as subtle differences in institutional details are more challenging to quantify
than readily observable economic trends. Anecdotal evidence suggests that in response to ongoing
uncertainty, and perhaps in an attempt to appear as model citizens, multinational corporations (MNCs)
can take steps toward managing host country political risk by establishing strategic partnerships that align
and improve business interests and the public good. At least, that is the claim made by some of the largest
multinationals on the global policy portions of their websites. However, it is difficult to reconcile these
claims with media articles highlighting MNCs’ self-serving behavior in foreign markets, which can
sometimes jeopardize the social, political, and economic conditions of host countries.1
While it is likely that MNCs with the resources to invest in managing geopolitical risk do so with
the expectation of some future economic returns, it is less clear whether the nature of MNC engagement
abroad generates positive or negative externalities for the host country. Along these lines, we investigate
two related research questions. First, at the firm level, we study whether MNCs’ performance abroad
improves with the number and strength of their local business relationships, particularly during periods of
1 For example, on the “Public policy and advocacy” page of its corporate website, Nestle (2017) claims to play an
“Increasingly active role in society, including in development of laws, rules and policy documents . . . [and]
providing expertise to assist in more informed decision making.” Contrast these claims with reports that Nestle is
“stymieing public health officials seeking soda taxes or legislation aimed at curbing the health of impacts of
processed food” in China, South Africa, and Columbia (NYT 2017). In another example, Goldman Sachs claims to
provide “research and high-level advisory services to policymakers, regulators and investors around the world”
(Goldman Sachs Global Markets Institute 2017). However, many who have scrutinized Goldman’s advisory services
to policymakers in Greece believe that they may have significantly contributed to Greece’s recent financial crisis
(NYT 2015).
2
heightened political risk. Second, at the host country level, we investigate whether future political
stability varies with the aggregate level of MNCs’ local relationships. We also separately study this
association conditional on the nature of MNC engagement with host country government and non-
government organizations.
We begin by developing predictions about the association between local relationships and firm
performance. In principle, avoiding political hazards provides a strong incentive for MNCs to team up
with local organizations (Henisz and Williamson 1999). The ability of governments to modify
regulations, tax rates, or other economic policies represents a significant source of uncertainty for firms
(Hassett and Metcalf 1999; Pindyck and Solimano 1993; Rodrik 1991; McDonald and Siegel 1986). To
the extent that local relationships allow MNCs to navigate this source of uncertainty, we expect MNCs
with local ties to have stronger future performance relative to MNCs that do not maintain those
relationships. Further, we expect MNCs to favor strategic partnerships over simple contracts in politically
risky jurisdictions (Henisz and Williamson 1999). Cultivating partnerships not only aligns the interests of
MNCs and local companies, but also provides protection from adverse political action (Delios and Henisz
2003).
Ex ante, however, it is unclear what externalities will extend to the host country from a greater
multinational presence. On one hand, to the extent that host country governments consider MNCs’
sensitivity to political hazards that threaten the profitability of MNCs’ investments (e.g., expropriation
risk or intellectual property protection), host country governments have an incentive to stabilize their
political environment. Evidence that links political stability to economic growth suggests that all parties
have the potential to gain from strengthening local economic and political institutions (e.g., Alesina and
Rodrik 1994; Henisz 2000; Acemoglu and Robinson 2013, 2016, 2017). As a result, relationships
between MNCs and local firms may be positively associated with future political stability in the host
country. On the other hand, MNCs may lobby local governments in countries dominated by corrupt
political institutions with the expectation of securing political favors. Indeed, several studies document
evidence consistent with collusion between firms and policymakers at the expense of external

3
stakeholders (e.g., Shleifer and Vishny 1994; Faccio, Masulis, and McConnell 2006; Amore and
Bennedsen 2013). As a result, greater MNC presence may actually engender instability. Thus, it is not
obvious what association partnerships between MNCs and local firms will have with host country
political stability.
To investigate these questions, we rely on a novel dataset constructed by Factset Revere that
covers customer contracts and other business relationships between 2003 and 2016. At the firm level, we
document the types of economic relationships that MNCs form with local companies through a broad set
of external contracts (e.g., supply, distribution, marketing, and manufacturing services) and strategic
partnerships (research and technology collaborations, integrated product offerings, and joint ventures).
Our sample consists of 4,064 unique firms with 34,055 unique relationships (18,777 external contracts
and 15,278 strategic partnerships) located in 75 host countries. To capture time-series variation in
political risk, we rely on the International Country Risk Guide (ICRG) political risk index. Consistent
with the idea that MNCs rely on host country relationships to navigate local institutions, we document
that the likelihood of maintaining local relationships is increasing with the level of political risk in the
host country.
We continue our firm-level analysis by investigating variation in MNC performance abroad
conditional on the number and type of local relationships that MNCs maintain in the host country. Ideally,
we would measure variation in profitability (e.g., return on assets). However, one limitation of the data is
that we are unable to observe revenue by jurisdiction. Alternatively we proxy for MNC performance by
measuring growth in MNCs’ customer base by jurisdiction.
To identify the effect of local relationships on future customer growth, we regress host country
customer growth on MNCs’ local relationships, controlling for firm and host country characteristics
identified in prior literature. It is possible that maintaining local relationships correlates with the
importance of the revenue stream coming from customers in the host country. Thus, firms that choose to
maintain local relationships may systematically differ from firms that choose not to maintain local
relationships, simply because they differ in their economic exposure to that jurisdiction. To address this

4
concern, we study the association between MNCs’ local business relationships and future customer
growth among MNCs with existing customer contracts (i.e., existing economic exposure). We include
indicator variables for each MNC home country-host country combination. These indicators control for
time-invariant characteristics that are also correlated with maintaining cross-border economic ties (e.g.,
whether the home and host country share a physical border, etc.). To mitigate concerns that time-invariant
country and industry characteristics (e.g., country- or industry-level shocks to growth opportunities) affect
our inferences, we also include indicator variables for each country-industry combination. Finally, we
include year fixed effects to capture the influence of aggregate time-series trends. We document a positive
association between MNCs’ relationships and future customer growth in the host country, on average. A
one standard deviation increase in the number of business relationships results in an increase in customer
growth of 3%.
We recognize that the choice to maintain local relationships in the host country is not random and
correlates, in part, with unobservable firm characteristics. To address this concern, we perform several
additional tests. First, we replace host country-industry indicators with firm indicators to control for time-
invariant differences across firms with and without local relationships. We continue to find a positive
association between local relationships and future customer growth. Second, if local relationships are
important for navigating local political risk, then we predict that the association between local
relationships and future customer growth is stronger when ex ante political risk is high. To test this
prediction, we separately estimate the interaction between host country relationships and three periods of
increasing or high political risk: the level of political risk, changes in political risk, and recurring national
elections that represent spikes in political risk. Our results indicate that the benefit of local relationships is
most valuable around these periods, consistent with the notion that local relationships are important for
navigating local political risk.
After establishing an association between MNCs’ host country relationships and future customer
growth, we examine whether economic ties between MNCs and local firms generate positive or negative
externalities for the host country’s political environment. To do this, we aggregate all MNC relationships

5
with host country firms by host country-year and investigate the association between the total number of
MNCs’ relationships and future political risk in the country. We find a negative and significant
association between the total number of MNCs’ relationships and future political risk. This suggests that a
greater multinational presence is associated with positive outcomes for the host country in the form of
lower future political risk.
One concern is that our proxy for host country political risk correlates with a number of other
environmental factors (e.g., general economic risk). To shed light on the potential mechanisms for
institutional change, we identify additional resources/expertise – beyond MNCs’ current economic
activities – that MNCs can draw on in their interactions with local government and non-government
organizations. To do this, we augment our primary dataset with two additional datasets that are available
only for a subset of firm-year observations.
First, for a sample of U.S. MNCs, we identify whether MNCs maintain a government relations
department and expect MNCs that invest in this resource to be in a better position to navigate the local
political landscape. Consistent with this prediction, we document that the benefits extending from local
relationships for customer growth are concentrated among firms that maintain this resource. Further, we
expect that MNCs maintain a government relations department in order to navigate political risk
specifically, as opposed to economic risk in general.2 Consistent with this expectation, we predict and find
that the total number of relationships stemming from MNCs with government relations departments is
associated with lower future political risk in the host country. In contrast, we do not find that this resource
has any direct association with reducing future economic risk in the host country.
Second, we investigate variation in whether firms proactively manage their exposure to social and
environmental risks in the host country. Social and environmental risk management strategies that align
firms’ business interests with the public good can strengthen firms’ economic outcomes in the host
country (Henisz 2014). In addition, MNCs’ risk management strategies may complement (or strengthen)
2 MNCs can also maintain resources useful in economic risk analysis. For example, Caterpillar, Inc. invests in
macroeconomic forecasting, complementing its quarterly earnings announcements with a macroeconomic outlook.

6
host country policies (e.g., entitlement and environmental protection programs). As a result, we may
observe a positive association between host country political stability and relationships between local
firms and MNCs with this expertise. To investigate these predictions, we rely on firms’ MSCI ESG risk
ratings. We find that MNCs’ ability to successfully manage social and environmental risks contributes to
MNCs’ customer growth in the host country. We also find that local relationships extending from MNCs
with this resource have a greater impact on host country political stability. Additional analysis reveals that
expertise in managing social and environmental factors does not serve to stabilize host country economic
risk, which suggests that this MNC resource is correlated with firms’ ability to navigate (and influence)
host country political risk, specifically.
Collectively, our findings highlight interdependencies that develop between MNCs and host
countries characterized by heightened political risk. Our research makes several contributions. First, we
contribute to the literature that links complementarities among firm resources to firm performance (e.g.,
Milgrom and Roberts 1995; Arora 1996; Aral, Brynjolfsson, and Wu 2012; Grabner and Moers 2013).
These studies examine how firm-level resources interact, emphasizing that practices implemented in
concert produce disproportionately greater benefits for firms. We build on this theory and evidence by
documenting the benefits that accrue to MNCs and host countries as MNCs implement a multi-faceted
internationalization strategy. Specifically, MNCs benefit from complementing access to local knowledge
through local relationships with maintaining a government relations team and/or expertise in managing
environmental and social risks.
Second, we contribute to the literature on corporate political strategies. A growing stream of
research studies the informational strategies that firms can implement in order to offset negative exposure
to political risks (Wellman 2017; Hendricks et al. 2017; Reza, Ovtchinnikov, and Wu 2016). We identify
a specific mechanism for information flow – government relations staff – posited in qualitative research
to have a significant impact on firms’ ability to react to and influence policy (e.g., Hillman and Hitt
1999). We document that the performance benefits for cross-country relationships are strongest for firms
that maintain this resource.

7
Finally, several studies consider the implications of multinational investment for future economic
growth (Bekaert, Harvey, and Lundblad 2001; Bekaert and Harvey 2002, 2003). These studies
demonstrate that the timing and mode of entry into a particular market influence future economic growth
in that region, as well as the institutional context for economic growth (Henisz 2000). We document the
types of relationships (i.e., external contracts and strategic partnerships) and additional MNC resources
(i.e., government relationships departments and risk management expertise) that are associated with
future political stability in the host country. Whereas prior research has taken a nefarious view of
corporate political activity (e.g., Chaney, Faccio, and Parsley 2011; Faccio 2006; Faccio, Masulis, and
McConnell 2006), we document welfare gains associated with the aggregate level of relationships that
stem from MNCs with government relations staff and/or expertise in managing environmental and social
risks. To the extent that firms can benefit from more stable political environments, our findings are
relevant to managers who are deciding whether or not to pursue local relationships, as well as determining
the nature of their engagement with local firms, government, and nongovernment organizations.
2. Hypothesis development
The extent to which policy makers have the incentive and ability to alter policies in response to
economic conditions or the demands of their constituents represents a source of uncertainty for MNCs
(Henisz and Williamson 1999). Uncertainty from the public policy environment magnifies difficulties in
collecting, interpreting, and organizing the information necessary for successful investment (Wellman
2017). Hence, the demand for local knowledge is a significant determinant of maintaining relationships
with local companies when entering foreign jurisdictions (Barkema, Bell, and Pennings 1996; Henisz and
Williamson 1999).
Traditional theories of international expansion maintain that MNCs curtail chances of failure
through knowledge gained along a chain of increasing commitment, from customer relationships to
supplier relationships to strategic alliances (Davidson 1980). Accelerating commitment in this way allows
8
firms to take advantage of “simple transactions” while building a database of local market knowledge
(Henisz and Williamson 1999). However, in less stable countries, strategic partnerships can foster
incentive alignment between MNCs and local firms, as well as secure commitment from local partners
(Henisz 2014).
Further, in politically unstable countries, MNCs face added hazards relative to host country firms,
as policymakers favor domestic companies when considering policy change (Delios and Henisz 2003).
Indeed, empirical evidence supports the proposition that local partners are more likely to receive a share
of equity ownership when MNCs enter countries characterized by high political risk (Agarwal and
Ramaswami 1992; Phillips-Patrick 1991). Together, this theory and evidence suggest that MNCs benefit
not only from access to local knowledge through their local relationships, but also from protection against
adverse political action when these relationships take the form of partnerships. This theory and evidence
lead to the following prediction formally stated in alternative form:
Hypothesis 1: Relationships with host country firms are associated with MNCs’ future
performance in the host country, particularly during periods of heightened
political risk.
To the extent that positive externalities extend from foreign presence, host country governments
also face strong incentives to cultivate foreign participation in the local economy. For example, spillovers
may take place when local firms improve their efficiency by copying the practices of foreign affiliates. In
addition, multinationals often provide technical assistance to their suppliers in order to raise the quality of
their products, sometimes requiring their suppliers to satisfy International Standards Organization (ISO)
standards. Further, case studies (e.g., Moran 2001) indicate that MNCs help suppliers with management
training and organization of the production process, quality control, purchase of raw materials, and even
finding additional customers. Finally, local companies may also learn to use existing resources more
efficiently due to increased competition stemming from foreign presence in the local economy
9
(Blomstrom and Ari Kokko 1998). Collectively, this evidence suggests that host country economies stand
to gain significantly from foreign participation.
However, government enforcement of laws and regulations that promote economic activity varies
extensively across countries (La Porta et al. 1998; La Porta et al. 1999, 2008). Acemoglu and Robinson
(2013, 2016, 2017) argue that economic policies are an outcome of political choices that are shaped by
the quality of political institutions. Acknowledging the close link between the quality of political and
economic institutions, Alesina and Rodrik (1994) and Henisz (2000) document a positive association
between political stability and economic growth. Building on this theory and evidence, we argue that in
order to foster continued economic relationships with multinationals, host countries must critically
evaluate the quality of their political environment. Consistent with this, several studies document
multinationals’ sensitivity to the quality of political institutions that shape economic outcomes in the host
country. For example, MNCs have been shown to exhibit sensitivity to the strength of intellectual
property rights protection (Javorcik 2004), the threat of expropriation from the state (Opp 2012), and
political violence (Hiatt and Sine 2014).
If host country governments have an incentive to redesign policies in order to cultivate continued
relationships with multinationals, then we expect externalities to extend from foreign presence in the form
of changes in political stability. Finally, we expect externalities that extend from relationships between
MNCs and local companies to be stronger when those relationships take the form of strategic
partnerships. This is in part due to stronger incentive alignment between multinationals and local
companies to improve local institutions and thus economic opportunity for all parties (Henisz 2014). We
make the following prediction, formally stated in alternative form:
H2: The total number of MNCs’ local relationships is associated with future political risk in the
host country.

10
3. Measures for host country political risk, MNCs’ relationships, and MNCs’ government
relations and quality of risk management
3.1 Host country political risk
To capture time-series variation in political risk, we rely on the International Country Risk Guide
(ICRG) political risk index. The ICRG staff collects political information and makes subjective
assessments based on available information in a consistent pattern of evaluation. The objective of the
political risk index is to measure political stability along 12 components. The minimum number of points
that can be assigned to each component is zero, while the maximum number of points depends on the
fixed width that component is given in the overall political risk assessments. In every case, the higher
(lower) the risk point total, the higher (lower) the risk. After a risk assessment (rating) has been awarded
to each of the 12 components, the components are added together to create the index.
Appendix B summarizes the risk components and weights. Government Stability, Socioeconomic
Conditions, Investment Profile, Internal Conflict, and External Conflict are the most heavily weighted
components of the overall index (i.e., a maximum of 12 points can be assigned to each of these
categories). Corruption, Military in Politics, Religious Tensions, Law and Order, Ethnic Tensions, and
Democratic Accountability can receive up to a maximum of six points, and Bureaucracy Quality a
maximum of four points.
To measure the level of political risk for country k in year t, we use the summary measure of
political risk as provided by ICRG. Specifically, POLITICAL_RISK is the index value across all twelve
components of political risk for country k in year t.
In Table 1, we observe variation across countries in the level of POLITICAL_RISK. ICRG
classifies countries as low risk if POLITICAL_RISK falls below 30.00, moderate risk if
POLITICAL_RISK is between 30.00 and 39.99, and high risk if POLITICAL_RISK rises above 39.99.
Using each country’s average political risk across our sample period, we classify the following countries
as moderate risk: Argentina, Bahrain, Brazil, Bulgaria, China, Ghana, Greece, Israel, Jordan, Kazakhstan,
Morocco, Peru, Philippines, Romania, Saudi Arabia, South Africa, Tunisia, Vietnam, and Zambia. Using

11
the same measure, we classify the following countries as high risk: Bangladesh, Bolivia, Colombia, Cote
d’Ivoire, Egypt, India, Indonesia, Iran, Kenya, Nigeria, Pakistan, Russia, Thailand, Turkey, Uganda, and
Venezuela.
3.2 Customer contracts and host country relationships
To capture firms with economic exposure to fluctuations in geopolitical risk, we identify firms
with customer contracts in the host country using a novel dataset constructed by Factset Revere. The same
dataset is used to track other business relationships (i.e., external contracts and strategic partnerships).
Factset analysts systematically collect companies’ relationship information exclusively from primary
public sources such as SEC 10-K annual filings, investor presentations, and press releases, and they
classify them through normalized relationship types. Data quality is monitored using a combination of
system quality control (i.e., an internally developed document reader with customizable searching and
translation tools) and human quality control. Company information is fully reviewed annually, and
changes based on press releases and corporate actions are monitored daily.
Beyond customer contracts, external contracts include supply, distribution, manufacturing, and
marketing contracts. Strategic partnerships include research and technology collaborations, integrated
product offerings, equity investments, and joint ventures.3 Appendix C provides more detail on each
category type.
So that we can identify MNCs with economic exposure to a particular jurisdiction, and thus
exposure to that country’s political risk, our sample of firm-host country-year observations includes only
those observations for which firm i has at least one customer contract in country k during year t. Our
primary independent variable of interest, RELATIONSHIPS, is the total number of relationships across
both external contract and strategic partnership categories for firm i in host country k during year t. In our
3 Factset Revere tracks licensing contracts (i.e., contracts whereby the MNC licenses products, patents, intellectual
property or technology). We exclude these contracts from our analyses because they are less likely to be
accompanied by a physical presence in the host country.
12
analyses, we also investigate the implications of external contracts and strategic partnerships separately,
with RELATIONSHIPSExternal_Contracts and RELATIONSHIPSStrategic_Partnership, respectively.
3.2 Measures for government relations and quality of risk management
We consider two additional activities that MNCs can combine with their local relationships:
whether or not MNCs maintain a government relations department, and/or the ability of MNCs to manage
social and environmental risks.
While the specific objectives of government relations teams vary across firms in our sample, in
general, staff interact with government officials in order to gain and maintain favorable policies from the
MNC’s perspective. We collect data on whether or not firms in our sample have an internal government
relations department. These data are available for MNCs domiciled in the United States and are collected
from Representatives, a directory published semi-annually by Columbia Books & Information Services
throughout our sample period.4
To identify whether or not our sample firms have any internal government relations staff, we
manually search the directory for each firm-year observation. If a company has any internal employees
listed as part of the company’s government relations staff, GOV_RELATIONS is set equal to one, and zero
otherwise. Thus, GOV_RELATIONS is measured annually at the firm level.
Next, we investigate variation in whether firms proactively manage social and environmental
risks in the host country. Social and environmental risk management strategies that align firms’ business
interests with the public good have the potential to build capital among customers, communities, and
governments (Henisz 2014). Thus, we expect that firms that take a more holistic approach to engaging
with stakeholders in the host country stand to gain the most. In addition, MNCs’ risk management
strategies may complement (or strengthen) host country policies. As a result, we may observe a positive
4 The directory lists internal employees who represent their firm in both domestic and international affairs. A
limitation of the data is that we cannot observe time-series variation in government relations resources dedicated to
specific host countries. If MNCs maintain this firm-level resource but have not dedicated any resources specifically
to the host country, this should bias against our finding any benefits extending to either the MNC or the host country
for activity in the host country.

13
association between host country political stability and relationships between local firms and MNCs with
this expertise. To test these predictions, we use the MSCI ESG risk ratings to identify firms that are more
(less) effective in managing social and environmental issues. Appendix D outlines the components of the
ESG risk rating. Companies are rated on a scale of AAA-CC relative to the standards and performance of
their industry peers. We separate firms on the relative strength of their rating. For firms receiving a rating
of AAA, AA, or A, STRONG_ESG equals one, and zero otherwise.
4. Firm-level analyses
In this section, we investigate whether the level of host country political risk contributes to
MNCs’ decisions to team up with local companies. We examine this question among firms with existing
economic exposure to host country political risk through current customer contracts. We then study
whether benefits accrue to MNCs that decide to manage local relationships.
4.1 Sample
Our sample consists of firm-host country-year observations where firm i has revenue exposure to
country k during year t through customer contracts for the years 2003 through 2016. Our sample period is
constrained to these years because of the data needed to construct measures of the various forms of
relationships from Factset Revere, which began coverage in 2003. Data on firm characteristics come from
Worldscope, and data on country characteristics come from the World Development Indicator database
(World Bank).
In Table 2, we document the distribution of MNCs based on location of MNC headquarters. Not
surprisingly, the largest concentration of firms is domiciled in the United States, followed by the United
Kingdom, Canada, Germany, and France.
4.2 Managing host country relationships, conditional on host country political risk

14
In this section, we investigate the determinants of managing host country relationships,
conditional on revenue exposure in the host country.5 Our sample includes firm-host country-year
observations with economic exposure to host country political risk through existing customer contracts.
We use the following firm-host country-year cross-sectional OLS regression specification:
Ln(RELATIONSHIPikt) = α + β1POLITICAL_RISKkt + ∑γFIRM CONTROLSit +
∑θHOST-COUNTRY CONTROLSkt + FE + εikt (1)
where i, k, and t indexes firms, host countries, and years, respectively: RELATIONSHIPSikt represents the
number of relationships firm i had in host country k in year t and captures the extent of firms’
involvement in the host country through local relationships.
POLITICAL_RISKikt is ICRG’s summary index value across all twelve components of political
risk for host country k in year t. The coefficient on POLITICAL_RISKikt measures whether the level of
host country political risk affects the likelihood that MNCs will maintain relationships with host country
firms. To the extent that these MNCs are more likely to have relationships with local firms in place during
periods of high political risk, we expect a positive and significant coefficient on POLITICAL_RISKikt.
We include various firm-level and host country-level variables identified in prior research as
determinants of global entry decisions (e.g., Ferreira, Massa, and Matos 2010; Martynova and Renneboog
2008). We include variables that capture firms’ resources and growth opportunities: firm size, SIZE; cash
flow, CF; market leverage, LEV; market-to-book ratio, MTB; research and development, R&D; and sales
growth, GROWTH.
For host country characteristics, we include several country characteristics that capture general
macroeconomic conditions. Pastor and Veronesi (2013) document that volatility stemming from policy
uncertainty worsens with changes in economic conditions. Barro and Sala-i-Martin (1995) argue that
government consumption proxies for political corruption, nonproductive public expenditures, or taxation.
5 Appendix A provides details on how all of the variables are calculated.

15
Bekaert and Harvey (1995, 1997, 2000) and Levine and Zervos (1998) employ the size of the trade sector
as a measure of openness of the particular economy to trade. Barro (1997) provides evidence suggesting a
negative relationship between inflation and economic activity. Drawing from these studies, we include
GDP growth, GDP_GROWTH; government consumption, CONSUMPTION; the size of the trade sector,
TRADE; and the annual rate of inflation, INFLATION.
We also include variables that capture development in the banking sector and financial markets.
Following the evidence presented in King and Levine (1993), we include PRIVATE_CREDIT to capture
the level of credit issued by private banks in the region, in contrast to that issued by a central bank. We
include two variables that proxy for general development of the equity market: a measure of equity
market size (MARKET_CAP) and a measure of market liquidity, equity market turnover (TURNOVER).
We also include indicator variables for each MNC home country-host country combination. These
indicators control for time-invariant characteristics that are also correlated with maintaining cross-border
economic ties (e.g., whether the home and host country share a physical border). To mitigate concerns
that time-invariant country and industry characteristics (e.g., country- or industry-level shocks to growth
opportunities) affect our inferences, we also include indicator variables for each country-industry
combination. Finally, we include year fixed effects to capture the influence of aggregate time-series
trends.
Table 4 documents the results of estimating equation (1). In column (1), the coefficient on
POLITICAL_RISK is positive and significant, consistent with a positive relation between the level of host
country political risk and MNCs’ propensity to maintain relationships with local firms. In columns (2)
and (3), we further distinguish between the types of relationships (i.e., external contracts vs. strategic
partnerships, respectively) in the dependent variable. The results show that there are few differences in
the determinants of maintaining external contracts and strategic partnerships. Specifically, the choice to
maintain strategic partnerships is increasing with firms’ growth opportunities (MTB) and investments in
research and development (R&D). The likelihood of MNCs maintaining either external contracts or
strategic partnerships is increasing with the level of host country political risk.

16
4.3 Customer growth
We continue our firm-level analysis by investigating variation in MNC performance abroad
conditional on the number and nature of local relationships that MNCs maintain in the host country. We
predict that firms willing to manage local relationships do so with the expectation of achieving future
customer growth in the host country. To test this prediction, we examine the association between MNCs’
local relationships and customer growth in the host country from t to t+3. We estimate the following
ordinary least squares (OLS) regression:
CUSTOMER_GROWTHikt, t+3 = α + β1RELATIONSHIPikt + ∑γFIRM CONTROLSit
+ ∑θHOST-COUNTRY CONTROLSkt + FE + εikt (2)
where i, k, and t indexes firms, host countries, and years, respectively: customer growth,
CUSTOMER_GROWTH, is calculated based on the four-year geometric average of the annual growth rate
in the customer base from time t to t+3 for firm i in country k. We predict that the estimated coefficient on
RELATIONSHIPS will be positively associated with CUSTOMER_GROWTH (i.e., β1 > 0).
We include firm and host country characteristics from equation (1). We also include indicator
variables for each MNC home country-host country combination. These indicators control for time-
invariant characteristics that are also correlated with maintaining cross-border economic ties (e.g.,
whether the home and host country share a physical border). To mitigate concerns that time-invariant
country and industry characteristics (e.g., country- or industry-level shocks to growth opportunities) affect
our inferences, we include indicator variables for each country-industry combination. We also include
year fixed effects to capture the influence the aggregate time-series trends. Standard errors are clustered
by host country and year to control for residual correlation in the growth of firm i’s customer base over
time and for residual correlation in the growth of firm i’s customer base across countries in year t
(Petersen 2009).
Table 5 provides tests for the association between MNCs’ host country relationships and host
country customer growth. Panel A of Table 5 provides the results of estimating equation (2). In column
(1), we investigate the association between RELATIONSHIPS and CUSTOMER_GROWTH, controlling
17
for firm and host country characteristics, as well as home country-host country, host country-industry, and
year fixed effects. We document a statistically positive association between RELATIONSHIPS and
CUSTOMER_GROWTH (coefficient = 0.0140, t = 2.13, two-tailed p = 0.03). A one standard deviation
change in RELATIONSHIPS represents a 3.2% increase in customer growth over the period t to t+3.6 In
column (2), we replace host country-industry fixed effects with firm fixed effects to control for time-
invariant unobservable firm characteristics. We continue to find a positive and significant coefficient on
RELATIONSHIPS (coefficient = 0.0449, t = 5.41, two-tailed p < 0.01). In column (3), we replace host
country-industry and year fixed effects with host country-industry-year fixed effects. These fixed effects
control for all time-varying and time-invariant country and industry characteristics that affect companies’
decision to maintain local relationships. We continue to find a positive and significant coefficient on
RELATIONSHIPS (coefficient = 0.0213, t = 3.34, two-tailed p < 0.01). In columns (4) and (5), we
separately examine the association between RELATIONSHIPS that come from external contracts and
strategic partnerships, respectively. In column (4), we do not find evidence that external contracts explain
future customer growth. However, in column (5), we find a statistically positive association between
strategic partnerships, as evidenced by the coefficient on RELATIONSHIPS and CUSTOMER_GROWTH
(coefficient = 0.0350, t = 3.19, p < 0.01).
Next, we investigate whether the benefit of local relationships for future customer growth is
conditional on the level and changes of ex ante political risk. If local relationships are important for
navigating local political risk specifically, then we expect that the association between local relationships
and future customer growth will be stronger when ex ante political risk is high and/or when there have
been significant increases in political risk. To test this prediction, we perform three sets of analyses. First,
we investigate whether the association between RELATIONSHIPS and CUSTOMER_GROWTH from t to
t+3 is conditional on the level of political risk at t-1 by augmenting equation (2) with an interaction term
6 3.2% is calculated by multiplying the value of the coefficient on non-transformed RELATIONSHIPS in column (1)
(i.e., 2.07, Table 4, Panel B) by the standard deviation of non-transformed RELATIONSHIPS for the customer
growth sample (i.e., .0154, untabulated).

18
between RELATIONSHIPS and POLITICAL_RISKHigh. We expect an incremental benefit from host
country relationships for customer growth in the host country when political risk at t-1 is high. The
coefficient on the interaction between RELATIONSHIPS and POLITICAL_RISKHigh captures the
association between RELATIONSHIPS and CUSTOMER_GROWTH for relationships maintained in high-
risk countries. If local relationships in high-risk countries are particularly beneficial, we expect a
statistically positive coefficient on the interaction term RELATIONSHIPS x POLITICAL_RISKHigh (i.e., β3
> 0).
In column (1) of Table 5, Panel B, we find that the coefficient on the interaction term
RELATIONSHIPS x POLITICAL_RISKHigh is positive and significant. This is consistent with the notion
that MNCs experience a more substantial benefit from maintaining relationships in high-risk countries.
Second, we investigate whether the association between RELATIONSHIPS and
CUSTOMER_GROWTH from t to t+3 is conditional on significant increases in the level of political risk
from t-1 to t by augmenting equation (2) with an interaction term between RELATIONSHIPS and
POLITICAL_RISKIncrease. To do this, we identify host country-years that experience a significant increase
in political risk (i.e., move from low to moderate risk or from moderate to high risk) as defined in the
International Country Risk Guide. If relationships in place around periods of increasing political risk are
particularly beneficial, we expect a statistically positive coefficient on the interaction term
RELATIONSHIPS x POLITICAL_RISKIncrease (i.e., β3 > 0).
In column (2) of Table 5, Panel B, we present the results of this analysis. We document a positive
and significant coefficient on the interaction term RELATIONSHIPS x POLITICAL_RISKIncrease. This
finding is consistent with MNCs benefiting from relationships, particularly around periods of increasing
political risk.
One remaining concern is that trends in political risk correlate with trends in general economic
conditions. To address this concern, we build on the findings of Julio and Yook (2012) and study shocks
to political risk relying on elections in which the national leader is determined. As the authors point out,
term limits imposed by recurring elections introduce the possibility that new leaders with different policy

19
preferences may replace current leaders. As a result, firms face uncertainty over how election outcomes
will alter policies that affect profitability. In our setting, election-induced political risk is only one
component of overall political risk. That is, predicting (or observing) the outcome of the election is only
one piece of the puzzle. Uncertainty about how newly elected officials pursue their agendas alongside
other elected and/or appointed government officials suggests that firms continue to face political risk even
after election outcomes are known (e.g., Fowler 2006, Goodell and Vähämaa 2013, Füss and Bechtel
2008). Nevertheless, relying on national elections as shocks to political risk is a useful empirical tool for
separating political risk from general economic risk, as timed elections represent recurring, temporary
spikes in political risk that are exogenous to economic conditions.
To investigate whether local relationships are useful for navigating election-induced political risk,
we collect data on the timing of national elections relying on the methodology of Julio and Yook (2012).
Specifically, Julio and Yook (2012) collect detailed election information from a variety of sources,
beginning with identifying the chief executive of each country and the national elections associated with
the selection of the chief executive.7 Next, the authors classify countries as having either exogenous
timing or endogenous timing. In our setting, we are only interested in those national elections where the
timing of the election is exogenously specified by electoral law, as these elections are less likely to
correlate with variation in other country-level characteristics (e.g., general economic trends). In Table 1
of Julio and Yook (2012), the authors report 20 countries having exogenous (i.e., fixed) timing (pg. 53).
Of these 20 countries, 18 are included in our sample: Argentina, Brazil, Chile, Colombia, France,
Hungary, Indonesia, Luxembourg, Mexico, Norway, Peru, Philippines, Russia, South Korea, Sweden,
Switzerland, United States, and Venezuela. For these 18 countries, we collect data on the timing of the
elections relying on the World Bank Database of Political Institutions and various internet sources for
cases in which election information is missing.
7 See Section II (pg. 51) of Julio and Yook (2012) for more detail on data collection and validation.

20
We investigate whether the association between RELATIONSHIPS and CUSTOMER_GROWTH
from t to t+3 varies between election and non-election years by augmenting equation (2) with an
interaction term between RELATIONSHIPS and POLITICAL_RISKElection_YR. We isolate host countries that
that have at least one national election during our sample period, reducing our sample to 12,499 firm-host
country-year observations. POLITICAL_RISKElection_YR is set equal to one if country k experiences a
national election in year t, and zero otherwise. The coefficient on the interaction between
RELATIONSHIPS and POLITICAL_RISKElection_YR captures the incremental effect between
RELATIONSHIPS and CUSTOMER_GROWTH for relationships in place during election years compared
to non-election years. If relationships in place during election years are particularly beneficial, we expect
a statistically positive coefficient on the interaction term RELATIONSHIPS x POLITICAL_RISKElection_YR
(i.e., β3 > 0).
In column (3) of Table 5, Panel B, we present the results of this analysis. The coefficient on the
interaction term RELATIONSHIPS x POLITICAL_RISKElection_YR is positive and significant, consistent
with a stronger benefit in election years relative to non-election years. However, we note that the overall
effect is moderate in this subsample of countries.
Finally, we perform a falsification test to identify whether host country relationships specifically,
rather than MNCs’ business relationships in general, contribute to host country customer growth. To the
extent that maintaining host country relationships captures unobservable firm resources that allow MNCs
to navigate uncertainty in general, we expect all MNC relationships (regardless of where those
relationships are maintained) to have a positive association with future customer growth in the host
country. In contrast, if firms maintain local relationships to navigate local institutions specifically, then
we expect no association between relationships maintained in other foreign jurisdictions and host country
customer growth. To test this prediction, we separately count relationships that MNCs have with local
companies in all other foreign jurisdictions (i.e., firm i’s total foreign relationships, less relationships in
the focal host country) by firm-year and regress host country customer growth on MNCs’ residual foreign
relationships. To illustrate, firm i has nine foreign relationships across all jurisdictions where firm i has

21
existing customer contracts, one of which is Mexico, where firm i maintains two local relationships. Our
measure of other foreign relationships, RELATIONSHIPSOther_Foreign, equals seven (i.e., nine total
relationships, less two relationships in Mexico) for firm i’s Mexico observation in year t.
Table 6 reports the results of re-estimating equation (2) including RELATIONSHIPSOther_Foreign. In
column (1), we replace RELATIONSHIPS with RELATIONSHIPSOther_Foreign and find no significant
association between RELATIONSHIPSOther_Foreign and CUSTOMER_GROWTH. In column (2), we re-
estimate equation (2) including both RELATIONSHIPSOther_Foreign and RELATIONSHIPS and continue to
find no significant association between RELATIONSHIPSOther_Foreign and CUSTOMER_GROWTH. Taken
together, the evidence in Table 6 is consistent with our prediction that host country customer growth does
not vary with MNCs’ foreign relationships maintained outside of the host country.
Collectively, the results of our firm-level analysis show that MNCs’ relationships are beneficial to
their host country customer base. We find a positive association between MNCs’ relationships and future
customer growth, and the association appears to be driven by strategic partnerships, rather than external
contracts. Further, our evidence is consistent with firms maintaining relationships with local companies in
the host country in order to navigate host country political risk. As a result, firms that maintain
relationships enjoy greater future customer growth in the host country.
5. Host country analysis
Next, we examine whether economic relationships between MNCs and local firms generate
positive or negative externalities for the host country’s political environment. On one hand, to the extent
that host country governments consider MNCs’ sensitivity to political hazards that threaten the
profitability of MNCs’ investments (e.g., expropriation risk or intellectual property protection), host
country governments have an incentive to stabilize their political environment. As a result, relationships
between MNCs and local firms may be positively associated with future political stability in the host
country. On the other hand, MNCs may lobby local governments in countries dominated by corrupt
political institutions with the expectation of securing political favors. As a result, greater MNC presence

22
may actually engender instability. To test the association between the total number of MNCs relationships
with local firms and future political stability in the host country, we estimate the following ordinary least
squares (OLS) regression:
POLITICAL_RISKk,t+1 = α + β1RELATIONSHIPSAggregatekt + ∑θHOST-COUNTRY CONTROLSkt +
FE + εkt (3)
where k and t indexes host countries and years, respectively: political risk, POLITICAL_RISK, is
calculated based on the level of political risk in t+1 for country k. We predict that the estimated
coefficient on RELATIONSHIPSAggregate will be negatively associated with POLITICAL_RISK (i.e., β1 <
0). Because policymakers’ actions are sensitive to changes in macroeconomic conditions (Pastor and
Veronesi 2013), there is a natural link between fluctuations in the macro economy and political stability.
Thus, in studying the relation between aggregate relationships formed between MNCs and local firms, we
control for factors that describe macroeconomic and market conditions: GDP_GROWTH,
CONSUMPTION, TRADE, INFLATION, PRIVATE_CREDIT, MARKET_CAP, NUMBER_COMPANIES,
and TURNOVER. We also include an additional control for ex ante political risk for country k at t-1. We
cluster standard errors by host country and year to control for residual correlation in political risk for
country k over time and residual correlation in political risk across countries in year t (Petersen 2009).
Table 7 presents the results of estimating equation (3). In column (1) of Panel A, we document a
negative and significant association between RELATIONSHIPSAggregate and POLITICAL_RISKt+1 after
including country characteristics, as well as host country and year fixed effects (coefficient = -0.0014, t =
-2.39, p = 0.02). A one standard deviation change in RELATIONSHIPSAggregate (186.15, untabulated)
results in a 0.26 change in the political risk score. Relative to the sample mean of 20.40 (Table 3, Panel
B), this represents a change of about 1.2%. In column (2), we continue to find a negative association
between RELATIONSHIPSAggregate and POLTICAL_RISKt+1 when we estimate equation (3) focusing
exclusively on external contracts as our dependent variable (coefficient = -.0016, t = -2.33, p = 0.02).
Interestingly, we document an insignificant coefficient on RELATIONSHIPSAggregate when we focus on

23
strategic partnerships alone. This suggest that externalities extending from strategic partnerships do not
manifest within a one-year horizon. Thus, we extend our analysis to include two- and three-year horizons.
In Table 7, Panels B and C, we document the results of estimating equation (3) using longer
horizons of future political risk. In Table 7, Panel B, we extend the horizon of political risk to represent
the average level of future political risk for host country k over the periods t+1 and t+2. Requiring an
additional year reduces the sample from 651 host country-year observations to 516 host country-year
observations. In columns (1) and (2) of Panel B, we continue to find that the aggregate number of MNC
relationships in host country k during year t is negatively associated with the level of future political risk
for country k, regardless of whether we estimate equation (3) relying on all MNC relationships (column
(1)) or just external contacts (column (2)). However, unlike the results in Panel A, the results in column
(3) of Panel B show a negative and significant association between strategic partnerships and future
political risk (coefficient = -0.0029, t = -2.03, p = 0.04). This suggests that externalities extending from
MNCs’ strategic partnerships with local firms come with some delay, relative to external contracts.
In Table 7, Panel C, we extend the horizon of political risk to represent the average level of future
political risk for host country k over the periods t+1 and t+3. Requiring an additional year further reduces
the sample from 516 host country-year observations to 458 host country-year observations. In columns
(1) - (3) of Panel C, we continue to find that the aggregate number of MNC relationships in host country k
during year t is negatively associated with the level of future political risk for country k, regardless of
whether we estimate equation (3) relying on all MNC relationships, external contacts, or strategic
partnerships, respectively. Collectively, these results suggest that relationships between MNCs and local
companies are positively associated with future political stability, and this association persists for several
years. In the next section, we investigate potential mechanisms for this association.
6. Supplemental analysis: Channels for predicting and influencing political stability
One concern is that our proxy for host country political risk correlates with a number of other
environmental factors (e.g., general economic risk). To shed light on the potential mechanisms for

24
institutional change, we identify additional resources/expertise – beyond MNCs’ current economic
activities – that MNCs can draw on in their interactions with local government and non-government
organizations. Specifically, we identify whether the MNC has a government relations department and/or
whether the MNC has expertise in managing environmental and social factors. We expect MNCs that
have developed these unique resources and/or expertise to be in a better position to navigate host country
political risk. We discuss each of these analyses separately below, as each variable further restricts our
sample due to available data on these additional MNC characteristics.
6.1 MNCs’ government relations staff
Alongside strategic partners, MNCs can engage in discussions over environmental or labor laws,
international trade barriers, or tax concessions for particular investments (Henisz and Williamson 1999;
Delois and Henisz 2003). Throughout these interactions, MNCs have the opportunity to inject members
of their own government relations department in an effort to influence policy outcomes. In addition to
providing opportunities for influence, participating in policy discussions reduces information asymmetry
over political outcomes, regardless of whether outcomes are ultimately favorable from the firm’s
perspective (Henisz and Zelner 2004). To investigate whether maintaining government relations staff
improves the overall success of the MNC in the host country, we collect data on whether or not MNCs
have internal government relations staff.8 If a company has any internal employees listed as part of the
company’s government relations staff, GOV_RELATIONS is set equal to one, and zero otherwise. We are
able to collect this data only for U.S.-domiciled MNCs. Because our access to data on government
relations staff are only available through 2014, we restrict our sample period to 2003 through 2014 for
this test. This reduces our firm-host country-year observations from to 11,274. We find that only 843
firm-host country-year observations stem from MNCs that have government relations staff, which
represents 100 unique firms. This is not surprising given the cost associated with maintaining this unique
8 See Section 3 for additional details on the construction of this variable.

25
resource (Bremmer 2005). We expect to find that the benefits of host country relationships are greatest
when firms maintain this resource.
Table 8 reports the results of our analyses related to government relations divisions. In Panel A,
column (1), we first replicate the findings of Table 5 for our sub-sample of U.S. MNCs. We continue to
find a positive and significant association between RELATIONSHIPS and future customer growth
(coefficient = 0.0106, t = 2.48, p = 0.01). In columns (2) and (3), we partition our sample on whether or
not U.S. MNCs have at least one government relations staff member, and we simultaneously estimate
equation (2) across these two subsamples. In column (2), the coefficient on RELATIONSHIPS is positive
and significant (coefficient = 0.0941, t = 2.37, p = 0.02). In contrast, when we re-estimate equation (2) on
the sample of firms without government relations staff, we no longer find a positive association between
RELATIONSHIPS and CUSTOMER_GROWTH. However, the coefficient on RELATIONSHIPS is not
statistically different across the two columns (F = 2.24, p = 0.1342).
Next, we investigate whether the association between the total number of MNC relationships and
future stability in the host country varies between MNCs that do (do not) maintain government relations
departments. Through ongoing communication with local policymakers, MNCs can either act in their own
self-interest by pursuing policies that provide benefits to their organization at the expense of other
stakeholders, or pursue policies that extend benefits to the broader constituency. Securing specific
policies can front-load the economic benefits enjoyed by MNCs (Boddewyn and Brewer 1994). However,
as policymakers are replaced by newly elected/appointed officials, broader policies are more likely to
survive shifts in the preferences of any particular policymaker (Henisz and Zelner 2004). Thus, if MNCs’
interactions with local governments result in highly specialized policies, we would not expect their
presence in the host country to engender future political stability, on average. Thus, it is an empirical
question whether and how MNCs’ government relations staff will have any influence over host country
political stability.
As in the customer growth analysis, in Panel B, column (1), we first replicate the findings of
Table 7 for our sub-sample of U.S. MNCs. We continue to find that the total number of MNC

26
relationships is negatively associated with future political risk, on average. We then separately aggregate
cross-country relationships between MNCs with government relations staff (i.e.,
RELATIONSHIPSGov_Relations_Firms) and those without (i.e., RELATONSHIPSNon_Gov_Relations_Firms). In column
(2), we find that the coefficient on RELATIONSHIPSGov_Relations_Firms is negative and significant (coefficient
= -0.0473, t = -3.12, p < 0.01). In contrast, the coefficient on RELATIONSHIPSNon_Gov_Relations_Firms is
positive and marginally significant. This evidence is consistent with at least two explanations. First,
MNCs with government relations staff are in a better position to predict changes in future political risk.
Second, aggregate activity stemming from MNCs with government relations (i.e., influence over policy
outcomes) has a positive impact on future political stability in the host country.
Finally, in Table 8, Panel C, we investigate whether activity stemming from MNCs with
government relations staff has any association with future economic risk. We expect that MNCs that
invest in this resource do so in order to better predict and/or influence specific political outcomes, as
opposed to general economic risk. While we observe a negative association between the total number of
MNC relationships and future economic risk, this association does not vary with whether activity stems
from MNCs that maintain a government relations department. The results of this analysis suggest that
government relations staff are a channel through which MNCs can either better predict or alter future
political stability in foreign jurisdictions.
6.2 MNCs’ expertise in managing environmental and social risks
Multinationals can also make investments in positive change through community engagement
related to social and environmental factors, enhancing their social license to operate and ultimately
increasing opportunity for growth in the host country (Henisz 2014). To investigate whether expertise in
managing environmental and social risks improves the overall success of the MNC in the host country,
we collect data on MNCs’ ESG risk rating.9 We are able to collect this data only for a sub-sample of firms
covered by RiskMetrics. Also, our access to data on risk ratings are only available through 2014. Thus,
9 See Section 3 for additional details on the construction of this variable.

27
we restrict our sample period to 2003 through 2014 for this test. This reduces our firm-host country-year
observations to 5,666. We identify whether firms have strengths or weaknesses in managing
environmental and social risks. Firms are classified as strong if they have an AAA, AA, or A rating, and
weak if they have a BBB, BB, B, or CCC rating. We expect to find that the benefits of cross-country
relationships are greatest for strong firms.
In Table 9, column (1), we first replicate the findings of Table 5 and document a positive
association between RELATIONSHIPS and CUSTOMER_GROWTH among a sample of firm-host
country-year observations with available ESG data. To test whether MNCs benefit from their
relationships when complementing these activities with environmental and social risk management
strategies, we partition our sample on strong vs. weak ESG ratings and simultaneously estimate equation
(2) across these two subsamples. In Table 9, column (2), the coefficient on RELATIONSHIPS is positive
and significant (coefficient = 0.0479, t = 3.64 p < 0.01). In column (3), we re-estimate equation (2) on the
sample of firms with weak expertise in managing environmental and social risks. We do not find that the
coefficient on RELATIONSHIPS is significant. Further, we find that the coefficient on RELATIONSHIPS
is significantly different across the two sub-samples (F = 3.36, p = 0.07).
Next, we investigate whether MNCs’ ability to successfully manage environmental and social
risks serves to stabilize the host country environment. On one hand, positive interactions with local
businesses, government, and non-government organizations can front-load gains from internationalization
enjoyed by the host country by directly contributing to the quality of host country institutions (Henisz
2014). In contrast, if internationalization activities stem from MNCs that are rated negatively in their
environmental and social advocacy efforts, it is unlikely that their internationalization activities will result
in welfare gains to the host country.
If MNCs can contribute to host country political stability through superior expertise in managing
environmental and social risks, we expect political stability in the host country to improve as the
aggregate activity from MNCs with strong ESG ratings increases. Before splitting relationships between
firms with strong vs. weak ESG ratings, in Panel B, column (1), we first document that the total number

28
of MNC relationships continues to have a negative association with future political risk among the
subsample of observations with available ESG data. In Panel B, columns (2), we then separately
aggregate the total number of local relationships for MNCs with strong ESG ratings (i.e.,
RELATIONSHIPSSTRONG_ESG) and those with weak ESG ratings (i.e., RELATONSHIPSWeak_ESG). In column
(2), we find that the coefficient on RELATIONSHIPSSTRONG_ESG is negative and significant
(coefficient = -0.0252, p =0.02). In contrast, we find no significant association between
RELATIONSHIPSWeak_ESG and future political risk. This evidence is consistent with the notion that
aggregate activity stemming from MNCs with expertise in managing environmental and social risks is
positively associated with future political stability in the host country.
Finally, in Table 9, Panel C, we investigate whether activity stemming from MNCs with strengths
in managing environmental and social risks serves to stabilize future economic risk in the host country.
While MNCs that develop this expertise can positively influence environmental and social policies
(relevant parameters for host country governments), it is unclear whether this resource should have any
direction association with general economic risk. While we observe a negative association between the
total number of MNC relationships and future economic risk in Table 9, Panel C, this association does not
vary with whether the activity stems from MNCs with strong vs. weak ESG ratings. Thus, while MNC
presence can improve general economic conditions in the host country, investments in environmental and
social risk management are relevant for managing and/or influencing facets of political stability,
specifically. Collectively, our evidence suggests that positive externalities stem from the nature of MNC
engagement with local firms, government, and community organizations.
7. Conclusion
In this paper, we investigate whether there is an effectively symbiotic relationship between MNCs
and host country firms that helps mitigate economic loss, particularly in politically unstable jurisdictions.
While it is well known that MNCs often partner with local firms to get a toe-hold in particular countries
and assistance in navigating the local institutions, it is less well known what externalities these

29
relationships generate. We suggest that in addition to providing more stable customer growth, MNCs’
relationships with both their local customers/partners and the local government can actually serve to
dampen the rise of political instability. While many conjecture that MNCs attempt to influence policy in
an exclusively self-serving manner, our work suggests that MNCs appear to influence policy in an
altruistic manner that has positive implications for the local landscape.
Using several unique datasets, we find a positive association between the likelihood of
maintaining a cross-country relationship and the level of host country political risk. This finding is
consistent with MNCs teaming up with local organizations in order to navigate host country political risk.
We predict and find that MNCs that maintain cross-country relationships enjoy greater future customer
growth, particularly during periods of high political risk. However, we also find that the aggregate level
of MNC local-country relationships is associated with lower levels of future political risk. This finding
suggests that these local partnerships help align the MNCs’ interests with those of local businesses and
lead to the adoption of policies/regulations that benefit all economic activity, not just the MNCs’.

30
References
Acemoglu, Daron, and James A. Robinson. Why Nations Fail: The Origins of Power, Prosperity, and
Poverty. Crown Business, 2013.
Agarwal, Sanjeev, and Sridhar N. Ramaswami. “Choice of Foreign Market Entry Mode: Impact of
Ownership, Location and Internalization Factors.” Journal of International Business Studies 23,
no. 1 (1992): 1-27.
Alesina, Alberto, and Dani Rodrik. “Distributive Politics and Economic Growth.” The Quarterly Journal
of Economics 109, no. 2 (1994): 465-490.
Amore, Mario Daniele, and Morten Bennedsen. “The Value of Local Political Connections in a Low-
Corruption Environment.” Journal of Financial Economics 110, no. 2 (2013): 387-402.
Aral, Sinan, Erik Brynjolfsson, and Lynn Wu. “Three-Way Complementarities: Performance Pay, Human
Resource Analytics, and Information Technology.” Management Science 58, no. 5 (2012): 913-
931.
Arora, Ashish. “Testing for Complementarities in Reduced-Form Regressions: A Note.” Economics
Letters 50, no. 1 (1996): 51-55.
Barkema, Harry G., John H. J. Bell, and Johannes M. Pennings. “Foreign Entry, Cultural Barriers, and
Learning.” Strategic Management Journal 17, no. 2 (1996): 151-166.
Barro, Robert J., and Xavier Sala-i-Martin. “Technological Diffusion, Convergence, and Growth.”
National Bureau of Economic Research Working Paper No. 5151 (1995).
Bekaert, Geert, and Campbell R. Harvey. “Time‐Varying World Market Integration.” The Journal of
Finance 50, no. 2 (1995): 403-444.
_______. “Emerging Equity Market Volatility.” Journal of Financial Economics 43, no. 1 (1997): 29-77.
_______. “Foreign Speculators and Emerging Equity Markets.” The Journal of Finance 55, no. 2 (2000):
565-613.
_______. “Research in Emerging Markets Finance: Looking to the Future.” Emerging Markets Review 3,
no. 4 (2002): 429-448.
_______. “Emerging Markets Finance.” Journal of Empirical Finance 10, no. 1 (2003): 3-55.
Bekaert, Geert, Campbell R. Harvey, and Christian Lundblad. “Emerging Equity Markets and Economic
Development.” Journal of Development Economics 66, no. 2 (2001): 465-504.
Blomström, Magnus, and Ari Kokko. “Multinational Corporations and Spillovers.” Journal of Economic
Surveys 12, no. 3 (1998): 247-277.
Boddewyn, Jean J., and Thomas L. Brewer. “International-Business Political Behavior: New Theoretical
Directions.” Academy of Management Review 19, no. 1 (1994): 119-143.
Bremmer, Ian. “Managing Risk in an Unstable World.” Harvard Business Review 83, no. 6 (2005): 51-60.
Chaney, Paul K., Mara Faccio, and David Parsley. “The Quality of Accounting Information in Politically
Connected Firms.” Journal of Accounting and Economics 51, no. 1 (2011): 58-76.

31
Davidson, William H. “The Location of Foreign Direct Investment Activity: Country Characteristics and
Experience Effects.” Journal of International Business Studies 11, no. 2 (1980): 9-22.
Delios, Andrew, and Witold J. Henisz. “Political Hazards, Experience, and Sequential Entry Strategies:
The International Expansion of Japanese Firms, 1980–1998.” Strategic Management Journal 24,
no. 11 (2003): 1153-1164.
Faccio, Mara. “Politically Connected Firms.” The American Economic Review 96, no. 1 (2006): 369-386.
Faccio, Mara, Ronald W. Masulis, and John McConnell. “Political Connections and Corporate
Bailouts.” The Journal of Finance 61, no. 6 (2006): 2597-2635.
Ferreira, M. A., M. Massa, and P. Matos. “Shareholders at the Gate? Institutional Investors and Cross-
Border Mergers and Acquisitions.” Review of Financial Studies 23, no. 2 (2010), 601-644.
Fowler, James H. "Elections and markets: The effect of partisanship, policy risk, and electoral margins on the economy." The Journal of Politics 68, no. 1 (2006): 89-103.
Füss, Roland, and Michael M. Bechtel. "Partisan politics and stock market performance: The effect of
expected government partisanship on stock returns in the 2002 German federal election." Public
Choice 135, no. 3-4 (2008): 131-150.
Goodell, John W., and Sami Vähämaa. "US presidential elections and implied volatility: The role of
political uncertainty." Journal of Banking & Finance 37, no. 3 (2013): 1108-1117.
Grabner, Isabella, and Frank Moers. “Management Control as a System or a Package? Conceptual and
Empirical Issues.” Accounting, Organizations and Society 38, no. 6 (2013): 407-419.
Gulen, Huseyin, and Mihai Ion. “Policy Uncertainty and Corporate Investment.” The Review of Financial
Studies 29, no. 3 (2015): 523-564.
Hassett, Kevin A., and Gilbert E. Metcalf. “Investment with Uncertain Tax Policy: Does Random Tax
Policy Discourage Investment?” The Economic Journal 109, no. 457 (1999): 372-393.
Hendricks, Bradley E., Jed J. Neilson, Catherine Shakespeare, and Christopher D. Williams. “Responding
to Regulatory Uncertainty: Evidence from Basel III.” University of North Carolina and
University of Michigan Working Paper (2016).
Henisz, Witold J. “The Institutional Environment for Economic Growth.” Economics & Politics 12, no. 1
(2000): 1-31.
_____. Corporate Diplomacy: Building Reputations and Relationships with External Stakeholders.
Sheffield: Greenleaf Publishing, 2014.
Henisz, Witold J., and Jeffrey T. Macher. “Firm- and Country-Level Trade-Offs and Contingencies in the
Evaluation of Foreign Investment: The Semiconductor Industry, 1994–2002.” Organization
Science 15, no. 5 (2004): 537-554.
Henisz, Witold J., and Oliver E. Williamson. “Comparative Economic Organization—Within and
between Countries.” Business and Politics 1, no. 3 (1999): 261-277.
Henisz, W. J., and B. A. Zelner. “Explicating Political Hazards and Safeguards: A Transaction Cost
Politics Approach.” Industrial and Corporate Change 13 no. 6 (2004): 901-915.

32
Hiatt, Shon R., and Wesley D. Sine. “Clear and Present Danger: Planning and New Venture Survival
amid Political and Civil Violence.” Strategic Management Journal 35, no. 5 (2014): 773-785.
Hillman, Amy J., and Michael A. Hitt. “Corporate Political Strategy Formulation: A Model of Approach,
Participation, and Strategy Decisions.” Academy of Management Review 24, no. 4 (1999): 825-
842.
Javorcik, Beata Smarzynska. “The Composition of Foreign Direct Investment and Protection of
Intellectual Property Rights: Evidence from Transition Economies.” European Economic
Review 48, no. 1 (2004): 39-62.
Julio, Brandon, and Youngsuk Yook. “Political Uncertainty and Corporate Investment Cycles.” The
Journal of Finance 67, no. 1 (2012): 45-83.
King, Robert G., and Ross Levine. “Finance and Growth: Schumpeter Might Be Right.” The Quarterly
Journal of Economics 108, no. 3 (1993): 717-737.
La Porta, Rafael, Florencio Lopez-de-Silanes, Andrei Shleifer, and Robert W. Vishny. "Law and
finance." Journal of political economy 106, no. 6 (1998): 1113-1155.
La Porta, Rafael, Florencio Lopez-de-Silanes, and Andrei Shleifer. "The economic consequences of legal
origins." Journal of economic literature 46, no. 2 (2008): 285-332.
La Porta, Rafael, Florencio Lopez-de-Silanes, Andrei Shleifer, and Robert Vishny. "The quality of
government." The Journal of Law, Economics, and Organization 15, no. 1 (1999): 222-279.
Levine, Ross, and Sara Zervos. “Stock Markets, Banks, and Economic Growth.” American Economic
Review (1998): 537-558.
Martynova, M., and L. Renneboog. 2008. “Spillovers of Corporate Governance Standards in Cross-
Border Mergers and Acquisitions.” Journal of Corporate Finance 14, no. 3 (2008): 200-223.
McDonald, Robert, and Daniel Siegel. “The Value of Waiting to Invest.” The Quarterly Journal of
Economics 101, no. 4 (1986): 707-727.
Milgrom, Paul, and John Roberts. “Complementarities and Fit Strategy, Structure, and Organizational
Change in Manufacturing.” Journal of Accounting and Economics 19, no. 2 (1995): 179-208.
Opp, Marcus M. “Expropriation Risk and Technology.” Journal of Financial Economics 103, no. 1
(2012): 113-129.
Pástor, Ľuboš, and Pietro Veronesi. “Political Uncertainty and Risk Premia.” Journal of Financial
Economics 110, no. 3 (2013): 520-545.
Petersen, Mitchell A. “Estimating Standard Errors in Finance Panel Data Sets: Comparing
Approaches.” The Review of Financial Studies 22, no. 1 (2009): 435-480.
Phillips-Patrick, Frederick J. “Political Risk and Organizational Form.” The Journal of Law and
Economics 34, no. 2, Part 2 (1991): 675-693.
Pindyck, Robert S., and Andres Solimano. “Economic Instability and Aggregate Investment.” NBER
Macroeconomics Annual 8 (1993): 259-303.

33
Reza, Syed Walid, Alexei V. Ovtchinnikov, and Yanhui Wu. “Political Activism and Firm Innovation.”
Working paper (2016).
Rodrik, Dani. “Policy Uncertainty and Private Investment in Developing Countries.” Journal of
Development Economics 36, no. 2 (1991): 229-242.
Shleifer, Andrei, and Robert W. Vishny. “Politicians and Firms.” The Quarterly Journal of
Economics 109, no. 4 (1994): 995-1025.
Wellman, Laura A. “Mitigating Political Uncertainty.” Review of Accounting Studies 22, no. 1 (2017):
217-250.
Wright, John R. Interest Groups and Congress: Lobbying, Contributions, and Influence. Allyn & Bacon,
1996.

34
Appendix A
Variable Definitions
Variable Name Variable Description
Variables of Interest
CUSTOMER_GROWTH Customer growth is calculated based on the four-
year geometric average of annual growth rate in
customer base from time t to t+3 for firm i in
country k. Customers are entities to which the
source company sells products/services. Available
from Factset.
RELATIONSHIPExternal_Contract The total number of manufacturing, marketing,
distribution, and supplier relationships between
the source company domiciled outside of the host
country and firms domiciled within the host
country, measured at the end of year t. Available
from Factset.
RELATIONSHIPStrategic_Partnership The total number of relationships between the
source company domiciled outside of the host
country and firms domiciled within the host
country that are represented by equity
investments, integrated product offerings, joint
ventures, research collaborations, and
technological collaborations, measured at the end
of year t. Available from Factset.
GOV_RELATIONS GOV_RELATIONS is an indicator variable equal
to 1 if firm i has any government relations staff in
year t; 0 otherwise. Collected from an annual
publication of Representatives by Columbia
Books & Information Services.
STRONG_ESG STRONG_ESG is an indicator variable equal to 1
if firm i receives an ESG rating of "AAA", "AA",
or "A"; 0 otherwise. Ratings are are available
through MSCI ESG risk ratings.
POLITICAL_RISK An annual index accounting for government
stability, socioeconomic conditions, investment
risk, risk of internal conflict, risk of external
conflict, corruption, the presence of the military in
politics, religious tensions, ethnic tensions,
democratic accountability and bureaucracy
quality. The original index ranges from 0-100. We
subtract the original index from 100 so larger
values correspond to higher political stability.
Available from the International Country Risk
Guide.
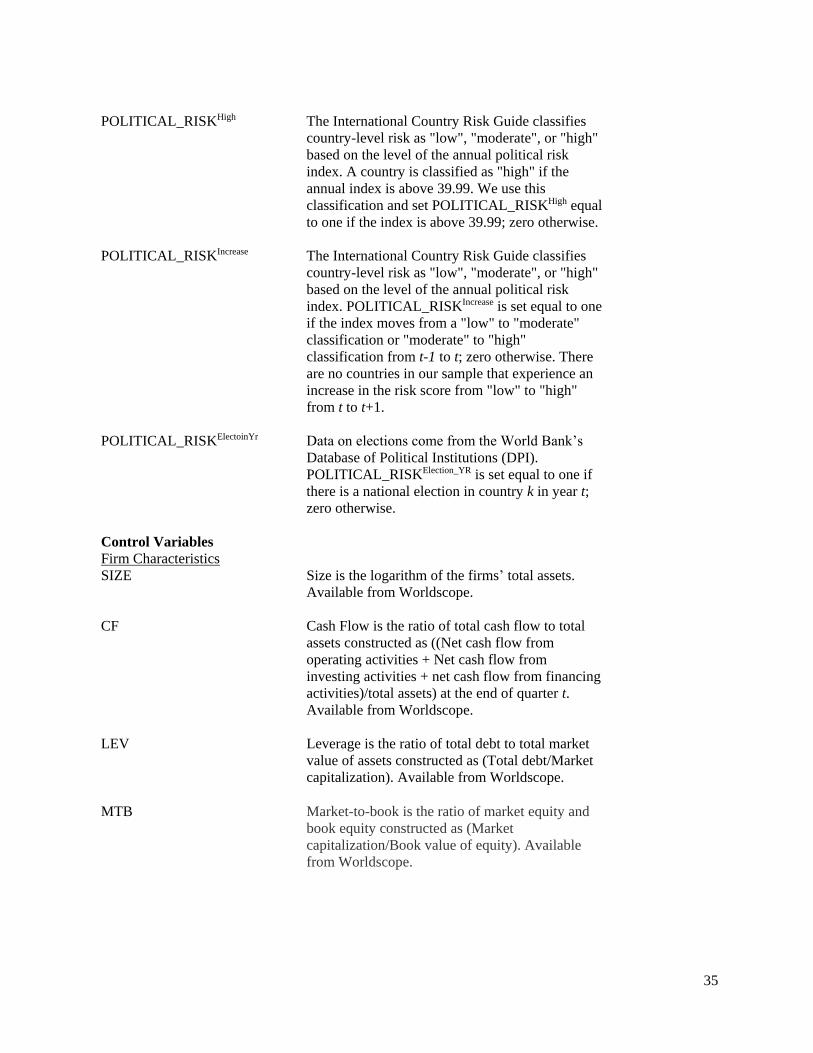
35
POLITICAL_RISKHigh The International Country Risk Guide classifies
country-level risk as "low", "moderate", or "high"
based on the level of the annual political risk
index. A country is classified as "high" if the
annual index is above 39.99. We use this
classification and set POLITICAL_RISKHigh equal
to one if the index is above 39.99; zero otherwise.
POLITICAL_RISKIncrease The International Country Risk Guide classifies
country-level risk as "low", "moderate", or "high"
based on the level of the annual political risk
index. POLITICAL_RISKIncrease is set equal to one
if the index moves from a "low" to "moderate"
classification or "moderate" to "high"
classification from t-1 to t; zero otherwise. There
are no countries in our sample that experience an
increase in the risk score from "low" to "high"
from t to t+1.
POLITICAL_RISKElectoinYr Data on elections come from the World Bank’s
Database of Political Institutions (DPI).
POLITICAL_RISKElection_YR is set equal to one if
there is a national election in country k in year t;
zero otherwise.
Control Variables
Firm Characteristics
SIZE Size is the logarithm of the firms’ total assets.
Available from Worldscope.
CF Cash Flow is the ratio of total cash flow to total
assets constructed as ((Net cash flow from
operating activities + Net cash flow from
investing activities + net cash flow from financing
activities)/total assets) at the end of quarter t.
Available from Worldscope.
LEV Leverage is the ratio of total debt to total market
value of assets constructed as (Total debt/Market
capitalization). Available from Worldscope.
MTB Market-to-book is the ratio of market equity and
book equity constructed as (Market
capitalization/Book value of equity). Available
from Worldscope.
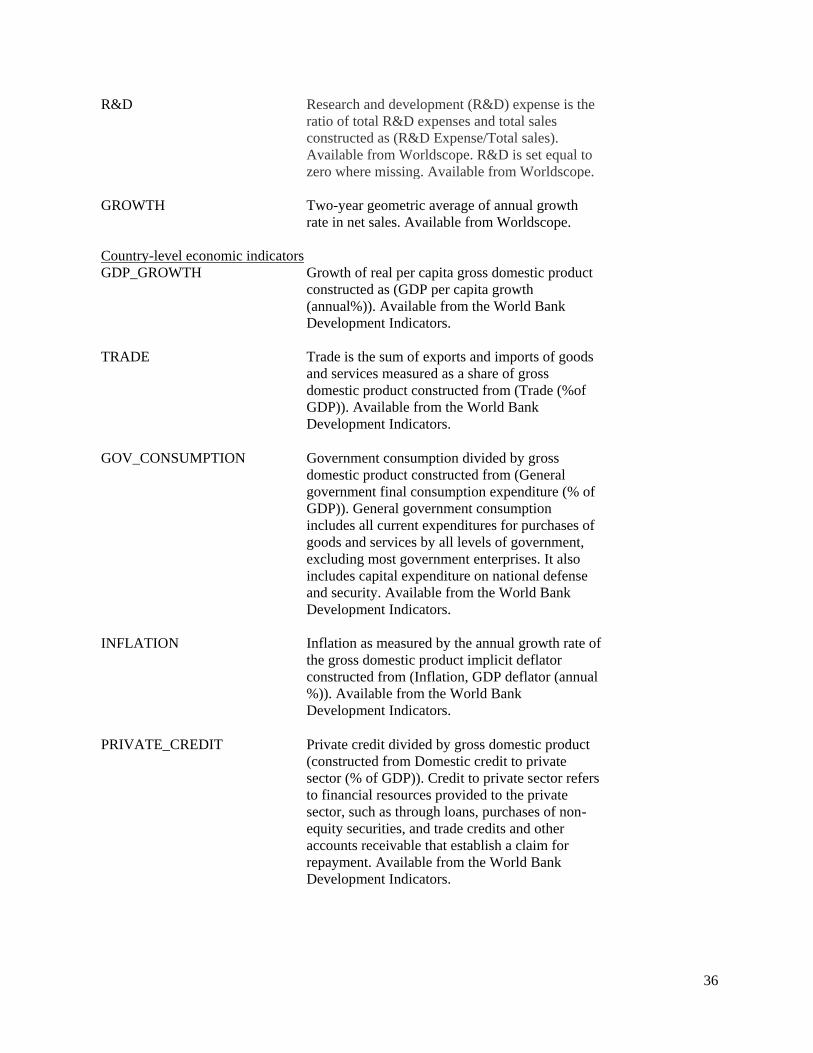
36
R&D Research and development (R&D) expense is the
ratio of total R&D expenses and total sales
constructed as (R&D Expense/Total sales).
Available from Worldscope. R&D is set equal to
zero where missing. Available from Worldscope.
GROWTH Two-year geometric average of annual growth
rate in net sales. Available from Worldscope.
Country-level economic indicators
GDP_GROWTH Growth of real per capita gross domestic product
constructed as (GDP per capita growth
(annual%)). Available from the World Bank
Development Indicators.
TRADE Trade is the sum of exports and imports of goods
and services measured as a share of gross
domestic product constructed from (Trade (%of
GDP)). Available from the World Bank
Development Indicators.
GOV_CONSUMPTION Government consumption divided by gross
domestic product constructed from (General
government final consumption expenditure (% of
GDP)). General government consumption
includes all current expenditures for purchases of
goods and services by all levels of government,
excluding most government enterprises. It also
includes capital expenditure on national defense
and security. Available from the World Bank
Development Indicators.
INFLATION Inflation as measured by the annual growth rate of
the gross domestic product implicit deflator
constructed from (Inflation, GDP deflator (annual
%)). Available from the World Bank
Development Indicators.
PRIVATE_CREDIT Private credit divided by gross domestic product
(constructed from Domestic credit to private
sector (% of GDP)). Credit to private sector refers
to financial resources provided to the private
sector, such as through loans, purchases of non-
equity securities, and trade credits and other
accounts receivable that establish a claim for
repayment. Available from the World Bank
Development Indicators.

37
MARKET_CAP Equity market capitalization divided by gross
domestic product constructed from (Market
capitalization of listed domestic companies (% of
GDP)). Available from the World Bank
Development Indicators.
NUM_COMPANIES The log of the number of domestic companies
covered constructed from (Listed domestic
companies, total). Available from the World Bank
Development Indicators.
TURNOVER The ratio of equity market value traded to the
market capitalization constructed from (Stocks
traded, turnover ratio of domestic shares).
Available from the World Bank Development
Indicators.
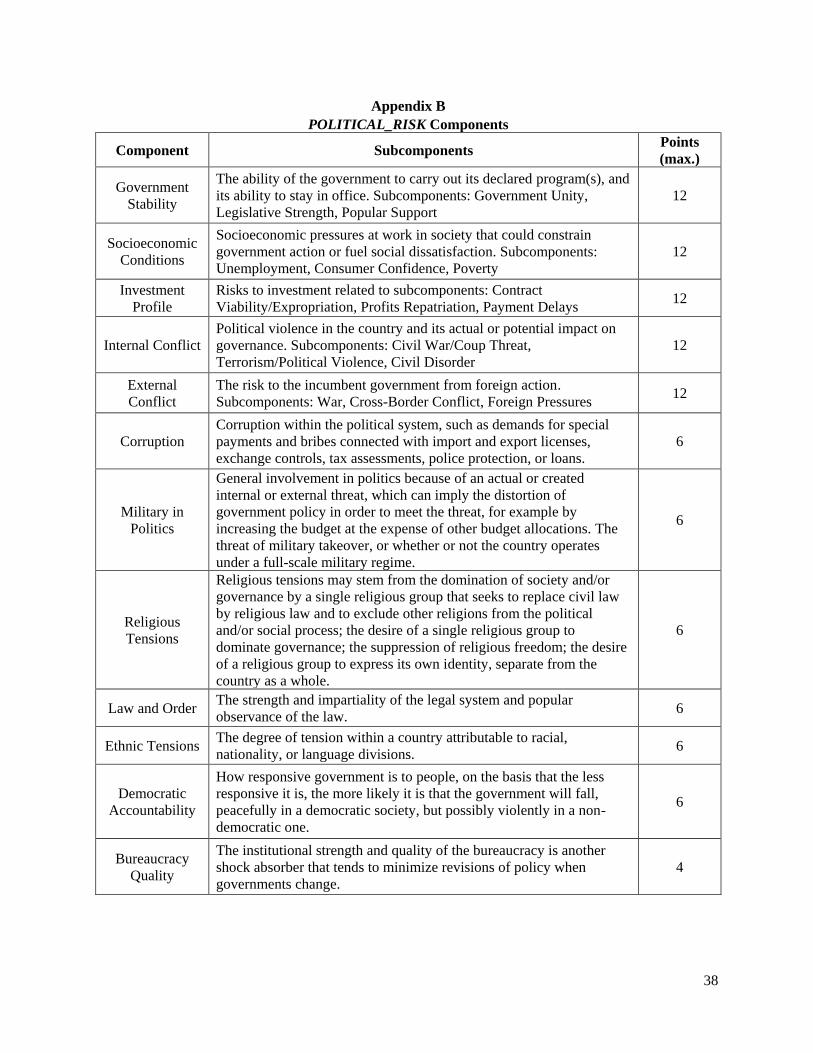
38
Appendix B
POLITICAL_RISK Components
Component Subcomponents Points
(max.)
Government
Stability
The ability of the government to carry out its declared program(s), and
its ability to stay in office. Subcomponents: Government Unity,
Legislative Strength, Popular Support
12
Socioeconomic
Conditions
Socioeconomic pressures at work in society that could constrain
government action or fuel social dissatisfaction. Subcomponents:
Unemployment, Consumer Confidence, Poverty
12
Investment
Profile
Risks to investment related to subcomponents: Contract
Viability/Expropriation, Profits Repatriation, Payment Delays 12
Internal Conflict
Political violence in the country and its actual or potential impact on
governance. Subcomponents: Civil War/Coup Threat,
Terrorism/Political Violence, Civil Disorder
12
External
Conflict
The risk to the incumbent government from foreign action.
Subcomponents: War, Cross-Border Conflict, Foreign Pressures 12
Corruption
Corruption within the political system, such as demands for special
payments and bribes connected with import and export licenses,
exchange controls, tax assessments, police protection, or loans.
6
Military in
Politics
General involvement in politics because of an actual or created
internal or external threat, which can imply the distortion of
government policy in order to meet the threat, for example by
increasing the budget at the expense of other budget allocations. The
threat of military takeover, or whether or not the country operates
under a full-scale military regime.
6
Religious
Tensions
Religious tensions may stem from the domination of society and/or
governance by a single religious group that seeks to replace civil law
by religious law and to exclude other religions from the political
and/or social process; the desire of a single religious group to
dominate governance; the suppression of religious freedom; the desire
of a religious group to express its own identity, separate from the
country as a whole.
6
Law and Order The strength and impartiality of the legal system and popular
observance of the law. 6
Ethnic Tensions The degree of tension within a country attributable to racial,
nationality, or language divisions. 6
Democratic
Accountability
How responsive government is to people, on the basis that the less
responsive it is, the more likely it is that the government will fall,
peacefully in a democratic society, but possibly violently in a non-
democratic one.
6
Bureaucracy
Quality
The institutional strength and quality of the bureaucracy is another
shock absorber that tends to minimize revisions of policy when
governments change.
4

39
Appendix C
Relationships
Relationship Category Relationship Type Definition
External Contract
Supplier
Supplier relationships occur when the source
company purchases goods or services from
other entities.
Manufacturing
Manufacturing relationships occur when other
entities provide paid manufacturing services to
the source company.
Marketing
Marketing relationships occur when other
entities provide paid marketing and/or
branding/advertising services to the source
company.
Distribution
Distribution relationships occur when the source
company pays other entities to distribute the
source company’s product/services.
Strategic Partnership
Integrated Product Offering
Integrated product offerings occur when the
source company and another entity agree to
bundle their standalone products/services,
which are marketed together as one offering. No
money is exchanged up front, and costs, risks,
and profits are shared.
Research Collaboration
Research collaborations occur when entities in
the host country collaborate with the source
company for research and development,
generally for new product development.
Research collaboration is common for products
in development, not products already marketed.
Technology Collaboration
Technology collaborations occur when entities
in the host country collaborate with the source
company for technology development, generally
for new product development. Technology
collaboration is common for products in
development, not products already marketed.
Equity Interest
Equity investments occur when the source
company owns an equity stake in another entity.
This designation applies only when the source
company owns a share equity stake in another
company. Working interests, royalties, property,
or well claims do not qualify for the equity
investment designation.
Joint Ventures
Joint ventures occur when the source company
jointly owns a separate company with one or
more companies.

40
Appendix D
Environmental, Social, and Governance Ratings
Category Subcategory Definition
Environment
Climate Change
Carbon Emissions, Energy Efficiency Product,
Carbon Footprint, Financing Environmental
Impact, Climate Change Vulnerability
Natural Resources Water Stress, Biodiversity & Land Use, Raw
Material Sourcing
Pollution & Waste Toxic Emissions, Packaging Material, and
Electronic Waste
Environmental Opportunities Opportunities in Clean Tech, Green Building,
and Renewable Energy
Social
Human Capital
Labor Management, Health & Safety, Human
Capital Development, Supply Chain Labor
Standards
Product Liability
Product, Chemical, and Financial Product Safety;
Privacy & Data Security; Responsible
Investment; Health & Demographic Risk
Stakeholder Opposition Controversial Sourcing
Social Opportunities Access to Communications, Finance, Health
Care, Opportunities in Nutrition & Health
Governance
Corporate Governance Board, Pay, Ownership, Accounting
Corporate Behavior
Business Ethics, Anti-Competitive Practices,
Corruption & Instability, Financial System
Instability
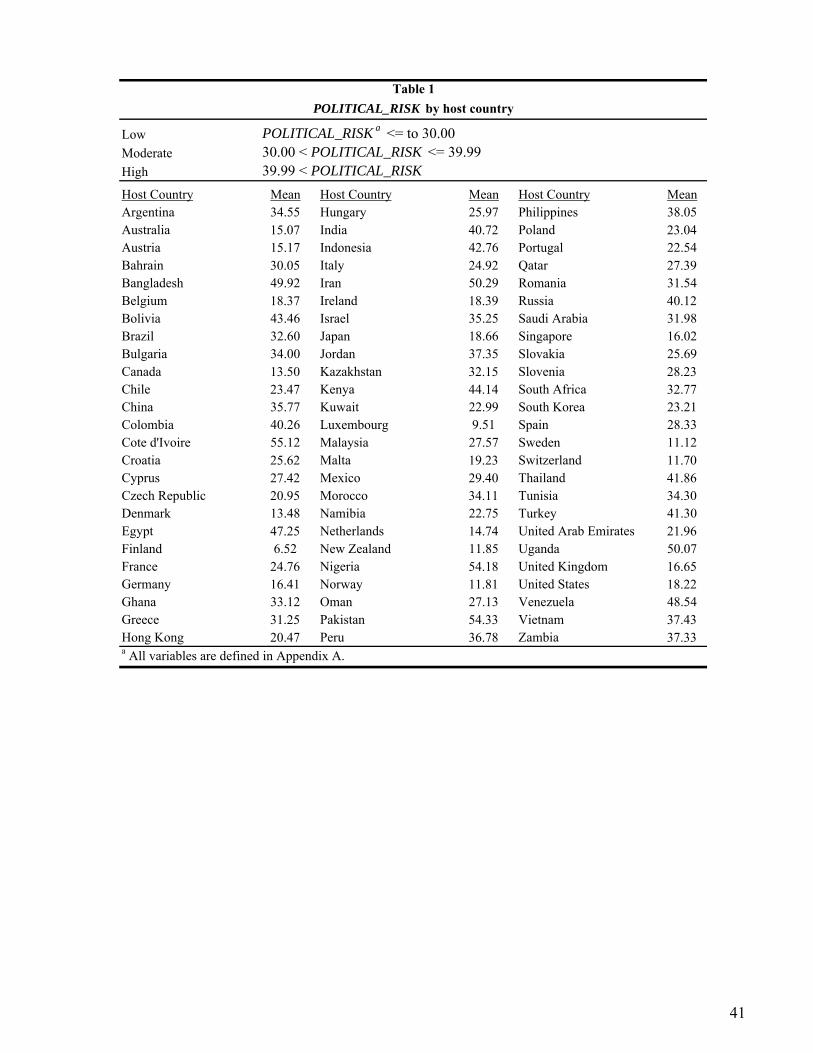
Low POLITICAL_RISK a <= to 30.00Moderate 30.00 < POLITICAL_RISK <= 39.99High 39.99 < POLITICAL_RISK
Host Country Mean Host Country Mean Host Country MeanArgentina 34.55 Hungary 25.97 Philippines 38.05Australia 15.07 India 40.72 Poland 23.04Austria 15.17 Indonesia 42.76 Portugal 22.54Bahrain 30.05 Italy 24.92 Qatar 27.39Bangladesh 49.92 Iran 50.29 Romania 31.54Belgium 18.37 Ireland 18.39 Russia 40.12Bolivia 43.46 Israel 35.25 Saudi Arabia 31.98Brazil 32.60 Japan 18.66 Singapore 16.02Bulgaria 34.00 Jordan 37.35 Slovakia 25.69Canada 13.50 Kazakhstan 32.15 Slovenia 28.23Chile 23.47 Kenya 44.14 South Africa 32.77China 35.77 Kuwait 22.99 South Korea 23.21Colombia 40.26 Luxembourg 9.51 Spain 28.33Cote d'Ivoire 55.12 Malaysia 27.57 Sweden 11.12Croatia 25.62 Malta 19.23 Switzerland 11.70Cyprus 27.42 Mexico 29.40 Thailand 41.86Czech Republic 20.95 Morocco 34.11 Tunisia 34.30Denmark 13.48 Namibia 22.75 Turkey 41.30Egypt 47.25 Netherlands 14.74 United Arab Emirates 21.96Finland 6.52 New Zealand 11.85 Uganda 50.07France 24.76 Nigeria 54.18 United Kingdom 16.65Germany 16.41 Norway 11.81 United States 18.22Ghana 33.12 Oman 27.13 Venezuela 48.54Greece 31.25 Pakistan 54.33 Vietnam 37.43Hong Kong 20.47 Peru 36.78 Zambia 37.33
Table 1
POLITICAL_RISK by host country
a All variables are defined in Appendix A.
41

Country % of Sample Country % of Sample
Argentina 0.04 Kuwait 0.11Australia 0.13 Lithuania 0.01Austria 0.08 Luxembourg 0.13Bahamas 0.20 Macau 0.01Bahrain 0.02 Malaysia 0.05
Belgium 0.20 Marshall Islands 0.03
Bermuda 1.13 Mexico 0.32
Brazil 1.07 Morocco 0.01
British Virgin Islands 0.02 Netherlands Antilles 0.01
Bulgaria 0.02 Netherlands Antilles 0.77
Canada 4.17 New Zealand 0.01
Cayman Islands 0.13 Norway 0.17
Chile 0.82 Oman 0.14
China 0.92 Peru 0.27
Colombia 0.01 Poland 0.18
Croatia 0.04 Qatar 0.02
Curacao 0.01 Russia 0.16
Czech Republic 0.02 Saudi Arabia 0.09
Denmark 0.04 Serbia 0.04
Finland 0.12 Singapore 0.38
France 1.89 Slovenia 0.02
Germany 2.10 South Africa 0.06Gibraltar 0.01 South Korea 0.31Greece 0.75 Spain 0.46Guernsey 0.03 Sweden 1.17Hong Kong 0.42 Switzerland 1.53Iceland 0.03 Taiwan 0.24India 0.09 Turkey 0.75Indonesia 0.52 United Arab Emirates 0.06Ireland 0.16 United Kingdom 3.76Israel 4.16 United States 68.12Italy 0.85 Uruguay 0.02Japan 0.23 Venezuela 0.05Jersey 0.10 Other 0.03
Table 2Distribution of MNCs based on location of MNC headquarters
42

Unique MNCs 4,064Unique host-countries where relationships are formed 75Unique business relationships
External Contracts 18,777Strategic Partnerhsips 15,278
Variablea Mean Std Dev p25 Median p75 p99
RELATIONSHIPS 0.62 2.07 0.00 0.00 0.00 10.00
RELATIONSHIPS External_Contract 0.34 1.29 0.00 0.00 0.00 5.00
RELATIONSHIPS Strategic_Partnership 0.28 1.14 0.00 0.00 0.00 5.00
SIZE 20.19 1.98 18.81 20.17 21.62 24.31LEV 37.99 625.47 0.00 0.12 0.46 252.92MTB 2.64 3.31 1.06 1.98 3.42 16.78R&D 0.12 0.27 0.00 0.04 0.16 1.53CF 0.25 0.22 0.07 0.19 0.39 0.87GROWTH 0.14 0.57 -0.03 0.07 0.20 1.64POLITICAL_RISK 20.40 7.73 14.96 18.33 22.96 42.37GDP_GROWTH 1.49 2.71 0.10 1.45 2.42 9.95TRADE 81.52 75.38 41.24 59.10 89.76 447.06GOV_CONSUMPTION 18.11 4.26 15.17 18.71 20.25 26.45INFLATION 1.94 3.16 0.40 1.54 2.48 15.58PRIVATE_CREDIT 124.78 45.63 94.71 118.62 169.19 221.29MARKET_CAP 104.36 130.69 51.59 78.51 115.56 1076.94NUMBER_COMPANIES 1531.13 1431.05 285.00 742.00 2323.00 5294.00TURNOVER 96.66 62.30 56.57 84.10 125.11 377.25
Table 3Descriptive Statistics for Firm-level Analysis
Panel A: Distribution of Model Variables, 2003 - 2016 (n = 41,977)
Panel A: Sample Composition
43

All External StrategicRelationships Contracts Partnerships
Variable a,b(1) (2) (3)
Firm-level Characteristics
SIZE 0.0335*** 0.0123*** 0.0272***(13.26) (7.63) (14.20)
LEV -0.0000 -0.0000 -0.0000(-1.46) (-1.38) (-0.05)
MTB 0.0007 -0.0005 0.0014**(0.84) (-0.62) (2.40)
R&D 0.1103*** 0.0008 0.1160***(9.38) (0.08) (10.43)
CF 0.1217*** 0.0591*** 0.0794***(7.86) (4.47) (6.26)
GROWTH 0.0035 0.0040 -0.0011(0.75) (0.91) (-0.36)
Host-Country CharacteristicsPOLITICAL_RISK 0.0051** 0.0035** 0.0036***
(2.55) (2.34) (2.65)GDP_GROWTH -0.0010 0.0005 -0.0016
(-0.50) (0.29) (-1.06)TRADE 0.0005 0.0003 0.0003
(1.35) (1.01) (1.20)GOV_CONSUMPTION -0.0001 0.0013 0.0008
(-0.01) (0.29) (0.16)INFLATION -0.0030*** -0.0014* -0.0022***
(-2.76) (-1.87) (-3.00)PRIVATE_CREDIT -0.0001 -0.0000 -0.0003
(-0.54) (-0.06) (-1.46)MARKET_CAP 0.0000 0.0000 0.0000
(0.15) (0.35) (0.55)NUMBER_COMPANIES 0.0001* 0.0000 0.0001*
(1.65) (1.15) (1.93)TURNOVER -0.0000 -0.0001 0.0001
(-0.01) (-1.19) (0.67)Intercept - - -Home Country x Host Country Indicator Y Y YHost Country x Industry Indicator Y Y YYear Indicator Y Y YCluster by Host Country and Year Y Y YAdjusted R2 40.74% 33.81% 34.21%N 41,977 41,977 41,977
Table 4Determinants of maintaining local relationships
Dep. Var. = Ln (RELATIONSHIPS)
44

External StrategicContracts Partnership
Variable a,b(1) (2) (3) (4) (5)
Ln(RELATIONSHIPS) 0.0140** 0.0449*** 0.0213*** -0.0038 0.0350***(2.13) (5.41) (3.34) (-0.51) (3.19)
SIZE 0.0108*** 0.0253*** 0.0111*** 0.0113*** 0.0103***(5.42) (2.75) (5.21) (5.69) (5.17)
LEV 0.0000 0.0001*** 0.0000 0.0000 0.0000(1.20) (2.70) (1.05) (1.18) (1.17)
MTB 0.0028*** 0.0006 0.0024*** 0.0028*** 0.0027***(3.42) (0.60) (2.59) (3.43) (3.37)
R&D -0.0246* -0.0320 -0.0240 -0.0230* -0.0271**(-1.85) (-1.61) (-1.54) (-1.73) (-2.06)
CF 0.0459*** 0.0644** 0.0394** 0.0478*** 0.0448***(2.99) (2.57) (2.41) (3.09) (2.94)
GROWTH 0.0211*** 0.0139*** 0.0210*** 0.0212*** 0.0212***(4.60) (2.76) (4.10) (4.60) (4.63)
POLITICAL_RISK -0.0043* -0.0041* -0.0042* -0.0043*(-1.86) (-1.96) (-1.82) (-1.87)
GDP_GROWTH 0.0030 0.0019 0.0030 0.0031(1.21) (0.87) (1.21) (1.23)
TRADE -0.0006 -0.0004 -0.0005 -0.0006(-1.42) (-1.25) (-1.41) (-1.43)
GOV_CONSUMPTION 0.0042 0.0052 0.0041 0.0041(0.78) (1.00) (0.78) (0.77)
INFLATION 0.0008 -0.0004 0.0007 0.0008(0.55) (-0.32) (0.52) (0.58)
PRIVATE_CREDIT 0.0001 0.0003 0.0001 0.0001(0.46) (0.85) (0.47) (0.48)
MARKET_CAP -0.0001 -0.0001 -0.0001 -0.0002(-1.51) (-1.47) (-1.51) (-1.52)
NUMBER_COMPANIES 0.0000 0.0000 0.0000 0.000(0.37) (1.05) (0.41) (0.34)
TURNOVER -0.0002 -0.0001 -0.0002 -0.0002(-1.51) (-0.61) (-1.52) (-1.52)
Intercept - - - - -
Home Country x Host Country Indicator Y Y Y Y YHost Country x Industry Indicator Y N N Y YFirm Indicator N Y N N NYear Indicator Y Y N Y YHost Country x Industry x Year Indicator N N Y N NCluster by Country and Year Y Y Y Y YAdj. R-squared 19.18% 39.78% 34.34% 19.16% 19.20%N 41,977 41,977 52,225 41,977 41,977
AllRelationships
Dep. Var = CUSTOMER_GROWTHt,t+3
Table 5Local relationships and growth in host country customer basePanel A: Cross-country relationships and future customer growth
45
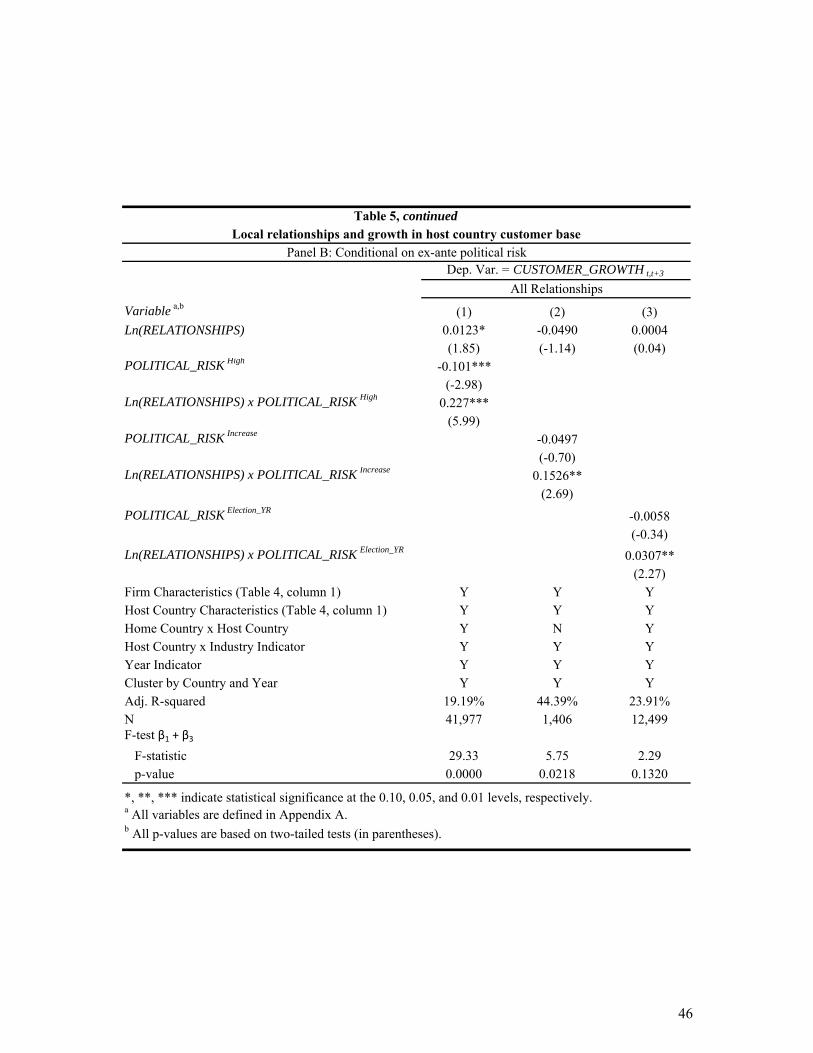
Variable a,b(1) (2) (3)
Ln(RELATIONSHIPS) 0.0123* -0.0490 0.0004(1.85) (-1.14) (0.04)
POLITICAL_RISK High-0.101***
(-2.98)Ln(RELATIONSHIPS) x POLITICAL_RISK High
0.227***(5.99)
POLITICAL_RISK Increase-0.0497(-0.70)
Ln(RELATIONSHIPS) x POLITICAL_RISK Increase0.1526**
(2.69)
POLITICAL_RISK Election_YR-0.0058(-0.34)
Ln(RELATIONSHIPS) x POLITICAL_RISK Election_YR0.0307**
(2.27)Firm Characteristics (Table 4, column 1) Y Y YHost Country Characteristics (Table 4, column 1) Y Y YHome Country x Host Country Y N YHost Country x Industry Indicator Y Y YYear Indicator Y Y YCluster by Country and Year Y Y YAdj. R-squared 19.19% 44.39% 23.91%N 41,977 1,406 12,499F-test β1 + β3
F-statistic 29.33 5.75 2.29p-value 0.0000 0.0218 0.1320
*, **, *** indicate statistical significance at the 0.10, 0.05, and 0.01 levels, respectively.a All variables are defined in Appendix A.
Table 5, continued
b All p-values are based on two-tailed tests (in parentheses).
Local relationships and growth in host country customer basePanel B: Conditional on ex-ante political risk
Dep. Var. = CUSTOMER_GROWTH t,t+3
All Relationships
46

Variable a,b(1) (2)
Ln(RELATIONSHIPS Other_Foreign ) -0.0009 -0.0029(-0.23) (-0.72)
Ln(RELATIONSHIPS) 0.0151**(2.13)
Firm Characteristics (Table 4, column 1) Y YHost Country Characteristics (Table 4, column 1) Y YHome Country x Host Country Indicator Y YHost Country x Industry Indicator Y YYear Indicator Y YCluster by Country and Year Y YAdj. R-squared 19.16% 19.18%N 41,977 41,977
*, **, *** indicate statistical significance at the 0.10, 0.05, and 0.01 levels, respectively.a All variables are defined in Appendix A.
Dep. Var. = CUSTOMER_GROWTH t,t+3
Table 6Falsification test: MNCs' other foreign relationshiops and host country customer growth
b All p-values are based on two-tailed tests (in parentheses).
47

All External StrategicRelationships Contracts Partnership
Variable a,b(1) (2) (3)
RELATIONSHIPS Aggregate-0.0014** -0.0016** -0.0047
(-2.39) (-2.33) (-1.62)POLITICAL_RISK 0.3751*** 0.3754*** 0.3783***
(9.87) (9.88) (9.97)GDP_GROWTH -0.1908*** -0.1905*** -0.1907***
(-5.55) (-5.54) (-5.52)TRADE 0.0023 0.0025 0.0020
(0.45) (0.49) (0.39)GOV_CONSUMPTION 0.0246 0.0247 0.0350
(0.34) (0.34) (0.48)INFLATION -0.0125 -0.0126 -0.0127
(-1.27) (-1.28) (-1.27)PRIVATE_CREDIT 0.0308*** 0.0309*** 0.0305***
(4.29) (4.29) (4.22)MARKET_CAP -0.0025 -0.0025 -0.0025
(-1.26) (-1.27) (-1.26)NUMBER_COMPANIES 0.0000 -0.0000 0.0001
(0.02) (-0.00) (0.24)TURNOVER 0.0015 0.0013 0.0023
(0.41) (0.35) (0.63)Intercept - - -
Host Country Indicator Y Y YYear Indicator Y Y YCluster by Country and Year Y Y YAdj. R-squared 97.13% 97.13% 97.12%N 651 651 651
Table 7Host country political risk
Panel A: Local relationships and future political risk at t +1
Dep. Var. = POLITICAL_RISK t+1
48
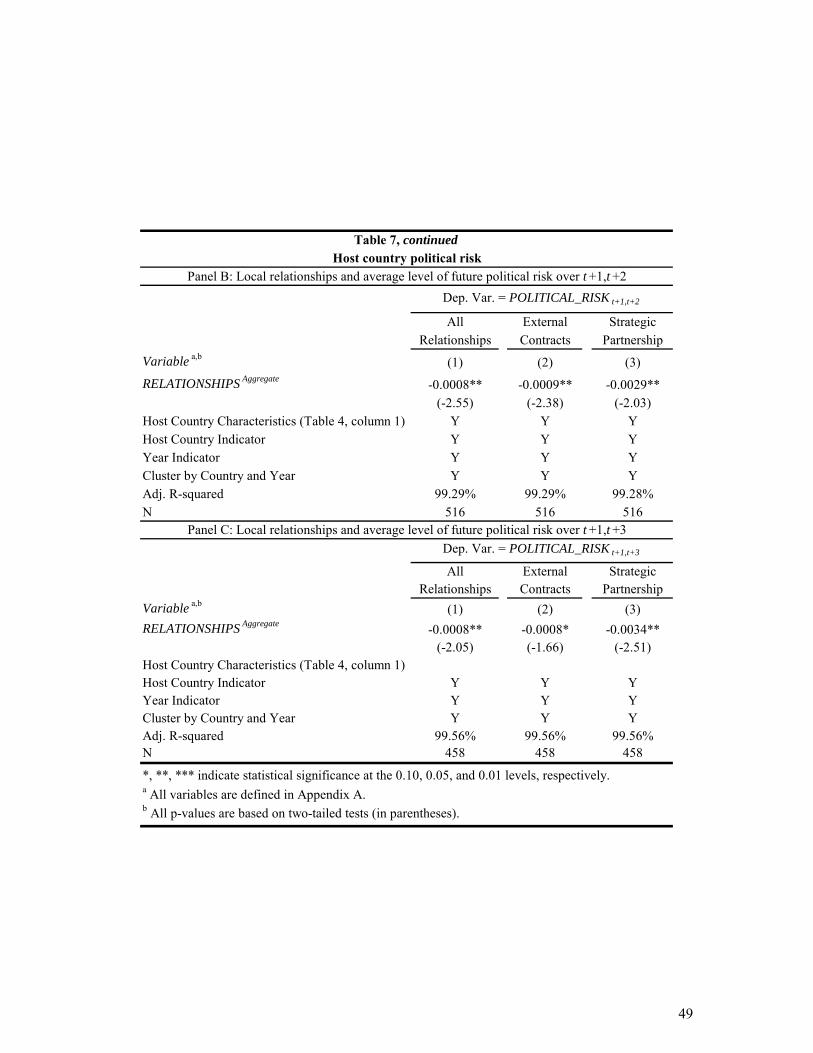
All External StrategicRelationships Contracts Partnership
Variable a,b(1) (2) (3)
RELATIONSHIPS Aggregate-0.0008** -0.0009** -0.0029**
(-2.55) (-2.38) (-2.03)Host Country Characteristics (Table 4, column 1) Y Y YHost Country Indicator Y Y YYear Indicator Y Y YCluster by Country and Year Y Y YAdj. R-squared 99.29% 99.29% 99.28%N 516 516 516
All External StrategicRelationships Contracts Partnership
Variable a,b(1) (2) (3)
RELATIONSHIPS Aggregate-0.0008** -0.0008* -0.0034**
(-2.05) (-1.66) (-2.51)Host Country Characteristics (Table 4, column 1)Host Country Indicator Y Y YYear Indicator Y Y YCluster by Country and Year Y Y YAdj. R-squared 99.56% 99.56% 99.56%N 458 458 458
*, **, *** indicate statistical significance at the 0.10, 0.05, and 0.01 levels, respectively.a All variables are defined in Appendix A.
Panel C: Local relationships and average level of future political risk over t +1,t +3
Dep. Var. = POLITICAL_RISK t+1,t+3
b All p-values are based on two-tailed tests (in parentheses).
Table 7, continuedHost country political risk
Panel B: Local relationships and average level of future political risk over t +1,t +2
Dep. Var. = POLITICAL_RISK t+1,t+2
49

Full Sample Gov Relations No Gov Relations
Variablea,b(1) (2) (3)
Ln(RELATIONSHIPS All ) 0.0106** 0.0941** 0.0140(2.48) (2.37) (1.19)
Firm Characteristics (Table 5, column 1) Included Included IncludedHost Country Characteristics (Table 5, column 1) Included Included IncludedIndustry and Year Fixed Effects Included Included IncludedHost Country Fixed Effects Included Included IncludedAdj. R-squared 6.84% 20.88% 5.61%N 11,274 796 10,478
F-statistic 2.24p-value 0.1342
(1) (2)
Ln(RELATIONSHIPS All ) -0.1820*(-1.90)
Ln(RELATIONSHIPS All ) Gov_Relations_Firms -0.0473***
(-3.12)
Ln(RELATIONSHIPS All ) Non_Gov_Relations_Firms 0.0096*
(1.66)Host Country Characteristics (Table 5, column 1) Included IncludedYear Fixed Effects Included IncludedAdj. R-squared 94.40% 97.20%N 418 418
(1) (2)
Ln(RELATIONSHIPS All ) -0.2430***(-3.16)
Ln(RELATIONSHIPS All ) Gov_Relations_Firms 0.0072
(0.70)
Ln(RELATIONSHIPS All ) Non_Gov_Relations_Firms -0.0013
(-0.34)Host Country Characteristics (Table 5, column 1) Included IncludedYear Fixed Effects Included IncludedAdj. R-squared 80.54% 91.50%N 418 418
*, **, *** indicate statistical significance at the 0.10, 0.05, and 0.01 levels, respectively.a All variables are defined in Appendix A.b All p-values are based on two-tailed tests (in parentheses).
Dep. Var. = POLITICAL_RISK t+1
Dep. Var. = ECONOMIC_RISK t+1
Table 8Government Relations
Panel A: Government relations and growth in host country customer baseDep. Var. = CUSTOMER_GROWTH t,t+3
Panel B: Government relations and future political risk
Panel C: Government relations and future economic risk
50

Full Sample Strong ESG Rating Weak ESG Rating
Variablea,b(1) (2) (3)
Ln(RELATIONSHIPS All ) 0.0297*** 0.0479*** 0.0144(2.64) (3.64) (1.12)
Firm Characteristics (Table 5, column 1) Included Included IncludedHost Country Characteristics (Table 5, column 1) Included Included IncludedIndustry and Year Fixed Effects Included Included IncludedMNC and Host Country Fixed Effects Included Included IncludedAdj. R-squared 50.80% 45.74% 57.50%N 5,666 3,627 2,039
F-statistic 3.36p-value 0.0668
(1) (2)
Ln(RELATIONSHIPS All ) -0.0059***(-2.92)
Ln(RELATIONSHIPS All ) Strong_ESG_Firms -0.0252**
(-2.32)
Ln(RELATIONSHIPS All ) Weak_ESG_Firms 0.0091
(1.13)Host Country Characteristics (Table 5, column 1) Included IncludedYear Fixed Effects Included IncludedAdj. R-squared 97.57% 97.60%N 228 228
(1) (2)
Ln(RELATIONSHIPS All ) -0.3890***(-2.89)
Ln(RELATIONSHIPS All ) Strong_ESG_Firms 0.0055
(0.76)
Ln(RELATIONSHIPS All ) Weak_ESG_Firms -0.0087
(-1.63)Host Country Characteristics (Table 5, column 1) Included IncludedYear Fixed Effects Included IncludedAdj. R-squared 76.52% 75.98%N 228 228
*, **, *** indicate statistical significance at the 0.10, 0.05, and 0.01 levels, respectively.a All variables are defined in Appendix A.
Panel A: Environmental and social risk management and growth in host country customer base
Dep. Var. = POLITICAL_RISK t+1
Dep. Var. = ECONOMIC_RISK t+1
b All p-values are based on two-tailed tests (in parentheses).
Table 9Environmental and Social Risk Management
Dep. Var. = CUSTOMER_GROWTH t,t+3
Panel B: Environmental and social risk management and future political risk
Panel C: Environmental and social risk management and future economic risk
51