three global developments and a look at new zealand
TRANSCRIPT
www.centreforavia-on.com
CAPA-ACTENewZealandSummit,17-Oct-2017
PeterHarbisonExecu-veChairman,CAPA–CentreforAvia-on
ThreeglobaldevelopmentsandalookatNewZealand

www.centreforavia-on.com
SirTimClark,EmiratesPresidentandCEO:A“gatheringstorm”forairlines.“Thisisgoingtocomeandweneedtobereadytodealwithit.”“Nowyou’reseeingScoot,NorwegianandAirAsiaXcomingalong.Ithinkwe’reseeingthebeginningsofaninflec-onpoint,”
AkbaralBaker,QatarAirwaysCEO:“Maybelong-haullow-costwillworkwhenthefuelpriceis30dollarsabarrel.Butonceitgoesbeyond50dollarsIguaranteeitisnotfeasible.”
WillieWalsh,IAGCEOLonghaullowcostflightswillbecomea“significantpartofIAG.”
1. Are long haul low cost airlines sustainable?

www.centreforavia-on.com
2012 2013 2014 2015 2016 2017
180%
160%
140%
120%
100%
80%
60%
40%
20%
0%
-20%
-40%
Long Haul LCC Non-LCC Non-LCC * Gulf carriers ~ 2012 2.6% 97.4% 84.0% 13.4% 2013 3.0% 97.0% 82.0% 15.0% 2014 3.6% 96.4% 80.4% 16.0% 2015 4.0% 96.0% 78.5% 17.5% 2016 4.6% 95.4% 76.9% 18.5% 2017 5.1% 94.9% 76.9% 18.1%
Market Share
Seat Growth
Seats
Long Haul LCC Non-LCC Non-LCC * Gulf carriers ~ 2012 9.7m 368.2m 317.6m 50.6m 2013 11.8m 383.2m 323.8m 59.4m 2014 15.2m 408.2m 340.5m 67.7m 2015 17.8m 430.9m 352.4m 78.4m 2016 22.0m 456.8m 368.4m 88.4m 2017 26.1m 486.4m 393.9m 92.5m
LongHaul=Routegreaterthan4,000km*Non-LCCexcludingGulfcarriers~GulfCarriers=EK,EY,QR&TK
Long Haul LCC Non-LCC Non-LCC * Gulf carriers ~ 2013 21.7% 4.1% 4.1% 2.0% 2014 28.6% 5.7% 6.5% 5.1% 2015 17.8% 5.9% 5.6% 3.5% 2016 23.6% 6.5% 6.0% 4.5% 2017 18.4% 6.7% 6.5% 6.9%
Source: CAPA – Centre for Aviation and OAG
LCC Non-LCC Non-LCC excluding Gulf carriers
5 years’ interna9onal traffic growth

www.centreforavia-on.com
JustasLCCsreshapedshorthaul,LHLCCsaredrivingfullserviceairlinechangeInthesamewaytheyareeachevolvingtolookmorealike–connec-vity,premiumseats,lounges,FFPsFullserviceairlinesaremovingtoadoptLHLCCsubsidiariesoftheirownThereare54LCCsthatoperatelonghaul(>4,000km)routes
….Long haul low cost airlines are here to stay
AlmostallLHLCCflights4-7,000kmareoperatedbynarrowbodyaircraA

www.centreforavia-on.com
Long haul narrowbody is growing fast
Average Distance (km) 4,687
Median Distance (km) 4,514
Total Routes 1,339
Total Flights 271,837
Total Seats 44,808,640
Total Distance (km) 1,227,181,740
Total ASK’s 202,329,421,542
Domestic Flights Seats ASK
JFK-SFO 13,743 1,989,960 8,258,333,950
EWR-SFO 11,120 1,680,194 6,917,358,790
BOS-LAX 9,542 1,531,292 6,417,644,694
BOS-SFO 8,718 1,387,245 6,020,643,210
HNL-LAX 7,714 1,458,740 5,988,127,656
International Flights Seats ASK
PTY-GRU 3,973 611,842 3,108,769,150
PTY-SCL 3,852 593,208 2,849,771,260
LAX-PTY 2,307 355,278 1,719,900,800
EZE-PTY 1,940 298,760 1,597,170,940
KEF-YYZ 1,780 346,518 1,444,287,040
Source:CAPA–CentreforAvia-onandOAG
Heatmapofordersanddeliveriesoflonghaulnarrowbodies
(andnotjustLCCs.Thesearepredominantlyfullserviceairlines)

www.centreforavia-on.com
10 Year Growth rate*: 13% p/a *Includes Turkish Airlines Seats ASK Flight
Emirates 159.4% 177.6% 91.5%
Etihad 210.4% 296.9% 266.1%
Qatar 253.3% 365.9% 185.7%
Turkish 240.5% 372.8% 186.7%
But in 2017 growth was only 0.5% Emirates: 2.8% Qatar: 0.8% Etihad: -3.6% Turkish: 1.8%
Source: CAPA – Centre for Aviation and OAG
2. The Gulf carriers at a turning point

www.centreforavia-on.com
The Super-Connectors: Revising strategies
Previouslyonlyorganiclonghaulgrowth;nowtonetworkwithflydubaiReducingcosts,droppingpartnershipstrategy,butnonewstrategyyet(Temporarily?)hamstrungbyblockade;stronginvestments,inIAG,LATAMTroublesathome;reducingexpansionplans

www.centreforavia-on.com
3. Chinese tourism growth is unlike any previous market
1. Chinesetourismhasimmenseandpoten-allyrapidupside
2. Thesheerscaleandrapidityofgrowthdifferen-atesitfromprevioussourcemarkets

www.centreforavia-on.com
177
2007 2008 2009 2010 2011 2012 2013 2014 2015 2016 2017
200
600
1,000
1,400
1,800
2,200
2,600
217 230 261415
658739
9321,133
1,909
2,211
China - New Zealand flight growth
NumberofairlinesflyingtoNewZealand
Over1,000%growth
ThescaleofChina’stourismgrowth– anditslikelyupside–hasmuchbroaderimplica-onsthanjusttourism.Itisoneelementofamajorglobaltransforma-on
Source:CAPA–CentreforAvia-on,OAG

Source:CAPA–CentreforAvia-on,OAGTrafficAnalyser*2017yeartodate
Air New Zealand average domes9c fares
$179
$174
$169
$171
$169
$162
$169
AirNewZealand’saveragedomes-cfaresdeclinedsignificantlybetween2011-2016,buthaverecoveredin2017todate

www.centreforavia-on.com
$190
$185
$180
$175
$170
$165
$160
$155
Air NZ average domes9c fares by airport
2011vs.2017AKL down9.0%CHC down4.3%DUD down6.4%QLG down6.6%ZQN down4.7%
2016vs.2017AKL up5.0%CHC up4.5%DUD up1.2%QLG up3.8%ZQN up8.1%
2011 2012 2013 2014 2015 2016 2017
AKL CHC DUD WLG ZQN
Source:CAPA-CentreforAvia-on,OAGTrafficAnalyser

www.centreforavia-on.com
-Anes-mated40,000appsareunderdevelopmentinthetravelspace-Ar-ficialIntelligence,voicerecogni-onarefastenhancingtheabilityofbotstohandlecomplextransac-ons-“Thirdpar-es”likegooglearerapidlyintrudingintothedistribu-onspace-Blockchainisnowenteringthepicture,allowingdirectdealingandchangingpayments-Privatebehaviouristransla-ngintothecorporate-Thiswillbean“un-dy”evolu-on.Probablyexplosive
A Torrent of apps, AI, chatbots, big data, Blockchain, google, Facebook, Amazon, Alibaba……
www.centreforavia-on.com
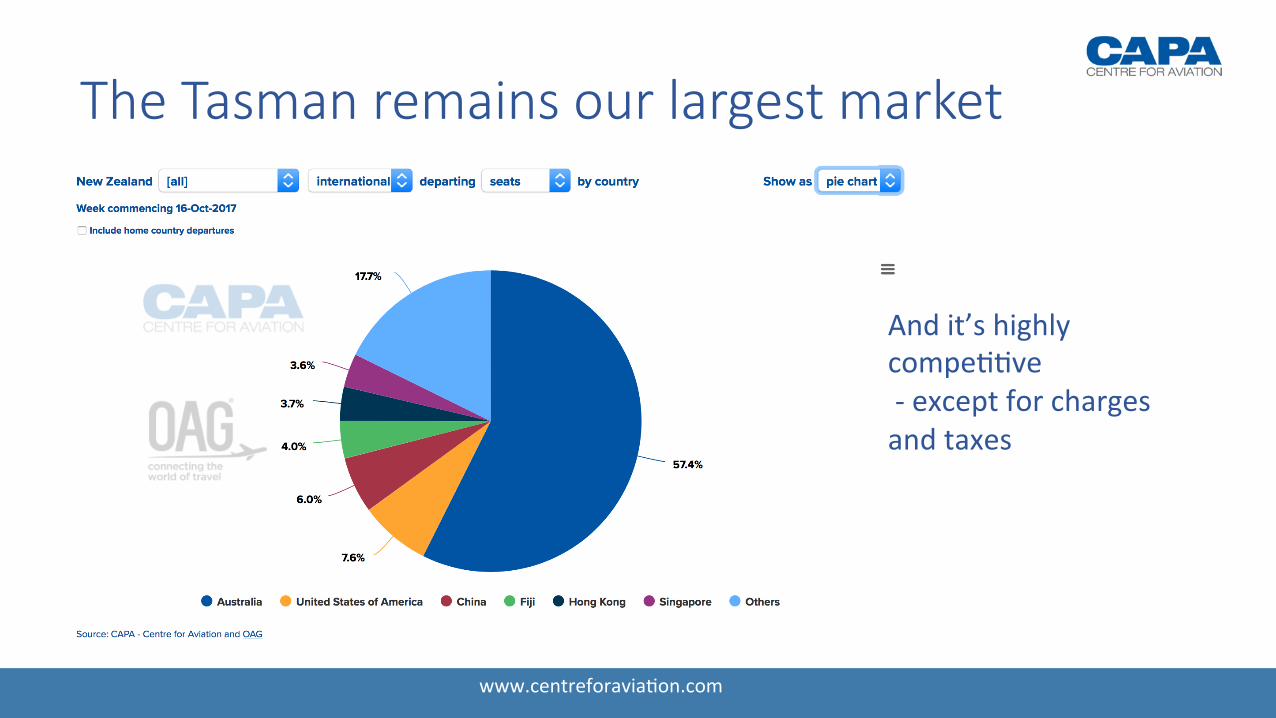
The Tasman remains our largest market
Andit’shighlycompe--ve-exceptforchargesandtaxes

www.centreforavia-on.com
AirlinesDes-na-ons
10/97
115/9
*AU/NZ
2007 2017
44%SeatGrowth
Australia-NewZealand
FlightsSeats
18,0003,500,000
24,0005,100,000
2007 2017• Addi-onaldes-na-onsinAustraliaincludeCBR,
MCY.
• ]NewZealandnolongerflyingtoHLZorPMR• 2010-2014flightstoROToperated.
Tasman: good growth in a “mature” market
Source:CAPA–CentreforAvia-on,OAG

www.centreforavia-on.com
The majority of future capacity growth will be into Asia – but the Americas have poten9al
Newaircrauaremakinglongandthinroutespossible

www.centreforavia-on.com
Air New Zealand Passenger Growth 2013-2017

www.centreforavia-on.com
Thankyou!