three-dimensional high-resolution urban … · three-dimensional high-resolution urban thermal and...
TRANSCRIPT

THREE-DIMENSIONAL HIGH-RESOLUTION URBAN THERMAL AND MECHANICAL LARGE EDDY SIMULATION
INTERACTIVE-PHYSICS BETWEEN BUILDINGS, LAND COVER AND TREES
Mohammed Bakkali1, Atsushi Inagaki2, Yasunobu Ashie3, Manabu kanda2, Mike Davies1, Philip Steadman1, and Siegfried Raasch4
1Bartlett School, University College London, UK 2International Development Engineering, Tokyo Institute of Technology, Tokyo, Japan
3Housing Department, National Institute for Land and Infrastructure Management, Japan 4Institut fur Meteorologie und Klimatologie, Leibnitz Universitat, Hannover, Germany
ABSTRACT
The large eddy simulation (LES) model ‘PALM’ was further developed for the computation of irregular turbulent vertical transports within real urban environments counting buoyancy-driven flows. The model was implemented with calculated initial boundary conditions for three-dimensional high-resolution heterogeneous sensible heat fluxes from buildings, tree crowns and different land use categories. These fluxes were initially computed by a multi-patch urban energy balance model (3D City Irradiance). The results were then inserted into the LES model through Neumann boundary conditions. Such detailed thermal effects in urban LES were not previously investigated. Results from this research showed that heterogeneous distribution of sensible heat fluxes at the wall surface led to more localised convections within the surface layer and above. This new numerical method aims at enhancing the capabilities of mathematical models for predicting extreme weather hazards stressed by urban environments such as overheating and turbulent mixing above the urban surface. The method was based on a binary approach grounded on aerodynamics and thermodynamics. More accurate estimates of maximum temperatures, their time of occurrence and their detailed spatial distributions are estimated. Two locations in Nagoya and Tajimi City in Japan were used for case studies by considering the effects of improved evaporation efficiency in building construction materials.
INTRODUCTION The lowest component of the atmosphere is the most turbulent. In urban areas, this component forms the urban boundary layer (UBL). Its depth fluctuates between a few hundred metres to a few kilometres. The treatment of turbulent vertical transports and mixing is important for urban meteorological modelling. During unstable urban thermal stratification, a realistic modelling of this layer remains difficult. Much of this difficulty arises from the range of turbulent scales that can affect convective turbulent mixing in its 90 % upper level. In urban environments, substantial heterogeneous irregular patterns and intensities of
turbulent vertical thermal and mechanical transports are stressed by various urban structures. The simultaneous effects of buildings including their respective features in terms of typology, geometry and construction materials in addition to tree crowns, land cover categories and their overall combined spatial configurations within urban environments are important to the evaluation of surface physical forcing. Wind shear and buoyancy from large, deep and dense canopies tend to affect the stability and the depth of the urban boundary layer. This influences our daily life through, for instance, the change in pollutant concentrations, heat and cold stresses and other weather related hazards. The understanding of such dynamics is vital in helping to shape more resilient communities and in addressing public health policies. Many numerical weather prediction (NWP) models can assess similar dynamics via the bulk parameterisation of the urban surface physics. Although advective horizontal flows are well resolved near surface, vertical flows from cities’ roughness could be however much more improved. The wall surface in such models is positioned either on the top of the canopy or on the ground level with basic surface features. They mostly operate at coarse spatial resolutions of hundred metres per grid to dozen of metres for the most detailed models. Despite of the boundary conditions carefully treated, these types of modelling cannot include the physical details of urban surface heterogeneities, e.g. three-dimensional radiation and so forth. The urban LES ‘PALM’ (Raasch and Schröter, 2001) developed in this paper addresses these surface features. Some NWPs do not address the instantaneous fluctuation of turbulences, e.g. Reynolds-Averaged-Navier-Stokes (RANS) models. The calculation of turbulences and eddies in such models is generally averaged. This does not depict detailed information about the intensity, the features, and when and where do different extreme weather events occur. However, these models are computationally affordable and they can give reliable results over longer simulated times. In recent years, high performance computing platforms have become more accessible. This had led to the development of high-resolution NWPs performing the calculation of detailed turbulences and the energy budget within urban environments.
Large eddy simulation (LES) modelling i.e., the Smagorinsky based approach and direct numerical simulation (DNS), have become hence more relevant. The only difference is that LES resolves fully large eddies with high Reynolds numbers unlike small scale eddies which are modelled and parameterised instead. In contrast, DNS resolves small eddies in fluids with low Reynolds numbers e.g., eddy viscosity. LES compromises between RANS models and the DNS method. LES and DNS are however run at higher computational costs for shorter simulation times. Most of the relevant researches carried out through LES, have mainly been applied for the assessment of mechanical turbulence from buildings (Letzel et al., 2008 and Kanda et al., 2013). Unlike wind shear effects, buoyancy effects had been poorly assessed. Considerations of both mechanical and thermal turbulences are required to understand the physics of urban meteorology and there has been some work recently done trying to include these aspects (Park et al., 2012, Suhring et al., 2014, Yaghoobian et al., 2014 and Maronga et al., 2014). However, such work has been applied in idealised conditions either by considering the physics from idealised three-dimensional street canyons or through the implementation of averaged urban physical parameterisation per numerical tiles at the wall surface (a ’tile’ varies from the urban block scale to neighbourhood or larger scales). Thermal turbulences rely on kinematic sensible heat fluxes. They have very heterogeneous patterns in real situations. In the work described in this paper, an LES model has been coupled to an urban outdoor-indoor multi-patch energy balance model (3D City Irradiance) (Bakkali et al., 2015). Multi-patch refers here to very fine urban facets of four square metres describing in details geometrical and thermo-physical properties of the surface of the urban canopy. These types of energy balance models are usually more complex and time consuming than slab models, single-layer and multi-layer urban canopy models. The coupling is a static or ‘one-way’ coupling. The numerical method employed in this research tends to be more representative of the physics occurring in real urban environments and it involves calculated integrated effects of mechanical and thermal turbulence from different urban structures at finer resolution. It describes appropriately the dynamics of urban weather from surface to the upper atmosphere. The physical effects of three-dimensional urban features were incorporated. This numerical method has not been previously implemented. The relevance of this method has been already tested at an earlier stage for the calculations of drag, buoyancy and turbulent flows (Bakkali et al., 2015). This has been achieved through the comparison of ‘real’ combined buoyancy-wind shear effects in thermally stratified unstable conditions with ‘ideal’ thermal effects and merely ‘real’ wind shear effects in neutral conditions. The work is a breakthrough towards urban
meteorological researches which provides more information on patterns, intensity, location and size of different types of turbulent flows ranging from streaky turbulent organized structures, local turbulent mixing and other features such as Rayleigh Benard convection and horizontal convective rolls which have been calculated in a previous paper (Bakkali et al., 2015). Only light detection and ranging (LIDAR) systems such as Doppler LIDAR can depict such ‘real’ physics by observing the movement of aerosols in the air and measuring the direction and speed of the wind based on that movement. Furthermore, the energy balance model implemented for this research has already been coupled with RANS model in Tokyo so as to produce a local heat map and output results have been tested along with measurements (Ashie, Y. and Kono, T., 2011). The implications of such turbulent flows on pollutant concentrations, heat and cold distributions, aerosol dispersion and gusts, for instance, are important and they will be explored in the near future. This is potentially useful for research on human health and comfort, building energy, urban planning, environmental assessment methods and construction design guidance.
NUMERICAL METHOD LES models are excellent tools that depict detailed physics within the UBL which is mainly affected by the combined effects of momentum and heat fluxes from the urban surface. Although these models are excellent NWP tools, they still however not applied for wider weather events and they require therefore further computational developments. Some of the gap is due to the limitations produced by studies carried out with coarse spatial resolutions, which are not sufficient enough for the investigation of urban environments. Other issues remain in studies lacking to cover sophisticated unstable thermal stratification. These types of researches cover either stable, neutral or very simplified unstable thermal conditions. The numerical method developed here makes from LES modelling a more appropriate tool if not the best tool to depict detailed physical patterns within the UBL in cities under unstable thermal stratification. The spatial resolution was set higher in order to include all the details of the urban features: buildings, vegetation and other infrastructure. The sensible heat flux was comprehensively included from all urban surfaces. Three-dimensional urban geometries were permanently considered during the development process. This is vital for the study of the momentum flux as well as the heat flux within the surface layer. For instance, the drag coefficient and leaf area density of three-dimensional tree crowns were accordingly taken into account. Some additional research are planned to be undertaken in the near future, this will include wet air and/or latent heat from the vegetative cover and waste heat from different energy systems including buildings and transportation.

Table 1 Calculation set up for the urban energy balance, 3D City Irradiance model
Model Settings Details Nagoya Nagoya Tajimi Tajimi (existing site) (green building) (exisitng site) (green building) Material properties Evaporation efficiency 0 0.3 0 0.3 Calculation set up Domain number 6 sub-domains 6 sub-domains 6 sub-domains 6 sub-domains Domain size 285x285x200 grids 285x285x200 grids 285x285x200 grids 285x285x200 grids Grid size 2mx2mx2m 2mx2mx2m 2mx2mx2m 2mx2mx2m 3D City Irradiance
Calculation time 24 calculated hours 24 calculated hours 24 calculated hours 24 calculated hours model Calcuation date August 22nd 2013 August 22nd 2013 August 10th 2013 August 10th 2013 12 pm (AMEDAS) 12 pm (AMEDAS) 12 pm (AMEDAS) 12 pm (AMEDAS) Filtering Nesting error: 60 m Nesting error: 60 m Nesting error: 60 m Nesting error: 60 m Output results Sensible heat flux w/m2 w/m2 w/m2 w/m2 Heterogeneous from
Buildings & land cover
Sensible heat source w/m3 w/m3 w/m3 w/m3 Heterogeneous from tree
crowns
Settings Details Nagoya/Tajimi Nagoya/Tajimi Nagoya/Tajimi
(green pavement) (highly reflective paint) (highly reflective pavement)
Material properties Evaporation efficiency 0.3 (concrete pavement) 0 0
Material properties Albedo 0.18 0.8 (building envelope) 0.8 (concrete pavement
Table 2 Calculation set up for large eddy simulation, PALM model
Model Settings Details Nagoya Nagoya Tajimi Tajimi (existing site) (green building) (exisitng site) (green building) Calculation set up Domain number 1 domain 1 domain 1 domain 1 domain Domain size 1350mx900mx1590m 1350mx900mx1590m 1350mx900mx1590m 1350mx900mx1590m Grid size 2mx2mx2m 2mx2mx2m 2mx2mx2m 2mx2mx2m PALM Calculation time 3600s 3600s 3600 3600s model Calcuation date August 22nd 2013 August 22nd 2013 August 10th 2013 August 10th 2013 12 pm (AMEDAS) 12 pm (AMEDAS) 12 pm (AMEDAS) 12 pm (AMEDAS) Boundary conditions cyclic (x,y) cyclic (x,y) cyclic (x,y) cyclic (x,y) slip (top) slip (top) slip (top) slip (top) non-slip (bottom) non-slip (bottom) non-slip (bottom) non-slip (bottom) Geostrophic wind (surface) 3.4 m/s 3.4 m/s 1.9 m/s 1.9 m/s Potential temperature (surface) 309 k 309 k 310 k 310 k Output results u, v, w m/s m/s m/s m/s Potential temperature k k k k Pressure bar bar bar bar Turbulent statistics
Three dimensional high-resolution interactive urban energy balance modelling of buildings, land cover and trees In this research work, the numerical capabilities of the urban energy balance model (3D City Irradiance) were further enhanced. Interactive thermodynamics in terms of radiation and conduction and convection although limited by the homogeneity of air temperatures were set between different urban surfaces either solid or porous. A comprehensive energy balance was calculated for buildings, land cover, water surfaces and tree crowns. The calculations were carried out in three-dimensional spatial settings. A plant model was appropriately developed and activated in the model’s code. This allowed the inclusion of the energy balance of the vegetative cover especially three-dimensional tree crowns. Regarding water surfaces, calculations of water energy balance were not performed as the modelling of the water energy balance could be very sophisticated. Although water surfaces are dynamic and involve different patterns of waves and so forth, they were nevertheless considered like all other static urban surfaces and they were allocated appropriate thermo-physical properties for albedo, emissivity, thermal diffusivity, evaporation efficiency, density, specific heat capacity and an extinction coefficient similar to other transparent surfaces. The depth of large water surfaces was set to ten metres.
In terms of enhancements related to the numerical capabilities, the spatial resolution was increased to two metres in x, y and z axes. Data pre-processing had to be performed in a Linux operating system to overcome the technical issues related to lack of memory.
Urban thermal LES modelling with heterogeneous sensible heat fluxes from all porous and solid urban surfaces The PALM model was used for large eddy simulations. The code was similarly updated in order to integrate the effects of sensible heat fluxes from all urban surfaces such as buildings, ground, water and different types of land cover. The new user code additionally incorporated sensible heat sources from different tree crowns. Input parameters included the height of tree crowns and buildings in metres. They included sensible heat fluxes (w/m2) from north, south, east and west elevations of all building types. Sensible heat fluxes were similarly added from building roofs and different types of land cover. The LES code was furthermore adapted to input the effects of sensible and latent heat sources (w/m3) from different three-dimensional tree crowns at every mesh. The resolution of the LES model was set to two metres in all directions the same as the energy balance model.

1.35 km 1.35 km
0.9 km
0.9 km
CALCULATION SETTINGS Energy balance modelling
Figure 1 Land use classifications in Nagoya The enhanced urban energy balance model calculated two case studies at the city centre of Nagoya and Tajimi City. For testing purposes, the model has been run for the two locations after the implementation of four different urban heat island mitigation strategies as follow: highly reflective buildings, highly reflective pavements, green pavements and green buildings. For highly reflective surfaces, albedos were increased from 0.18 to 0.8. For green surfaces, the evaporation efficiency was increased from 0 to 0.3 (see, table 1). Each domain was composed of six sub-domains that were calculated in a local computer. The domain was sub divided for calculation efficiency due to limitations in the available computational resources. The code was not adapted to be run in high performance computing platform for this study. Each sub-domain consisted of 285 x 285 x 200 grids. The grids were structured and equidistants. They measured two metres along all axes. Simulations were run for 24 hours on August 22nd 2013 in Nagoya and August 10th 2013 in Tajimi City. Results from a band of 60 metres around the edges of each sub-domain were omitted due to errors linked with nesting and the periodic settings of the cyclic boundaries for radiation. Calculated heterogeneous sensible heat fluxes from all buildings and land cover surfaces for one hour, i.e. 12.00 pm were inputted into the LES model. This specific time was chosen due to higher amount of solar radiation hitting the urban surface. Calculated heterogeneous sensible heat sources from tree crowns were similarly inputted into the LES model. These results were used as the boundary conditions for heterogeneous heat fluxes
Figure 2 Land use classifications in Tajimi City in the existing sites before and after the implementation of higher evaporation efficiency in building envelopes. The other thermal physical properties were maintained constant between all runs.
• Nagoya In the existing urban settings of the city centre of Nagoya, the effects of shading on surface temperatures were an important physical factor considering the deep urban canopy. Surface temperatures were calculated by the urban energy balance model in Nakamura district in Nagoya (Japan) on August 22nd 2013 at 12.00pm. Surface temperature levels at the surface were very heterogeneous. This is due to the inclusion of the integrated effects of building geometries and materials, land cover, water surfaces and trees on the urban energy closure (see, figure 1). Calculated surface temperatures reached 58 degrees at the surface of roads made of asphalt, 52 degrees on concrete roofs and 40 degrees in shaded spaces (see, figure 3). As a reminder, The albedo of highly reflective building envelopes was set to 0.8. Although surface temperatures cooled down about -6 degrees over building walls and -16 degrees over building roofs, surface temperatures increased however inside street canyons by +6 degrees. The contrasted effects of radiation on temperatures over building envelopes and the temperature of street canyons on the ground level has been enabled by the three-dimensional radiation scheme implemented in the code of the urban energy balance model. Such detailed information could not be depicted with one or two-dimensional radiation schemes.

Figure 3 Calculated surface temperature distributions (oC) at 12.00pm (22/08/13) in Nagoya (3D City Irradiance model) Building walls were less cool than building roofs. They were exposed to multi-reflected radiation, which was trapped inside the canyons and building roofs were exposed to incoming radiation. The more an urban surface was exposed to radiation the more tangible the effect of the mitigation strategy was and this is why building roofs were probably cooler. The albedo of the ground surface was set to 0.8. The albedo of different roads was maintained at 0.18. Temperatures at the ground were therefore cooled down by -16 degrees and the temperature of buildings increased by +2 to +4 degrees. For high-rise buildings, roof temperatures were not affected and kept unchanged. For other buildings, roof temperatures increased by +2 to +4 degrees. The evaporation efficiency of all buildings was increased to 0.3. Calculated surface temperatures decreased by -11 degrees in certain roofs among low-rise buildings and approximately -10 degrees over the rest of building roofs. Temperatures were reduced by -5 degrees in most building walls. The change of ground surface temperature was insignificant. The evaporation efficiency was similarly increased for all ground surfaces except for the roads. Surface temperatures were reduced by -12 degrees especially on concrete surfaces and approximately -7 degrees on pavements. No major surface temperature changes were noticed on building surfaces. Although the urban energy balance model (3D City Irradiance) was tested with the BESTest (Bakkali et al., 2015), surface temperature values were used here as indicators only and not as absolute values.
• Tajimi City In this case study, effects of land cover were an important factor on surface temperature distributions (see, figure 2). The temperatures were calculated
Figure 4 Calculated surface temperature distributions (oC) at 12.00pm (10/08/13) in Tajimi City (3D City Irradiance model) on August 10th 2013 at 12.00 in Tajimi City and near surface they were very heterogeneous. Integrated thermodynamics between all types of urban surfaces were included. The coolest surfaces were primordially part of the green cover and other water surfaces. Hottest surfaces were mainly built from concrete and asphalt surfaces. Regarding buildings, the walls were in general cooler than roofs which were more exposed to radiation. Less amount of radiation was trapped between buildings as the site is characterised by low-rise buildings organised around large courtyards (see, figure 4). Highly reflective buildings were implemented all over the site. Their albedos were similarly increased to 0.8. Temperature levels at different buildings’ envelopes were reduced by a maximum of -18 degrees. However, in narrow and dense courtyards temperatures were increased by a maximum of +6 degrees due to the multi-reflection of trapped radiation. Highly reflective ground surface was implemented with a reflectivity of 0.8. Roads were excluded from this measure. Temperature levels at the ground surface were reduced by a maximum of -20 degrees. In narrow and dense courtyards temperatures were however increased due to stuck radiation. This also applies to different buildings’ envelopes where temperatures were increased due to radiation reflected from the ground surface. As a reminder, The evaporation efficiency was set to 0.3 in all buildings. Temperature levels generally dropped. This was insignificant over ground surfaces and it reached around -12 degrees on building roofs and approximately -7 degrees on building walls. The evaporation efficiency was then set to 0.3 for all concrete horizontal surfaces on the ground apart from the roads. Temperature levels generally dropped. This reached -13 degrees on ground surfaces and it was insignificant over buildings.
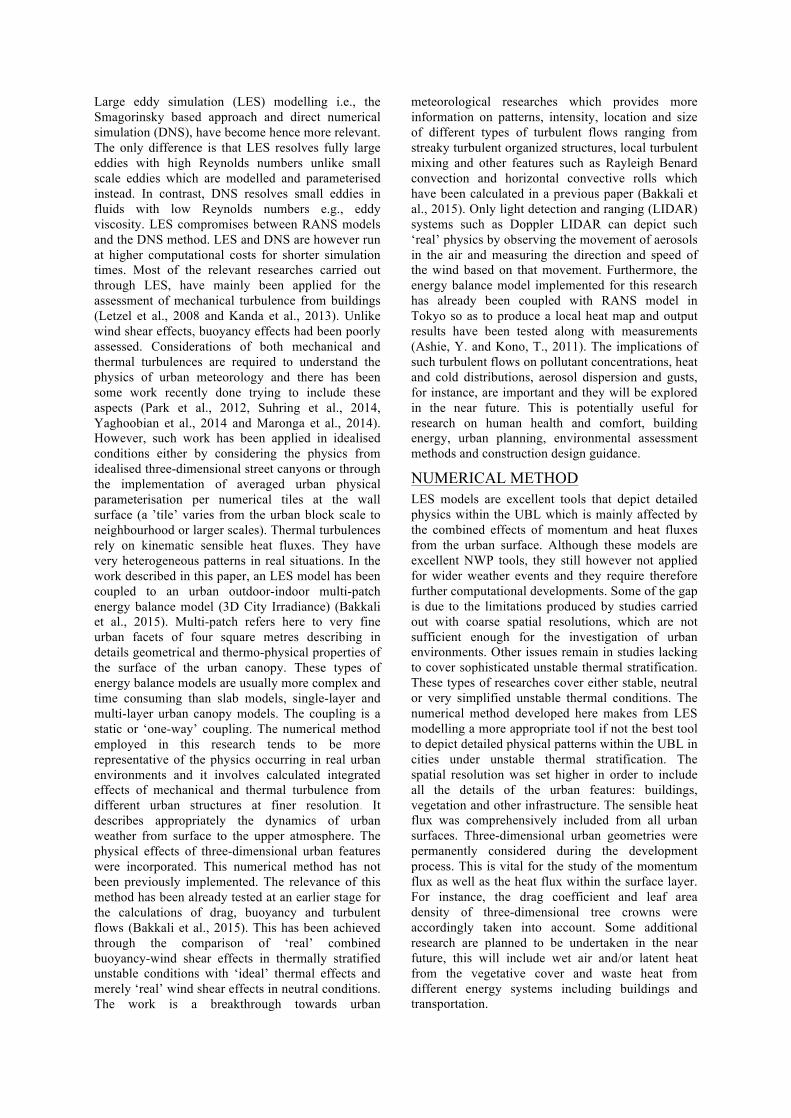
Urban thermal LES Figure 5 Potential temperature variations (310 -316 k) at 12.00pm (22/08/13) in Nagoya (buildings with improved evaporation efficiency), calculated by PALM model Calculations of turbulent statistics during one-hour were performed. The spatial resolution of the domain was equally set at two metres along x, y and z directions. Turbulent statistics were averaged for every 30 minutes for potential temperatures, u and v velocity components, vertical momentum fluxes wu and wv and vertical heat fluxes wθ. For comparison purposes, only results from the last 30 minutes were taken into account. The height of the domain was set to 1590 metres. Further simulation details are in table 2. This numerical method represents an upgrade of the earlier method developed in previous publications (Bakkali et al., 2015 a,b). The upgrade consisted in increasing the spatial resolution from five to two metres, including heat fluxes from land cover and heat sources from trees.
• Nagoya In general, the wind velocity component u increased at z = 2 metres after the implementation of higher evaporation efficiency in building construction materials. A better configuration of wind paths parallel to the mean flow was calculated at the south of the district. The implementation of such building materials reduced the wind velocity component v. A better configuration of wind paths lateral to the mean flow was calculated in the existing site before the implementation of the measure. This is due to the effects of tall buildings on drag involving a larger amount of heat flux. The amplitudes of upward and downward wind velocities were higher in the existing site. Downdraft flow was also more emphasized under the same circumstances. Maximum air temperatures near surface at z = 2 metres were higher before the application of the countermeasure. Temperatures were however more homogeneous inside the street canyons after the increase of the
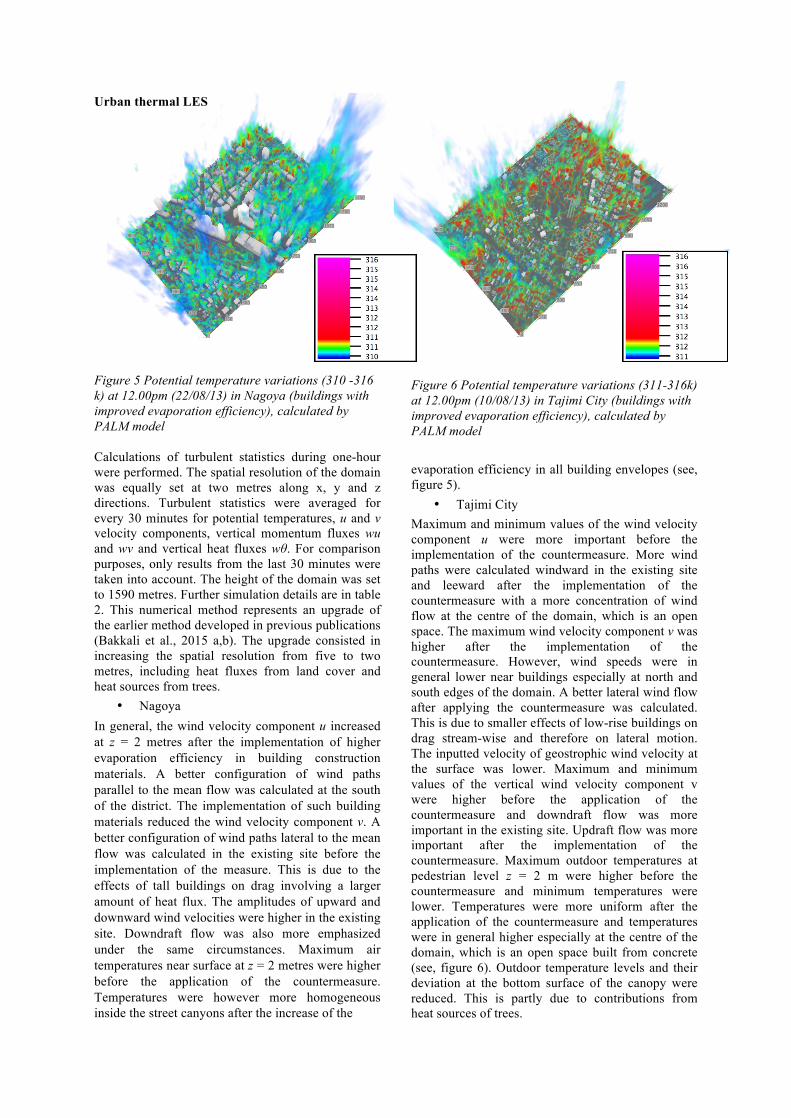
Figure 6 Potential temperature variations (311-316k) at 12.00pm (10/08/13) in Tajimi City (buildings with improved evaporation efficiency), calculated by PALM model evaporation efficiency in all building envelopes (see, figure 5).
• Tajimi City Maximum and minimum values of the wind velocity component u were more important before the implementation of the countermeasure. More wind paths were calculated windward in the existing site and leeward after the implementation of the countermeasure with a more concentration of wind flow at the centre of the domain, which is an open space. The maximum wind velocity component v was higher after the implementation of the countermeasure. However, wind speeds were in general lower near buildings especially at north and south edges of the domain. A better lateral wind flow after applying the countermeasure was calculated. This is due to smaller effects of low-rise buildings on drag stream-wise and therefore on lateral motion. The inputted velocity of geostrophic wind velocity at the surface was lower. Maximum and minimum values of the vertical wind velocity component v were higher before the application of the countermeasure and downdraft flow was more important in the existing site. Updraft flow was more important after the implementation of the countermeasure. Maximum outdoor temperatures at pedestrian level z = 2 m were higher before the countermeasure and minimum temperatures were lower. Temperatures were more uniform after the application of the countermeasure and temperatures were in general higher especially at the centre of the domain, which is an open space built from concrete (see, figure 6). Outdoor temperature levels and their deviation at the bottom surface of the canopy were reduced. This is partly due to contributions from heat sources of trees.

TURBULENT STATISTICS
Figure 7 Vertical profiles of potential temperatures in blue colour corresponding to the last calculated set of 30 minutes at 12.00 on 22/08/13 in Nagoya (top) and 10/08/13 in Tajimi City (bottom), before the implementation of green buildings strategy (left) and after (right), calculated by PALM model
• Nagoya The maximum height of the urban canopy was 247 metres. This height is a reference height that impacts the patterns of different turbulent statistics. All turbulent statistics were written as follow u = u* + u”, where u represent the total quantity, u* the resolved quantity and u” the sub grid scale quantity which most of the time is negligible compared to the resolved one. The averaged vertical profile of u component follows a logarithmic wind profile and it increased from 3 to 3.2 m/s at the top of the canopy after the mitigation strategy was implemented. Wind speeds at the top of boundary layer increased from 4.2 to 4.4 m/s. The vertical momentum flux wu decreased at the top of the canopy layer from -0.44 to -0.55 m2/s2 after the implementation of the mitigation strategy then increased to 0 at the top of the boundary layer. The vertical momentum flux wv decreased at the top of the canopy layer from 0.014 to -0.035 m2/s2 after the implementation of the mitigation strategy then increased to 0 at the top of the boundary layer. In the current site, the momentum flux increased from 0 to 0.3 (at the middle of the canopy) then decreased. For the mitigation scenario, it only decreased from 0. At the top of the boundary layer, it decreased to -0.034 m2/s2 at 1200 metres in the existing site and -0.1 m2/s2 at 750 metres after the mitigation strategy was applied. Momentum fluxes in general were stronger a long x-axis than y-axis.
Potential temperatures decreased from the bottom to the top of the canopy and reached 309.4 k at the existing site and 309.2 k when implementing the mitigation then decreased slightly to reach 309.2k and 309.1k respectively at the top of the boundary layer (see, figure 7). The calculated vertical heat flux was very turbulent within the canopy layer especially in the bottom 60 metres then it was decreased until 0.125 k.m/s and 0.1 k.m/s at the top of the canopy for the existing site and after the implementation of the mitigation strategy respectively. Above the urban canopy, the heat flux was decreasing smoothly until the 0 value was reached. The heat flux was decreasing slower until the height of 750 metres then quicker for the mitigation scenario.
• Tajimi City The maximum building height within the canopy is 60 metres. The averaged wind velocity u reached 2 m/s above the canopy layer at z=180 metres in the existing site and 2.2 m/s after the implementation of the mitigation strategy. The wind velocity u fluctuated then above this level and it decreased for the mitigation scenario. The averaged velocity v reached 0.2 m/s and below -0.2 m/s at z=180 metres for the existing site and the mitigation scenario respectively. Above z=180 metres, the averaged velocity decreased within the existing site and increased for the mitigation strategy. The vertical momentum flux wu decreased to -0.1 and -0.13 m2/s2

for the actual site and the mitigation scenario respectively. This value was decreased to -0.14 and -0.22 m2/s2 at 750 metres and 1050 metres above the surface then increased to 0 at the top of the boundary layer. For the existing site, the vertical momentum flux wv decreased at the top of the urban canopy layer. It increased to 0.04 m2/s2 at z=450 metres and it then decreased to -0.02 m2/s2 at z=1350 metres then increased to 0 at the top of the boundary layer. Regarding the mitigation strategy, it continuously decreased to -0.07 m2/s2 until z=400 metres, it increased then to 0.06 m2/s2 at z=1200 metres then it decreased to 0 at the top of the boundary layer. Potential temperature decreased to 310.4k and 310.3k just above the urban canopy both in the existing site and after the implementation of the mitigation strategy. Above the urban canopy, temperature profiles remained stable and nearly constant around 310.25k (see, figure 7). The vertical heat flux is very turbulent near the wall surface at the bottom of the canopy. 0.17 k.m/s and 0.15 k.m/s were the calculated values at the top of the urban canopy. The flux then decreased continuously to 0 at the top of the boundary layer. Regarding, the existing site there was an inflection at z=750 metres where the heat flux decreased slowly then quickly after that until the top boundary layer. If we compare the patterns of these heat fluxes in Nagoya case, there was more inflections due to larger surface forcing. A deeper and heterogeneous urban canopy was behing the generation of such forcing.
CONCLUSION The flow patterns in cities in terms of localised buoyancy-driven flows and wind shear were more discernible when detailed urban parameterisation scheme for heat flux distributions from the urban surface was applied. In previous research, a less advanced approach was implemented to look at the integrated effects of mechanical and thermal fluxes on the convective boundary layer and some turbulent streaky organised structures closer to the spatial pattern of a horizontal convective roller were calculated. Only light detection and ranging (LIDAR) systems could depict such an event. In this research, the numerical method was enhanced and applied to the dynamics within the surface layer including the pedestrian level where applications in terms of the investigation of outdoor comfort are on going. The implementation of the urban LES model with detailed three-dimensional heterogeneous heat flux from different urban surfaces comparable to real settings is a new numerical method. In general, this approach depicts very localized turbulence at the urban surface due to more confined joint drag and buoyancy effects. These properties allow a fuller illustration of patterns such as local streaky turbulent organized structure, turbulent mixing within the convective boundary layer in terms of size and intensity over specific regions within urban areas. In
summary, such a high-resolution modelling approach has the potential to be very informative to extreme urban meteorology for the prediction, for instance, of high pollutant concentrations and temperatures. This is useful for decision-making, scalability of urban energy supply and public health policies. Future research plans involve the incorporation of such numerical modelling approaches into an assessment framework for the urban thermal environment where a downscaling approach is fundamental for the development of greater mutual feedback on urban physical parameterisation schemes aiming at improving environmental performances. The implementation of urban LES with anthropogenic heat/moisture emissions and its application to the development of renewables and energy systems would also be of interest.
ACKNOWLEDGEMENT This work was supported by the Japanese Society for the Promotion of Science (JSPS) KAKENHI Grant Numbers 25249066, 26420492 and JSPS research fellowship. Thanks go to the research programme on climate change adaptation fund (RECCA) and to the TSUBAME supercomputer platform team at Tokyo Institute of Technology for helping to run LES.
REFERENCES Ashie, Y., Kono, T., Urban-scale CFD analysis in support
of a climate sensitive design for the Tokyo Bay area, International Journal of Climatology, Vol.31, pp 174-188, 2011.
Bakkali, M., Inagaki, A., Ashie, Y., Yoshida Y., Kanda, M., Raasch, S., Thermal Large Eddy Simulation with Sensible Heat Flux Distribution From Various 3D Building Geometries, Journal of Hydraulic Engineering, JSCE, Vol.71, 2015.
Kanda, M. et al., A New Aerodynamic Parametrization for Real Urban Surfaces, Boundary-Layer Meteorology, 148(2), pp.357–377, 2013.
Letzel M.O., Krane M., Raasch S., High resolution urban large-eddy simulation studies from street canyon to neighborhood scale, Atmos. Environ., 42:8770–8784, 2008.
Maronga, B. et al., The Effect of Surface Heterogeneity on the Structure Parameters of Temperature and Specific Humidity: A Large-Eddy Simulation Case Study for the LITFASS-2003 Experiment, Boundary-Layer Meteorology, pp.1–30, 2014.
Park, S.B., Baik, J.J., Raasch, S., Letzel, M.O., A large-eddy simulation study of thermal effects on turbulent flow and dispersion in and above a street canyon. J Appl. Meteor. Climatol. , 51: 829-841, 2012.
Raasch S, Schröter S., A large-eddy simulation model performing on massively parallel computers, Meteorol., Z 10:363–372, 2001.
Sühring, M. et al., On the Effect of Surface Heat-Flux Heterogeneities on the Mixed-Layer-Top Entrainment, Boundary-Layer Meteorology, 151(3), pp.531–556, 2014.
Yaghoobian, N., Kleissl, J. & Paw U, K.T., An Improved Three-Dimensional Simulation of the Diurnally Varying Street-Canyon Flow, Boundary-Layer Meteorology, pp.1–26, 2014.