threadneedle european equities - fundsupermart.com · a leader in european equity €34.4 billion...
TRANSCRIPT

February 2013
Threadneedle European Equities
Francis Ellison
Contents
2
1. Introduction to Threadneedle European Equity team
2. Outlook
3. Funds
i. Pan European Strategy – Threadneedle(Lux) Pan European Equities Fund
ii. Why Small Cap?
iii. Pan European Smaller Companies Strategy – Threadneedle(Lux) Pan European Small Cap Opportunities Fund
Appendix1. Investment Process

Introduction
1

A leader in European equity
€34.4 billion AuM across all portfolios1
Excellent long-term performance
Deep resource
24-strong European equity team2
Close interaction across asset classes
Dedicated risk management
Clear investment philosophy, consistently applied
Stock selection key source of return
Culture of collaboration and debate
Threadneedle‟s European equity credentials
Source: Threadneedle as at 31 December 2012.
1 AuM includes externally managed portfolios, and includes UK-specific assets of €19.0 billion.
2 Includes 12 UK-specific investment professionals as at 31 October 2012.
4

European equities team
Source: Threadneedle, 31 January 2013.
5
Philip
Dicken
Dan
Ison
Ann
Steele
Nick
Davis
Mark
Heslop
David
Dudding
Paul
Doyle
Fred
Jeanmaire
Ben
Needham
Caroline
Duong
Industry
start 1997 1994 1982 2004 1999 1999 1990 2007 2010 2012
Threadneedle
start 2004 2007 2009 2010 2008 1999 1995 2011 2012 2012
Research
Small Cap
Forestry
& Paper
Automotive
Consumer Disc.
Industrials
Technology
Consumer
Disc.
Food Retail
Insurance
Healthcare
Consumer
Staples
Utilities
Small Cap
Basic Materials
Consumer
Staples
Med. Tech
Metals
Telecoms
Banks
Media
Support
Services
Electrical
Engineers
Beverages
Small Cap
Funds
managed
Institutional
Funds
Pan European
Smaller
Companies
Fund
Institutional
Funds
Pan European
Accelerando
Fund
T-Lux Pan
European Fund
Institutional
Funds
Pan European
Fund
European Fund
Pan European
Equity
Dividend Fund
Institutional
Funds
T-Lux Pan
European
Smaller
Companies
Fund
European
Select Fund
European
Smaller
Companies
Fund
Institutional
Funds
European Apex
Fund
Institutional
Funds

Outlook
2
Good news
US housing market showing signs of life, consumer in better spirits
Central banks committed to boosting asset prices
New regime in China raises prospects of stimulus
Bad news
US fiscal cliff threatens to tip economy into recession
Europe condemned to another year of pitiful economic performance
Risk of crisis remains, likely candidates are Spain and Greece
Deleveraging forces continue to hold back developed economies for the foreseeable future
Navigating the current environment
7
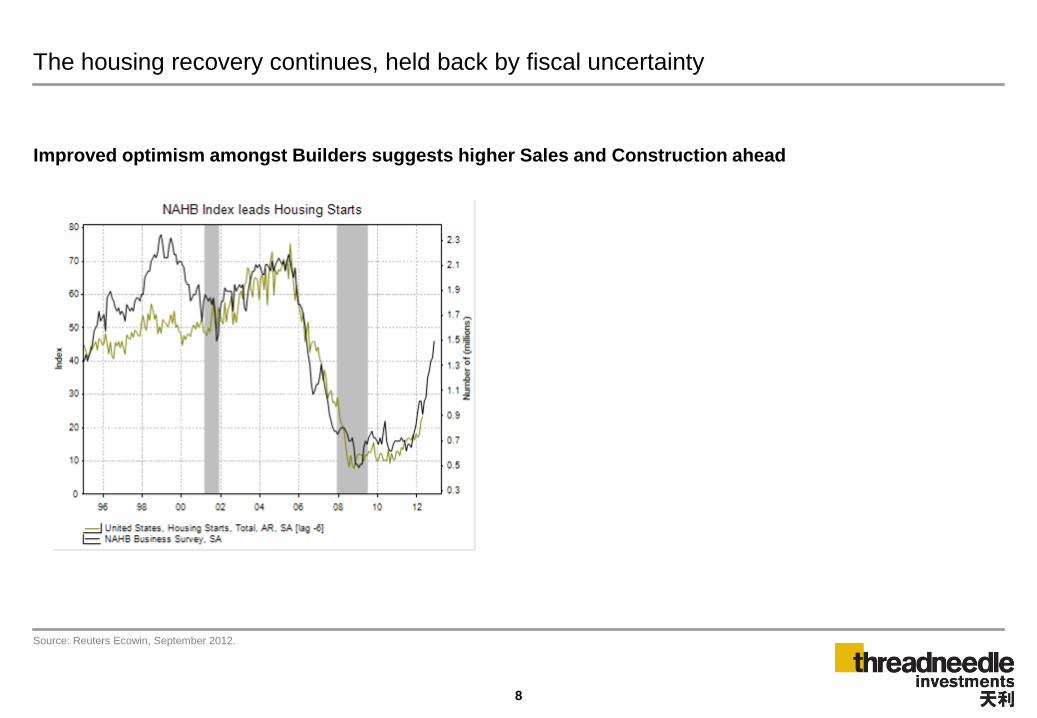
Improved optimism amongst Builders suggests higher Sales and Construction ahead
The housing recovery continues, held back by fiscal uncertainty
8
Source: Reuters Ecowin, September 2012.

Consumers feeling better about life for the first time since the crisis
Source: Reuters Ecowin, October 2012.
9

Central bank balance sheets v S&P 500
Central Bank policy: Who needs growth anyway?
Source: Threadneedle, Bloomberg, Reuters Ecowin, October 2012, Combined balance sheet = ECB + Federal Reserve + Bank of England.
1500
2000
2500
3000
3500
4000
4500
5000
09 10 11 12
600
700
800
900
1000
1100
1200
1300
1400
1500
Combined Central Bank balance sheet S&P 500 (RHS)
IndexUSD bn
Central bank balance sheets (rebased, Jan 08 = 100)
50
100
150
200
250
300
350
400
450
08 09 10 11 12
ECB Fed BoE
Index (Jan 08 = 100) Central Bank Assets
“…lower mortgage rates will make housing more affordable and allow more homeowners to
refinance. Lower corporate bond rates will encourage investment. And higher stock prices will boost
consumer wealth and help increase confidence, which can also spur spending.” Ben Bernanke,
November 2010
10

Tentative signs of improvement in China
Source: Threadneedle, UBS, October 2012
Growth rate (% y/y) Growth of infrastructure investment (% y/y 3mma)
11

The US fiscal cliff in 2013 We expect fiscal drag of roughly 1.5% in the coming year
Source: Morgan Stanley, April 2012.
12
Percentage points of potential GDP
-4.5
-3.0
-1.5
0.0
1.5
3.0
4.5
80 82 84 86 88 90 92 94 96 98 00 02 04 06 08 10 12
Fiscal year
Fiscal Restraint (+)
Fiscal Stimulus (-)
Current Law
2013 Fiscal Cliff
(% of GDP )
Expiration of
unemployment
benefits
-0.2%
Automatic
spending cuts
(sequestration)
-0.8%
Expiration of
payroll tax cuts -0.8%
Expiration of Bush
tax cuts -0.8%
C.-3.0%

Growth divergence is not new, but cannot continue
Time for decisive action
Source: Threadneedle, Reuters Ecowin, Reuters Ecowin October 2012
Eurozone Unemployment Rates
Corporate loan growth, %YoY
13
-10
-5
0
5
10
15
20
25
30
35
04 05 06 07 08 09 10 11 12
Italy Spain Germany France
Lending to Corporations%
oya
5
6
7
8
9
10
11
12
93 95 97 99 01 03 05 07 09 11
5
7
9
11
13
15
17
19
21
23
25
Germany Italy Spain (RHS)
%%

European banks not yet started necessary
deleverage2
European lenders have a long way to go
1Source: Companies data, Westhouse Securities, October 2012. 2Source: Thomson Reuters Datastream, Arbuthnot, October 2012
14
Cumulative loan loss provisions as a % of peak
loan assets1

Corporate balance sheets are strong – excluding financials!
Source: MSCI, Worldscope, Morgan Stanley Research, 31 December 2012.
All data above based on companies within the MSCI Europe ex-Financials.
Ex-financials debt to equity (%) Cash on balance sheets
15

European companies sales are increasingly global
European equities are a play on global growth
Source: Published accounts/Redburn IDEAS database.
16
460 European non-financial companies
0%
10%
20%
30%
40%
50%
60%
70%
80%
90%
100%
1990 1992 1994 1996 1998 2000 2002 2004 2006 2008 2010 2012 2014
Rest of World Asia ex Japan Other Americas USA and Canada Japan Europe
Extrapolation

Volatility to continue
Remain alive to macro developments
Many alpha opportunities
A stockpicker‟s paradise
Valuations remain attractive
1 Source: Mirabaud Securities LLP, 30 November 2012.
Equities are cheap1
6
10
14
18
22
26
30
80 82 84 86 88 90 92 94 96 98 00 02 04 06 08 10 12
Multip
le (
x)
of tr
end e
arn
ings
EU Ex Bubble Trend PE Median + 1 SD -1 SD
17

Index Level 2013E PE 2014E PE PCF 2012 yield (%)
US - S&P 500 1,466 14.4 13.8 8.4 1.9
Europe – MSCI
Europe 99 13.6 12.4 7.5 3.3
Japan – TOPIX 889 17.8 13.2 5.3 3.2
Asia Pacific ex. Japan –
MSCI Asia Pacific ex
Japan
476 13.2 12.3 8.9 2.9
Source: Threadneedle Investments, Bloomberg, 4 January 2013
18
Valuations remain attractive

Characteristics of companies we like
Source: Threadneedle as at 31 December 2012.
Themes Portfolio strategy Examples
Strong franchises / unique
assets
Market leaders
Strong finances / management
Barriers to entry
Nestlé, Ryanair, Fresenius Medical
Care
Restructuring / recovery
New management strategy
Improving returns
Value creation
Allianz, Merck
Quality cyclicals
Growth potential
Overseas earnings
Strong finances
Sika, SGS, Lanxess
Structural growth
Demographic trends
Energy efficiency
Global shortages
Innovation
Syngenta, Atlas Copco, Novo Nordisk
Emerging markets opportunities Emerging markets exposure
Reasonable valuations Edenred, ABI
19

The market is trading at an attractive valuation historically and relative to other assets such
as bonds
Cash flows are healthy and balance sheets are strong, yet cash balances are earning little
M&A activity is likely to be a feature
Whilst problems in some countries have caused euro weakness this benefits a number of
exporting companies, particularly in northern Europe
Despite tough macroeconomic conditions, it is still very possible to find companies, even in
the peripheral eurozone – There are great opportunities.
Why European equities now ?
20

Pan European Strategy ▪ Threadneedle (Lux) Pan European Equities Fund
3i
A core Pan European equity offering that provides a broad and diversified exposure.

Portfolio characteristics
22
Pan European equity strategy
Source: Threadneedle as at 30 September 2012. This represents the Europe inc. UK Core Plus composite strategy. Where references are made to portfolio guidelines
and features, these may be subject to change over time and prevailing market conditions. Actual investment parameters will be agreed and set out in the prospectus or
formal investment management agreement. Please note that the performance target may not be attained and is over a rolling 3-year period.
Strategy Pan-European Large Cap
(Europe inc. UK Core Plus)
Outperformance target 2.0% p.a.
Expected tracking error 3%–6%
Expected information ratio 0.5–1.0
Stock weightings +/- 4% versus benchmark
Sector weightings +/-10% versus benchmark
Total AUM in strategy €2.4 billion
Actively seeking the best opportunities

Threadneedle (Lux) Pan European Equities Fund Top 10 positions
Source: Threadneedle as at 31 December 2012. Index is MSCI Europe Index.
23
Stock Sector Fund (%) Index (%) Active (%)
Rio Tinto Mining 3.7 1.1 2.6
Nestlé Food Producers 3.6 2.9 0.7
Allianz Nonlife Insurance 3.2 0.9 2.3
SAP Software & Computer Services 3.1 1.0 2.0
BNP Paribas Banks 3.0 0.8 2.2
Unilever Food Producers 3.0 0.7 2.3
Diageo Beverages 3.0 1.0 1.9
Novartis Pharmaceuticals & Biotechnology 2.8 2.0 0.8
Volkswagen Automobiles & Parts 2.5 0.5 2.1
Anheuser-Busch InBev Beverages 2.3 1.0 1.3
Total 30.1 11.9 18.3
24
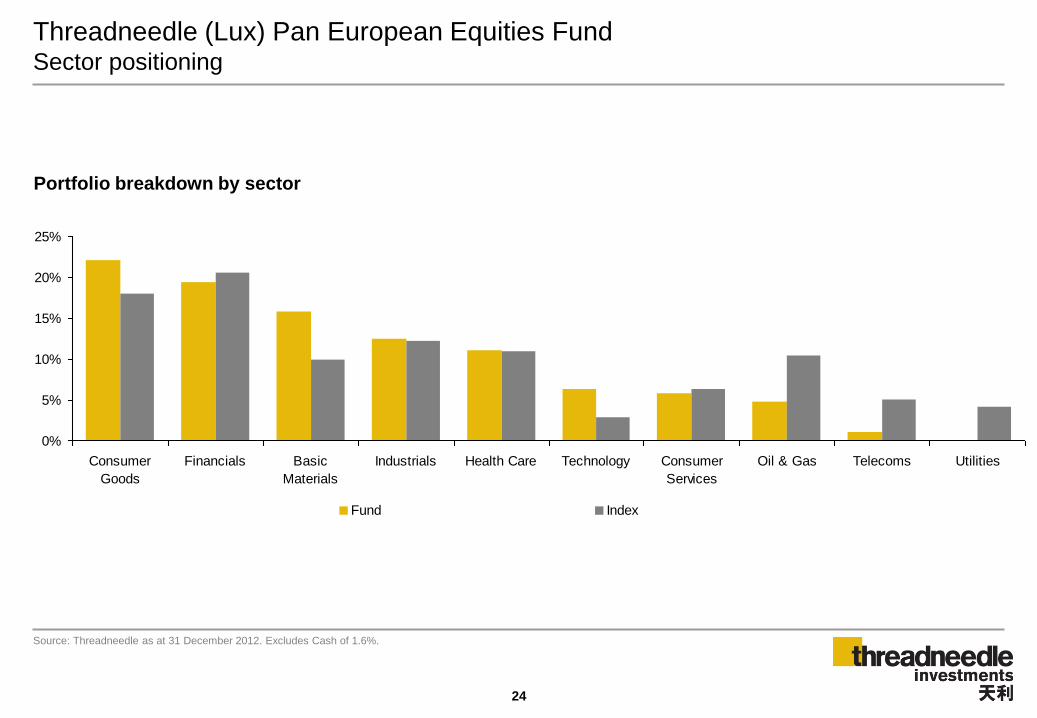
Threadneedle (Lux) Pan European Equities Fund Sector positioning
Source: Threadneedle as at 31 December 2012. Excludes Cash of 1.6%.
0%
5%
10%
15%
20%
25%
Consumer
Goods
Financials Basic
Materials
Industrials Health Care Technology Consumer
Services
Oil & Gas Telecoms Utilities
Fund Index
Portfolio breakdown by sector

25
Threadneedle (Lux) Pan European Equities Fund Geographic breakdown
Source: Threadneedle as at 31 December 2012. Excludes Cash of 1.6%.
Other consists of Austria, Greece, Ireland and Chile.
0%
5%
10%
15%
20%
25%
30%
35%
40%
UK Germany Switzerland France Netherlands Spain Belgium Sweden Denmark Norway Portugal Finland Italy Other
Fund Index
Portfolio breakdown by country

Threadneedle (Lux) Pan European Equities Fund
Source: Style Research as at 31 December 2012.
26
Style Analysis - Portfolio Style SkylineTM

What are we looking for in a company?
27
Strong 3-year relative performance
Source: Threadneedle and DataStream as at 31 December 2012. Performance in EUR and rebased to 100.
Initial purchase – October 2009.
2 Source: Bloomberg as at 9 January 2013.
The mention of stocks is not a recommendation to deal.
Sustainable competitive advantage
Swiss watch heritage cannot be copied by low cost alternatives
Dominance of global watch movement market a strong barrier to
entry and a driver of pricing power
Growth
More than 40% of sales from emerging markets
Market underestimating the strength and profitability of growth
(Asia, Americas underpenetrated)
Stable, experienced management team pursuing a clear, long-
term brand strategy coupled with a strong balance sheet model
Valuation
Trading on P/E of 15.1x (excluding cash) in 2011, falling to 11.5x
(excluding cash) in 2013e
80
100
120
140
160
180
200
220
Jan 09 Jul 09 Jan 10 Jul 10 Jan 11 Jul 11 Jan 12 Jul 12
Reb
ased
= 1
00
Sw atch relative to MSCI Europe Index
Year to Dec2 2012e 2013e
P/E 18.4x 16.6x
EV/EBITDA 11.8x 10.6x
ROE 17% 17%

UBS
1 Source: Datastream, as at 31 December 2012, in local currency.
2 Source: Autonomous estimates.
The mention of stocks is not a recommendation to deal.
28
Leading wealth manager in the world: UBS has a
relationship with half of the world‟s billionaires
Refocusing on wealth management announced in
October 2012 shows management discipline and
realism.
Consensus estimates for a return on equity of 13-
15% by 2015 are too low. ROE could be closer to
18-20%
UBS trades on 1.3x its tangible book value, and
could trade in a 1.6-2.0x range once its
restructuring is complete
28
Absolute performance and relative strength
2-year performance¹
50
60
70
80
90
100
110
120
130
Dec 10 Apr 11 Aug 11 Dec 11 Apr 12 Aug 12 Dec 12
Reb
ased
= 1
00
UBS UBS relative to FTSE W Europe Index
Year to Dec² 2013e 2014e 2015e
P/E 15.0x 12.1x 9.2x
EV/EBITDA 1.3x 1.2x 1.2x
RoE 8.3% 10.4% 13.0%

3ii
Why Small Cap?

Superior growth to large cap
Smaller companies are more flexible and able to adapt to changing market conditions
Entrepreneurial managements
Large opportunity set, greater opportunity to generate alpha
Lower analyst coverage
M&A: Cash-rich large caps likely to boost low organic growth with acquisitions
Valuation appears attractive relative to other asset classes and history
Large caps may be more at risk of government intervention/regulation than small caps.
Attractions of Pan European Small/Mid Cap
30

Characteristics of smaller companies
1 Source: Goldman Sachs International as at 11 July 2012.
2 Source: Datastream, July 2012.
3 Source :JP Morgan as at 31 December 2011.
Dispersion of returns1
-55%-45%-35%-25%-15%-5%5%
15%25%35%45%55%
2001 2002 2003 2004 2005 2006 2007 2008 2009 2010 2011 2012Ou
t-/u
nd
erp
erf
orm
an
ce, 12-
mo
nth
ro
llin
g
75th percentile outperformance Large 75th percentile outperformance Small
25th percentile underperformance Large 25th percentile underperformance Small
Smaller companies outperform2
Risk-adjusted return since 1995
0.27
0.21
0.32
0.230.220.22
0.43
0.35
0.0
0.1
0.2
0.3
0.4
0.5
US
S&
P
500
US
S&
P
600 S
mall
Cap
UK
FT
SE
350
UK
Sm
all
Glo
bal
MS
CI
World
Glo
bal
MS
CI
World
Sm
all
Euro
pe e
x
UK
FT
SE
W.E
uro
pe
exU
KE
uro
pe e
x
UK
HS
BC
Sm
alle
r
Euro
pe e
x
Ris
k a
dju
ste
d r
etu
rn
31
Fewer analysts1
10
15
20
25
30
35
Less than €3 bn €3 - €5 bn €5 - €10 bn Greater than €10
bnMarket cap size
No
. o
f an
aly
sts
Sales growth – outperforming in 19 of the last 22
years3

Small Caps – Why now?
Source: JPMorgan – 10 January 2013. Pan European data.
PE Yr+1
Current
PE Yr+1
15 yr avg
P/B
Current
P/B
15 yr avg
EPS growth
2012e
EPS growth
2013e
Small/Mid Caps 12.2x 14.5x 1.9x 2.5x 4.9% 19.7%
Large Caps 13.3x 16.2x 2.3x 2.9x 5.9% 13.2%
Small/Mid caps are trading at a discount to 15-year average multiples
Small/Mid caps are expected to grow faster than Large caps
32

Structural growth – five examples
Theme Implication How can we benefit
European austerity Decline in consumer spending
Downtrading
Cheap US natural gas Improved US competitiveness
Reinvestment in basic industries
Ageing populations Increased incidence of cancer
Emerging market growth Consumption of luxury goods
Energy and environment Demand for energy-efficient
solutions
33

What makes a good business model?
34
1 Pricing power Fragmented
supplier base
Diverse customer base Dominant market position
2. Barriers to entry
Value added know-how
Scale
Regulatory compliance
Mission critical
+ =
A sustainably
high return on
capital
3 Structural growth drivers
Emerging market growth
Outsourcing
Supply chain efficiency/increased productivity
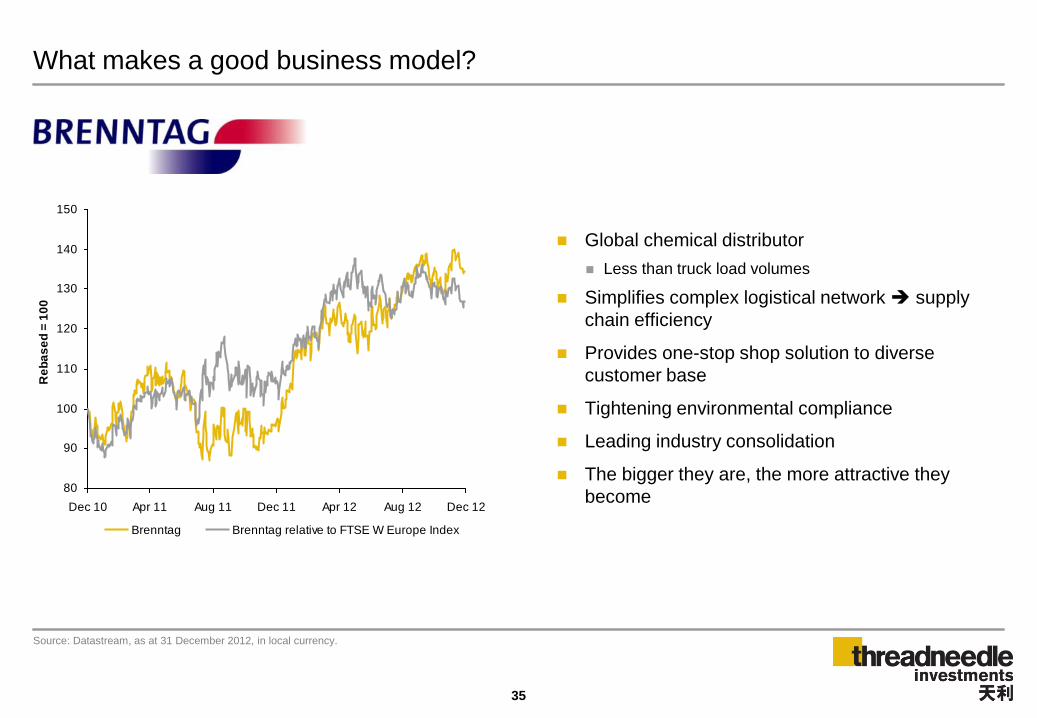
What makes a good business model?
Source: Datastream, as at 31 December 2012, in local currency.
35
Global chemical distributor
Less than truck load volumes
Simplifies complex logistical network supply
chain efficiency
Provides one-stop shop solution to diverse
customer base
Tightening environmental compliance
Leading industry consolidation
The bigger they are, the more attractive they
become 80
90
100
110
120
130
140
150
Dec 10 Apr 11 Aug 11 Dec 11 Apr 12 Aug 12 Dec 12
Re
ba
se
d =
10
0
Brenntag Brenntag relative to FTSE W Europe Index
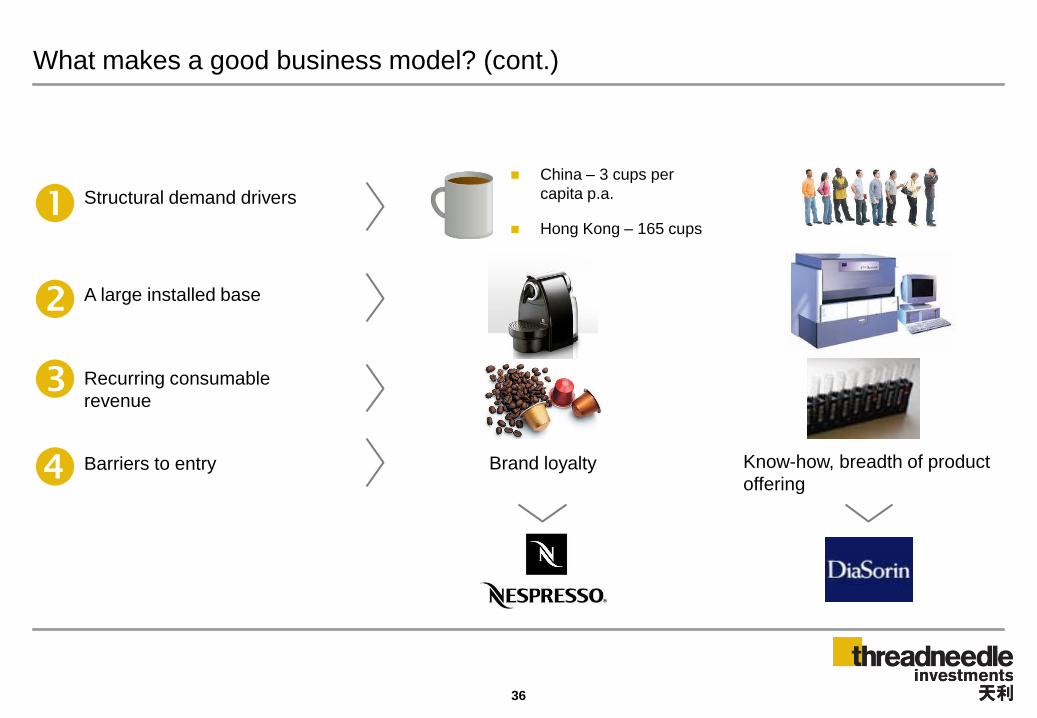
What makes a good business model? (cont.)
36
Structural demand drivers
A large installed base
Recurring consumable
revenue
Barriers to entry Know-how, breadth of product
offering Brand loyalty
China – 3 cups per
capita p.a.
Hong Kong – 165 cups
3iii
Pan European Smaller Companies Strategy ▪ Threadneedle (Lux) Pan European Small Cap Opportunities Fund
A well-diversified portfolio of smaller company Pan European stocks.
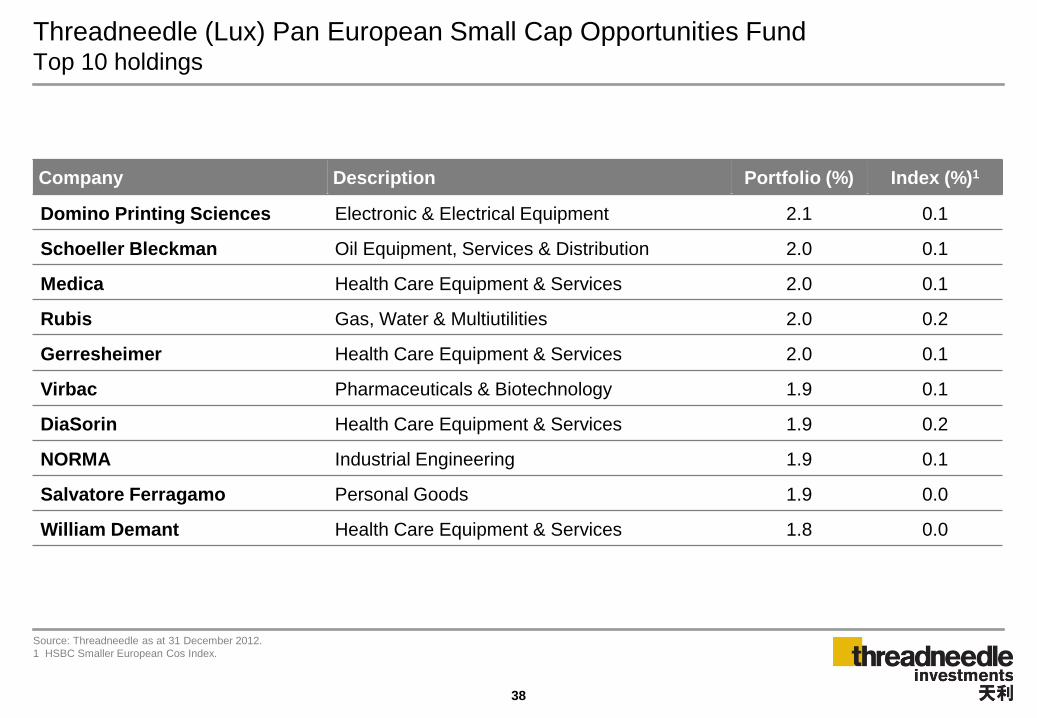
Company Description Portfolio (%) Index (%)1
Domino Printing Sciences Electronic & Electrical Equipment 2.1 0.1
Schoeller Bleckman Oil Equipment, Services & Distribution 2.0 0.1
Medica Health Care Equipment & Services 2.0 0.1
Rubis Gas, Water & Multiutilities 2.0 0.2
Gerresheimer Health Care Equipment & Services 2.0 0.1
Virbac Pharmaceuticals & Biotechnology 1.9 0.1
DiaSorin Health Care Equipment & Services 1.9 0.2
NORMA Industrial Engineering 1.9 0.1
Salvatore Ferragamo Personal Goods 1.9 0.0
William Demant Health Care Equipment & Services 1.8 0.0
Threadneedle (Lux) Pan European Small Cap Opportunities Fund Top 10 holdings
Source: Threadneedle as at 31 December 2012.
1 HSBC Smaller European Cos Index.
38

Threadneedle (Lux) Pan European Small Cap Opportunities Fund Sector weightings
Source: Threadneedle as at 31 December 2012. Excludes cash at 1.7%.
1 HSBC Smaller European Cos Index.
Sector Portfolio (%) Index (%)1
Industrials 30.8 25.4
Health Care 18.7 6.6
Consumer Goods 12.4 10.2
Financials 11.7 21.8
Basic Materials 8.0 6.1
Oil & Gas 5.7 7.0
Technology 4.3 6.1
Consumer Services 3.1 13.5
Utilities 2.0 1.8
Telecoms 1.6 1.4
Unclassified 0.0 0.1
0%
5%
10%
15%
20%
25%
30%
35%
Industr
ials
Health C
are
Consum
er
Goods
Fin
ancia
ls
Basic
Mate
rials
Oil
& G
as
Technolo
gy
Consum
er
Serv
ices
Utilit
ies
Tele
com
s
Uncla
ssifie
d
Fund Index
Threadneedle (Lux) Pan European Small Cap
Opportunities Fund
39

Threadneedle (Lux) Pan European Small Cap Opportunities Fund Country profile
Source: Threadneedle as at 31 December 2012. Excludes cash at 1.7%.
Other includes: Greece, Portugal, Malaysia, Peru, Bermuda and US.
1 HSBC Smaller European Cos Index.
Sector Portfolio (%) Index (%)1
UK 23.4 28.0
Germany 20.9 9.8
France 13.7 8.9
Italy 6.6 8.1
Sweden 5.8 7.1
Switzerland 5.2 7.6
Denmark 4.9 2.5
Austria 4.8 2.2
Norway 4.7 4.6
Finland 2.6 3.6
Netherlands 1.9 3.5
Ireland 1.3 1.5
Israel - Domestic 0.9 0.0
Belgium 0.8 3.2
Spain 0.6 5.1
Other 0.0 4.2
0%
5%
10%
15%
20%
25%
30%
35%
UK
Germ
any
Fra
nce
Italy
Sw
eden
Sw
itzerland
Denm
ark
Austr
ia
Norw
ay
Fin
land
Neth
erlands
Irela
nd
Isra
el -
Dom
estic
Belg
ium
Spain
Oth
er
Fund Index
Threadneedle (Lux) Pan European Small Cap
Opportunities Fund
40

Threadneedle (Lux) Pan European Small Cap Opportunities Fund
Source: Style Research as at 31 December 2012.
Style Analysis - Portfolio Style SkylineTM
41

Elekta
Porter’s Five Forces
1 Source: Datastream, as at 31 December 2012, in local currency (Swedish Krona).
2 Source: Bloomberg, as at 24 January 2013.
The mention of stocks is not a recommendation to deal.
42
+ Growth
EM healthcare spend
Increasing cancer
incidence
Ageing population
Reducing
(e.g. Siemens
quitting sector)
Degree of rivalry
Technology
Regulatory approval
References
Barriers to entry
Low
Other oncology
treatment
Threat of
substitution
Main input is own
intellectual
property
Supplier power
Medium (high-cost
product)
Buyer power
Absolute performance and relative strength
2-year performance¹
Year to April2 2013e 2014e
P/E 25.2x 20.8x
EV/EBITDA 16.0x 13.8x
RoE 27% 27%
80
100
120
140
160
180
Dec 10 Apr 11 Aug 11 Dec 11 Apr 12 Aug 12 Dec 12
Re
ba
se
d =
10
0
Elekta Elekta relative to FTSE W Europe Index
42

William Demant
Porter’s Five Forces
1 Source: Datastream, as at 31 December 2012, in local currency.
2 Source: Bloomberg, as at 24 January 2013.
The mention of stocks is not a recommendation to deal.
43
+ Growth
Ageing
population
Low penetration
Innovation
Absolute performance and relative strength
2-year performance¹
85
95
105
115
125
135
145
155
Dec 10 Apr 11 Aug 11 Dec 11 Apr 12 Aug 12 Dec 12
Re
ba
se
d =
10
0
William Demant William Demant relative to FTSE W Europe Index
Year to Dec² 2012e 2013e 2014e
P/E 23.4x 18.8x 16.6x
EV/EBITDA 15.8x 13.6x 12.4x
RoE 34% 35% 33%
43
Oligopoly
Weak competitors
Degree of rivalry
Scale
R&D investment
Distribution
Barriers to entry
Very low
Threat of
substitution
Low
Supplier power
Very fragmented
But consolidating
Buyer power

Investment Process
AP1

A company‟s intrinsic value is determined by its growth, returns on capital and its sustainable competitive
advantage
The market typically underestimates the potential of some companies to increase their intrinsic value
Targeted research will enable us to identify these companies
European equity philosophy
Our core portfolios tend to display a growth bias
45

European equity investment process
46
Idea generation
Macro and themes
European equity team and other
investment professionals
Company meetings
Implementation
Portfolio construction
Risk management
Research / debate
Stock analysis
Investable universe – 2,400 companies
600 stocks researched
50-70 holdings

Idea generation
47
Company meetings, site visits and contacts
1,200+ meetings each year
Provides insight into competitors, suppliers and wider industry
Daily team meeting and informal discussions
Forum for discussion of short-term news
Interaction with other teams on specific stocks and
themes
Global / credit inputs
Weekly stock reviews
Interpretation of future trends, margins, pricing etc.
Valuation analysis
Quarterly strategy and sector reviews
Industry trends and changes assessed
Stock recommendations
Macro and themes
European Equity team and other
investment professionals
Company meetings
Idea generation
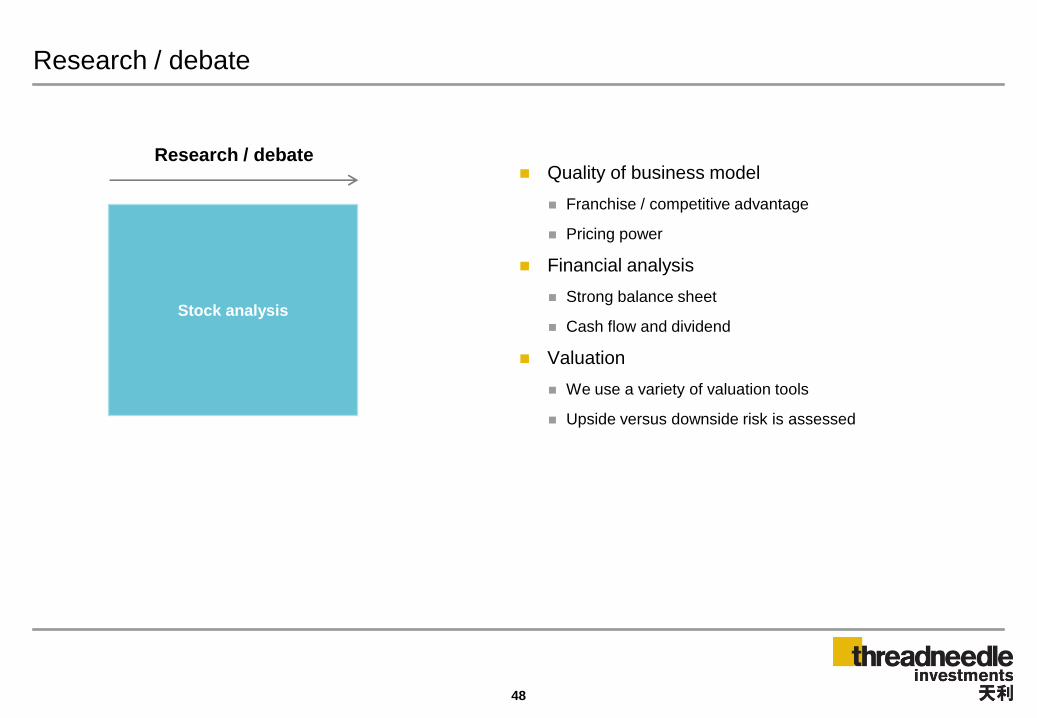
Research / debate
48
Quality of business model
Franchise / competitive advantage
Pricing power
Financial analysis
Strong balance sheet
Cash flow and dividend
Valuation
We use a variety of valuation tools
Upside versus downside risk is assessed
Research / debate
Stock analysis

Implementation
49
Position sizes determined by:
Upside potential
Impact on the portfolio‟s risk exposure
Liquidity
On-going assessment
Holdings monitored against valuation / performance targets
New stock ideas; new themes
Sell discipline
Changing risk / reward characteristics
Competition for capital
Target price reached
Portfolio
Risk management
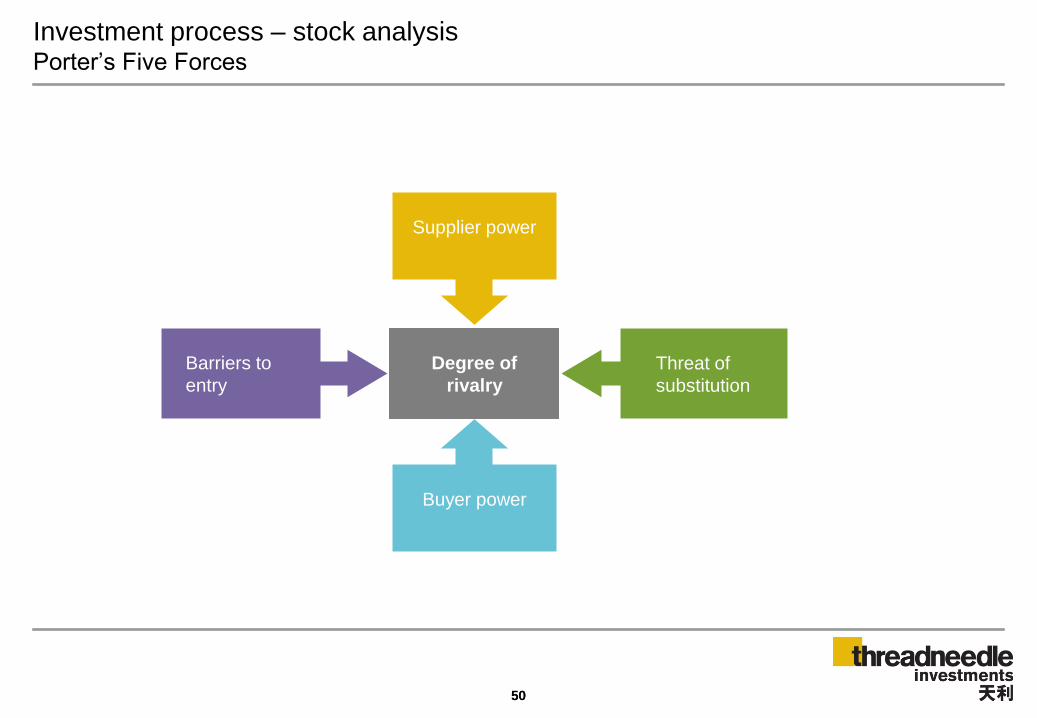
Investment process – stock analysis Porter‟s Five Forces
50 50
Buyer power
Degree of
rivalry
Barriers to
entry
Threat of
substitution
Supplier power
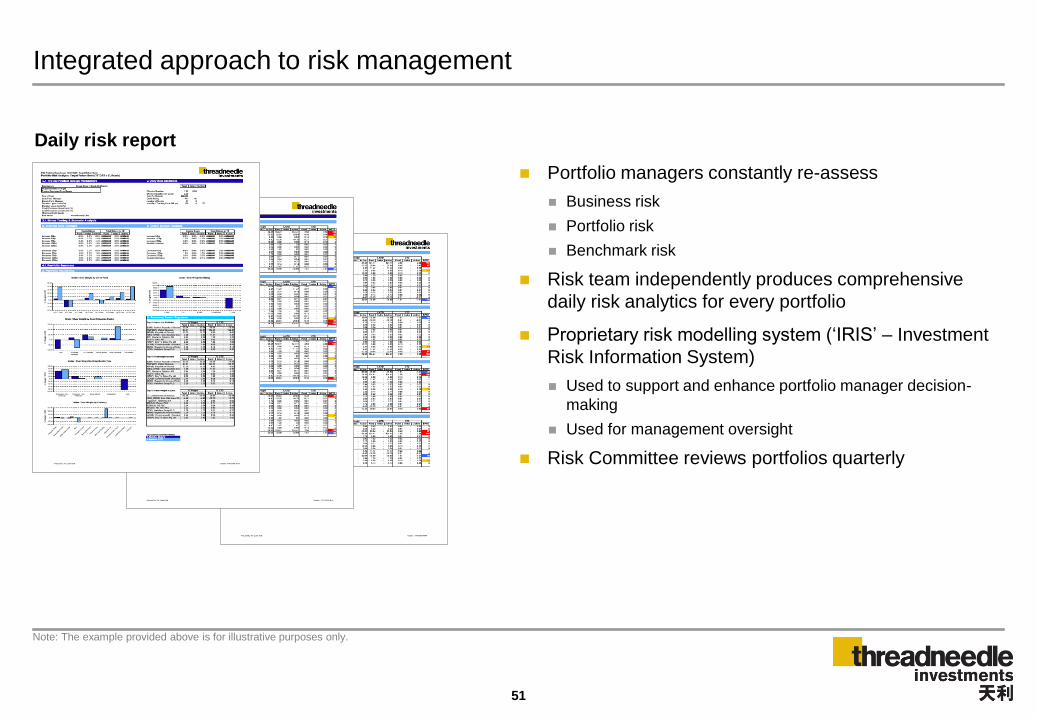
Integrated approach to risk management
Note: The example provided above is for illustrative purposes only.
51
Portfolio managers constantly re-assess
Business risk
Portfolio risk
Benchmark risk
Risk team independently produces comprehensive
daily risk analytics for every portfolio
Proprietary risk modelling system („IRIS‟ – Investment
Risk Information System)
Used to support and enhance portfolio manager decision-
making
Used for management oversight
Risk Committee reviews portfolios quarterly
Daily risk report

52
The research and analysis included in this document have not been prepared in accordance with the legal requirements designed to promote its independence and have been
produced by Threadneedle for its own management activities, may have been acted upon prior to publication and is made available here incidentally. Any opinions expressed are
made as at the date of publication but are subject to change without notice. Information obtained from external sources is believed to be reliable but its accuracy or completeness
cannot be guaranteed. This document is for the sole use of those attending the presentation. It may not be reproduced in any form or passed on to any third party without the
express written permission of Threadneedle. This document is the property of Threadneedle and must be returned upon request.
Past performance of the fund and its manager and any forecasts or information on the economic trends are not necessarily indicative of the future or likely performance of the
fund or its manager or a guarantee of future trends. The price of shares and the income accruing to those shares, if any, may fall or rise and an investor may not get back the
amount invested. Due to the investment policies of the fund, it may experience greater volatility in its net asset value.
Threadneedle does not give any investment advice. The mention of any specific shares or bonds should not be taken as a recommendation to deal. This document is for
informational purpose only and does not constitute an offer or solicitation of an order to buy or sell any securities or other financial instruments or to provide investment advice or
services. Investors are advised to exercise caution. If you are in any doubt about any of the contents of this document, you should obtain independent professional advice.
A Singapore prospectus (“Prospectus”) can be obtained free of charge from any of our authorized distributors or downloaded from www.threadneedle.com. Investors should read
the Prospectus for further details before deciding whether to subscribe for or purchase shares. The Fund may invest in financial derivative instruments to the extent permitted
under relevant laws. Past performance of the Fund and its Manager and any forecasts or information on the economic trends are not necessarily indicative of the future or likely
of the Fund or its Manager or a guarantee of future trends. The information provided in this document is for informational purpose only and does not constitute an offer or
solicitation of an order to buy or sell any securities or other financial instruments, or to provide investment advice or services. This publication does not have regard to the specific
investment objective(s), financial situation or the particular needs of any person. Investors may wish to seek advice from financial adviser before making a commitment to invest.
In the event of an investor chooses not to seek advice from a financial adviser, the investor should consider whether the Fund is suitable for him. Threadneedle (Lux) is an
investment company with variable capital (Société d‟investissement à capital variable, or “SICAV”) formed under the laws of the Grand Duchy of Luxembourg. The SICAV issues,
redeems and exchanges shares of different classes, which are listed on the Luxembourg Stock Exchange. Threadneedle Management Luxembourg S.A is advised by
Threadneedle Asset Management Ltd. and/or selected sub-advisors. Threadneedle Management Luxembourg S.A has appointed State Street Bank and Trust Company –
Singapore Branch as its Singapore representative.
Issued in Singapore by Threadneedle Investments Singapore (Pte.) Limited, 3 Killiney Road, #07-07, Winsland House 1, Singapore 239519. Regulated in Singapore by the
Monetary Authority of Singapore under the Securities and Futures Act (Chapter 289). License number: CMS100182-1. This document is not a prospectus as defined in the SFA.
Accordingly, statutory liability under the SFA in relation to the content of prospectuses would not apply. Threadneedle Investments is a brand name and both the Threadneedle
Investments name and logo are trademarks or registered trademarks of the Threadneedle group of companies.
Important Information – Singapore