thomas porathe, information design, mälardalen university, sweden 3d chart visualization 1...
TRANSCRIPT
1
Thomas Porathe, Information Design, Mälardalen University, Sweden 3D chart visualization
Real-Time 3D Nautical
Navigational Visualisation
Thomas Porathe
Information Design
Department of Innovation, Design and Product Development
Mälardalen University
Sweden

2
Thomas Porathe, Information Design, Mälardalen University, Sweden 3D chart visualization
Problem
• Shorter and shorter time for decision making due to higher and higher speeds of vessels and more and more instruments to watch.

3
Thomas Porathe, Information Design, Mälardalen University, Sweden 3D chart visualization
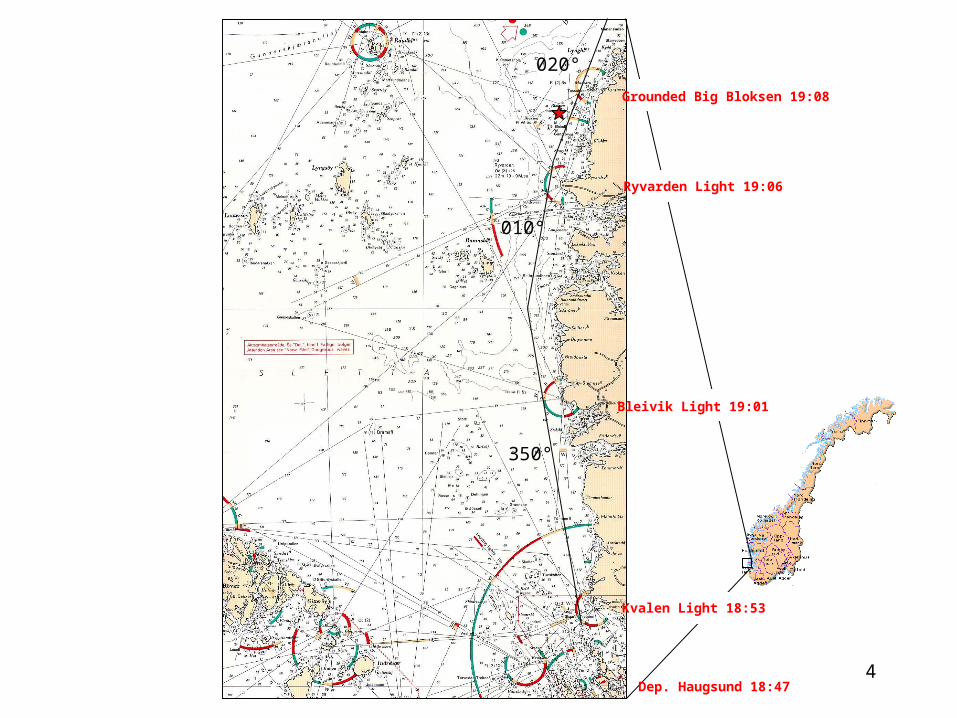
High Speed Craft (HSC) “Sleipner” grounded on the 26th of Nov. 1999
4
Thomas Porathe, Information Design, Mälardalen University, Sweden 3D chart visualization
350°
010°
020°
Kvalen Light 18:53
Bleivik Light 19:01
Ryvarden Light 19:06
Dep. Haugsund 18:47
Grounded Big Bloksen 19:08

5
Thomas Porathe, Information Design, Mälardalen University, Sweden 3D chart visualization
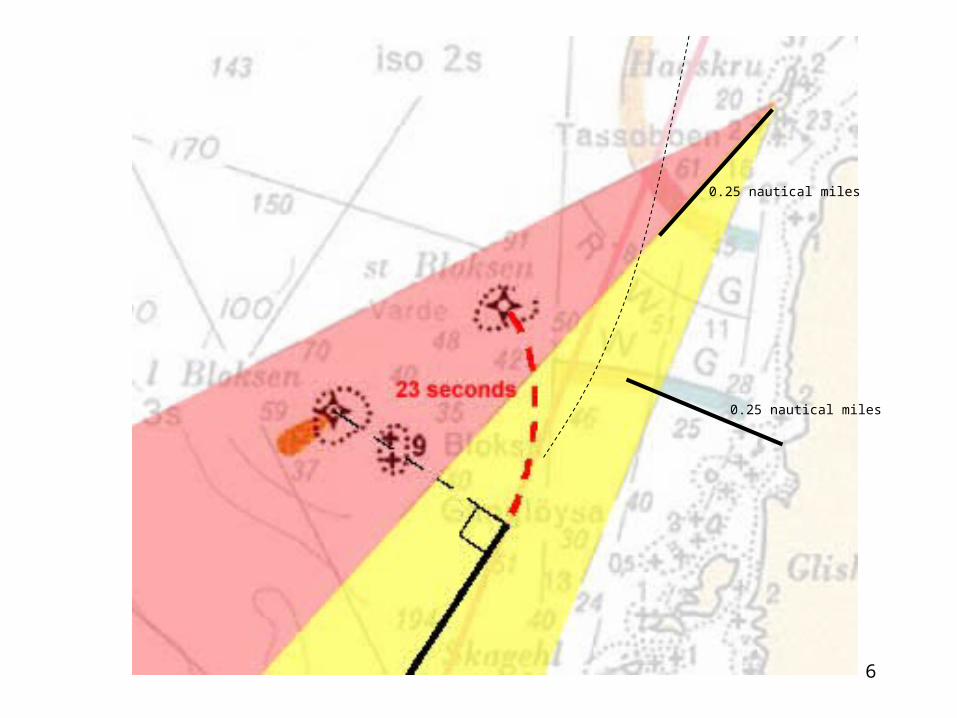
19:06
6
Thomas Porathe, Information Design, Mälardalen University, Sweden 3D chart visualization
0.25 nautical miles
0.25 nautical miles

7
Thomas Porathe, Information Design, Mälardalen University, Sweden 3D chart visualization

8
Thomas Porathe, Information Design, Mälardalen University, Sweden 3D chart visualization
9
Thomas Porathe, Information Design, Mälardalen University, Sweden 3D chart visualization
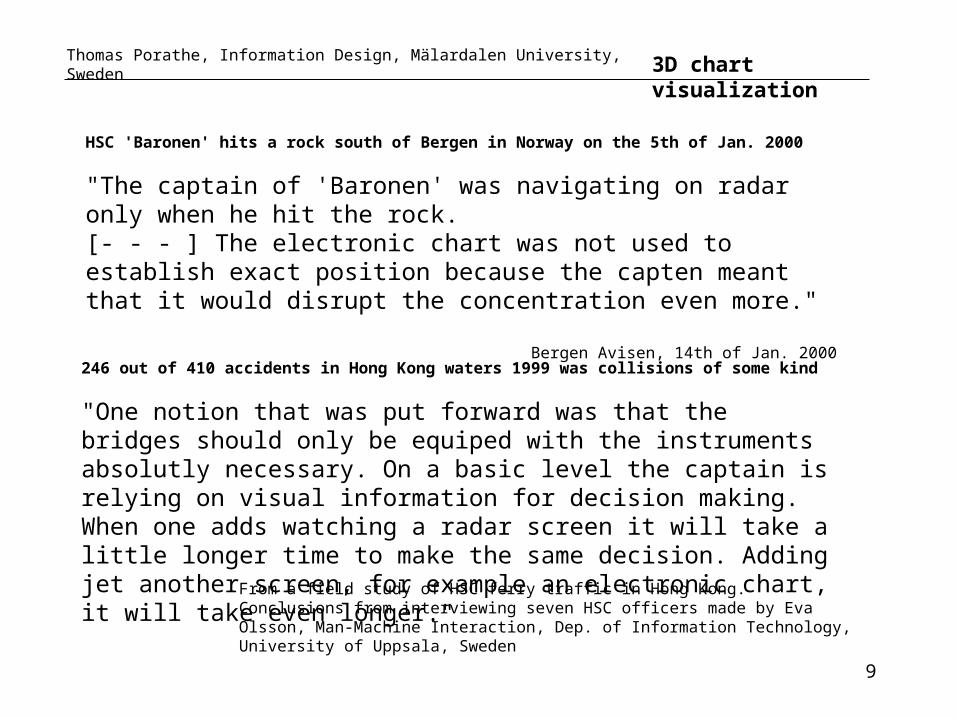
HSC 'Baronen' hits a rock south of Bergen in Norway on the 5th of Jan. 2000
"The captain of 'Baronen' was navigating on radar only when he hit the rock.[- - - ] The electronic chart was not used to establish exact position because the capten meant that it would disrupt the concentration even more."
Bergen Avisen, 14th of Jan. 2000
246 out of 410 accidents in Hong Kong waters 1999 was collisions of some kind
"One notion that was put forward was that the bridges should only be equiped with the instruments absolutly necessary. On a basic level the captain is relying on visual information for decision making. When one adds watching a radar screen it will take a little longer time to make the same decision. Adding jet another screen, for example an electronic chart, it will take even longer."
From a field study of HSC ferry traffic in Hong Kong. Conclusions from interviewing seven HSC officers made by Eva Olsson, Man-Machine Interaction, Dep. of Information Technology, University of Uppsala, Sweden
10
Thomas Porathe, Information Design, Mälardalen University, Sweden 3D chart visualization
Is it fair to say that navigation tools like
- Radars - Charts - Compasses
take an effort to translate into visualisationand therefore are not used in all situations where they should have been used?
The effort takes time.
Time is what we are running short of.
11
Thomas Porathe, Information Design, Mälardalen University, Sweden 3D chart visualization
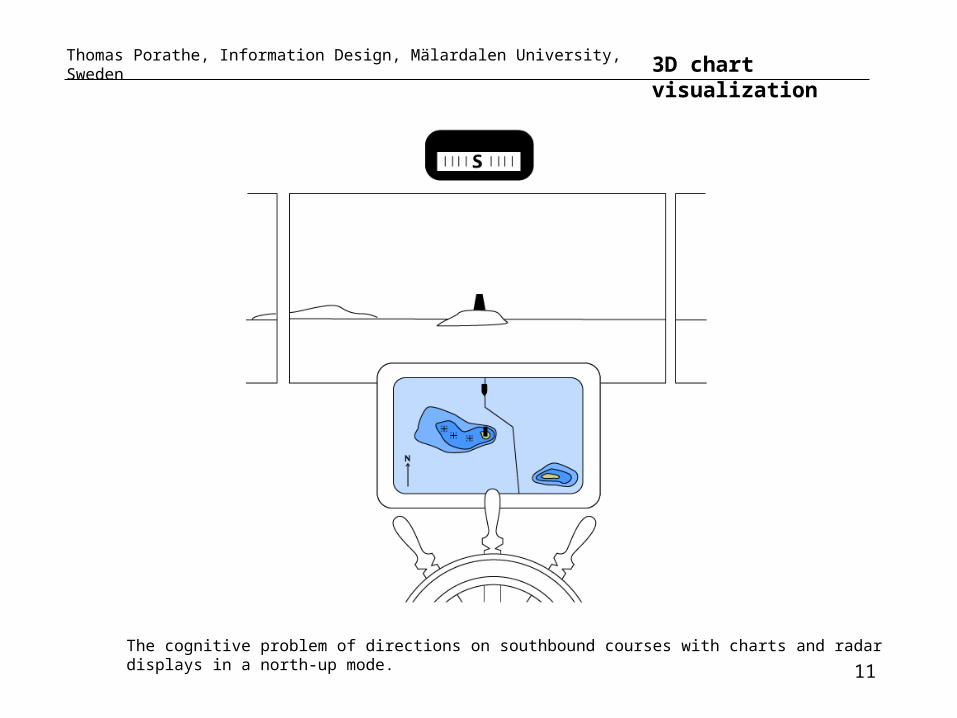
The cognitive problem of directions on southbound courses with charts and radar displays in a north-up mode.

12
Thomas Porathe, Information Design, Mälardalen University, Sweden 3D chart visualization
The cognitive problem of directions on southbound courses with charts and radar displays in a north-up mode.

13
Thomas Porathe, Information Design, Mälardalen University, Sweden 3D chart visualization
The cognitive problem of directions on southbound courses with charts and radar displays in a north-up mode.

14
Thomas Porathe, Information Design, Mälardalen University, Sweden 3D chart visualization
A 3D-chart with a display in a bridge-view perspective solves the directional problem.

15
Thomas Porathe, Information Design, Mälardalen University, Sweden 3D chart visualization
Cognitive maps Spatial Mental ModelsBarbara Tversky, 1993

16
Thomas Porathe, Information Design, Mälardalen University, Sweden 3D chart visualization
A screen dump from 3D-chart connected to a electronic raster chart. Entrance to the Åland archipelago in the Baltic sea. Position and view direction marked in the raster chart. A click on Marhällan light reveals attributes as well as high lights it position in the raster chart.

17
Thomas Porathe, Information Design, Mälardalen University, Sweden 3D chart visualization
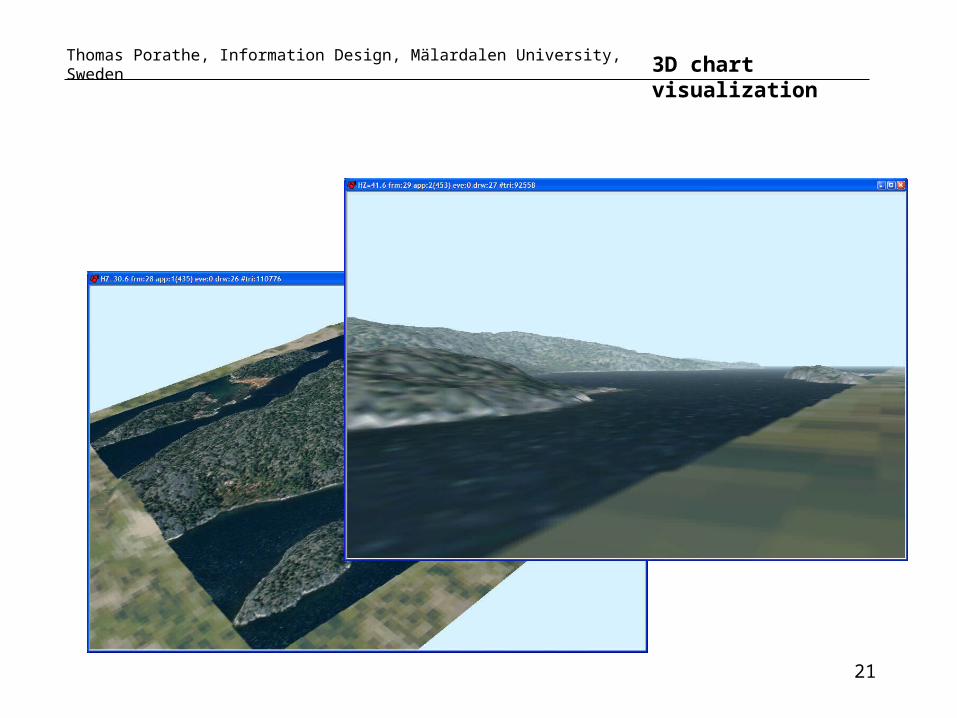
Features of the 3D-chart. Åland archipelago.

18
Thomas Porathe, Information Design, Mälardalen University, Sweden 3D chart visualization
Start Stop
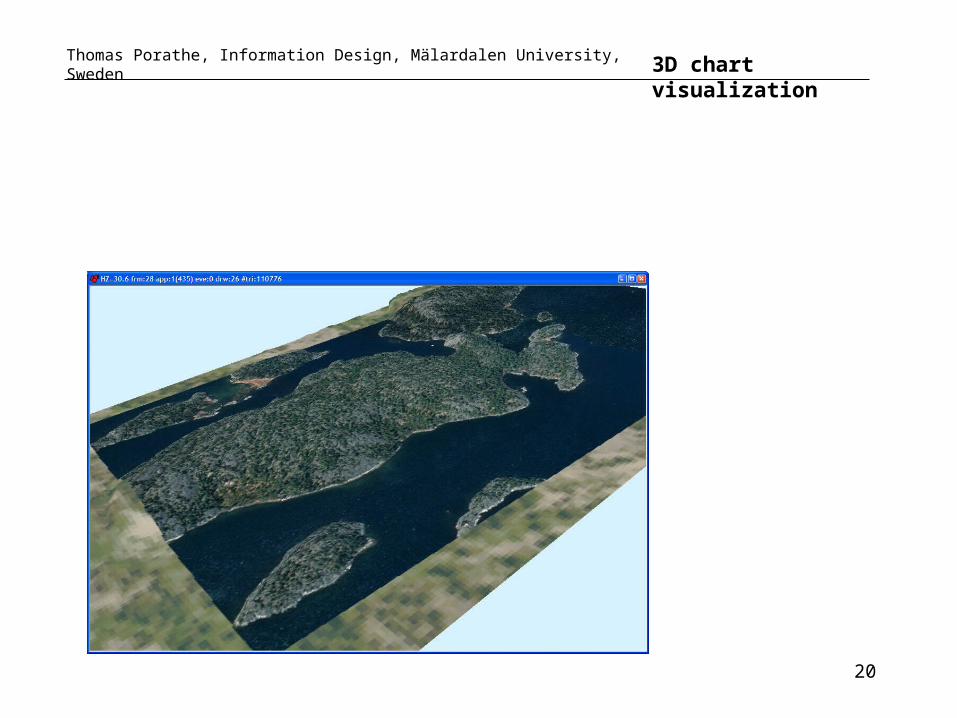
Real-time 3D demonstrator
19
Thomas Porathe, Information Design, Mälardalen University, Sweden 3D chart visualization
20
Thomas Porathe, Information Design, Mälardalen University, Sweden 3D chart visualization
21
Thomas Porathe, Information Design, Mälardalen University, Sweden 3D chart visualization

22
Thomas Porathe, Information Design, Mälardalen University, Sweden 3D chart visualization
Conclution
On going work: tree visualisation, getting the right silhouette on forested islands.
Next step: get a working prototype in a HSC
The big question: Will it be used?