this work is licensed under a creative commons attribution...
TRANSCRIPT

Copyright 2007, The Johns Hopkins University and Kenrad Nelson. All rights reserved. Use of these materials permitted only in accordance with license rights granted. Materials provided “AS IS”; no representations or warranties provided. User assumes all responsibility for use, and all liability related thereto, and must independently review all materials for accuracy and efficacy. May contain materials owned by others. User is responsible for obtaining permissions for use from third parties as needed.
This work is licensed under a Creative Commons Attribution-NonCommercial-ShareAlike License. Your use of this material constitutes acceptance of that license and the conditions of use of materials on this site.

Case-Control Studies in Infectious Diseases
Kenrad E. Nelson, MDJohns Hopkins University

3
Case Control Studies in Infectious Disease Epidemiology
May be very important in outbreaks of acute infectious disease to define:−
Relationship of an infectious agent to a clinical syndrome
−
Important risk factors operative in infectious disease outbreaks
Often must be done quickly during an acute infectious disease in order to control the epidemicCareful attention must be given to reliable measurement of relevant variables and selection of an appropriate control group
Section A
Toxic Shock Syndrome (TSS)
5
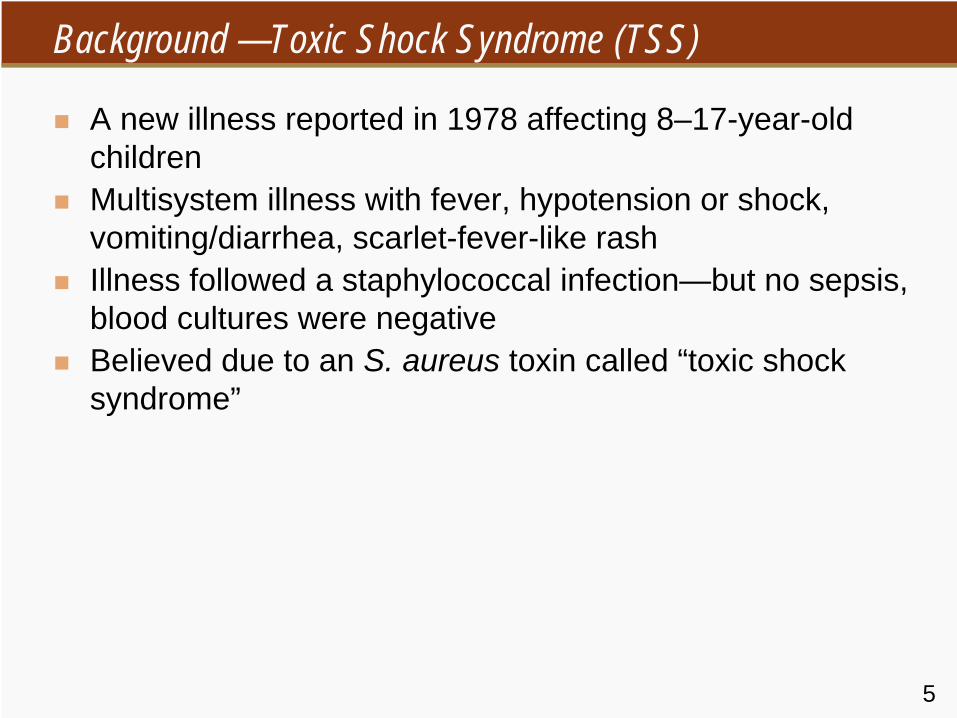
Background —Toxic Shock Syndrome (TSS)
A new illness reported in 1978 affecting 8–17-year-old childrenMultisystem illness with fever, hypotension or shock, vomiting/diarrhea, scarlet-fever-like rashIllness followed a staphylococcal infection—but no sepsis, blood cultures were negativeBelieved due to an S. aureus toxin called “toxic shock syndrome”

6
Background—Toxic Shock Syndrome (TSS)
January 1980−
Epidemiologists in Wisconsin and Minnesota reported several cases of a similar illness to the TSS cases in children among young women
Symptoms were shock, multisystem illness, and rash of sudden onset during menstrual period, without known cause

7
Toxic Shock Syndrome Case Definition (CDC)
1. Fever ≥
102°F2. Rash diffuse, macular, erythema3. Desquamation (after 1–2 weeks4. Hypotension (Bp < 90 mm) or shock5. Multisystem illness (GI, Renal, Hem, CNS)6. Negative work-up for known causes

8
Reported Cases of Toxic Shock Syndrome, U.S. 1970–80

9
Toxic Shock Syndrome: Menstrual Cycle

10
Reported Cases of Toxic Shock Syndrome, U.S., 1970–80

11
Wisconsin Case-Control Study of Toxic Shock Syndrome
Thirty-eight cases of toxic shock syndrome reported to Wisconsin State Health dept. before 30 June 1980−
37 cases were women and 35 cases occurred during menses
Three controls per case (N = 105) were selected from a population of non-pregnant women presenting for routine gynecologic care to a clinic in Madison, Wisconsin, matched for age (+/- 2 years) to the case
12
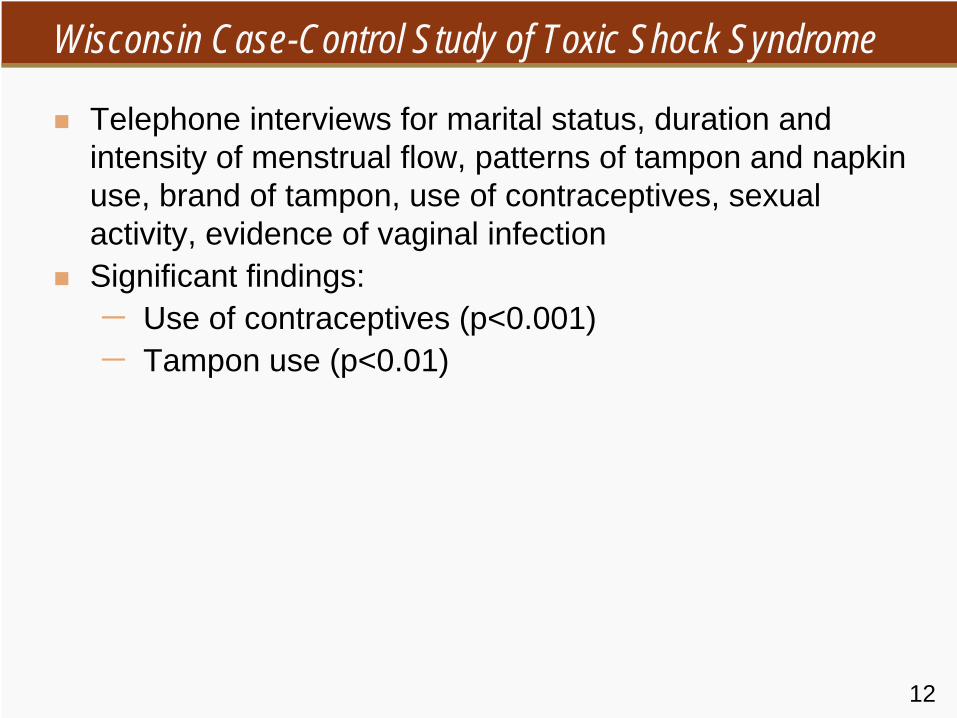
Wisconsin Case-Control Study of Toxic Shock Syndrome
Telephone interviews for marital status, duration and intensity of menstrual flow, patterns of tampon and napkin use, brand of tampon, use of contraceptives, sexual activity, evidence of vaginal infectionSignificant findings:−
Use of contraceptives (p<0.001)
−
Tampon use (p<0.01)

13
First CDC Study of Toxic Shock Syndrome
Fifty-two cases of toxic shock syndrome that met the CDC definition (fever, rash, hypotension, desquamation, multisystem involvement, and other specific rash-type illnesses excluded)All cases were menstruating women reported to CDC between January 25, 1980, and June 13, 1980One control was matched to each case: a female friend within three years of age and willing to be interviewed

14
First CDC Study of Toxic Shock Syndrome
Cases and controls asked about marital status, fecundity, contraceptive methods, frequency of sexual intercourse, intercourse during menstruation, use of tampons or sanitary napkins—type, brand, absorbency and continuity of useCases questioned about index menses prior to illness, controls questioned about most recent mensesInterviews done June 13–19, 1980

15
First CDC Study: Findings
1. Significant association with tampon use 100% (cases) vs. 85% (controls)
2. Significant continuous use of tampons, i.e., through day and night, among cases
3. No differences in cases and controls in amount or duration of menses
4. Significantly fewer cases (35%) than controls (47%) were contraceptive users
5. No association of toxic shock syndrome with any particular brand of tampon

16
Distribution of Tampon Brands

17
Second CDC Study: Findings
Cases reported to CDC between July 1 and September 5, 1980, that met case definition of toxic shock syndrome occurring during menses and had not been included in another survey (N = 50)Three controls (friends of case) chosen for each case and matched for age (+/- 3) years (N = 150)Telephone interviews September 5–8, 1980All participants asked to check the tampon box and read label to investigatorSignificant association with:−
Tampon use (cases = 100%, controls = 83%)
−
Use of Rely tampons (cases = 75%, controls = 26%)Rely tampons withdrawn from market on September 22, 1980
18
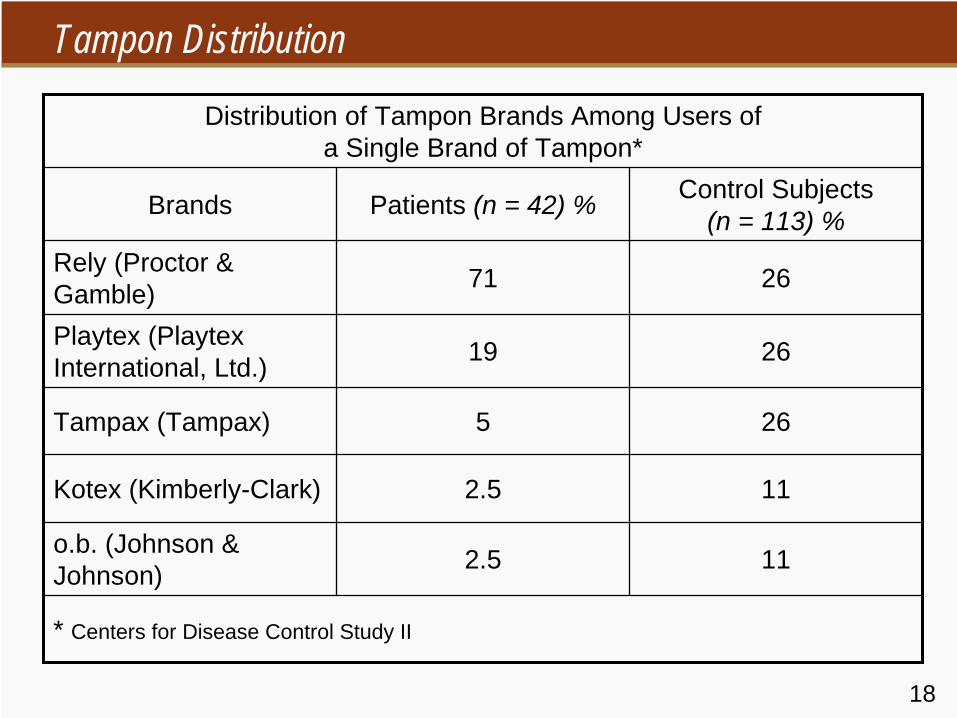
Tampon Distribution
Distribution of Tampon Brands Among Users of a Single Brand of Tampon*
Brands Patients (n = 42) % Control Subjects (n = 113) %
Rely (Proctor & Gamble) 71 26
Playtex (Playtex International, Ltd.) 19 26
Tampax (Tampax) 5 26
Kotex (Kimberly-Clark) 2.5 11
o.b. (Johnson & Johnson) 2.5 11
* Centers for Disease Control Study II

19
Tampon Characteristics
Before 1977, all tampon products were made of rayon or a blend of rayon and cottonSince 1977, 44% of tampon products, representing 65% of the estimated market, have contained more absorbent synthetic materials, including poly-acrylate fibers, carboxmethyl cellulose, high-absorbency rayon cellulose, and polyester foam (“super tampons,” e.g., Rely)Not sterile, but contained toxin-producing S. aureus on culture at CDCVery absorbent—can be left in place for longer periodsMore prone than rayon-cotton tampons to produce mucosal abrasions (and possible absorption of toxins)

20
Tampon Use in Case-Control Pairs
Yes No
Yes 44 0
Controls
No 8 0
52 0
OR = 8/0 (8/0.5 Approx) = 16, p = < 0.02

21
Tampon Use in Studies of Toxic Shock Syndrome
Cases Controls OR
1. CDC #1: June 1980 52/52 (100%) 43/52 (85%) 20.1*
2. Wisconsin Health Department: 1980 34/35 (97%) 80/105 (76%) 7.3*
3. CDC #2: September 1980 50/50 (100%) 125/150 (83%) 21.5*
4. Utah: August 1980 29/29 (100%) 70/91 (77%) 18.0*
5. Tri-State: October–November 1980 75/76 (99%) 123/152 (81%) 12.0*
6. Oregon: January–March 1981 18/18 (100%) 14/18 (78%) 16/18 (89%)
11.5* 5.6*
*p < .05

22
Effect of Treatment with BLRA
Effect of treatment with beta-lactamase-resistant antibiotics (BLRA) during the initial episode of TSS on the rate of recurrence of TSS
Mos. after1st episode Treated with BLRA Not treated with BLRA P
Value*
No. ofpatients
CumulativeNo. with
recurrences
No. ofpatients
CumulativeNo. with
recurrences1 19 0 13 8 0.0001
2 19 1 13 9 0.0002
3 16 1 13 9 0.0004*All were statistically significant by FisherÕs exact test.

23
Reported Cases of TSS by Quarter, U.S., 1979–1990

Section B
Reye's Syndrome (RS): Background

25
Reye's Syndrome Background
1. In 1963, Reye et al. described a syndrome of acute encephalopathy with fatty degeneration of the liver following a febrile illness
2. Patients had no inflammation of liver or brain. Cerebral edema was the main pathological finding.
3. Patients with RS had elevated transminase with hypoglycemia

26
Reye's Syndrome Background
4. Patients became drowsy or comatose, clinically5. RS resembled intoxication6. In October 1963, outbreaks of RS following an
Influenza B epidemic in North Carolina7. Subsequently, outbreaks of RS frequently followed
Influenza epidemics (1963–1981)
27
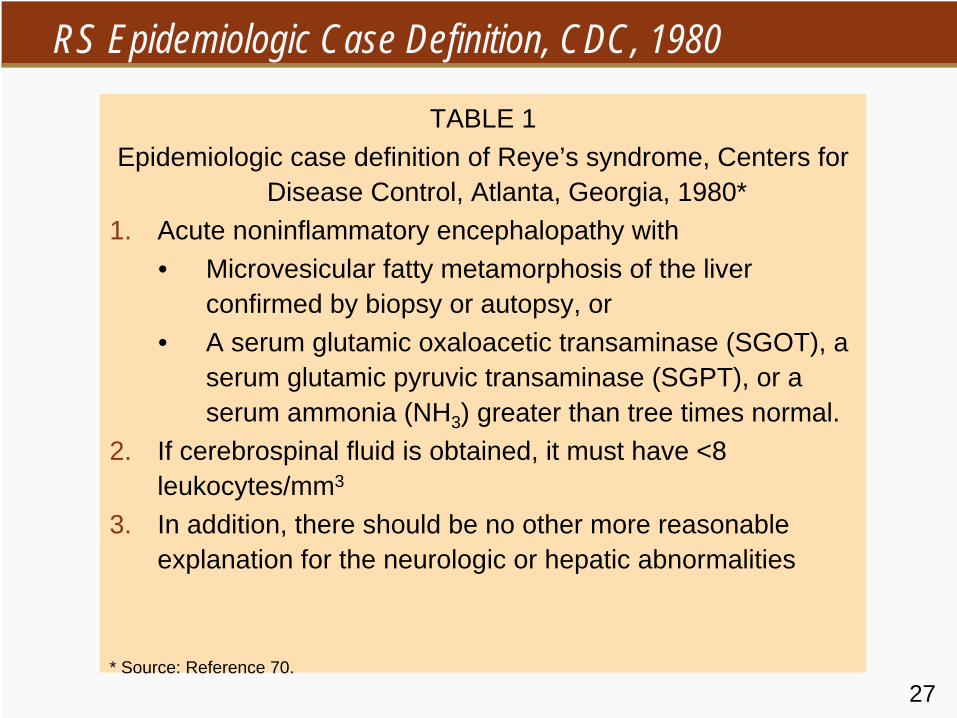
RS Epidemiologic Case Definition, CDC, 1980
TABLE 1Epidemiologic case definition of Reye’s syndrome, Centers for
Disease Control, Atlanta, Georgia, 1980*1. Acute noninflammatory encephalopathy with
• Microvesicular fatty metamorphosis of the liver confirmed by biopsy or autopsy, or
• A serum glutamic oxaloacetic transaminase (SGOT), a serum glutamic pyruvic transaminase (SGPT), or a serum ammonia (NH3 ) greater than tree times normal.
2. If cerebrospinal fluid is obtained, it must have <8 leukocytes/mm3
3. In addition, there should be no other more reasonable explanation for the neurologic or hepatic abnormalities
* Source: Reference 70.

28
CDC RS Table: Toxins and MedicationsTABLE 6
Toxins and medications suspected of being associated with Reye’s syndrome-like illnesses
Agent Reference no.
Aflatoxins 31, 67, 69, 75, 80, 113–118
Endotoxin 124
Hypoglycin 2
Insecticides and insecticide- related chemicals
75, 119-121
Isopropyl alcohol 104
Antiemetics 19, 30, 58
Pteridine 125
Salicylates 19, 58, 129–132
Valproic acid 126, 127Warfarin 128
29
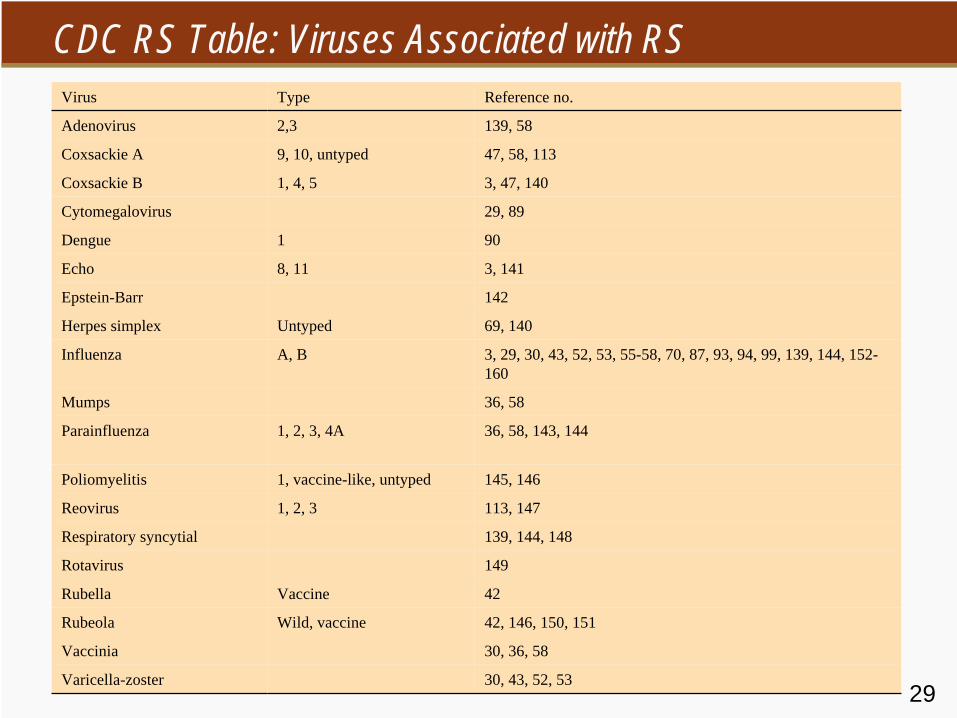
CDC RS Table: Viruses Associated with RSVirus Type Reference no.
Adenovirus 2,3 139, 58
Coxsackie A 9, 10, untyped 47, 58, 113
Coxsackie B 1, 4, 5 3, 47, 140
Cytomegalovirus 29, 89
Dengue 1 90
Echo 8, 11 3, 141
Epstein-Barr 142
Herpes simplex Untyped 69, 140
Influenza A, B 3, 29, 30, 43, 52, 53, 55-58, 70, 87, 93, 94, 99, 139, 144, 152- 160
Mumps 36, 58
Parainfluenza 1, 2, 3, 4A 36, 58, 143, 144
Poliomyelitis 1, vaccine-like, untyped 145, 146
Reovirus 1, 2, 3 113, 147
Respiratory syncytial 139, 144, 148
Rotavirus 149
Rubella Vaccine 42
Rubeola Wild, vaccine 42, 146, 150, 151
Vaccinia 30, 36, 58
Varicella-zoster 30, 43, 52, 53

30
Epidemiology of RS

31
CDC RS Table: Reported Cases of RS, U.S., 1967-80Year No. of reported cases/100,000 persons
1967 11
1968 17
1969 41
1970 13
1971 83
1972 30
1973 32
1974 379†
1975 ‡
1976 ‡
1977 454§
1978 240
1979 389
1980 443*
Sources: CDC. Unpublished data. Atlanta, GA, 1980, and references 30, 52, 53.† December 15, 1973, to June 30, 1974‡ Data unavailable§ December 1976 to November 1977: dates for all subsequent 12-month periods are similar.* Through August 31, 1980

32
Age Association
33
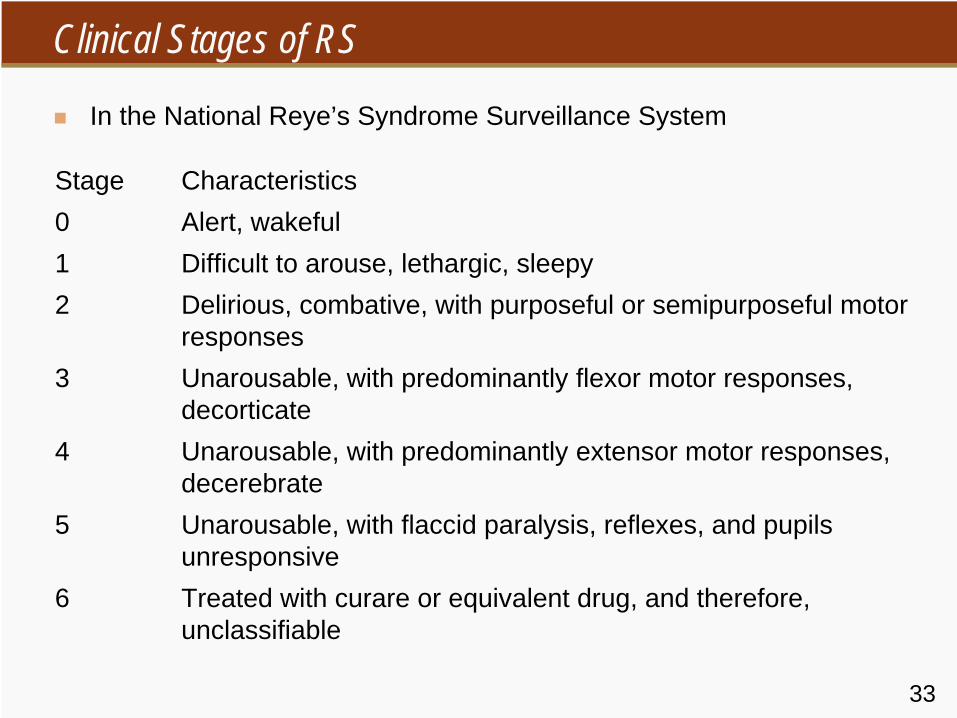
Clinical Stages of RS
In the National Reye’s Syndrome Surveillance System
Stage Characteristics0 Alert, wakeful1 Difficult to arouse, lethargic, sleepy2 Delirious, combative, with purposeful or semipurposeful motor
responses3 Unarousable, with predominantly flexor motor responses,
decorticate4 Unarousable, with predominantly extensor motor responses,
decerebrate5 Unarousable, with flaccid paralysis, reflexes, and pupils
unresponsive6 Treated with curare or equivalent drug, and therefore,
unclassifiable

Section C
Case-Controlled Studies of Reye’s Syndrome
35
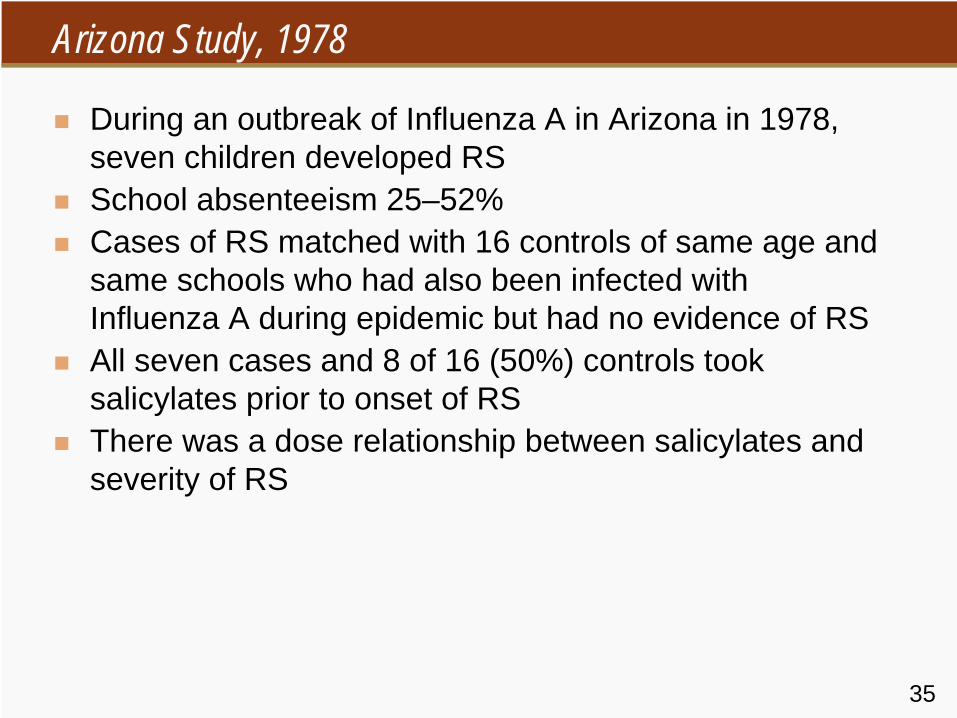
Arizona Study, 1978
During an outbreak of Influenza A in Arizona in 1978, seven children developed RSSchool absenteeism 25–52%Cases of RS matched with 16 controls of same age and same schools who had also been infected with Influenza A during epidemic but had no evidence of RSAll seven cases and 8 of 16 (50%) controls took salicylates prior to onset of RSThere was a dose relationship between salicylates and severity of RS

36
Stages of Reye’s Syndrome

37
Sources of Bias
1. Selection bias−
Physicians might be more likely to report RS if aspirin was used to treat influenza and encephalopathy ensued because of publicity concerning this association
2. Confounding bias−
Aspirin might be more likely to be used if influenza illness was more severe, e.g., high fever, more myalgia, headaches, etc.
3. Observational bias−
A child or parent would be more likely to remember aspirin use if encephalopathy ensued

38
Ohio Study, 1978–1980
Ninety-seven cases of RS in Ohio with onsets from December 1978–March 1980 matched with 156 controls; matched for age, same school, similar type of precipating febrile illness to the case of RSAspirin was used by 97% of cases and 78% of controls; 16% of cases and 33% of controls had received acetaminophen

39
Cases and ControlsTen Medication Components Most Frequently Used by Study Subjects,* Ohio, December 1978 through
March 1980
Medication Cases, % (n = 97) Controls, % (n = 156)
Aspirin 97 71
Alcohol 42 43
Vitamins 35 35
Acetaminophen 16 33
Phenothiazines 21† 4
Phenylpropanolamine hydrochloride
25 28
Guaifenesin 28 27
Dextromethorphan hydrobromide 16 22
Miscellaneous adsorbents 20 19
Chlorpheniramine meleate 18 20
* For cases, includes period from onset of antecedent illness until hospitalization for RS
† During the second study period, 12 (19%) of 64 cases received phenothiazines, but only 8% did so before onset of RS (severe vomiting)
40
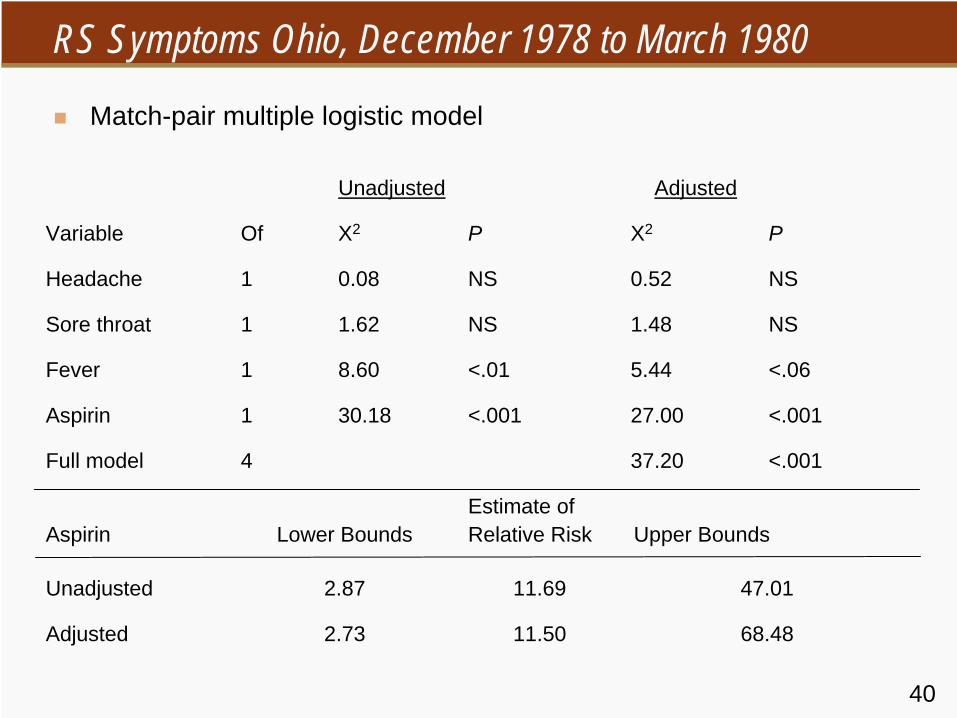
RS Symptoms Ohio, December 1978 to March 1980
Match-pair multiple logistic model
Unadjusted Adjusted
Variable Of X2 P X2 P
Headache 1 0.08 NS 0.52 NS
Sore throat 1 1.62 NS 1.48 NS
Fever 1 8.60 <.01 5.44 <.06
Aspirin 1 30.18 <.001 27.00 <.001
Full model 4 37.20 <.001
Aspirin Lower BoundsEstimate ofRelative Risk Upper Bounds
Unadjusted 2.87 11.69 47.01
Adjusted 2.73 11.50 68.48

41
RS: Aspirin Use by Highest Level of Fever
Reported 1978–1980, Ohio
Highest Temp °C (°F) Cases Controls
None 21/23 (91%) 39/61 (64%)
Unknown temp 10/11 (91%) 13/19 (68%)
37.1 – 37.7–99.9 4/4 (100%) 4/6 (67%)
37.8 – 38.8 (100.0-101.9) 18/18 (100%) 21/28 (75%)
>38.9 (≥
102.0) 41/41 (100%) 33/44 (75%)
Total 94/97 (97%) 110/156 (71%)
42
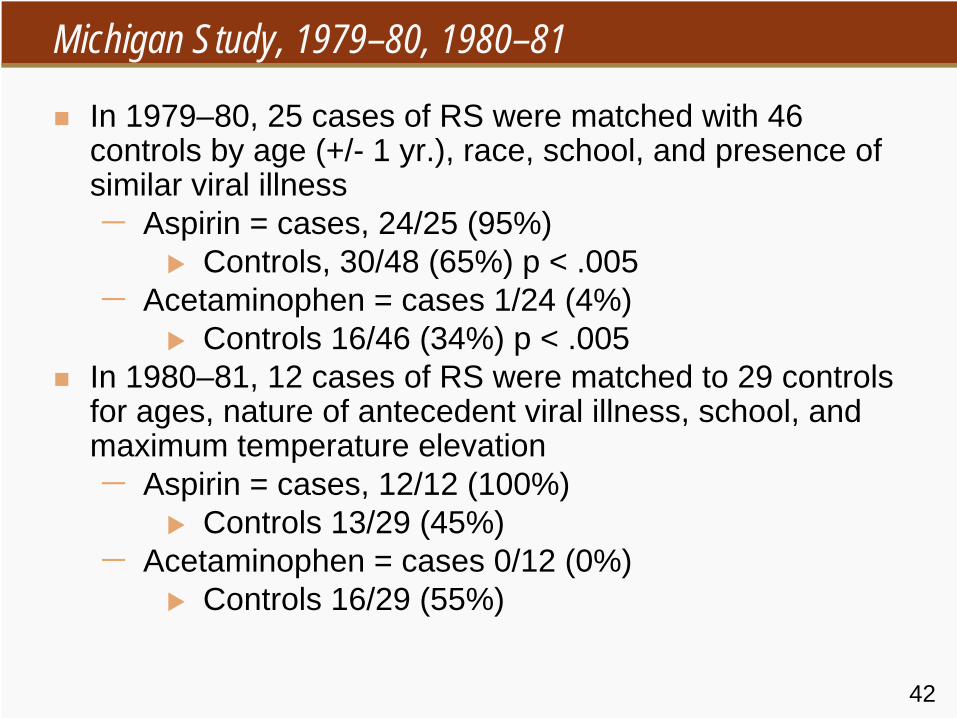
Michigan Study, 1979–80, 1980–81
In 1979–80, 25 cases of RS were matched with 46 controls by age (+/- 1 yr.), race, school, and presence of similar viral illness−
Aspirin = cases, 24/25 (95%)
Controls, 30/48 (65%) p < .005−
Acetaminophen = cases 1/24 (4%)
Controls 16/46 (34%) p < .005In 1980–81, 12 cases of RS were matched to 29 controls for ages, nature of antecedent viral illness, school, and maximum temperature elevation−
Aspirin = cases, 12/12 (100%)
Controls 13/29 (45%) −
Acetaminophen = cases 0/12 (0%)
Controls 16/29 (55%)

43
Doses
44
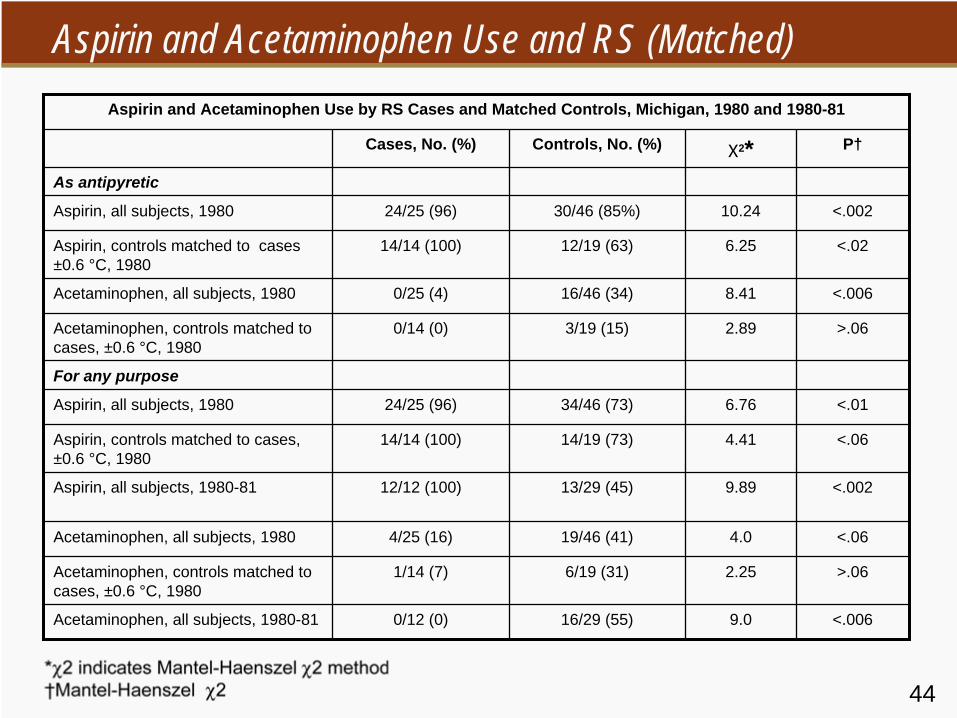
Aspirin and Acetaminophen Use and RS (Matched) Aspirin and Acetaminophen Use by RS Cases and Matched Controls, Michigan, 1980 and 1980-81
Cases, No. (%) Controls, No. (%) X2 * P†
As antipyretic
Aspirin, all subjects, 1980 24/25 (96) 30/46 (85%) 10.24 <.002
Aspirin, controls matched to cases ±0.6 °C, 1980
14/14 (100) 12/19 (63) 6.25 <.02
Acetaminophen, all subjects, 1980 0/25 (4) 16/46 (34) 8.41 <.006
Acetaminophen, controls matched to cases, ±0.6 °C, 1980
0/14 (0) 3/19 (15) 2.89 >.06
For any purpose
Aspirin, all subjects, 1980 24/25 (96) 34/46 (73) 6.76 <.01
Aspirin, controls matched to cases, ±0.6 °C, 1980
14/14 (100) 14/19 (73) 4.41 <.06
Aspirin, all subjects, 1980-81 12/12 (100) 13/29 (45) 9.89 <.002
Acetaminophen, all subjects, 1980 4/25 (16) 19/46 (41) 4.0 <.06
Acetaminophen, controls matched to cases, ±0.6 °C, 1980
1/14 (7) 6/19 (31) 2.25 >.06
Acetaminophen, all subjects, 1980-81 0/12 (0) 16/29 (55) 9.0 <.006

45
Aspirin and Acetaminophen Use and RS (Unmatched)
Unmatched Characteristics, RS Cases and Controls, Michigan, 1980 and 1980–81
1980 1980–1981
Cases (n = 25) Controls (n = 46) Cases (n = 12) Controls (n = 28)
Mean duration, days of viral illness (range) 5.7 (3-11) 5.8 (2-15) 4.8 (37) 5.3 (2-10)
Mean age of parents, yr (range) 35.5 (24-?) 35.6 (24-56) 37.4 (29-47) 35.8 (23-50)
Mean No. of medications received during viral illness
4.0 (109) 3.7 (0-13) 3.8 (3.6) 4.0 (0-9)
Mean peak reported temperature, °C (range) (37.0-40.6) (37.0-40.0) (37.0-38.9) (37.0-39.2)

46
Antecedent Respiratory Illnesses TableSymptoms and Associated Actions Reported During Antecedent Respiratory Illnesses for 25 Case-Patients and 135 Matched Controls
Controls
Symptom of Action Case-Patients (n = 25)
Emergency Room (n=29)
Inpatient (n = 22)
School (n = 41)
Community (n = 43)
Total (n = 135)
Duration (mean days) 4.9 10.2 10.7 8.9 9.4 9.6
Overall severity score (mean)* 1.5 1.6 1.8 1.7 1.6 1.7
Fever score (mean)* 1.8 1.9 2.1 1.9 1.9 1.9
Mean peak temperature, °C† 36.2 38.4 38.7 36.4 38.4 38.4
Fever‡ 64 (2.5) 79 (3.70) 68 (3.20) 88 (3.97) 72 (3.29) 78 (3.59)
Cough ‡ 7 (4.16) 97 (6.71) 82 (6.72) 93 (6.66) 91 (6.92) 91 (6.77)
Headache ‡ 56 (2.79) 48 (3.36) 55 (3.06) 83 (3.62) 74 (3.31) 68 (3.41)
Muscle aches ‡ 24 (3.17) 31 (4.00) 41 (4.89) 37 (3.20) 42 (3.67) 38 (3.79)
Sore throat ‡ 64 (2.88) 62 (6.39) 59 (3.54) 76 (4.55) 72 (3.74) 69 (4.49)
Absent from school/in bed 80 (3.35) 93 (3.69) 82 (3.50) 95 (3.97) 77 (4.18) 87 (3.94)
Consulted/saw health care provider ‡ 44 66 55 49 40 50
*Based on main care provider’s report of none (=0), mild (=1), moderate (=2), or severe (=3); † Included only if fever was indicated and measured (13 case-patients, 18 emergency room controls, 13 impatient controls, 29 school controls, and 22 community controls; ‡ Values are percentages of patients: mean number of days of duration among patients reported to have these symptoms or actions are shown in parentheses

47
Antecedent Respiratory or Chickenpox TableGeneric Components of Medications Administered to 20% or More of Study Subjects
During Antecedent Respiratory or Chickenpox Illnesses
Controls Exposed, %
Generic Component Case-Patients (n = 27)
Emergency Room (n=30)
Inpatient (n = 22)
School (n = 45)
Community (n = 43)
Total (n = 140)
Acetaminophen 29.6 90.0 77.3 91.1 81.4 85.7
Alcohol 44.4 53.3 50.0 46.7 72.1 56.4
Amoxicillin 7.4 20.0 0.0 4.4 11.6 9.3
Caffeine 22.2 6.7 4.5 2.2 14.0 7.1
Camphor 14.8 10.0 9.1 13.3 20.9 14.3
Chlorpheniramine maleate 22.2 23.3 22.7 20.0 37.2 26.4
Dextromethorphan hydrobromide 29.6 36.7 22.7 33.3 60.5 40.7
Eucalyptus oil 29.6 13.3 13.6 28.9 27.9 22.9
Guaifenesin 22.2 43.3 36.4 31.1 34.9 35.7
Menthol 40.7 26.7 13.6 33.3 39.5 30.7
Phenol 11.1 16.7 4.5 8.9 20.9 13.6
Phenylephrine hydrochloride 14.8 6.7 22.7 20.0 20.9 17.9
Phenylpropanolamine hydrochloride 18.5 40.0 36.4 33.3 44.2 38.6
Pseudoephedrine hydrochloride 29.6 16.7 31.8 26.7 48.8 32.1
Salicylates* 96.3 40.0 27.3 44.4 34.9 37.9
*Salicylates include biemuth subsalicylate, magnesium salicylate, and acetylsalicylates; the only salicylate exposure for one case and 11 controls was to biemuth subsalicylate, and for two additional controls the only exposure was to magnesium salicylate.

48
Salicylates and Acetaminophen Table
Odds Ratios for Exposure to Salicylates and Acetaminophen of 27 Case-Patients vs. 140 Controls*
Controls
Emergency Room Inpatient School Community Total
Salicylates (4.9)† 39 (7.8) 66 (4.4) 33 (5.9) 44 (5.8) 40
Acetaminophen 0.04 (0.18)‡ 0.13 (0.51) 0.04 (0.16) 0.06 (0.30) 0.06 (0.18)
*Odds ratios are based on matched set analyses and are not adjusted for differences in the severity of the antecedent illness.† Lower 95% confidence limit‡ Upper 95% confidence limit

49
RS and Aspirin
1. Arizona, 1978, Influenza A outbreak−
7.7 RS cases and 8/16 ill controls used salicylates (p<.05)
2. Michigan, 1979-80, Influenza B outbreak−
83 cases of RS
−
24/25 cases and 30/46 controls used salicylates (p < .05)
3. Michigan, 1980-81, Influenza A outbreak−
18 cases of RS
−
12/12 RS cases and 12/29 controls used salicylates (p <.05)

50
RS and Aspirin
4. Ohio, 1978–80, Influenza outbreaks−
97 cases of RS
−
97% of cases and 71% of controls used salicylates (p < .01)
5. CDC Nationwide Study, January 1985–May 1986−
27 cases of RS, matched for age, race, and type and timing of antecedent illness
−
97% of cases and 35% of controls had used salicylates (odds ratio = 40, lower 95% CI = 5.8)

51
Influenza and RS TablePredominant influenza strains, reported cases of RS and varicella-associated RS, RS incidence, and RS
fatality rate—U.S., 1974 and 1977-88*
RS Cases
Year† Predominant influenza strains Jan-May
Total Varicella- associated
Incidence of RS§
Case-fatality rate (%)
1974 B 379 -- 0/6 41
1977 B 454 73 0.7 42
1978 A(H3N2) 236 69 0/4 29
1979 A(J1N1) 389 113 0.6 32
1980 B 555 103 0.9 23
1981 A(H3N2) 297 77 0.5 30
1982 B 213 45 0.5 35
1983 A(H3N2) 198 28 0.3 31
1984 A(H1N1)+B 204 26 0.3 26
1985 A(H3N2) 93 15 0.2 31
1986 B 101 5 0.2 27
1987 A(H1N1) 36 7 0.1 29
1988 A(H3N2) 20 4 0.0 30
*Continuous RS surveillance began in December 1976. Data for 1988 are provisional.† RS reporting year begins December 1 of previous year§ Per 100,000 U.S. population <18 years of age (U.S. Bureau of the Census data)

52
By Age at Onset and by Season
53
Article from NEJM
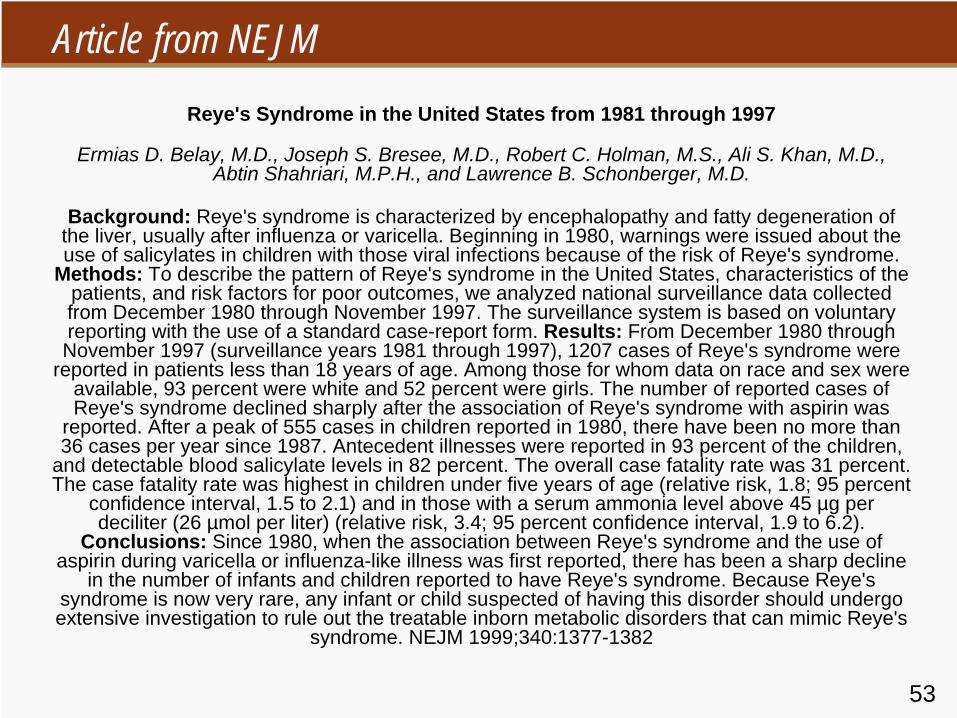
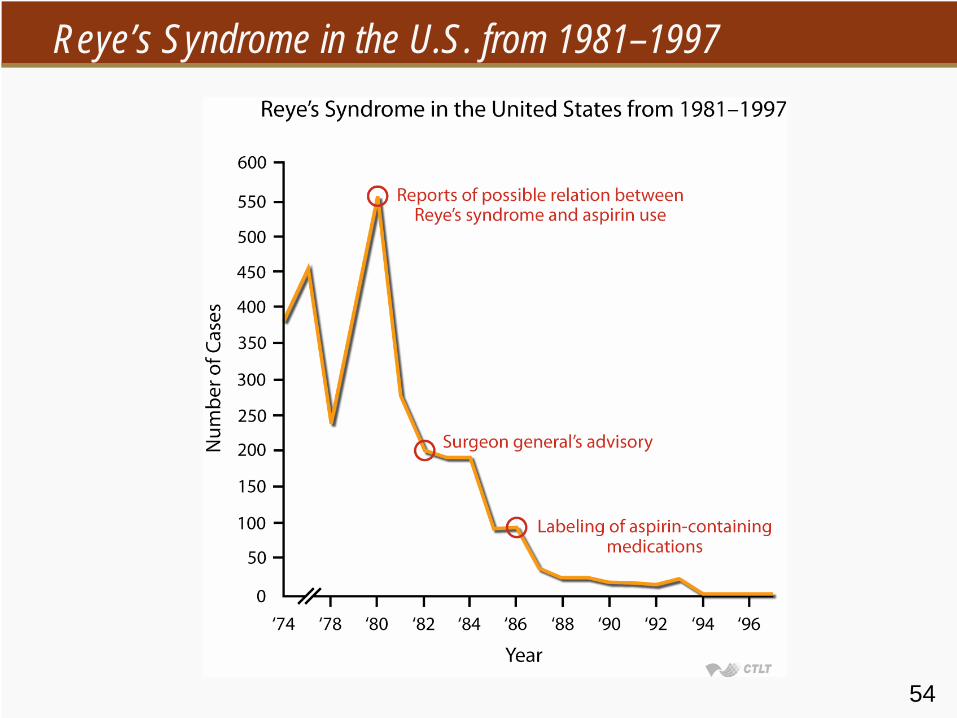
Reye's Syndrome in the United States from 1981 through 1997
Ermias D. Belay, M.D., Joseph S. Bresee, M.D., Robert C. Holman, M.S., Ali S. Khan, M.D., Abtin Shahriari, M.P.H., and Lawrence B. Schonberger, M.D.
Background: Reye's syndrome is characterized by encephalopathy and fatty degeneration of the liver, usually after influenza or varicella. Beginning in 1980, warnings were issued about the use of salicylates in children with those viral infections because of the risk of Reye's syndrome.
Methods: To describe the pattern of Reye's syndrome in the United States, characteristics of the patients, and risk factors for poor outcomes, we analyzed national surveillance data collected from December 1980 through November 1997. The surveillance system is based on voluntary reporting with the use of a standard case-report form. Results: From December 1980 through November 1997 (surveillance years 1981 through 1997), 1207 cases of Reye's syndrome were
reported in patients less than 18 years of age. Among those for whom data on race and sex were available, 93 percent were white and 52 percent were girls. The number of reported cases of Reye's syndrome declined sharply after the association of Reye's syndrome with aspirin was
reported. After a peak of 555 cases in children reported in 1980, there have been no more than 36 cases per year since 1987. Antecedent illnesses were reported in 93 percent of the children,
and detectable blood salicylate levels in 82 percent. The overall case fatality rate was 31 percent. The case fatality rate was highest in children under five years of age (relative risk, 1.8; 95 percent
confidence interval, 1.5 to 2.1) and in those with a serum ammonia level above 45 µg per deciliter (26 µmol per liter) (relative risk, 3.4; 95 percent confidence interval, 1.9 to 6.2).
Conclusions: Since 1980, when the association between Reye's syndrome and the use of aspirin during varicella or influenza-like illness was first reported, there has been a sharp decline
in the number of infants and children reported to have Reye's syndrome. Because Reye's syndrome is now very rare, any infant or child suspected of having this disorder should undergo extensive investigation to rule out the treatable inborn metabolic disorders that can mimic Reye's
syndrome. NEJM 1999;340:1377-1382
54
Reye’s Syndrome in the U.S. from 1981–1997

55
Evidence of Causal Association
Tampons/TS Salicylates/Reyes1. Strength of association 4+ 3+2. Consistency 4+ 4+3. Specificity 2–3+ 1+ – 0 (?)4. Temporality 4+ 2+ (?)5. Biological-gradient 4+ 3+6. Plausibility 4+ 0 (?)7. Coherence 4+ 0 (?)8. Experiment (removal of
exposure) 4+ 4+
9. Analogy N/A N/A