this is a pre-copyedited, author-produced pdf of an … this is a pre-copyedited, author-produced...
TRANSCRIPT

1
This is a pre-copyedited, author-produced PDF of an article accepted for publication in
Journals of Gerontology (Series B): Psychological Sciences and Social Sciences following
peer review. The version of record “Social Disadvantage and Social Isolation Are
Associated With a Higher Resting Heart Rate: Evidence From The Irish Longitudinal
Study on Ageing”, J GERONTOL B PSYCHOL SCI SOC SCI December 6, 2014, is
available online at: http://dx.doi.org/10.1093/geronb/gbu163
2
Title: Social disadvantage and social isolation are associated with a higher resting heart
rate: evidence from The Irish Longitudinal Study on Ageing (TILDA).
Authors: *Cathal McCrory1, Ciaran Finucane1, Celia O’Hare 1John Frewen1, Hugh Nolan1,
Richard Layte2, Patricia M. Kearney3, Rose Anne Kenny1.
*Corresponding author
Email: [email protected]
Tel: 00353 1 8964263
Affiliations:
1 The Irish Longitudinal Study on Ageing 2 Economic & Social Research Institute
Department of Medical Gerontology Whitaker Square
Trinity College Dublin Sir John Rogerson’s Quay
3 Department of Epidemiology and Public Health
Western Gateway Building
University College Cork
3
ABSTRACT
Objectives: A high resting heart rate (RHR) represents a major risk factor for cardiovascular
disease and individuals from poorer backgrounds have a higher RHR compared with their
more advantaged peers. This study investigates the pathways through which low socio-
economic status (SES) contributes to a higher RHR.
Method: The sample involved data for 4,888 respondents who were participating in the first
wave of The Irish Longitudinal Study on Ageing (TILDA). Respondents completed a
detailed interview at home and underwent a 5-minute baseline electrocardiograph recording
as part of a clinic-based health assessment. SES was indexed using household income.
Results: The mean difference in RHR between those at polarised ends of the income
distribution was 2.80 beats per minute (bpm) [CI=1.54, 4.06; p<0.001], with the magnitude of
the socio-economic differential being greater for men [4.15 bpm; CI=2.18, 6.12; p<0.001]
compared with women [1.57 bpm; CI=0.04, 3.10; p<0.05]. Psychosocial factors including
social network size and loneliness accounted for a sizeable proportion of the socio-economic
differential in RHR, particularly among men.
Discussion: The finding that poorer people have a higher RHR reinforces the need for
additional research exploring the pathways through which social inequalities are translated
into biological inequalities.
Keywords: resting heart rate (RHR); socio-economic status (SES); social networks;
loneliness; Irish cohort study
4
INTRODUCTION
A high resting heart rate (RHR) has been identified as a risk factor for cardiovascular
disease (CVD) and cardiovascular mortality across a large number of studies (Cooney,
Vairtiainen, Laaktainen, Juolevi, Dudina, & Graham, 2010; Jensen, Marott, Allin,
Nordestgaard, & Jensen 2012; Kristal-Boneh, Silber Harari, & Froom, 2000), including
prospective studies (Jensen et al. 2012; Kristal-Boneh et al. 2000). Indeed, a recent review
indicated that heart rate was associated with cardiovascular mortality in 36 of the 38 studies
which were included as part of the review (Perret-Guillaume, Joly, & Benetos, 2009).
A separate body of research has shown that there is a pronounced social gradient in
relation to CVD and that people from more socially disadvantaged backgrounds are at higher
risk of CVD (Fiscella & Tancredi, 2008; Lynch, Kaplan, Cohen, Tuomilehto & Salonen,
1996). For example, data from a large epidemiologic prospective cohort study of men found
that those in the bottom 20% of the income distribution were twice as likely to experience
cardiovascular mortality and four times more likely to experience acute myocardial infarction
at follow-up compared with the wealthiest 20% of the sample (Lynch et al., 1996).
Interestingly, a recent study found that those from more disadvantaged soci-economic
backgrounds have a higher RHR than their more advantaged peers (Chaix, Jouven, Thomas,
Leal, Billaudeau, Bean et al. 2011), which raises the possibility that differences in heart rate
may help explain some of the excess risk of CVD among disadvantaged groups; particularly
given the finding that a 5 beats per minute increase in RHR is associated with a 17% increase
in cardiovascular mortality (Hozawa, Okhubo, Kikuya, Ugajin, Yamaguchi, Asayama, et al.
2004).
The effect of socio-economic status (SES) on CVD is mediated through a number of
different processes including early life influences (Dong, Giles, Felitti, Dube, Williams,
5
Chapman et al. 2004; Smith, McCarron, Okasha, & McEwen, 2001), material deprivation
(Fiscella & Tancredi, 2008), psychosocial stresses (Matthews & Gallo, 2011; Steptoe &
Kivimaki, 2013), and lifestyle-related factors (Dong et al, 2004; Smith et al, 2001).
Investigators have found that anthropometric indicators of impaired foetal growth and
development such as low birth-weight, which are socially structured (see Kramer, Sequin,
Lydon & Goulet, 2000) represent a major risk factor for CVD in later life (Eriksson, 2011).
Material deprivation exerts a direct influence on the quality of nutrition that is accessible to
an individual, and people from disadvantaged backgrounds tend to have poorer dietary
quality (Ricciuto & Tarasuk, 2007). Similarly, lifestyle factors such as smoking tend to be
heavily socially patterned (Hiscock, Bauld, Amos Fidler & Munafò, 2012) and increase risk
for adverse cardiovascular outcomes.
Psychosocial factors have also been implicated in the aetiology of CVD because SES
predisposes to more stressors while simultaneously constraining the amount of resources one
has available to overcome or ameliorate the impact of a stressor (Matthews & Gallo, 2011).
The cardiovascular system therefore represents a plausible psychobiological pathway through
which social inequalities, mediated via lifestyle factors and psychosocial processes acting
over the life-course are translated into biological inequalities that may be prior to the
emergence of CVD. Indeed, investigators have tried to quantify the effects of SES induced
biological stress using a multi-system, multi-component allostatic load score which usually
comprises indices of cardiovascular functioning (Matthews & Gallo, 2011).
In the classical ‘fight or flight’ stress response, sympathetic nervous system activation
leads to increased secretion of catecholamines and glucocorticoids, which in turn raise heart
rate, respiratory rate and blood pressure. It is assumed this response is transient and that the
6
physical systems return to baseline. However, recent data suggests that repeated or chronic
exposure to stress has lingering end-organ effects, and that excessive levels of
catecholamines and their oxidative by-products injure myocardial tissue (Adameova,
Abdellatif, & Dhalla, 2009;). A higher RHR might therefore represent the end point of this
accumulation of disadvantage over time, reflecting earlier ageing of the vasculature with
well-established consequences for CVD risk and life expectancy (Tardif, 2009). It has also
been suggested that an elevated RHR may reflect an imbalance in the autonomic nervous
system, leading to sympathetic dominance and increased inflammation, which may
precipitate atherosclerotic processes (Whelton, Narla, Blaha, Nasir, Blumenthal et al. 2014).
Viewed in this way, a higher RHR might well be considered a biomarker of biological
ageing.
A recent study provides support for the idea that heart rate is sensitive to social
influences (Chaix et al., 2011). These investigators used individual and neighbourhood
indicators of disadvantage to create a composite socio-economic index and observed that
heart rate increased with increasing socio-economic disadvantage. In univariate analysis, the
most disadvantaged group had a resting HR that was 3.6 beats per minute higher on average
compared with those in the least disadvantaged group. When adjusted for classical risk
factors, sports and exercise participation accounted for the largest proportion of the socio-
economic differential (22%); with the other mediating variables – waist circumference (9%),
gamma-glutamyltransferase (7%), alkaline phosphatase (5%) and leg length (3%) –
accounting for proportionately less. Nevertheless, in multivariable adjustment 53% of the
SES-related difference in heart rate remained unexplained, which reinforces the need to
examine other risk factors which may contribute to SES-related differences in heart rate.
Psychosocial factors represent a potentially fecund area of investigation but have not featured
7
prominently in the empirical work that has been done to date, at least with respect to socially
mediated variation in heart rate (Krantz & McCeney, 2002). Chaix et al. (2011) included
measures of perceived stress and depression but these were found to be unrelated to heart rate
in the fully adjusted models.
This study builds upon previous work in a number of important ways. Firstly, it
employs a broader and more varied definition of the psychosocial environment than has been
employed in previous studies by considering the role of inter-personal factors such as social
connectedness and loneliness as potential mediators of the social gradient in RHR. People
from more disadvantaged social backgrounds have smaller social support networks
(Stringhini, Berkman, Ferrie, Marmot, Kivimaki, & Singh-Manoux, 2012; Steptoe, Shankar,
Demakakos, & Wardle, 2013). A series of studies have documented links between social
isolation and measures of cardiovascular functioning (Hawkley, Thisted, Masi, & Cacioppo,
2010; Steptoe & Kivimaki, 2013). Hawkley et al. (2010) found that loneliness at baseline
predicted increases in systolic blood pressure (SBP) at 2, 3 and 4 year follow-up independent
of perceived stress, hostility and social support; and that the effect was graded such that
higher levels of loneliness predicted higher SBP.
Secondly, the study explores differences separately for males and females as there is
reason to suspect that men derive greater health benefits from the availability of social
supports compared with women (Stringhini et al., 2012; Unger, McAvay, Bruce, Berkman, &
Seeman, 1999). For example, Stringhini et al. (2012) found that structural measures of social
support predicted increased risk of mortality among men, but not among women, in a large
prospective study of British civil servants over a mean follow-up interval of 20.8 years.
Furthermore, social network score and marital status explained 29% of the association
8
between SES and all-cause mortality in men, which reinforces the necessity of stratifying by
gender. Given the working hypothesis that a higher RHR may indicate accumulation of
disadvantage over time, we also examine whether SES related differentials become more
pronounced as people age. We examine these issues using data from a large population
based cohort study of ageing in the Republic of Ireland.
METHODS
STUDY DESIGN AND PARTICIPANTS
The Irish Longitudinal Study on Ageing (TILDA) is a large prospective cohort study
examining the social, economic and health circumstances of 8,175 community-dwelling older
adults aged 50 years and older resident in the Republic of Ireland. The sample was generated
using a 3-stage selection process and the Irish Geodirectory as the sampling frame. The Irish
Geodirectory is a comprehensive listing of all addresses in the Republic of Ireland which is
compiled by the national post service and ordnance survey Ireland. Subdivisions of district
electoral divisions pre-stratified by socio-economic status, age and geographical location
served as the primary sampling units. The second stage involved the selection of a random
sample of 40 addresses from within each PSU resulting in an initial sample of 25,600
addresses. The third stage involved the recruitment of all members of the household aged 50
years and over. Consequently, the response rate was defined as the proportion of households
including an eligible participant from whom an interview was successfully obtained. A
response rate of 62.0 percent was achieved at the household level.
There were three components to the survey. Respondents completed a computer
assisted personal interview (CAPI) (n=8175) and a separate self-completion paper and pencil
module (n=6915) which collected information that was considered sensitive. All participants
9
were invited to undergo a separate health assessment at one of two national centres using
trained nursing staff. 5036 respondents attended the health centre assessment, of which 4891
provided heart rate measurements, which represents the initial case base for the analysis. A
more detailed exposition of study design, sample selection and protocol is available
elsewhere (Whelan & Savva, 2013).
Ethics Statement
Ethical approval for the study was obtained from the Trinity College Dublin Research
Ethics Committee and signed informed consent was obtained from all participants.
OUTCOME VARIABLE – RESTING HEART RATE
Respondents who attended the health centre assessment completed a 5-minute
baseline surface electrocardiogram (ECG) recording (Medilog Darwin®). They were
instructed to lie supine and breathe normally while measurements were taken. ECG signals
were sampled at 4000 Hz, filtered between 0.01–100.0 Hz. Records were scored for
significant noise and artefact and cases were excluded (n=3) if noise hampered the clinician’s
interpretation.
PRIMARY PREDICTOR VARIABLE – SOCIO-ECONOMIC STATUS
Household income, adjusted for the number of respondents living in the household
was used to measure socio-economic status. During the course of the household survey,
respondents were asked to report all income resulting from full or part-time employment,
private or public pensions, and income from other social welfare transfers. Respondents who
could not provide an exact figure for income were asked to estimate their income using a
banded range: (1) <€10,000 (2) €10,000 - <€20,000 (3) €20,000 - <€40,000; (4) €40,000 -
10
<€70,000 and (5) >=€70,000. These cases were treated by setting them equal to the mid-
point of the banded range. We imputed for the remaining cases missing on income using a
multiple imputation procedure (described below). Household income quintiles were then
generated among the sample of people who attended the health centre assessment after
imputing for income.
COVARIATES
Classical Risk Factors
Two seated systolic blood pressure (SBP) and diastolic blood pressure (DBP)
measurements were obtained separated by a 1 minute interval using an automatic digital BP
monitor (OMRONTM, Model M10-IT). The means of the 2 readings were then averaged to
derive SBP and DBP estimates. Medication use was recorded during the household interview
and confirmed by cross-checking with the labels on the medicinal packaging. Anatomical
Therapeutic Classification (ATC) codes were used for classification (WHO,
2013). Respondents were questioned about angina, heart attack, heart failure, stroke, and
transient ischemic attack (TIA). The total number of cardiovascular disease conditions was
then summed to create a continuous variable ranging between 0-5. A separate binary variable
was used to indicate whether the respondent had ever been diagnosed with diabetes.
Lifestyle Behaviours
Smoking status was indexed using a three level variable: never smoked, past smoker,
or current smoker. The CAGE alcohol screening test (Ewing, 1984) was used to index
hazardous drinking. The scale comprises 4 items and follows a dichotomous yes/no response
format. Answering yes to two or more questions indicates a clinically significant profile and
constitutes potentially hazardous drinking. Physical activity was assessed using the 8-item
11
short form of the International Physical Activity Questionnaire (Craig et al., 2003). It
measures the amount of time (mins) spent walking and engaged in moderate and vigorous
physical activity, and the amount of time spent sedentary. Scores on this measure were
positively skewed because a sizeable proportion of the sample (~10%) were not doing any
physical activity. We decided therefore to use a categorical variable representing low,
medium and high levels of physical activity as per the IPAQ protocol (www.ipaq.ki.se). We
also tried a log-transformation imputing small integer values for individuals’ who had a score
of zero on the IPAQ, but the results were very similar and the categorical variable has the
advantage of being in the original metric.
Lipid Profiles & Anthropometric Measures
Respondents also provided a blood sample during the course of the health assessment
and these were sent for immediate analysis to derive a detailed lipid profile which included
high density lipoprotein (HDL), low density lipoprotein (LDL), and triglycerides.
Anthropometric measurements were obtained by trained nursing staff using scientifically
calibrated and medically approved equipment. Height was measured to the nearest 0.1
centimetre using a SECA 240 wall mounted measuring rod. Weight was measured to the
nearest 0.1 kilogram using a SECA electronic floor scales. Waist circumference was
measured to the nearest 0.1cm using a SECA measuring tape with the waist defined as the
point midway between the iliac crest and the costal margin (lower rib).
Psychosocial Variables
Mental Health
A generalized measure of stress was obtained using the 4-item short form of the Perceived
Stress Scale (PSS) (Cohen, Kamarck, & Mermelstein, 1983) which is designed to gauge the
12
extent to which an individual appraises situations in his/her life as stressful. Sample items
include: ‘…how often have you felt difficulties were piling up so high that you could not
overcome them?’ and respondents indicate how often they have felt this way in the past
month on a five point rating scale ranging from ‘never’ to ‘very often’. Scores range from 0
through 16 with higher scores indicating higher levels of perceived stress. The PSS has
adequate internal consistency reliability for a short 4-item scale as assessed in the present
study using Cronbach’s alpha (α = 0.65). Cohen and Janicki-Deverts (2012) report that
higher scores on the PSS are associated with elevated cortisol levels, suppression of the
immune response, and problems with sleep.
Depressive symptoms were indexed using the Centre for Epidemiological Studies Depression
scale (CES-D) (Radloff, 1977). It measures the major components of depressive
symptomatology, including depressive mood, feelings of guilt and worthlessness,
psychomotor retardation, loss of appetite, and sleep disturbance. Respondents are shown 20
statements and asked to rate how often they have felt this week in the past week on a four
point (0-3) response scale ranging from ‘Rarely or none of the time (less than 1 day)’ to ‘All
of the time (5-7 days). A total score is calculated by summing responses across the 20 items
(range 0-60) with higher scores representing higher levels of depression. The instrument has
robust psychometric properties including excellent internal consistency reliability (α = 0.87 in
the present study), a stable factor structure (Knight, Williams, McGee, & Olaman, 1997), and
discriminates well between psychiatric and general population samples (Radloff, 1977).
Social Connectedness
Social connectedness was indexed using the Berkman-Syme Social Network Index
(SNI) (Berkman & Syme, 1979) which is a 4 item composite measure comprising different
13
types of social connections: marital status (married vs not married); sociability (number and
frequency of contacts with children, close relatives, and close friends); church group
membership (no vs yes) and membership in other community organisations (no vs yes). A
total score ranging between 0-4 indicates the extent of social connections with higher scores
signifying greater social connection. The SNI demonstrates convergent validity with other
measures of social support including the Social Relations Satisfaction Scale (Melchior,
Berkman, Niedhammer, Chea & Goldberg, 2003), and scores on this measure are predictive
of health and mortality outcomes (Berkman & Syme, 1979). Loneliness was measured using
5 items from the UCLA loneliness scale (version 3) which was designed to assess subjective
feelings of loneliness and social isolation (Russell, 1996). Respondents were asked: “how
often do you feel you lack companionship?”, “how often do you feel left out?”, “how often
do you feel isolated from others?”, “how often do you feel in tune with the people around
you?” and “how often do you feel lonely?”. Total scores range from 0-10 with higher scores
indicating greater feelings of loneliness. Internal consistency reliability for the 5-item scale
as assessed in the present study was satisfactory (α= 0.79). The scale has a test-retest
reliability of 0.73 over a one-year period and demonstrates convergent validity with other
measures of loneliness (Russell, 1996).
Statistical Analysis
All analyses were undertaken in STATA 12.0 using version 1-7-7 of the TILDA
dataset. Linear regression analysis was used to examine whether the covariates were
predictive of RHR adjusting for age and sex. Wilcoxon rank-sum (non-parametric) and
ANOVA one-way (parametric) tests for linear trend were used to test whether the variables
that were predictive of RHR in regression analysis were structured according to income. We
tested for effect modification by age by fitting income quintile * age interaction terms for the

14
overall sample, and separately for men and women; however, as none of the interaction terms
were significant we pooled the estimates with respect to age. Hierarchical linear regression
analysis was used to examine the hypothesis that psychosocial factors partially mediate the
association between SES and RHR. The models were initially estimated using complete case
analysis (CCA) (n=3760) which reduced the effective sample size by 1128 cases or 23.1%.
Sensitivity analyses comparing the characteristics of included and excluded cases revealed
that those who were missing listwise on the covariates were more heavily concentrated in
lower income groups. This issue was addressed by using a regression based multiple
imputation procedure to impute for cases missing on any of the covariates. The multiple
imputation by chained equations (MICE) algorithm implemented in STATA 12.0 utilises all
non-missing or imputed values to make predictions within a sequential regression-based
framework and accommodates variables of different types using an imputation method that is
appropriate for each variable.
MI introduces random variation into the imputation process and averages across the
simulations to generate a single set of estimates, standard errors and test statistics. The
income gradient was found to be steeper, after imputing for missing values, compared with
using complete case analysis. This is what we would expect given that individuals’ who were
missing listwise on any of the covariates tended to be more disadvantaged. Another obvious
advantage of his approach is that MI affords greater statistical power. The regression results
are therefore presented using the multiply imputed data (n=4888). The data were weighted
prior to analysis using survey weights which incorporated both a design weight to account for
initial sample design, stratification and clustering, and an additional weighting factor to take
account of the fact that respondents who attended the health assessment centre were younger,
better educated, and tended to be in better health (Whelan & Savva, 2013).
15
RESULTS
* Table 1 here *
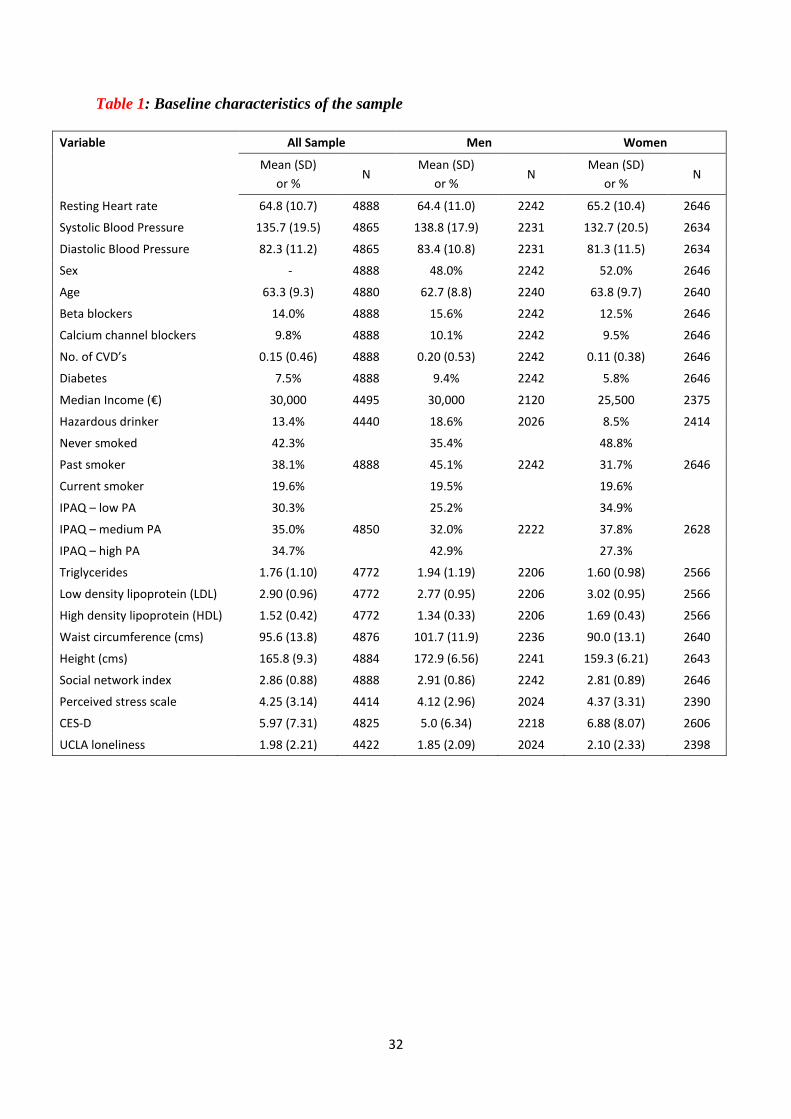
Table 1 describes the baseline characteristics for the overall sample, and separately
for males and females. With the exception of low density lipoprotein (LDL), and being a past
smoker, all the covariates were predictive of RHR in ordinary least squares regression (OLS).
Table 2 shows that the majority of the variables that were predictive of RHR in OLS
regression were structured according to income. For example, income was found to be
significantly negatively associated with scores on the PSS, CES-D, and UCLA loneliness
scale; and significantly positively associated with scores on the SNI, indicating that people
from more advantaged socio-economic backgrounds have larger social support networks.
* Table 2 here *
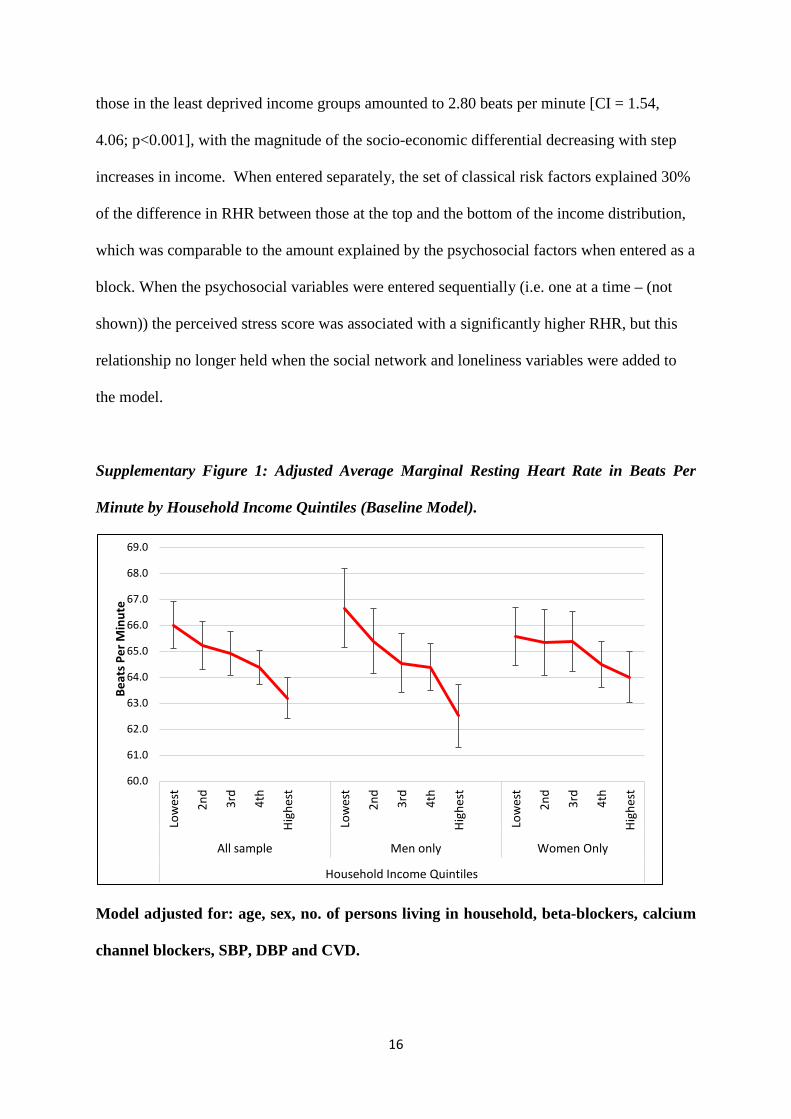
Supplementary Figure 1 displays the conditional mean RHR in beats per minute by
household income quintiles in the baseline model for the overall sample, and separately for
males and females. A clear social gradient was evident in the data with people from lower
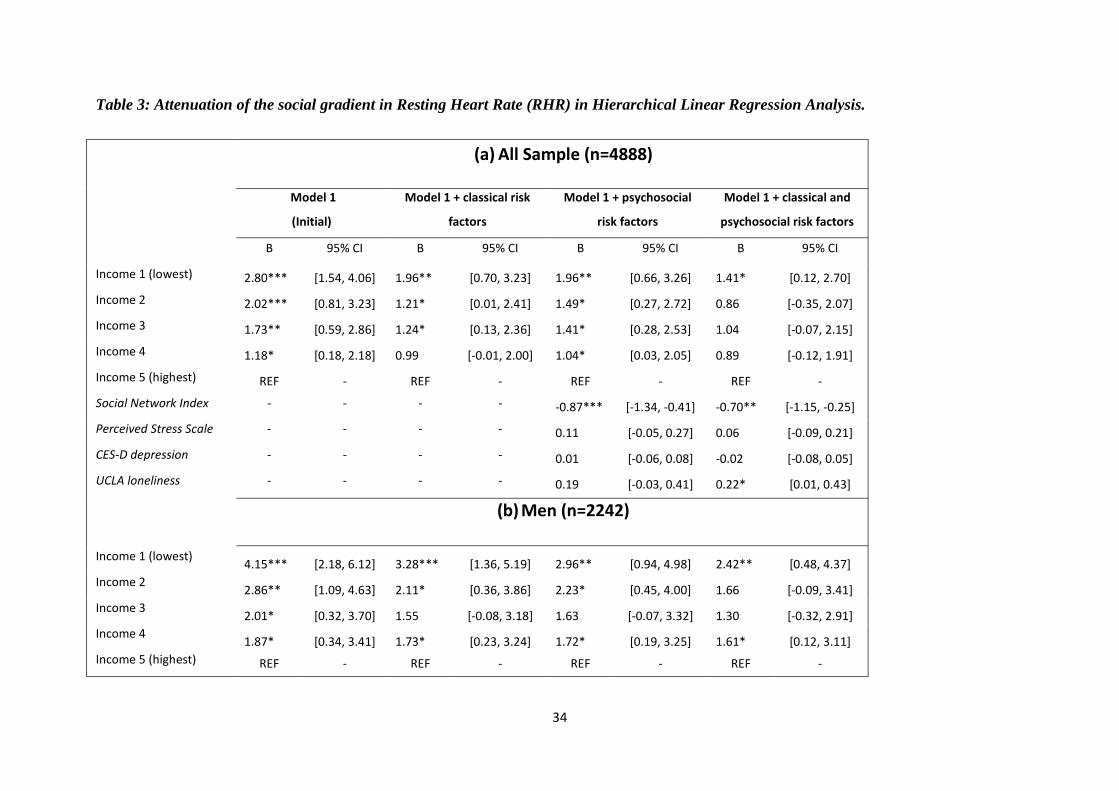
income backgrounds having a higher RHR. Table 3(a) shows the mean difference in RHR by
household income quintiles in the base model (model 1), and the change in the magnitude of
the association between RHR and income as the models are adjusted separately for the
constellation of classical risk factors (model 2); for the psychosocial factors (model 3); and
when adjusted simultaneously for all factors (model 4) in hierarchical linear regression
analysis. In the initial model, the difference in RHR between those in the most deprived and
16
those in the least deprived income groups amounted to 2.80 beats per minute [CI = 1.54,
4.06; p<0.001], with the magnitude of the socio-economic differential decreasing with step
increases in income. When entered separately, the set of classical risk factors explained 30%
of the difference in RHR between those at the top and the bottom of the income distribution,
which was comparable to the amount explained by the psychosocial factors when entered as a
block. When the psychosocial variables were entered sequentially (i.e. one at a time – (not
shown)) the perceived stress score was associated with a significantly higher RHR, but this
relationship no longer held when the social network and loneliness variables were added to
the model.
Supplementary Figure 1: Adjusted Average Marginal Resting Heart Rate in Beats Per
Minute by Household Income Quintiles (Baseline Model).
Model adjusted for: age, sex, no. of persons living in household, beta-blockers, calcium
channel blockers, SBP, DBP and CVD.
60.0
61.0
62.0
63.0
64.0
65.0
66.0
67.0
68.0
69.0
Low
est
2nd
3rd
4th
High
est
Low
est
2nd
3rd
4th
High
est
Low
est
2nd
3rd
4th
High
est
All sample Men only Women Only
Household Income Quintiles
Beat
s Per
Min
ute
17
When the classical and psychosocial factors were included in the same model, the
difference in RHR between those at the top and bottom of the spectrum was reduced by 50%.
In the full multivariable adjusted model, each one unit increase in score on the SNI measure
was associated with a reduction of -0.70 bpm [CI=-1.15, -0.25; p<0.01] in RHR. By contrast,
each one unit increase in score on the UCLA loneliness measure was associated with a +0.22
bpm increase in RHR [CI=0.01, 0.43; p<0.05].
* Table 3 here *
Because the difference in RHR between those at polarised ends of the income
spectrum was found to be much steeper for men at 4.15 bpm [CI=2.18, 6.12; p<0.001]
compared with women, where the difference amounted to 1.57 bpm [CI=0.04, 3.10; p<0.05],
we replicated the analyses separately for males and females as shown in Table 3(b) and 3(c)
respectively. With respect to men, psychosocial factors were responsible for a greater
diminution of the social gradient in RHR (28.7%) than were the classical risk factors (21%).
Again, much of the effect was mediated via the SNI measure. Each one unit increase in score
on the SNI measure was associated with a -1.09 [CI=-1.74, -0.44; p<0.001] reduction in RHR
in the full multivariable adjusted model. The socio-economic differential in RHR was much
less pronounced for women and none of the psychosocial factors were associated with RHR
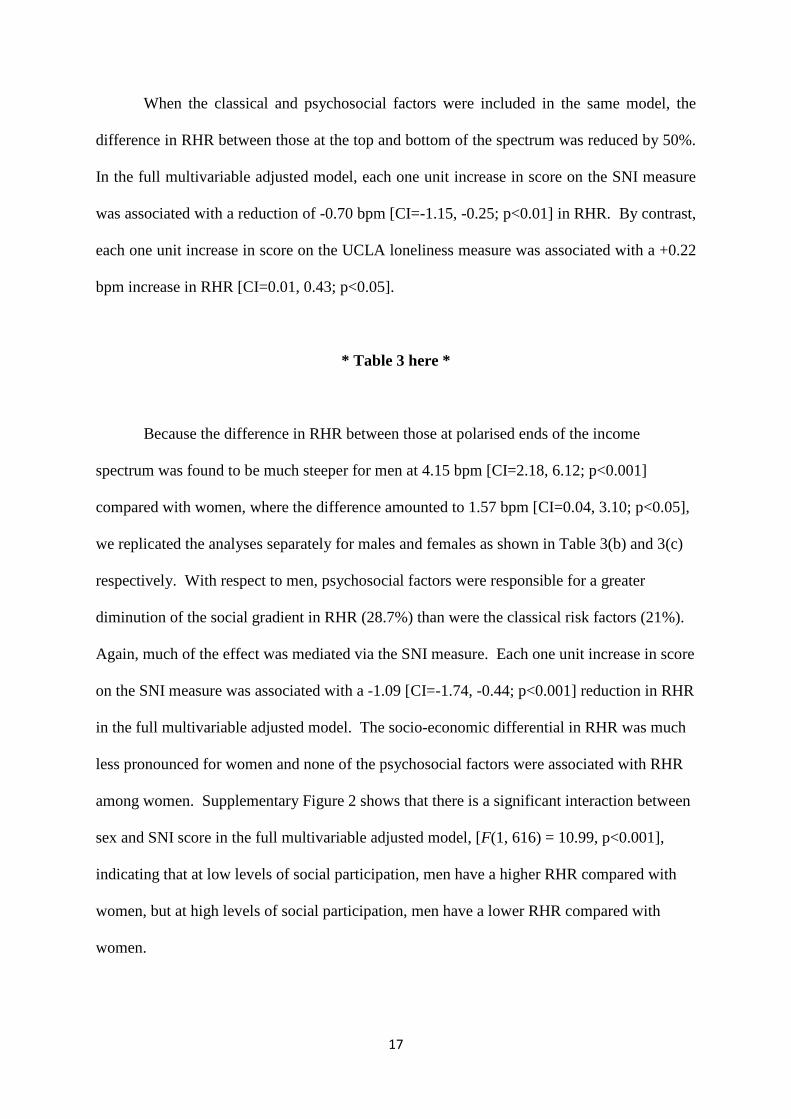
among women. Supplementary Figure 2 shows that there is a significant interaction between
sex and SNI score in the full multivariable adjusted model, [F(1, 616) = 10.99, p<0.001],
indicating that at low levels of social participation, men have a higher RHR compared with
women, but at high levels of social participation, men have a lower RHR compared with
women.
18
Supplementary Figure 2: Interaction of Sex with Social Network Score in Prediction of
Resting Heart Rate.
Adjusted for age, sex, no. of persons living in household, beta-blockers, calcium channel
blockers, SBP, DBP, CVD, diabetes, hazardous drinking, smoking, physical activity,
triglycerides, HDL, LDL, waist circumference, height, Social Network Index (SNI),
Perceived Stress Scale (PSS), CES-D depression, and UCLA loneliness.
DISCUSSION
In this large epidemiologic based cohort study in the Republic of Ireland, individuals
from deprived social backgrounds were found to have a significantly higher RHR compared
with their more advantaged peers. In unadjusted analysis, the difference in RHR between
those at polarised ends of the income distribution amounted to 2.80 beats per minute, with the
magnitude of the socio-economic differential being greater for men (4.15 beats per minute)
compared with women (1.57 beats per minute). Why the relationship between income and
RHR is so much stronger for men compared with women is not readily apparent, but it is
notable that the relationship persists even when the estimates are adjusted for the full battery
62.0
63.0
64.0
65.0
66.0
67.0
68.0
69.0
70.0
71.0
0 1 2 3 4
Beat
s Per
Min
ute
Total Score on the Berkman-Syme Social Network Index
male female
19
of mediating variables, which suggests that the gender difference is not simply attributable to
differences in risk factors between males and females. The results of a recent experimental
study may provide some insight as it suggests that status ranking may be more important for
men compared with women. The study found that men who lost social influence when
working with other men had a greater physiological stress response (i.e. cortisol secretion)
than they did when they lost influence relative to women. Interestingly, this effect was not
evident when women lost influence relative to men, nor indeed when women lost influence
relative to other women (Taylor, 2014).
The relationship between life expectancy and total number of heart beats in a lifetime is
remarkably similar in mammals (Levine, 1997), which might imply that there is a finite
number of beats that can be exercised over a lifetime. The heart is a muscle subject to
biomechanical stresses and a higher RHR may precipitate earlier ageing of the organ and
more rapid progression to the CVD endpoint. A difference in RHR of 2.80 beats per minute
between those at polarised ends of the income distribution scales to an absolute difference of
1,471,580 beats in a year (2,181,240 beats in a year among men): a finding which lends
further weight to the idea that differences in heart rate might help explain some of the excess
risk in CVD that has been observed among socially deprived groups. Thus RHR may serve as
a potent marker of stress induced biological damage in the cardiovascular system.
An obvious difficulty with this interpretation is that women tend to live longer than men
despite having a higher RHR. It should be acknowledged, however, that RHR represents the
influence of sympathetic and parasympathetic (vagal) nervous systems and the balance of
these systems may have different implications for CVD and mortality risk, which may be
further modulated by gender specific factors. Palatini (2001) has suggested that the

20
relationship between tachycardia and adverse cardiovascular events is stronger for men
compared with women because they differ in autonomic balance. In men, a higher RHR is
hypothesised to reflect higher sympathetic activation whereas in women there is vagal
predominance which is cardio-protective. Future work should be directed towards exploring
gender differences in autonomic function and whether these are sensitive to social influences.
Given our working hypothesis that low SES is a potent marker of life course stresses
and that a higher RHR may encapsulate some of this differential exposure, it might have been
expected that the income gradient would become more pronounced as people age. However,
this relationship was not evident in the data. In fact, we noticed a tendency for the income
effect to dissipate with age in the baseline model when the results were stratified by age
group with the association being stronger among those aged less than 65 years compared with
those who were older than 65 years (results available upon request). This is not an entirely
unexpected finding because a higher RHR is a well established risk factor for cardiovascular
mortality, and if disadvantaged individuals are dying earlier, this will necessarily diminish the
income gradient as people age.
The analysis went further to ascertain the risk factors that were associated with social
inequalities in RHR. While socially mediated variation in exposure to classical risk factors
such as smoking and overweight were responsible for a sizeable proportion of the socio-
economic differential, the results revealed that psychosocial factors were important too.
Specifically, a larger social network size was associated with a lower RHR. Those from
more disadvantaged backgrounds were characterised by smaller social networks and higher
scores on the UCLA loneliness index. That the social network measure and the loneliness
measure were independently associated with RHR in the full multivariable adjusted model
21
implies that these variables, while related; are not synonymous. This view has been
previously articulated by Steptoe et al. (2013) who found that loneliness did not explain the
association between social isolation and mortality in their prospective study. Social network
size might therefore be more appropriately viewed as a quantitative indicator of the
availability of social support, while loneliness reflects a subjective appraisal that the quality
and/or quantity of the social network is not sufficient to meet the individual’s needs. When
the results were disaggregated by gender, psychosocial factors were found to be more
important for men than they were for women, a finding which is consistent with other
literature examining social group differences in health outcomes among men and women
(Ikeda et al. 2007; Stringhini et al. 2012).
These findings stimulate debate as to how differences in the psychosocial
environment translate into a higher RHR. The field of stress physiology arguably provides a
mechanism for the biological embedding of social isolation if one interprets social connection
as a fundamental human need, and a lack of social support/social integration as a stressor that
heightens feelings of vulnerability and promotes vigilance for threat (Hawkley & Cacioppo,
2010). Chronic activation of the stress response can cause dysregulation of hemodynamic,
endocrine, and immunologic responses that may compromise cardiovascular functioning
(Krantz &Ceney, 2002; McEwen, 2008). Consistent with such a proposition, epidemiologic
studies have documented an increase in cardiovascular mortality among socially isolated
individuals (Steptoe & Kivimaki, 2013) and widowers (Elwert & Christakis, 2008), and a
recent prospective study has documented deleterious effects of childhood isolation for
cardiovascular health risk in early adulthood (Caspi, Harrington, Moffitt, Milne, & Poulton,
2006). Alternatively, it could be that the absence of social support means that one does not

22
benefit from the protection afforded by the presence of social ties in terms of mitigating the
impact of a stressor (Cohen & Willis, 1985; Birditt, Newton & Hope, 2014).
Limitations
An obvious limitation of the study is that the data were cross-sectional so it could be
argued that a higher RHR among those who are more socially isolated reflects reverse
causation (i.e. those with existing CVD are less socially engaged because they are in worse
health). In an attempt to overcome this difficulty the models were re-estimated, excluding
cases with existing cardiovascular disease. Nevertheless, the same broad pattern of results
emerged and gender differences were still apparent for both income and the SNI score
(results available upon request). As a further test of the hypothesis that psychosocial factors
are more important for men compared with women, a supplementary analysis was performed
which explored temporal variations in RHR among respondents who had been recently
widowed. These results add further weight to the claim that heart rate is responsive to social
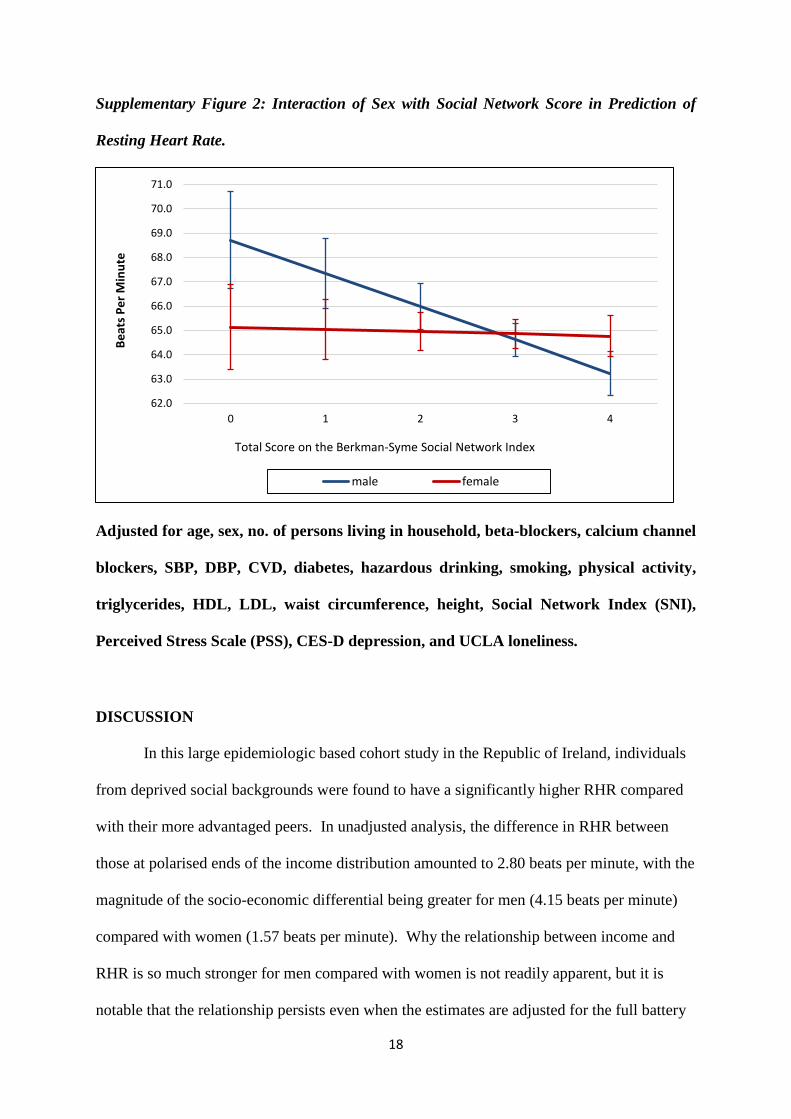
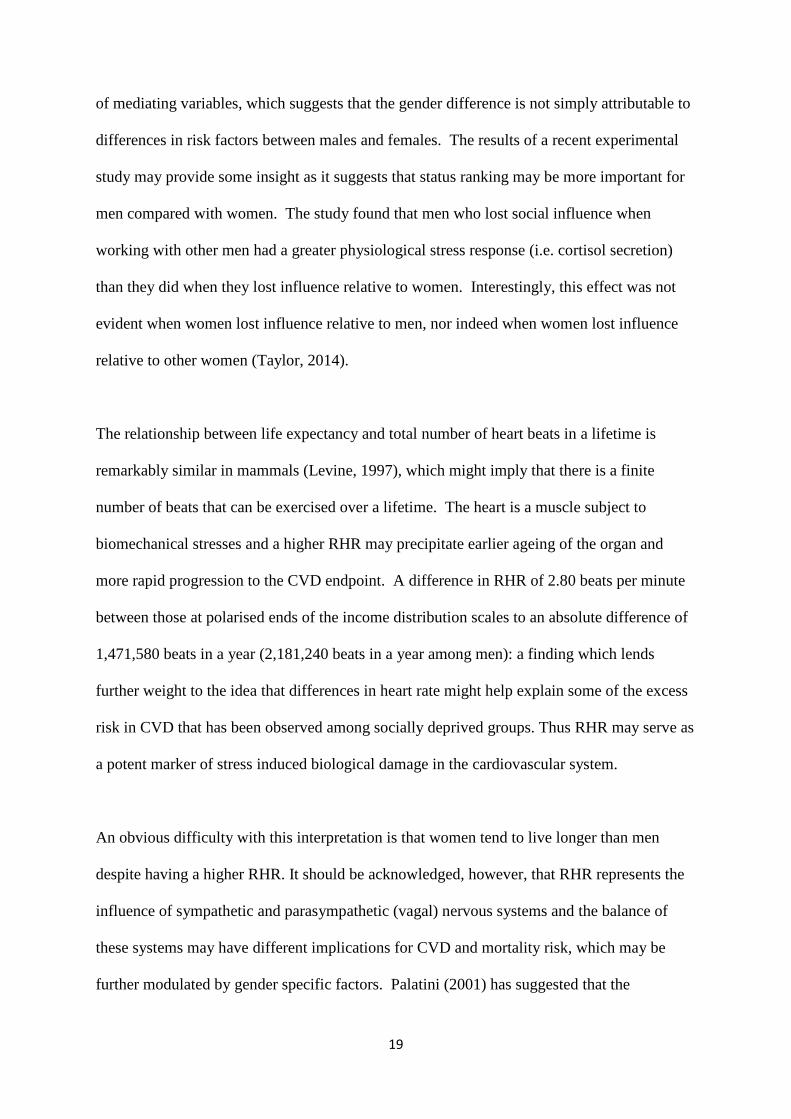
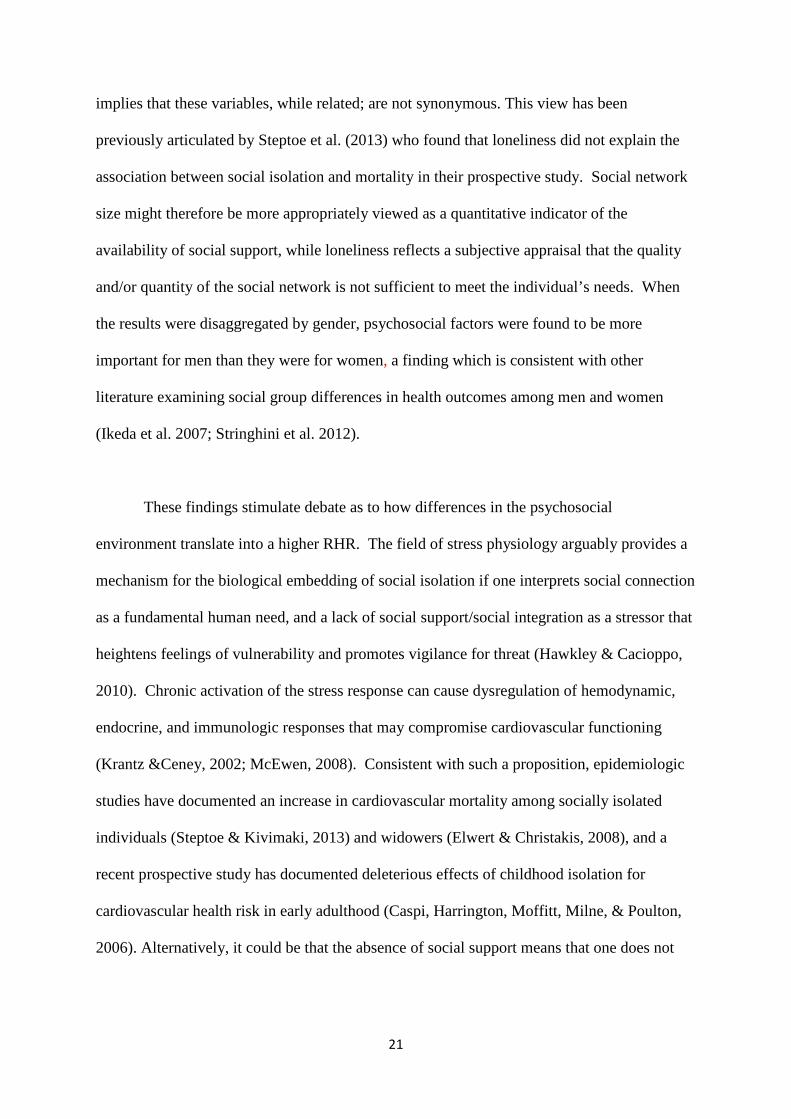
isolation, particularly amongst men. Supplementary Figure 3a shows that the years following
bereavement are characterised by a marked increase in RHR among men relative to those
who were married, but no such relationship was evident among women (Supplementary
Figure 3b). This result is consistent with evidence from a recent prospective study which
found that bereaved men who reported emotional numbness 6 months after the death of their
partner had a greater physiological stress response (i.e. cortisol) at 18 months post-loss
relative to women (Richardson, Bennett, Carr, Gallagher, Kim et al. 2013).
23
Supplementary Figure 3a: Adjusted Average Marginal Resting Heart Rate in Beats Per Minute by Bereavement Status (Men only).
Model adjusted for age, beta-blockers, calcium channel blockers, SBP, DBP and existing CVD
Supplementary Figure 3b: Adjusted Average Marginal Resting Heart Rate in Beats Per Minute by Bereavement Status (Women only).
Model adjusted for age, beta-blockers, calcium channel blockers, SBP, DBP and existing CVD
58.0
60.0
62.0
64.0
66.0
68.0
70.0
72.0
74.0
Married Widow 0-4yrs Widow 5-9yrs Widow 10yrs+
Men
Beat
s Per
Min
ute
58.0
60.0
62.0
64.0
66.0
68.0
70.0
72.0
Married Widow 0-4yrs Widow 5-9yrs Widow 10yrs+
Women
Beat
s Per
Min
ute
24
Conclusions
The study also has a number of strengths. Firstly, the study benefits from having a
large nationally representative sample which means that the results can be generalised to the
population of people aged 50 years and over. Secondly, RHR was measured using
electrocardiographic recording over a 5-min resting period. Thirdly, the study examined a
greater variety of psychosocial parameters than has been employed in previous research.
Finally, the finding that a higher level of social isolation was predictive of a higher RHR and
accounts for a substantial proportion of the socio-economic variation in RHR implies that we
should be including psychosocial parameters in our psychological and epidemiological
discourse regarding socially inequalities in CVD risk.
Funding
Funding for this work was supported by a grant to the first author from the Health Research
Board (HRB) of Ireland. Funding for the TILDA study is provided by the Irish Government,
The Atlantic Philanthropies, and Irish Life plc.

25
REFERENCES
Adameova, A., Abdellatif, Y., & Dhalla, N.S. (2009). Role of the excessive amounts of
circulating catecholamines and glucocorticoids in stress-induced heart disease.
Canadian Journal of Physiology and Pharmacology, 87(7), 493-514.
http://dx.doi.org/10.1139/Y09-042
Berkman, L.F., & Syme, S.L. (1979). Social networks, host resistance, and mortality: a
nine-year follow-up study of Alameda County residents. American Journal of
Epidemiology. 109(2), 186-204.
Birditt, K.S., Newton, N., & Hope, S. (2014). Implications of marital/partner
relationship quality and perceived stress for blood pressure among older adults.
Journals of Gerontology, Series B:Psychological Sciences and Social Sciences,
69(2), 188–198. http://dx.doi.org/10.1093/geronb/gbs123
Caspi, A., Harrington, H., Moffitt, T.E., Milne, B. J., & Poulton, R. (2006). Socially
isolated children 20 years later: Risk of cardiovascular disease. Archives of
Pediatrics & Adolescent Medicine, 160(8), 805-811.
http://dx.doi.org/10.1001/archpedi.160.8.805
Chaix, B., Jouven, X., Thomas, F., Leal, C., Billaudeau, N., Bean, K., et al. (2011).
Why socially deprived populations have a faster resting heart rate: Impact of
behaviour, life course anthropometry, and biology – the RECORD Cohort
Study. Social Science & Medicine, 73(10), 1543-1550.
http://dx.doi.org/10.1016/j.socscimed.2011.09.009
Cohen, S. & Janicki-Deverts, D. (2012). "Who's stressed? Distributions of
psychological stress in the United States in probability samples from 1983,
2006, and 2009." Journal of Applied Social Psychology, 42(6) 1320-1334.
http:// dx.doi.org/ 10.1111/j.1559-1816.2012.00900.x
26
Cohen, S., Kamarck, T., & Mermelstein, R. (1983). A global measure of perceived
stress. Journal of Health and Social Behavior, 385-396.
http://dx.doi.org/10.2307/2136404
Cohen, S., & Wills, T.A. (1985). Stress, social support, and the buffering hypothesis.
Psychological Bulletin, 98(2), 310-357. http://dx.doi.org/10.1037/0033-
2909.98.2.310
Cooney, M.T., Vartiainen, E., Laakitainen, T., Juolevi, A., Dudina, A., & Graham, I.M.
(2010). Elevated resting heart rate is an independent risk factor for
cardiovascular disease in healthy men and women. American Heart Journal,
159(4), 612 619.e613. http://dx.doi.org/10.1016/j.ahj.2009.12.029
Craig, C.L., Marshall, A.L., Sjostrom, M., Bauman, A.E., Booth, M.L., Ainsworth,
B.E., et al. (2003). International physical activity questionnaire: 12-country
reliability and validity. Medicine & Science in Sports & Exercise, 35(8), 1381-
1395. http://dx.doi.org/10.1249/01.MSS.0000078924.61453.FB
Dong, M., Giles, W.H., Felitti, V.J., Dube, S.R., Williams, J.E., Chapman, D.P., et al.
(2004). Insights into causal pathways for ischemic heart disease: adverse
childhood experiences study. Circulation., 110(13), 1761-1766.
http://dx.doi.org/10.1161/01.CIR.0000143074.54995.7F
Elwert, F., & Christakis, N. A. (2008). The effect of widowhood on mortality by the
causes of death of both spouses. American Journal of Public Health, 98(11),
2092-2098. http://dx.doi.org/10.2105/AJPH.2007.114348
Eriksson, J. G. (2011). Early growth and coronary heart disease and type 2 diabetes:
findings from the Helsinki Birth Cohort Study (HBCS). The American Journal
of Clinical Nutrition, 94(6 Suppl), 1799S-1802S.
http://dx.doi.org/10.3945/ajcn.110.000638
27
Ewing, J. A. (1984). Detecting alcoholism. JAMA: The Journal of the American
Medical Association, 252(14), 1905-1907.
http://dx.doi.org/10.1001/jama.252.14.1905
Fiscella K, Tancredi. D. (2008). Socioeconomic status and coronary heart disease risk
prediction. JAMA: The Journal of the American Medical Association, 300(22),
2666-2668. http://dx.doi.org/10.1001/jama.2008.792
Hawkley, L.C., & Cacioppo, J.T. (2010). Loneliness matters: a theoretical and
empirical review of consequences and mechanisms. Annals of Behavioral
Medicine, 40(2), 218-227. http://dx.doi.org/10.1007/s12160-010-9210-8
Hawkley, L. C., Thisted, R. A., Masi, C. M., & Cacioppo, J. T. (2010). Loneliness
predicts increased blood pressure: Five-year cross-lagged analyses in middle-
aged and older adults. Psychology and Aging, 25, 132-141.
http://dx.doi.org/10.1037/a0017805
Hiscock, R., Bauld, L., Amos, A., Fidler, J.A., & Munafò, M. (2012). Socioeconomic
status and smoking: a review. Annals of the New York Academy of Sciences,
1248(1), 107-123. http://dx.doi.org/10.1111/j.1749-6632.2011.06202.x
Hozawa, A., Ohkubo, T., Kikuya, M., Ugajin, T., Yamaguchi, J., Asayama, K., et al.
(2004). Prognostic value of home heart rate for cardiovascular mortality in the
general population: The Ohasama study. American Journal of Hypertension,
17(11), 1005-1010. http://dx.doi.org/10.1016/j.amjhyper.2004.06.019
Ikeda, A., Iso, H., Toyoshima, H., Fujino, Y., Mizoue, T., Yoshimura, T., ... &
Tamakoshi, A. (2007). Marital status and mortality among Japanese men and
women: the Japan Collaborative Cohort Study. BMC Public Health, 7(1), 73.
http://dx.doi.org/10.1186/1471-2458-7-73
28
Jensen, M.T., Marott, J.L., Allin, K.H., Nordestgaard, B.G., & Jensen, G.B. (2012).
Resting heart rate is associated with cardiovascular and all-cause mortality after
adjusting for inflammatory markers: The Copenhagen City Heart Study.
European Journal of Preventive Cardiology, 19(1), 102-108.
http://dx.doi.org/10.1177/1741826710394274
Knight, R.G., Williams, S., McGee, R., & Olaman, S. (1997). Psychometric properties
of the Centre for Epidemiologic Studies Depression Scale (CES-D) in a sample
of women in middle life. Behaviour Research and Therapy. 1997;35(4):373-80.
http://dx.doi.org/10.1016/S0005-7967(96)00107-6
Kramer, M.S., Seguin, L., Lydon, J., & Goulet, L. (2000). Socio-economic disparities in
pregnancy outcome: why do the poor fare so poorly? Paediatric & Perinatal
Epidemiology, 14(3), 194-210. http://dx.doi.org/10.1046/j.1365-
3016.2000.00266.x
Krantz, D.S., & McCeney, M.K. (2002). Effects of psychological and social factors on
organic disease: A critical assessment of research on coronary heart disease.
Annual Review of Psychology, 53, 341-369.
http://dx.doi.org/10.1146/annurev.psych.53.100901.135208
Kristal-Boneh, E., Silber, H., Harari, G., & Froom, P. (2000). The association of resting
heart rate with cardiovascular, cancer and all-cause mortality. Eight year follow-
up of 3527 male Israeli employees (the CORDIS Study). European Heart
Journal, 21(2), 116-124. http://dx.doi.org/10.1053/euhj.1999.1741
Levine, H. J. (1997). Rest heart rate and life expectancy. Journal of the American
College of Cardiology, 30(4), 1104-1106.
Lynch, J.W., Kaplan, G.A., Cohen R.D., Tuomilehto, J. &, Salonen, J.T. (1996). Do
cardiovascular risk factors explain the relation between socioeconomic status,
29
risk of all-cause mortality, cardiovascular mortality, and acute myocardial
infarction? American Journal of Epidemiology, 144(10):934–942.
http://dx.doi.org/10.1093/oxfordjournals.aje.a008863
Matthews, K.A., & Gallo, L.C. (2011). Psychological perspectives on pathways linking
socioeconomic status and physical health. Annual Review of Psychology, 62,
501. http://dx.doi.org/10.1146/annurev.psych.031809.130711
McEwen, B.S. (2008). Central effects of stress hormones in health and disease:
Understanding the protective and damaging effects of stress and stress
mediators. European Journal of Pharmacology, 583(2), 174-185.
http://dx.doi.org/10.1016/j.ejphar.2007.11.071
Melchior, M., Berkman, L.F., Niedhammer, I., Chea, M., & Goldberg, M. (2003).
Social relations and self-reported health: a prospective analysis of the French
Gazel cohort. Social Science & Medicine, 56(8), 1817-1830.
http://dx.doi.org/10.1016/S0277-9536(02)00181-8
Palatini, P. (2001). Heart rate as a cardiovascular risk factor: do women differ from
men? Annals of Medicine. 33(4), 213-221.
http://dx.doi.org/10.3109/07853890108998748
Perret-Guillaume, C., Joly, L., & Benetos, A. (2009). Heart Rate as a Risk Factor for
Cardiovascular Disease. Progress in Cardiovascular Diseases, 52(1), 6-10.
http://dx.doi.org/10.1016/j.pcad.2009.05.003
Radloff LS. The CES-D Scale. Applied Psychological Measurement. 1977;1(3):385-
401.http://dx.doi.org/10.1177/014662167700100306
Ricciuto, L.E., & Tarasuk, V.S. (2007). An examination of income-related disparities in
the nutritional quality of food selections among Canadian households from

30
1986–2001. Social Science & Medicine, 64(1), 186-198.
http://dx.doi.org/10.1016/j.socscimed.2006.08.020
Richardson, V. E., Bennett, K. M., Carr, D., Gallagher, S., Kim, J., & Fields, N. (2013).
How does bereavement get under the skin? The effects of late-life spousal loss
on cortisol levels. The Journals of Gerontology Series B: Psychological
Sciences and Social Sciences. http://dx.doi.org/10.1093/geronb/gbt116
Russell, D.W. (1996). UCLA Loneliness Scale (Version 3): Reliability, validity, and
factor structure. Journal of Personality Assessment, 66(1), 20-40.
http://dx.doi.org/10.1207/s15327752jpa6601_2
Smith, G. D., McCarron, P., Okasha, M., & McEwen, J. (2001). Social circumstances in
childhood and cardiovascular disease mortality: prospective observational study
of Glasgow University students. Journal of Epidemiology and Community
Health, 55(5), 340-341. http://dx.doi.org/10.1136/jech.55.5.340
Steptoe, A., & Kivimaki, M. (2013). Stress and cardiovascular disease: an update on
current knowledge. Annual Review of Public Health, 34, 337-354.
http://dx.doi.org/10.1146/annurev-publhealth-031912-114452
Steptoe, A., Shankar, A., Demakakos, P., & Wardle, J. (2013). Social isolation,
loneliness, and all-cause mortality in older men and women. Proceedings of the
National Academy of Sciences (PNAS), 110(15), 5797-5801.
http://dx.doi.org/10.1073/pnas.1219686110
Stringhini, S., Berkman, L., Dugravot, A., Ferrie, J.E., Marmot, M., Kivimaki, M., &
Singh-Manoux, A. (2012). Socioeconomic Status, Structural and Functional
Measures of Social Support, and Mortality: The British Whitehall II Cohort
Study, 1985-2009. American Journal of Epidemiology, 15; 175(12), 1275-83.
http://dx.doi.org/10.1093/aje/kwr461
31
Tardif, J.C. (2009). Heart rate as a treatable cardiovascular risk factor. British Medical
Bulletin, 90(1), 71-84. http://dx.doi.org/10.1093/bmb/idp016.
Taylor, C.J. (2014). Physiological stress response to loss of social influence and threats
to masculinity. Social Science & Medicine, 103, 51-59.
http://dx.doi.org/10.1016/j.socscimed.2013.07.036
Unger, J. B., McAvay, G., Bruce, M L., Berkman, L., & Seeman, T. (1999). Variation in the
impact of social network characteristics on physical functioning in elderly persons:
MacArthur Studies of Successful Aging. The Journals of Gerontology Series B:
Psychological Sciences and Social Sciences, 54(5), S245-S251.
http://dx.doi.org/10.1093/geronb/54B.5.S245
Whelan, B. J., & Savva, G. M. (2013). Design and methodology of the Irish
Longitudinal Study on Ageing. Journal of the American Geriatrics
Society,61(s2), S265-S268. http://dx.doi.org/10.1111/jgs.12199
Whelton, S.P., Narla, V., Blaha, M.J., Nasir, K., Blumenthal, R.S. et al., (2014).
Association between resting heart rate and inflammatory biomarkers (high
sensitivity C-reactive protein, interleukin 6 and fibrinogen) (from the Multi-
Ethnic Study of Atherosclerosis). American Journal of Cardiology, 113(4),
644-649. http://dx.doi.org/10.1016/j.amjcard.2013.11.009
W.H O. (2013). Collaborating Centre for Drug Statistics Methodology: Guidelines for
ATC classification and DDD assignment 2013. Oslo.
http://www.whocc.no/atc_ddd_publications/guidelines/
32
Table 1: Baseline characteristics of the sample
Variable All Sample Men Women
Mean (SD)
or % N
Mean (SD) or %
N Mean (SD)
or % N
Resting Heart rate 64.8 (10.7) 4888 64.4 (11.0) 2242 65.2 (10.4) 2646
Systolic Blood Pressure 135.7 (19.5) 4865 138.8 (17.9) 2231 132.7 (20.5) 2634
Diastolic Blood Pressure 82.3 (11.2) 4865 83.4 (10.8) 2231 81.3 (11.5) 2634
Sex - 4888 48.0% 2242 52.0% 2646
Age 63.3 (9.3) 4880 62.7 (8.8) 2240 63.8 (9.7) 2640
Beta blockers 14.0% 4888 15.6% 2242 12.5% 2646
Calcium channel blockers 9.8% 4888 10.1% 2242 9.5% 2646
No. of CVD’s 0.15 (0.46) 4888 0.20 (0.53) 2242 0.11 (0.38) 2646
Diabetes 7.5% 4888 9.4% 2242 5.8% 2646
Median Income (€) 30,000 4495 30,000 2120 25,500 2375
Hazardous drinker 13.4% 4440 18.6% 2026 8.5% 2414
Never smoked 42.3%
4888
35.4%
2242
48.8%
2646 Past smoker 38.1% 45.1% 31.7%
Current smoker 19.6% 19.5% 19.6%
IPAQ – low PA 30.3%
4850
25.2%
2222
34.9%
2628 IPAQ – medium PA 35.0% 32.0% 37.8%
IPAQ – high PA 34.7% 42.9% 27.3%
Triglycerides 1.76 (1.10) 4772 1.94 (1.19) 2206 1.60 (0.98) 2566
Low density lipoprotein (LDL) 2.90 (0.96) 4772 2.77 (0.95) 2206 3.02 (0.95) 2566
High density lipoprotein (HDL) 1.52 (0.42) 4772 1.34 (0.33) 2206 1.69 (0.43) 2566
Waist circumference (cms) 95.6 (13.8) 4876 101.7 (11.9) 2236 90.0 (13.1) 2640
Height (cms) 165.8 (9.3) 4884 172.9 (6.56) 2241 159.3 (6.21) 2643
Social network index 2.86 (0.88) 4888 2.91 (0.86) 2242 2.81 (0.89) 2646
Perceived stress scale 4.25 (3.14) 4414 4.12 (2.96) 2024 4.37 (3.31) 2390
CES-D 5.97 (7.31) 4825 5.0 (6.34) 2218 6.88 (8.07) 2606
UCLA loneliness 1.98 (2.21) 4422 1.85 (2.09) 2024 2.10 (2.33) 2398

33
Table 2: Variation in the mediating variables by household income quintiles
Variable Income 1 (lowest)
Income 2
Income 3
Income 4
Income 5 (highest)
Test for linear trend
Mean (95% CI) Mean (95% CI) Mean (95% CI) Mean (95% CI) Mean (95% CI) p-value Male (%) 40.5 [36.1, 45.0] 45.7 [42.2, 49.2] 48.2 [44.9, 51.5] 57.0 [53.8, 60.2] 56.1 [53.6, 58.6] p<0.001 Age (years) 66.6 [65.5, 67.7] 65.5 [64.6, 66.5] 64.1 [63.3, 64.9] 60.9 [60.1, 61.7] 58.7 [58.1, 59.3] p<0.001 Systolic Blood Pressure (SBP) 135.9 [133.9, 137.8] 137.4 [135.7, 139.0] 136.2 [134.8, 137.5] 134.6 [133.2, 136.0] 134.1 [132.8, 135.4] p<0.001 Diastolic Blood Pressure (DSP) 81.6 [80.5, 82.6] 82.0 [81.1, 83.0] 82.1 [81.3, 82.8] 82.6 [81.8, 83.4] 83.2 [82.4, 83.9] n.s Beta blockers 17.3 [13.8, 21.5] 17.6 [14.5, 21.1] 15.0 [12.2, 18.3] 11.9 [9.8, 14.4] 9.5 [7.7, 11.7] p<0.001 Calcium channel blockers 9.1 [6.9, 12.0] 13.3 [10.4, 17.0] 9.7 [7.8, 12.0] 9.6 [7.4, 12.4] 6.2 [4.8, 8.0] p<0.001 No. of cardio. diseases 0.19 [0.14,0.23] 0.16 [0.12, 0.19] 0.18 [0.14, 0.22] 0.14 [0.10, 0.17] 0.07 [0.05, 0.09] p<0.001 Diabetes (%) 8.6 [6.3, 11.6] 10.5 [7.9, 13.7] 7.0 [5.2,9.4] 6.9 [5.3, 9.0] 4.6 [3.3, 6.2] p<0.001 Never smoked (%) 36.2 [31.5, 41.2] 40.4 [36.2, 44.6] 45.1 [41.6, 48.7] 41.0 [37.6, 44.6] 48.5 [45.3, 51.7] P<0.001 Past smoker (%) 39.2 [34.4 44.2] 37.8 [33.7. 42.1] 35.4 [32.1, 38.9] 40.2 [36.8, 43.6] 38.3 [35.2, 41.5] n.s Current smoker (%) 24.6 [20.1, 29.8] 21.8 [18.3, 25.9] 19.5 [16.4, 22.9] 18.8 [15.8, 22.3] 13.2 [11.0, 15.9] p<0.001 Hazardous drinking (%) 13.7 [10.5, 17.7] 9.3 [7.2, 11.8] 13.3 [10.8, 16.4] 15.4 [12.9, 18.2] 17.1 [14.7, 19.7] p<0.001 IPAQ – Low PA (%) 36.0 [31.2, 41.0] 31.0 [27.3, 35.0] 28.4 [25.0, 32.0] 28.6 [25.3, 32.2] 25.1 [22.1, 28.4] p<0.01 IPAQ – Moderate PA (%) 32.9 [28.6, 37.5] 37.4 [33.2, 41.7] 34.2 [30.9, 37.7] 33.8 [30.3, 37.5] 37.2 [34.0, 40.4] n.s. IPAQ – High PA (%) 31.1 [26.6, 36.1] 31.6 [27.6, 35.9] 37.4 [33.7, 41.3] 37.6 [33.9, 41.4] 37.8 [34.1, 41.6] n.s. Triglycerides 1.77 [1.67, 1.87] 1.77 [1.68, 1.86] 1.73 [1.66, 1.81] 1.81 [1.73, 1.89] 1.72 [1.65, 1.80] n.s Low density lipoprotein (LDL) 2.89 [2.80, 2.99] 2.80 [2.71, 2.88] 2.85 [2.79, 2.92] 2.93 [2.86, 3.01] 3.01 [2.95, 3.06] p<0.01 High density lipoprotein (HDL) 1.55 [1.51, 1.59] 1.47 [1.44, 1.50] 1.53 [1.50, 1.56] 1.50 [1.47, 1.53] 1.54 [1.51, 1.57] n.s Height (cms) 163.2 [162.3, 164.1] 164.8 [164.0, 165.5] 165.2 [164.5, 165.8] 168.1 [167.5, 168.7] 168.6 [168.1, 169.2] p<0.001 Waist circumference (cms) 95.1 [93.7, 96.6] 97.0 [96.0, 98.0] 95.9 [94.9, 96.8] 96.0 [95.1, 97.0] 95.0 [94.1, 95.9] n.s. Perceived stress score 4.73 [4.39, 5.07] 4.85 [4.58, 5.11] 4.34 [4.08, 4.60] 3.81 [3.56, 4.05] 3.45 [3.24, 3.66] p<0.001 Social Network index 2.46 [2.38, 2.54] 2.79 [2.72, 2.87] 2.93 [2.86, 3.01] 2.95 [2.89, 3.02] 3.13 [3.07, 3.19] p<0.001 CES-D 7.71 [6.80, 8.62] 6.15 [5.48, 6.82] 5.88 [5.22, 6.54] 4.98 [4.46, 5.50] 4.55 [4.10, 4.99] p<0.001 UCLA loneliness 2.68 [2.42, 2.94] 2.19 [2.00, 2.38] 1.92 [1.72, 2.12] 1.75 [1.58, 1.93] 1.29 [1.17, 1.41] p<0.001
34
Table 3: Attenuation of the social gradient in Resting Heart Rate (RHR) in Hierarchical Linear Regression Analysis.
(a) All Sample (n=4888)
Model 1
(Initial)
Model 1 + classical risk
factors
Model 1 + psychosocial
risk factors
Model 1 + classical and
psychosocial risk factors
B 95% CI B 95% CI B 95% CI B 95% CI
Income 1 (lowest) 2.80*** [1.54, 4.06] 1.96** [0.70, 3.23] 1.96** [0.66, 3.26] 1.41* [0.12, 2.70]
Income 2 2.02*** [0.81, 3.23] 1.21* [0.01, 2.41] 1.49* [0.27, 2.72] 0.86 [-0.35, 2.07]
Income 3 1.73** [0.59, 2.86] 1.24* [0.13, 2.36] 1.41* [0.28, 2.53] 1.04 [-0.07, 2.15]
Income 4 1.18* [0.18, 2.18] 0.99 [-0.01, 2.00] 1.04* [0.03, 2.05] 0.89 [-0.12, 1.91]
Income 5 (highest) REF - REF - REF - REF -
Social Network Index - - - - -0.87*** [-1.34, -0.41] -0.70** [-1.15, -0.25]
Perceived Stress Scale - - - - 0.11 [-0.05, 0.27] 0.06 [-0.09, 0.21]
CES-D depression - - - - 0.01 [-0.06, 0.08] -0.02 [-0.08, 0.05]
UCLA loneliness - - - - 0.19 [-0.03, 0.41] 0.22* [0.01, 0.43]
(b) Men (n=2242)
Income 1 (lowest) 4.15*** [2.18, 6.12] 3.28*** [1.36, 5.19] 2.96** [0.94, 4.98] 2.42** [0.48, 4.37] Income 2 2.86** [1.09, 4.63] 2.11* [0.36, 3.86] 2.23* [0.45, 4.00] 1.66 [-0.09, 3.41] Income 3 2.01* [0.32, 3.70] 1.55 [-0.08, 3.18] 1.63 [-0.07, 3.32] 1.30 [-0.32, 2.91] Income 4 1.87* [0.34, 3.41] 1.73* [0.23, 3.24] 1.72* [0.19, 3.25] 1.61* [0.12, 3.11] Income 5 (highest) REF - REF - REF - REF -

35
***significant at the 0.001 level, **significant at the 0.01 level, * significant at the 0.05 level
Model 1: adjusted for age, (sex- all sample) no. of persons living in household, beta-blockers, calcium channel blockers, SBP, DBP and CVD.
Model 2: Model 1 + diabetes, hazardous drinking, smoking, physical activity, triglycerides, HDL, LDL, waist circumference, height.
Model 3: Model 1 + Social Network Index (SNI), Perceived Stress Scale (PSS), CES-D depression, and UCLA loneliness.
Model 4: Model 1 + diabetes, hazardous drinking, smoking, physical activity, triglycerides, HDL, LDL, waist circumference, height, SNI, PSS, CES-D, and UCLA loneliness.
Social Network Index - - - - -1.36*** [-2.03, -0.69] -1.09*** [-1.74, -0.44] Perceived Stress Scale - - - - 0.19 [-0.03, 0.40] 0.12 [-0.09, 0.32] CES-D depression - - - - 0.00 [-0.10, 0.11] -0.05 [-0.16, 0.05] UCLA loneliness - - - - 0.12 [-0.19, 0.44] 0.22 [-0.09, 0.53]
(c) Women (n=2646)
Income 1 (lowest) 1.57* [0.04, 3.10] 0.73 [-0.80, 2.27] 1.06 [-0.51, 2.62] 0.43 [-1.12, 1.98]
Income 2 1.34 [-0.29, 2.96] 0.43 [-1.11, 1.97] 0.96 [-0.68, 2.60] 0.21 [-1.35, 1.76]
Income 3 1.37 [-0.06, 2.80] 0.74 [-0.66, 2.15] 1.14 [-0.27, 2.56] 0.62 [-0.78, 2.02]
Income 4 0.48 [-0.81, 1.78] 0.30 [-0.96, 1.55] 0.38 [-0.91, 1.67] 0.23 [-1.02, 1.49]
Income 5 (highest) REF - REF - REF - REF -
Social Network Index - - - - -0.40 [-1.01, 0.22] -0.30 [-0.89, 0.29] Perceived Stress Scale - - - - 0.05 [-0.17, 0.27] 0.01 [-0.20, 0.22] CES-D depression - - - - 0.01 [-0.07, 0.10] 0.01 [-0.07, 0.09] UCLA loneliness - - - - 0.21 [-0.12, 0.54] 0.19 [-0.12, 0.50]