the intracranial distribution of gliomas in relation to...
TRANSCRIPT

This is a repository copy of The Intracranial Distribution of Gliomas in Relation to Exposure From Mobile Phones: Analyses From the INTERPHONE Study.
White Rose Research Online URL for this paper:http://eprints.whiterose.ac.uk/109640/
Version: Accepted Version
Article:
Grell, K, Frederiksen, K, Schüz, J et al. (18 more authors) (2016) The Intracranial Distribution of Gliomas in Relation to Exposure From Mobile Phones: Analyses From the INTERPHONE Study. American Journal of Epidemiology, 184 (11). pp. 818-828. ISSN 0002-9262
https://doi.org/10.1093/aje/kww082
© The Author 2016. Published by Oxford University Press on behalf of the Johns Hopkins Bloomberg School of Public Health. This is a pre-copyedited, author-produced PDF of an article accepted for publication in American Journal of Epidemiology following peer review. The version of record, Grell, K, Frederiksen, K, Schüz, J et al. (18 more authors) (2016) The Intracranial Distribution of Gliomas in Relation to Exposure From Mobile Phones: Analyses From the INTERPHONE Study. American Journal of Epidemiology, 184 (11). pp. 818-828., is available online at: https://doi.org/10.1093/aje/kww082
[email protected]://eprints.whiterose.ac.uk/
Reuse
Unless indicated otherwise, fulltext items are protected by copyright with all rights reserved. The copyright exception in section 29 of the Copyright, Designs and Patents Act 1988 allows the making of a single copy solely for the purpose of non-commercial research or private study within the limits of fair dealing. The publisher or other rights-holder may allow further reproduction and re-use of this version - refer to the White Rose Research Online record for this item. Where records identify the publisher as the copyright holder, users can verify any specific terms of use on the publisher’s website.
Takedown
If you consider content in White Rose Research Online to be in breach of UK law, please notify us by emailing [email protected] including the URL of the record and the reason for the withdrawal request.

This is a pre-copyedited, author-produced version of an article accepted for publication in
American Journal of Epidemiology following peer review. The version of record is “The In-
tracranial Distribution of Gliomas in Relation to Exposure From Mobile Phones: Analyses
From the INTERPHONE Study. Grell K, Frederiksen K, Schuz J, Cardis E, Armstrong
B, Siemiatycki J, Krewski DR, McBride ML, Johansen C, Auvinen A, Hours M, Blettner
M, Sadetzki S, Lagorio S, Yamaguchi N, Woodward A, Tynes T, Feychting M, Fleming
SJ, Swerdlow AJ, Andersen PK. Am J Epidemiol. 2016 Dec 1;184(11):818-828.”
It is available online at: http://aje.oxfordjournals.org/content/184/11/818
Doi: 10.1093/aje/kww082
The spatial distribution of gliomas in relation to
exposure from mobile phones: analyses from the
Interphone Study
Kathrine Grell1,2, Kirsten Frederiksen1, Joachim Schuz3, Elisabeth
Cardis4, Bruce Armstrong5, Jack Siemiatycki6, Daniel R. Krewski7, Mary
L. McBride8, Christoffer Johansen9, Anssi Auvinen10,11, Martine Hours12,
Maria Blettner13, Siegal Sadetzki14,15, Susanna Lagorio16, Naohito
Yamaguchi17, Alistair Woodward18, Tore Tynes19,20, Maria Feychting21,
Sarah J. Fleming22, Anthony J. Swerdlow23,24, and Per K. Andersen2
1

1Unit of Statistics, Bioinformatics and Registry, Danish Cancer Society Research Center, Copenhagen,
Denmark , 2Section of Biostatistics, Department of Public Health, Faculty of Health and Medical
Sciences, University of Copenhagen, Copenhagen, Denmark , 3Section of Environment and Radiation,
International Agency for Research on Cancer (IARC), Lyon, France , 4Centre for Research in
Environmental Epidemiology (CREAL), Universitat Pompeu Fabra (UPF) and CIBER Epidemiologıa y
Salud Publica (CIBERESP), Barcelona, Spain , 5Sydney School of Public Health, University of Sydney
and Sax Institute, Sydney, Australia , 6Guzzo-CRS Chair in Environment and Cancer, School of Public
Health, University of Montreal, Montreal, Quebec, Canada , 7Department of Epidemiology and
Community Medicine, Faculty of Medicine, University of Ottawa, Ottawa, Ontario, Canada , 8Cancer
Control Research Department, BC Cancer Agency, Vancouver, British Columbia, Canada , 9Unit of
Survivorship, Danish Cancer Society Research Center, Copenhagen, Denmark , 10STUK - Radiation and
Nuclear Safety Authority, Helsinki, Finland , 11University of Tampere, School of Health Sciences,
Tampere, Finland , 12Epidemiological Research and Surveillance Unit in Transport Occupation and
Environment-Universite de Lyon, Lyon, France , 13Institute for Medical Biostatistics, Epidemiology and
Informatics, University Medical Center, Johannes Gutenberg University Mainz, Mainz, Germany ,
14Cancer & Radiation Epidemiology Unit, Gertner Institute, Chaim Sheba Medical Center, Ramat Gan,
Israel , 15Sackler Faculty of Medicine, Tel-Aviv University, Tel-Aviv, Israel , 16Istituto Superiore di
Sanita, National Centre for Epidemiology, Surveillance and Health Promotion, Rome, Italy ,
17Department of Public Health, School of Medicine, Tokyo Women’s Medical University, Tokyo, Japan ,
18Epidemiology and Biostatistics, School of Population Health, University of Auckland, Auckland, New
Zealand , 19Department of Occupational Health Surveillance, National Institute of Occupational Health,
Oslo, Norway , 20Institute of Epidemiological Cancer Research, Cancer Registry of Norway, Oslo,
Norway , 21Unit of Epidemiology, Institute of Environmental Medicine, Karolinska Institutet, Stockholm,
Sweden , 22Division of Epidemiology and Biostatistics, Leeds Institute of Cardiovascular and Metabolic
Medicine, University of Leeds, Leeds, United Kingdom , 23Institute of Cancer Research, Division of
Genetics and Epidemiology, London, United Kingdom , 24Institute of Cancer Research, Division of
Breast Cancer Research, London, United Kingdom
2

When investigating the association between brain tumors and mobile phone use, accurate
data on tumor position is essential, due to the highly localized absorption of energy in
the human brain from the radiofrequency fields emitted. We used a point process model
to investigate this association using data that included tumor localization from the multi-
national Interphone Study. Our main analysis included 792 regular mobile phone users
diagnosed with a glioma between 2000–2004. Similar to earlier results, we found a statisti-
cally significant association between the spatial distribution of gliomas and the self-reported
location of the phone. When accounting for preferred side not being exclusively used for
all mobile phone calls, the results were similar. The association was independent of the
cumulative call time or cumulative number of calls. We also observed a significant asso-
ciation between tumor distribution and total cumulative specific energy absorbed at the
tumor’s center of gravity, which had been calculated for a subset of the data. However,
our model uses reported side of mobile phone use, which is potentially influenced by recall
bias. The point process method provides an alternative to previously used epidemiological
designs when including localization in the investigation of brain tumors and mobile phone
use.
Abbreviations: CT, Computerized tomography; IARC, International Agency for Research
on Cancer; MRI, Magnetic resonance image; RF, Radio frequency; RF-EMF, Radio fre-
quency electromagnetic fields; SAR, Specific absorption rate; TCSE, Total cumulative
specific energy; WHO, World Health Organization
3

Mobile phone use has increased dramatically within the last three decades in most coun-
tries (1). The extensive use of mobile phones has been followed by concerns about potential
adverse health effects of exposure to radio frequency electromagnetic fields (RF-EMF) emit-
ted by mobile phones (2). RF-EMF were classified as group 2B ‘possibly carcinogenic to
humans’ in May 2011 by the International Agency for Research on Cancer (IARC) (3, 4).
The IARC monograph’s working group considered that the most informative epidemiolog-
ical evidence came from the Swedish case-control studies by Hardell et al. (5) and the
multinational case-control “Interphone” study coordinated by IARC (6). The latter is the
largest investigation of mobile phone use and brain tumors to date. Interphone observed no
increased glioma risk except for the decile with the highest reported cumulative call-time
(>1640 hours) and with uncertain interpretation. The national publications on the Inter-
phone data (7–13) and other studies on the association between RF radiation from mobile
phones and brain tumors (14–23) have shown mixed results. When interpreting these
findings, the timing of the study, the exposure variables of relevance, and methodological
limitations have to be considered (24, 25).
The absorption of energy from RF-EMF in human tissue greatly depends on distance
from the source in addition to factors such as frequency band, network characteristics, and
conditions of use (26). Consequently, increased occurrence of tumors in the part of the
brain closest to the phone would be expected if there were a causal association. Analyses of
all brain tumors together without localization are likely to dilute a risk if present, hence it is
crucial to include localization. Some studies divided the participants into ipsilateral phone
users (participants reporting preferential use of the phone on the same side of the head
as the tumor was localized) and contralateral phone users (the opposite) (6, 9–12, 16, 20–
22). Others investigated the risk of brain tumors separately in the different anatomical
lobes of the brain (6, 12, 14, 16, 19, 21). Some studies estimated the distance between
the brain tumor and the mobile phone and divided cases into those close to the phone
where most energy from RF-EMF is absorbed versus further away (27, 28). Additionally,
4

both the specific absorption rate of energy (SAR) inside the tumor (29) and the total
cumulative specific energy (TCSE) for each tumor (30) have been estimated for use as
exposure measures.
Our aim is to use the three-dimensional point process model described in Grell et al.
(31) to analyze the Interphone localization data for glioma and thereby further investi-
gate the association between glioma and mobile phone use. A case-only approach removes
possible differential bias between cases and controls, and the specific tumor localizations
collected in the Interphone study allow detailed analysis of spatial relations. Moreover, we
added a mixing proportion to our model to take into account that self-reported preferred
side of use did not mean exclusive use on that side.
METHODS
The Interphone study included participants from 13 countries (Australia, Canada, Den-
mark, Finland, France, Germany, Israel, Italy, Japan, New Zealand, Norway, Sweden, and
the United Kingdom) and cases were between 30 and 59 years of age when diagnosed
with a first primary glioma, meningioma or acoustic neuroma during study periods of 2–4
years between 2000 and 2004. The study has been described in detail elsewhere (32). We
included only gliomas in our analyses as their putative origin is less spatially confined
compared to those of meningiomas and acoustic neuromas. The Interphone data comprise
2700 glioma cases and tumor localization was performed by neuroradiologists on 1530 of
these cases. The localization could not be determined for all cases due to difficulties in re-
trieving appropriate scans. The computer program GridMaster was created specifically for
recording localizations in the Interphone study and consisted of a three-dimensional grid
map of the human head and brain made up of 1 cm cubes (voxels) (33). Neuroradiologists
recorded the tumor contours and their best estimate of the tumor origin in GridMaster
using radiological images (preferably MRI, otherwise CT) when available (92.2%) or ra-
diology reports otherwise (7.8%); hence, they scaled each brain to match the GridMaster
5

brain. Of the 1530 tumors with localization data, 906 had a single voxel marked as the
putative origin, 383 had no putative origin marked, and 241 had several voxels marked as
the putative origin.
Detailed information on past mobile phone use was collected by interview, including
number of calls, duration of calls, use of a hands-free device, preferred side of the head
for mobile phone use, and time since start of use. A regular phone user was defined as
a person who made at least one call per week for a period of 6 months or more. Among
the 1530 glioma cases with recorded localization, 933 were regular phone users. The 597
non-regular phone users and non-users were defined as not exposed and are not included
in our analyses. The lifetime cumulative call time and number of calls excluding use with
hands-free devices were calculated in the Interphone study (32, 34). Absorbed RF energy
is widely used as a quantity of RF exposure in tissue and the TCSE was calculated based
on an algorithm which included, among other things, self-reported call time, laterality of
use, hands-free devices, frequency band, communication system, phone class, and network
characteristics (35) at each location in the GridMaster brain for the 372 Interphone study
subjects with tumor localization from five countries (Australia, Canada, France, Israel,
and New Zealand).
The Interphone interview had a question about which side of the head mobile phones
were generally used with ‘generally’ meaning more than 50% of the time. Of the 933 regular
phone users 265 (28.4%) reported left side, 527 (56.5%) reported right side, 110 (11.8%)
reported both sides and for the remaining 31 (3.3%) the preferred side was unknown.
All diagnoses were histologically confirmed or based on unequivocal diagnostic imaging.
From the morphology codes the tumors were assigned a grade as defined by WHO (36)
but this was only possible for 880 (94.3%) of the regular phone users.
Exposure localization. The ear canals were fully contained within 48 voxels on each side of
the GridMaster head and we defined the location of the exposure source as the geometric
midpoint of the outer area of these voxels. We will refer to this point as the ear. For the
6

GridMaster head, the nearest brain tissue is 15 mm and the midline of the brain is 85 mm
in horizontal distance from the ear. We assumed that the energy was emitted at the ear
on the side of the head where the mobile phone was self-reported as generally used.
Tumor localization. We condensed the tumor localization for each of the 792 regular mobile
phone users with self-reported preferred side into a single point. Ideally, this point would
represent the origin of the tumor. However, a glioma can grow diffusely and does not
necessarily form a single, consolidated mass. Actually, 36 of the 1530 tumors comprised
more than one patch of contiguous (i.e., sharing either a vertex, edge or face) voxels. We
reviewed a plot of these tumors and decided to include them with all tumor voxels when
calculating a tumor central point. We calculated the tumor localization point as the ‘center
of gravity’, which has previously been used in analyses of Interphone data (30). It is the
midpoint of the voxel at the shortest distance from the other voxels in the tumor. In the
906 cases with a single voxel marked by the neuroradiologists as the putative origin, the
latter had a mean distance of 4.1 mm from the center of gravity (median 0 mm, 75th centile
10.0 mm, maximum 51 mm). We also calculated the geometric midpoint of the tumor as
an alternative to the center of gravity. The results were similar, see the Web Appendix.
Statistical analyses
The main point process analysis included all 792 subjects with a self-reported preferred
side of use. Each tumor was identified with a single reference location x = (x1, x2, x3) cho-
sen as the gravity center of the whole tumor. The ears were identified with locations xL and
xR. We assume the spatial distribution of tumors in the two brain halves to be symmetrical
and that the susceptibility of the brain tissue is uniform across each hemisphere.
The point process model is described in further detail in Grell et al. (31). Briefly, we as-
sumed that the left-sided users’s and right-sided users’s centers of gravity form independent
Poisson processes with the intensities
λL(x) = λ0(x)g(x− xL, z;α) and λR(x) = ρλ0(x)g(x− xR, z;α) (1)
7

where ρ is a nuisance parameter related to the relative number of left-sided and right-sided
users and the baseline intensity λ0(x) reflects the intensity for non-users. The function
g describes the distance relation between tumor and preferred ear. We modeled g as a
piecewise constant decreasing function of the distance in millimeters dL = ||x− xL||
g(dL;α) =
α1 if 0 < dL ≤ 55
α2 if 55 < dL ≤ 75
α3 if 75 < dL ≤ 95
α4 if 95 < dL ≤ 115
1 if dL > 115
(2)
with the added constraint α1 ≥ α2 ≥ α3 ≥ α4 ≥ 1 to ensure a decreasing distance
relation. This was supported by the data subset analyzed in Grell et al. (31). The α-
values represent the change in risk of observing a tumor within the given interval compared
to the baseline intensity. We assume that a possible effect of mobile phone use will not
affect the contralateral hemisphere; consequently, we have fixed g = 1 for distances larger
than 115 mm. The null hypothesis (g = 1 or α = 1) is that occurrence of tumors across
each hemisphere for both the left- and right-sided phone users is similar to the occurrence
of tumors for persons not using mobile phones. If α is significantly higher than 1, the
tumor intensity is significantly higher for the users than the non-users. Note that the
approach does not require the baseline intensity λ0(x) to be estimated (31); hence, the
non-users are not included in the analyses even though they appear in the phrasing of the
null hypothesis. The significance testing was done by simulating 1000 test statistics under
the null hypothesis and calculating the empirical p-value (31). The reported confidence
intervals are the Monte Carlo confidence intervals calculated by bootstrapping. The change
points in equation 2 were chosen using the actual distances to preferred ear in the data
(39.0–147.7 mm) such that the first four intervals were of approximately equal length
starting from the shortest distance. Figure 1 is a naive two-dimensional representation of
the GridMaster head and the intervals. The data are from a three-dimensional model so
8
α1 covers part of a ball with a radius of 55 mm, α2 a 20 mm layer outside that ball, etc.
We dichotomized each of the seven variables: sex, tumor grade, age, tumor size, time
since start of mobile phone use, lifetime cumulative phone use, and lifetime cumulative
number of calls using the median for the last four variables. Years of phone use and length
and number of calls are related to the exposure, whereas tumor grade and size are related
to the outcome, but they all entered the model similarly. We stratified our model for each
of these variables z and estimated the eight parameters αj = (αj1, α
j2, α
j3, α
j4), j ∈ {0, 1}
corresponding to the model with
g(dL, z;α0,α1) =
αj1
if 0 < dL ≤ 55 and z = j
αj2
if 55 < dL ≤ 75 and z = j
αj3
if 75 < dL ≤ 95 and z = j
αj4
if 95 < dL ≤ 115 and z = j
1 if dL > 115 and z = j.
(3)
We cannot estimate the absolute difference between α0 and α1. Consequently, we cannot
assess whether the tumor intensity is higher for one level of the covariate than the other.
However, the model enables us to investigate whether the covariate alters the distance
relation such that the shape of the function g differs between the two covariate levels.
The preferred side of the head for phone use did not imply exclusive use at the preferred
side; consequently, we redefined our model writing the intensities for left- and right-sided
users as mixtures of the distance relation to the left ear and to the right ear:
λL(x) = λ0(x) (wprefg(x− xL, z;α) + wnonprefg(x− xR, z;α)) ,
λR(x) = ρλ0(x) (wprefg(x− xR, z;α) + wnonprefg(x− xL, z;α)) .
We chose the mixing proportions wpref = 0.75 and wnonpref = 0.25.
We conducted several sensitivity analyses. We changed the exposure variable to the
distance to the point with the highest SAR instead of the preferred ear. The former is 15
mm in horizontal distance from the latter and coincident with the location of the nearest
9

brain tissue. In this analysis, we redefined the change points in equation 2 by subtracting
15 mm from each of them. Moreover, we changed the exposure variable to the TCSE at
the tumor point x, E(x), in a model with
g(E(x);β) =
1 if 0 < E(x) ≤ 43
β4 if 43 < E(x) ≤ 186
β3 if 186 < E(x) ≤ 771
β2 if 771 < E(x) ≤ 3514
β1 if E(x) > 3514
(4)
where the change points are the quintiles of TCSE. The interpretation of β is the same as
for α: the change in risk of observing a tumor within the given interval compared to the
(not estimated) risk in non-users. We estimated the model with and without the decreasing
constraint β1 ≥ β2 ≥ β3 ≥ β4 ≥ 1. These analyses included the 324 cases with preferred
laterality of the 372 cases with TCSE.
We estimated the model with smaller steps than in equation 2 and we estimated the
standard model for the subsets used in previous case-only analyses: Denmark; Finland;
Germany; Italy; Norway; Sweden; and UK (N=428 with preferred laterality of 515 in
original paper) (28) and: Australia; Canada; France; Israel; and New Zealand (N=332 of
380) (30).
Because of the uncertainty in the assessment of tumor origin, we conducted the same
analyses as in Grell et al. (31) with the same data subset but using the center of gravity
to see whether the choice of either point was crucial for these results.
The analyses were carried out using R software (37).
RESULTS
Descriptive characteristics of the regular users with a self-reported side of use are pre-
sented in Table 1 and a flow chart is presented in Figure 2.
10

Figure 3 shows histograms of the distances from tumor center of gravity to closest ear
for all regular users and the non-users with no marked difference between the two.
Table 2 shows the estimates and 95% confidence intervals for the model with piecewise
constant decreasing distance relation (shown in Figure 4), with exposure variable ‘point
with highest SAR’, and with mixing proportions wpref = 0.75 and wnonpref = 0.25. The
hypothesis of no association with the mobile phone is rejected for all three models with
P < 0.01. The estimates for the first two models are similar. For the model with mixing
proportions, the estimates are higher but the confidence intervals are also wider.
Table 3 shows the results for the standard model with the dichotomized covariates
included one at a time. Moreover, the P -value from the test of no difference in the distance
relation for the two groups is included. The distance relation was unrelated to levels of
sex, age, tumor grade, tumor size, years of mobile phone use and amount of mobile phone
use, whether measured as cumulative call time or cumulative number of calls. The test
of no association with the distance to mobile phone yielded P < 0.01 for each strata (not
shown).
The results with TCSE instead of distance are shown in Table 4 and the relation concurs
with the relation for distance with P < 0.01 when testing g = 1. The association between
TCSE and tumor distribution is close to constant after the first interval with the highest
TCSE.
In Table 5 the results from the sensitivity analysis comparing the center of gravity with
the results from Grell et al. (31) are shown (reported with standard errors as (31)) and the
estimates are similar for both types of tumor points. The results from further sensitivity
analyses are found in the Web Appendix and are similar to those presented in Table 2.
This includes the piecewise constant model with smaller intervals and the results for the
subsamples from Larjavaara et al. (28) and Cardis et al. (30).
DISCUSSION
11

This is the first analysis that has modeled the spatial distribution of gliomas in relation
to mobile phone use by using the exact localization data from the full Interphone study.
Our results show that the three-dimensional distribution of gliomas within the brain is
skewed towards the ear self-reported to be preferred for mobile phone use. This applies
also when considering that the preferred side of the head was not used for all mobile
phone calls by assuming all study participants used the preferred side for 75% and the
non-preferred side for 25% of the calls. However, we did not find a difference in distance
relation for different levels of lifelong cumulative phone use and for the persons who had
used their mobile phone less than 200 hours there was still a relation with distance. Neither
did we observe any difference in distance relation for age, sex, tumor grade, tumor size,
time since start of mobile phone use, or cumulative number of phone calls. We found a
significant association between tumor intensity and TCSE, though with lower estimates
than for distance alone.
Our results concur with the observation of a statistically significant excess of gliomas
on the self-reported side of mobile phone use (28). However, Larjavaara et al. (28) did not
observe significantly higher odds for a short distance between glioma and mobile phone for
cases than for speculars (a hypothetical control location). Contrary to our method, they
considered exposure on the same side of the head as the glioma, irrespective of the reported
preferred side of mobile phone use. This avoids potential recall bias but may attenuate any
possible association. Our results contrast with the finding in another study of an increase
of gliomas for persons with the highest level of TCSE applied only for mobile phone use
more than 7 years (30). Restricting our analysis to the subsets used in the two studies did
not markedly change our results.
Studies on the SAR distribution in the human head have shown that the energy ab-
sorption drops considerably after 5 cm with almost all energy being absorbed within the
brain hemisphere closest to the phone (26). Our data had only a small proportion of tumor
points closer than 5 cm to the ear which could be related to our use of the three-dimensional
12
gravity point of the glioma. This point has limitations for large, irregular shaped tumors
close to the edge of the brain because these may grow towards the center of the brain
resulting in the gravity point being further from the edge and hence the exposure. For
most of the models, α4 is close to 1 indicating that the size of association with the phone
use is small further than 95 mm away from the phone, in agreement with almost all energy
being absorbed within the ipsilateral hemisphere.
The strengths of this paper include the large number of cases with localization data
and that the localization is used as a continuous measure. Moreover, because our anal-
ysis includes only cases, the findings are not affected by differential bias between cases
and controls (38–41). A limitation is uncertainty about the tumor origin and that the
self-reported side of use may be influenced by systematic and recall bias. Our method
necessitates inclusion of side of mobile phone use. Frequently, cases were aware where
their tumor was located when asked about preferred side of the head for mobile phone use,
which could have caused a systematic over-reporting of ipsilateral use. A recent study with
healthy volunteers reported considerable disagreement between self-reported preferred side
for mobile phone use with a 10–12 months recall, and that measured by a software modi-
fied phone (42). This indicates that our data on self-reported side of phone use might be
influenced by random recall bias. Moreover, the cases reporting a preferred side might not
have used the phone exclusively on that side but occasionally used it on the non-preferred
side. We dealt with the latter by introducing mixing proportions with 75% of use assigned
to the preferred side and 25% assigned to the not preferred side. This could not eliminate
systematic recall bias but it could ameliorate the parameter estimates by not assuming
preferred use to be exclusive use.
Figure 3 shows that the distance to closest ear is similarly distributed for regular users
and for non-users, indicating that mobile phone use does not overall result in tumours being
located closer to the ears. Together with the no relation with phone use, this suggests that
our finding could be a result of recall bias.
13

The main exposure measure in our model was distance between tumor and phone but
this is a simplification because the spatial distribution of SAR within the head also depends
on the frequency band and other characteristics (26, 43). Further, the exposure source
was modelled as a single point, though in reality it is mainly the antenna of the phone,
which is frequently embedded in the body of the phone. We modeled the distance relation
as a simple piecewise constant function and it would have been preferable to use also a
model with a continuous distance function, but the data did not support this (31). The
model relies on the assumptions that the tumor baseline intensity in the two brain halves
is symmetrical and is uniform across each hemisphere. This is a simplification because
gliomas occur more frequently in some lobes than others (44) and the susceptibility of the
brain tissue is very likely not completely uniform across each hemisphere because the cells
that gliomas arise from are not uniformly distributed in the brain (45).
Taken together, our results suggest that ever using a mobile phone regularly is asso-
ciated with glioma localization in the sense that more gliomas occurred closer to the ear
on the side of the head where the mobile phone was self-reported to be used the most;
however, this trend was not related to amount of mobile phone use making it less likely
that the association observed is caused by a relation between mobile phone use and cancer
risk. We cannot draw firm conclusions about cause and effect, but our approach shows
several strengths compared with traditional epidemiological approaches though the results
may be affected by recall bias in reported side of phone use. Nevertheless, it provides an
alternative in future mobile phone related research.
ACKNOWLEDGMENTS
This work was supported by funding from the Danish Cancer Society’s scientific com-
mittee (KBVU), grant R20-A897. The Interphone study was supported by funding from the
European Fifth Framework Program, ‘Quality of Life and Management of Living Resources’
(contract QLK4-CT-1999901563) and the International Union Against Cancer (UICC).
14
The UICC received funds for this purpose from the Mobile Manufacturers’ Forum and
GSM Association. Provision of funds to the Interphone study investigators via the UICC
was governed by agreements that guaranteed Interphone’s complete scientific independence.
The terms of these agreements are publicly available at http://www.iarc.fr/en/research-
groups/RAD/RCAd.html. The Australian centre was supported by the Australian Na-
tional Health and Medical Research Council (EME Grant 219129) with funds originally
derived from mobile phone service licence fees; Bruce Armstrong was supported by a Uni-
versity of Sydney Medical Foundation Program Grant and Julianne Brown by an Aus-
tralian Postgraduate Award. The Cancer Council NSW and The Cancer Council Victoria
provided most of the infrastructure for the project in Australia. The Canada-Montreal
study was primarily funded by a grant from the Canadian Institutes of Health Research
(project MOP-42525). Additionally, Dr Siemiatycki’s research team was partly funded
by the Canada Research Chair programme and by the Guzzo-CRS Chair in Environment
and Cancer. Dr Parent had a salary award from the Fonds de la Recherche en Sante du
Quebec. The other Canadian centres were supported by a university-industry partner-
ship grant from the Canadian Institutes of Health Research (CIHR), the latter including
partial support from the Canadian Wireless Telecommunications Association. The CIHR
university-industry partnerships program also includes provisions that ensure complete sci-
entific independence of the investigators. D. Krewski is the NSERC/SSHRC/McLaughlin
Chair in Population Health Risk Assessment at the University of Ottawa. The Danish
centre was supported by the Danish Cancer Society and the Finnish centre by the Emil
Aaltonen Foundation and the Academy of Finland. Additional funding for the study in
France was provided by l’Association pour la Recherche sur le Cancer (ARC)(Contrat No
5142) and three network operators (Orange, SFR, Bouygues Telecom). The funds provided
by the operators represented 5% of the total cost of the French study and were governed by
contracts guaranteeing the complete scientific independence of the investigators. In Ger-
many, additional funds were received from the German Mobile Phone Research Program
15

(Deutsches Mobilfunkforschungsprogramm) of the German Federal Ministry for the Envi-
ronment, Nuclear Safety, and Nature Protection; the Ministry for the Environment and
Traffic of the state of Baden-Wurttemberg; the Ministry for the Environment of the state
of North Rhine-Westphalia; the MAIFOR Program (Mainzer Forschungsforderungspro-
gramm) of the University of Mainz. The study conducted in Japan was fully funded by
the Ministry of Internal Affairs and Communications of Japan. In New Zealand, funding
was provided by the Health Research Council, Hawkes Bay Medical Research Foundation,
the Wellington Medical Research Foundation, the Waikato Medical Research Foundation
and the Cancer Society of New Zealand. The Swedish centre was also supported by the
Swedish Research Council and the Swedish Cancer Society. Additional funding for the UK
North and UK South studies was received from the Mobile Telecommunications, Health
and Research (MTHR) program, and the UK North study received funding from the Health
and Safety Executive, the Department of Health, the UK Network Operators (O2, Orange,
T-Mobile, Vodafone, ‘3’) and the Scottish Executive. The Institute of Cancer Research
acknowledges National Health Service (NHS) funding to the NIHR Biomedical Research
Centre.
The authors thank Mrs. Monika Moissonier (IARC) for extracting the data used for
this work from the Interphone database, and Mr. Jordi Figuerola (CREAL) for extracting
the TCSE data for five Interphone countries. The authors also thank the IARC team
coordinating the study during its fieldwork: Dr Isabelle Deltour, Dr Lesley Richardson, Dr
Martine Vrijheid, Mrs. Monika Moissonnier, Mrs. Emilie Combalot and Mrs. Helen Tardy.
Moreover, the authors thank Dr Johanna Vompras, who programmed the GridMaster
program under the supervision of the German Interphone team and the IARC coordinators,
and all neuroradiologists of the centers for mapping the gliomas in the GridMaster. Finally,
the authors thank all the neuroradiologists from the study centers who mapped the tumours
in the Gridmaster as well as Dr Graham Giles, Dr Julianne Brown, Dr Marie-Elise Parent,
Dr Louise Nadon, Dr Helle Collatz Christensen, Dr Paivi Kurttio, Dr Anna Lahkola,
16

Dr Tiina Salminen, Dr Marlene Bernard, Dr Lucile Montestrucq, Dr Juliet Britton, Dr
Gabriele Berg-Beckhoff, Dr Birgitte Schlehofer, Dr Angela Chetrit, Dr Avital Jarus-Hakak,
Dr Ivano Iavarone, Dr Toru Takebayashi, Dr Angus Cook, Dr Neil Pearce, Dr Karl G
Blaasaas, Dr Lars Klaeboe, Dr Stefan Lonn, Dr Anders Ahlbom, Dr Patricia A McKinney,
Dr Sarah J Hepworth, Dr Kenneth R Muir, Dr Minouk J Schoemaker, and Dr Juliet
Britton.
Conflicts of interest: none declared.
References
1. International Telecommunications Union. Key ICT indicators for developed and
developing countries and the world (totals and penetration rates). International
Telecommunications Union, Geneva, Switzerland; 2015. http://www.itu.int/en/ITU-
D/Statistics/Pages/stat/default.aspx. Accessed September 1, 2015.
2. Eurobarometer. Special Eurobarometer 347. Electromagnetic fields. European Com-
mission; 2010.
3. IARC. IARC monographs on the evaluation of carcinogenic risks to humans, vol 102.
Non-ionizing radiation, part II: radiofrequency electromagnetic fields. Lyon: Interna-
tional Agency for Research in Cancer; 2013.
4. Baan R, Grosse Y, Lauby-Secretan B, et al. Carcinogenicity of radiofrequency electro-
magnetic fields. Lancet Oncol. 2011;12(9):624–626.
5. Hardell L, Carlberg M, Mild KH. Pooled analysis of case-control studies on malignant
brain tumours and the use of mobile and cordless phones including living and deceased
subjects. Int J Oncol. 2011;38(5):1465.
6. The INTERPHONE Study Group. Brain tumour risk in relation to mobile telephone
17

use: results of the INTERPHONE international case-control study. Int J Epidemiol.
2010;39(3):675–694.
7. Christensen HC, Schuz J, Kosteljanetz M, et al. Cellular telephones and risk for brain
tumors a population-based, incident case-control study. Neurology. 2005;64(7):1189–
1195.
8. Schuz J, Bohler E, Berg G, et al. Cellular phones, cordless phones, and the risks
of glioma and meningioma (Interphone Study Group, Germany). Am J Epidemiol.
2006;163(6):512–520.
9. Klaeboe L, Blaasaas KG, Tynes T. Use of mobile phones in Norway and risk of
intracranial tumours. Eur J Cancer Prev. 2007;16(2):158–164.
10. Lahkola A, Auvinen A, Raitanen J, et al. Mobile phone use and risk of glioma in 5
North European countries. Int J Cancer. 2007;120(8):1769–1775.
11. Hepworth SJ, Schoemaker MJ, Muir KR, et al. Mobile phone use and risk of glioma
in adults: case-control study. Br Med J. 2006;332(7546):883–887.
12. Lonn S, Ahlbom A, Hall P, et al. Long-term mobile phone use and brain tumor risk.
Am J Epidemiol. 2005;161(6):526–535.
13. Hours M, Bernard M, Montestrucq L, et al. Cell phones and risk of brain and acoustic
nerve tumours: the French Interphone case-control study [in French]. Rev Epidemiol
Sante Publique. 2007;55(5):321–332.
14. Frei P, Poulsen AH, Johansen C, et al. Use of mobile phones and risk of brain tumours:
update of Danish cohort study. Br Med J. 2011;343:d6387.
15. Benson VS, Pirie K, Schuz J, et al. Mobile phone use and risk of brain neoplasms and
other cancers: prospective study. Int J Epidemiol. 2013;42(3):792–802.
18

16. Inskip PD, Tarone RE, Hatch EE, et al. Cellular-telephone use and brain tumors. N
Engl J Med. 2001;344(2):79–86.
17. Dreyer NA, Loughlin JE, Rothman KJ. Cause-specific mortality in cellular telephone
users. JAMA-J Am Med Assoc. 1999;282(19):1814–1816.
18. Auvinen A, Hietanen M, Luukkonen R, et al. Brain tumors and salivary gland cancers
among cellular telephone users. Epidemiology. 2002;13(3):356–359.
19. Muscat JE, Malkin MG, Thompson S, et al. Handheld cellular telephone use and risk
of brain cancer. JAMA-J Am Med Assoc. 2000;284(23):3001–3007.
20. Hardell L, Hallquist A, Carlberg M, et al. Case-control study of the association between
malignant brain tumours diagnosed between 2007 and 2009 and mobile and cordless
phone use. Int J Oncol. 2013;43(6):1833–1845.
21. Hardell L, Carlberg M. Mobile phones, cordless phones and the risk for brain tumours.
Int J Oncol. 2009;35(1):5–17.
22. Hardell L, Carlberg M, Mild KH. Pooled analysis of two case–control studies on use
of cellular and cordless telephones and the risk for malignant brain tumours diagnosed
in 1997–2003. Int Arch Occup Environ Health. 2006;79(8):630–639.
23. Kahn A, O’Brien D, Kelly P, et al. The anatomical distribution of cerebral glioma in
mobile phone users. Irish Med J. 2003;96(8):240–242.
24. Cardis E, Sadetzki S. Indications of possible brain-tumour risk in mobile-phone studies:
should we be concerned? Occup Environ Med. 2011;68(3):169–171.
25. Swerdlow AJ, Feychting M, Green AC, et al. Mobile phones, brain tumors, and the
Interphone study: where are we now? Environ Health Persp. 2011;119(11):1534–1538.
19

26. Cardis E, Deltour I, Mann S, et al. Distribution of RF energy emitted by mobile
phones in anatomical structures of the brain. Phys Med Biol. 2008;53(11):2771–2783.
27. Hartikka H, Heinavaara S, Mantyla R, et al. Mobile phone use and location of glioma:
A case-case analysis. Bioelectromagnetics. 2009;30(3):176–182.
28. Larjavaara S, Schuz J, Swerdlow A, et al. Location of gliomas in relation to mobile
telephone use: A case-case and case-specular analysis. Am J Epidemiol. 2011;174(1):2–
11.
29. Takebayashi T, Varsier N, Kikuchi Y, et al. Mobile phone use, exposure to radiofre-
quency electromagnetic field, and brain tumour: a case-control study. Br J Cancer.
2008;98(3):652–659.
30. Cardis E, Armstrong BK, Bowman JD, et al. Risk of brain tumours in relation to
estimated RF dose from mobile phones: results from five Interphone countries. Occup
Environ Med. 2011;68(9):631–640.
31. Grell K, Diggle PJ, Frederiksen K, et al. A three-dimensional point process model for
the spatial distribution of disease occurence in relation to an exposure source. Stat
Med. 2015;34(23):3170–3180.
32. Cardis E, Richardson L, Deltour I, et al. The INTERPHONE study: design, epi-
demiological methods, and description of the study population. Eur J Epidemiol.
2007;22(9):647–664.
33. GridMaster Computer Program. Dusseldorf: Vompras, 2007.
34. Bit-Babik G, Chou CK, Faraone A, et al. Estimation of the SAR in the human head
and body due to radiofrequency radiation exposure from handheld mobile phones with
hands-free accessories. Radiat Res. 2003;159(4):550–557.
20

35. Cardis E, Varsier N, Bowman J, et al. Estimation of RF energy absorbed in the brain
from mobile phones in the Interphone Study. Occup Environ Med. 2011;68(9):686–693.
36. Louis DN, Ohgaki H, Wiestler OD, et al. WHO classification of tumours of the central
nervous system. Lyon: International Agency for Research in Cancer; 2007.
37. R Core Team. R: A Language and Environment for Statistical Computing. Vienna,
Austria: R Foundation for Statistical Computing, 2014. http://www.R-project.org/.
38. Vrijheid M, Deltour I, Krewski D, et al. The effects of recall errors and of selection
bias in epidemiologic studies of mobile phone use and cancer risk. J Expo Sci Environ
Epidemiol. 2006;16(4):371–384.
39. Vrijheid M, Cardis E, Armstrong B, et al. Validation of short term recall of mobile
phone use for the Interphone study. Occup Environ Med. 2006;63(4):237–243.
40. Vrijheid M, Armstrong BK, Bedard D, et al. Recall bias in the assessment of exposure
to mobile phones. J Expo Sci Environ Epidemiol. 2009;19(4):369–381.
41. Vrijheid M, Richardson L, Armstrong BK, et al. Quantifying the impact of selection
bias caused by nonparticipation in a case–control study of mobile phone use. Ann
Epidemiol. 2009;19(1):33–41.
42. Kiyohara K, Wake K, Watanabe S, et al. Recall accuracy of mobile phone calls among
Japanese young people [published online ahead of print March 18, 2015]. J Expo Sci
Environ Epidemiol ;(doi: 10.1038/jes.2015.13).
43. Deltour I, Wiart J, Taki M, et al. Analysis of three-dimensional SAR distributions
emitted by mobile phones in an epidemiological perspective. Bioelectromagnetics.
2011;32(8):634–643.
44. Larjavaara S, Mantyla R, Salminen T, et al. Incidence of gliomas by anatomic location.
Neuro-Oncol. 2007;9(3):319–325.
21
45. Walker C, Baborie A, Crooks D, et al. Biology, genetics and imaging of glial cell
tumours. Brit J Radiol. 2011;784:S090–S106.
22
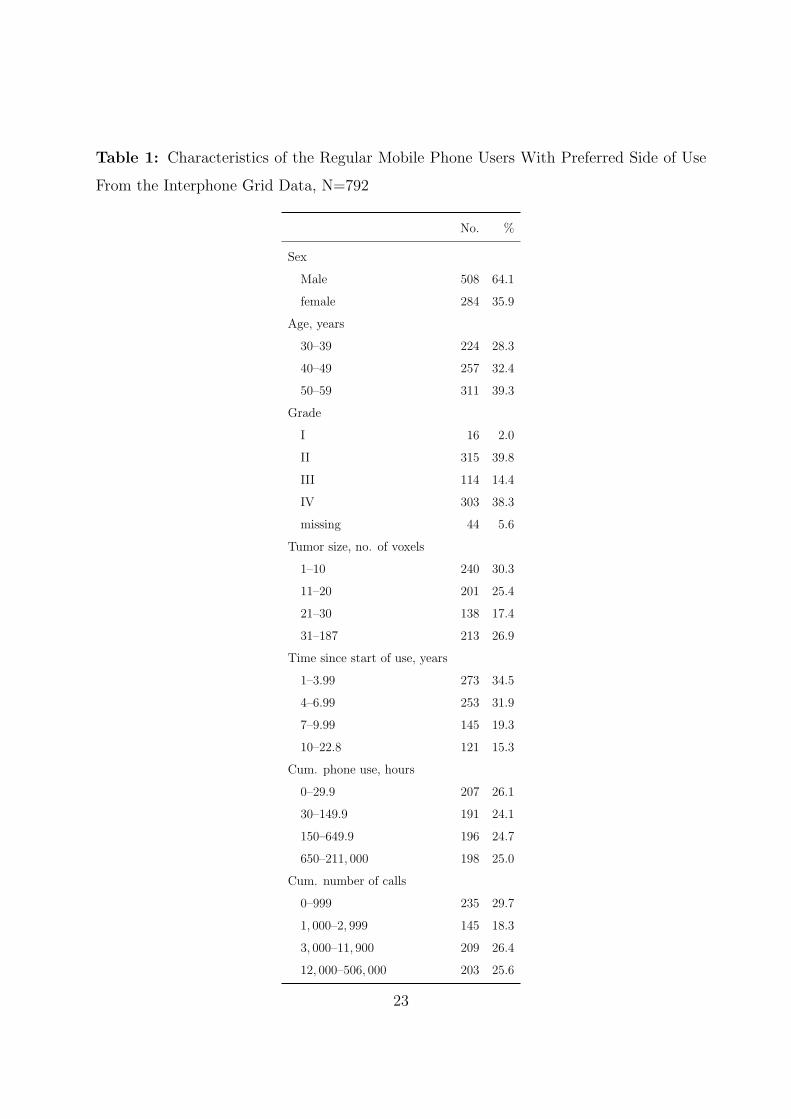
Table 1: Characteristics of the Regular Mobile Phone Users With Preferred Side of Use
From the Interphone Grid Data, N=792
No. %
Sex
Male 508 64.1
female 284 35.9
Age, years
30–39 224 28.3
40–49 257 32.4
50–59 311 39.3
Grade
I 16 2.0
II 315 39.8
III 114 14.4
IV 303 38.3
missing 44 5.6
Tumor size, no. of voxels
1–10 240 30.3
11–20 201 25.4
21–30 138 17.4
31–187 213 26.9
Time since start of use, years
1–3.99 273 34.5
4–6.99 253 31.9
7–9.99 145 19.3
10–22.8 121 15.3
Cum. phone use, hours
0–29.9 207 26.1
30–149.9 191 24.1
150–649.9 196 24.7
650–211, 000 198 25.0
Cum. number of calls
0–999 235 29.7
1, 000–2, 999 145 18.3
3, 000–11, 900 209 26.4
12, 000–506, 000 203 25.6
23

Table 2: Estimates and 95% Confidence Intervals for the Interphone Grid Data With Preferred Side of use, N=792. The
αs Represent the Elevation in Risk of Observing a Tumor Within a Given Interval Compared to the Assumed Baseline
Risk. The Intervals are Distances From the Ear Preferred for Mobile Phone Use. The Numbers are Number of Tumors
Within a Given Interval.
0–55 mm 55–75 mm 75–95 mm 95–115 mm >115 mm
Model No. α1 95% CI No. α2 95% CI No. α3 95% CI No. α4 95% CI No. - 95% CI
Standard 45 2.37 1.66, 4.56 159 1.75 1.38, 2.34 220 1.42 1.14, 1.81 166 1.10 1.00, 1.49 202 1.00 -
Highest SARa 25 2.62 1.70, 6.33 150 1.92 1.47, 2.60 210 1.38 1.11, 1.80 173 1.10 1.00, 1.45 234 1.00 -
Mixing prop. (0.75/0.25)b 45 9.66 2.84, 39.3 159 3.50 1.96, 8.78 220 2.09 1.36, 3.76 166 1.28 1.00, 2.52 202 1.00 -
Abbreviations: CI, confidence interval.
a The intervals are: 0–40 mm, 40–60 mm, 60–80 mm, 80–100 mm, >100 mm.24

Table 3: Estimates and 95% Confidence Intervals for the Stratified Models for the Interphone Grid Data With Preferred
Side of Use. The αs Represent the Elevation in Risk of Observing a Tumor Within a Given Interval Compared to the
Assumed Baseline Risk. The Model Cannot Estimate Absolute Differences in α-values Between Covariate-groups but
the Test can Detect if the Distance Relation Differs Between the two Groups. The Intervals are Distances From the Ear
Preferred for Mobile Phone Use. The Numbers are Number of Tumors Within the Covariate Group.
0–55 mm 55–75 mm 75–95 mm 95–115 mm >115 mm
Covariate No. α1 95% CI α2 95% CI α3 95% CI α4 95% CI - 95% CI P valuea
Female 284 1.85 1.41, 4.04 1.85 1.36, 2.96 1.71 1.17, 2.44 1.00 1.00, 1.41 1.00 - 0.26
Male 508 3.04 1.63, 7.54 1.68 1.26, 2.33 1.31 1.00, 1.78 1.21 1.00, 1.64 1.00 -
Age ≤ 46 years 379 1.86 1.45, 4.37 1.86 1.38, 2.76 1.54 1.10, 2.09 1.00 1.00, 1.34 1.00 - 0.39
Age > 46 years 413 3.06 1.63, 7.29 1.69 1.25, 2.51 1.40 1.03, 1.98 1.36 1.00, 1.91 1.00 -
Grade 1 and 2 331 2.59 1.45, 6.61 1.82 1.25, 2.75 1.15 1.00, 1.76 1.15 1.00, 1.68 1.00 - 0.54
Grade 3 and 4 417 2.16 1.46, 5.01 1.64 1.34, 2.39 1.64 1.23, 2.13 1.08 1.00, 1.62 1.00 -
Tumor size ≤ 18 cm3 401 1.96 1.51, 3.66 1.96 1.48, 2.97 1.70 1.21, 2.28 1.25 1.00, 1.85 1.00 - 0.19
Tumor size > 18 cm3 391 4.09 1.90, 12.0 1.51 1.17, 2.25 1.23 1.00, 1.64 1.00 1.00, 1.40 1.00 -
Years of use < 6 years 461 2.02 1.31, 4.28 1.39 1.13, 1.99 1.39 1.06, 1.81 1.00 1.00, 1.43 1.00 - 0.38
Years of use ≥ 6 years 331 3.27 1.92, 11.3 2.32 1.57, 3.57 1.41 1.00, 2.12 1.24 1.00, 1.85 1.00 -
Cum. phone use < 200 hours 435 1.57 1.29, 3.36 1.57 1.27, 2.22 1.48 1.10, 1.95 1.07 1.00, 1.55 1.00 - 0.37
Cum. phone use ≥ 200 hours 357 4.06 2.03, 11.6 1.94 1.32, 3.02 1.34 1.00, 1.97 1.13 1.00, 1.71 1.00 -
Cum. no. of calls < 4, 000 420 1.55 1.25, 3.42 1.44 1.19, 2.02 1.44 1.10, 1.84 1.00 1.00, 1.37 1.00 - 0.16
Cum. no. of calls ≥ 4, 000 372 3.56 2.05, 9.88 2.26 1.51, 3.38 1.39 1.03, 2.08 1.29 1.00, 1.92 1.00 -
Abbreviations: CI, confidence interval.
a Test of no difference in distance relation between levels of the covariate.
25

Table 4: Estimates and 95% Confidence Intervals for the Interphone Grid Data With Preferred Side of Use from Australia,
Canada, France, Israel and New Zealand using Total Cumulative Specific Energy Instead of Distance, N=324. The βs
Represent the Elevation in Risk of Observing a Tumor Within a Given Interval Compared to the Assumed Baseline Risk.
The Intervals are TCSE-values Calculated Using Distance to the Ear Preferred for Mobile Phone Use. The Numbers are
Number of Tumors Within a Given Interval.
>3514 J/kg 771–3514 J/kg 186–771 J/kg 43–186 J/kg 0–43 J/kg
Model No. β1 95% CI No. β2 95% CI No. β3 95% CI No. β4 95% CI No. - 95% CI
Piec. constant 82 2.38 1.33, 5.03 57 1.03 0.58, 1.91 58 1.02 0.57, 1.79 66 1.10 0.66, 1.81 61 1.00 -
Decreasinga 82 2.43 1.65, 1.57 57 1.06 1.00, 1.96 58 1.06 1.00, 1.70 66 1.06 1.00, 1.64 61 1.00 -
a Constraint added to the piecewise constant model to ensure decreasing βs.
Table 5: Comparison of Tumor Points for the Interphone Grid Data With Single Voxel Origin Recorded by Neuroradi-
ologists or Calculated Center of Gravity, N=478
0–55 mm 55–75 mm 75–95 mm 95–115 mm >115 mm
Model No. α1 SE No. α2 SE No. α3 SE No. α4 SE No. - SE
Origin pointa 25 1.82 0.32 100 1.82 0.28 127 1.48 0.22 105 1.09 0.18 121 1.00 -
Gravity center 24 1.75 0.58 105 1.68 0.24 126 1.52 0.22 95 1.00 0.13 128 1.00 -
Abbreviations: SE, standard error.
a Result from Grell et al. (31)
26

Figure legends
Figure 1
Naive representation of the head with the intervals from the point process model. The
radius of α1 is 55 mm, of α2 75 mm, of α3 95 mm, and of α4 115 mm; the short radius of
the ellipse is 85 mm.
Figure 2
Study Subjects
Figure 3
A) Density Histogram for Distance to Closest Ear for all Regular Users, N=933. B)
Distance to Closest Ear for all Non-users, N=597
Figure 4
Results from the model with piecewise constant decreasing distance relation for the In-
terphone Grid Data With Preferred Side of Use. Step function, α-values representing the
elevation in risk of observing a tumor within a given interval compared to the assumed
baseline risk; Vertical bars, 95% confidence intervals.
27

α1
α2
α3
α4
Sagittal Axis
Cor
onal
Axi
s
Figure 1
2,700 GliomaCases
1,530 WithLocalisation Data
933 RegularPhone Users
265 Left Users
527 Right Users
110 Both Users
Figure 2
28

Distance to closest ear in mm
Den
sity
A)
35 55 75 95 115
0.00
0.01
0.02
0.03
Distance to closest ear in mm
Den
sity
B)
35 55 75 95 115
0.00
0.01
0.02
0.03
Figure 3
Distance to preferred ear in mm
α
0 15 30 45 60 75 90 105 120 135 150
0.5
1.0
1.5
2.0
2.5
3.0
3.5
4.0
4.5
5.0
Figure 4
29
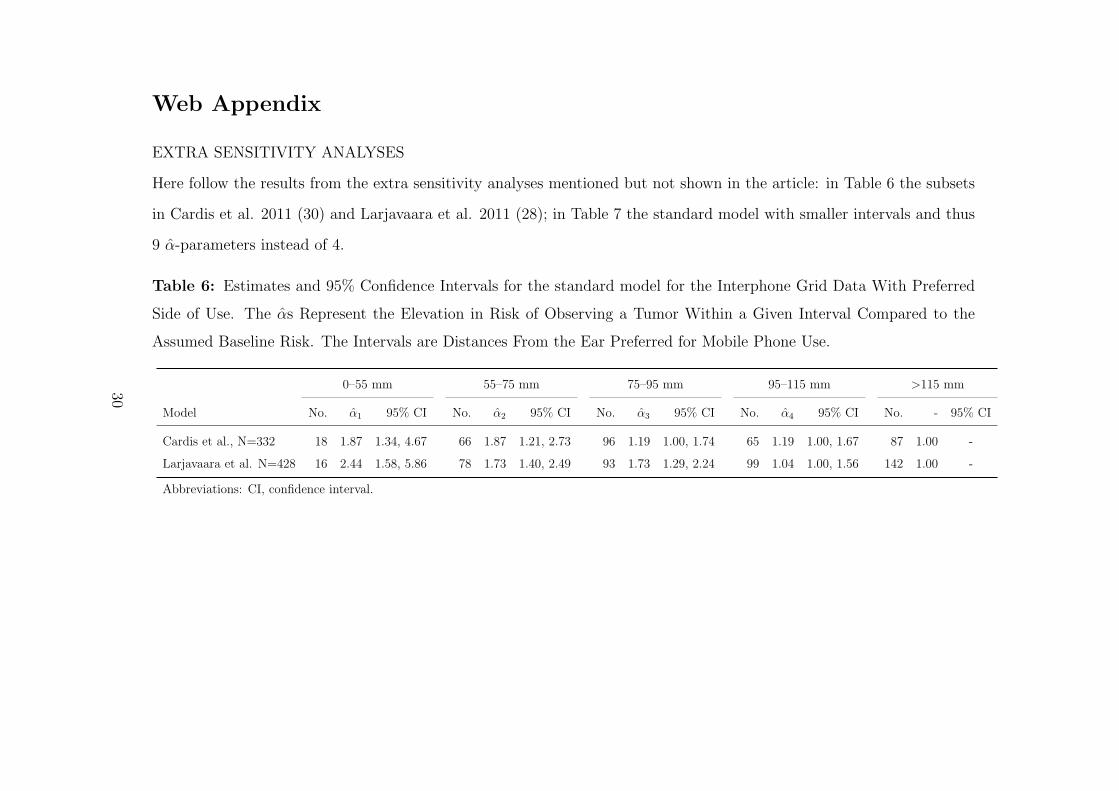
Web Appendix
EXTRA SENSITIVITY ANALYSES
Here follow the results from the extra sensitivity analyses mentioned but not shown in the article: in Table 6 the subsets
in Cardis et al. 2011 (30) and Larjavaara et al. 2011 (28); in Table 7 the standard model with smaller intervals and thus
9 α-parameters instead of 4.
Table 6: Estimates and 95% Confidence Intervals for the standard model for the Interphone Grid Data With Preferred
Side of Use. The αs Represent the Elevation in Risk of Observing a Tumor Within a Given Interval Compared to the
Assumed Baseline Risk. The Intervals are Distances From the Ear Preferred for Mobile Phone Use.
0–55 mm 55–75 mm 75–95 mm 95–115 mm >115 mm
Model No. α1 95% CI No. α2 95% CI No. α3 95% CI No. α4 95% CI No. - 95% CI
Cardis et al., N=332 18 1.87 1.34, 4.67 66 1.87 1.21, 2.73 96 1.19 1.00, 1.74 65 1.19 1.00, 1.67 87 1.00 -
Larjavaara et al. N=428 16 2.44 1.58, 5.86 78 1.73 1.40, 2.49 93 1.73 1.29, 2.24 99 1.04 1.00, 1.56 142 1.00 -
Abbreviations: CI, confidence interval.
30

Table 7: Estimates and 95% Confidence Intervals for the standard model with smaller intervals for the Interphone Grid
Data With Preferred Side of Use, N=792. The αs Represent the Elevation in Risk of Observing a Tumor Within a Given
Interval Compared to the Assumed Baseline Risk. The Intervals are Distances From the Ear Preferred for Mobile Phone
Use.
0–50 mm 50–60 mm 60–70 mm 70–80 mm 80–90 mm
Model No. α1 95% CI No. α2 95% CI No. α3 95% CI No. α4 95% CI No. α5 95% CI
Standard model 13 4.22 1.88, 29.2 69 1.86 1.50, 2.87 83 1.86 1.45, 2.65 81 1.47 1.23, 1.95 117 1.47 1.22, 1.95
90–100 mm 100–110 mm 110–120 mm 120–130 mm >130 mm
Model No. α6 95% CI No. α7 95% CI No. α8 95% CI No. α9 95% CI No. - 95% CI
111 1.47 1.20, 1.93 58 1.02 1.00, 1.64 102 1.00 1.00, 1.33 104 1.00 1.00, 1.31 54 1.00 -
Abbreviations: CI, confidence interval.
31

ALTERNATIVE TUMOR POINT: THE GEOMETRIC MIDPOINT
As an alternative to the tumor’s center of gravity, we calculated also the geometric mean of each tumor. We compared
the geometric midpoint and the single voxel marked by neuroradiologists as the origin and in these 906 subjects, the
geometric midpoint was a mean distance of 5.4mm from the origin, with median 4.9, 75th centile 7.3mm and maximum
44mm. The medians of the distance from the ear point to the single voxel marked as the origin and from the ear point
to the geometric midpoint differ less than 2mm. Using this geometric midpoint instead of the center of gravity does not
change any of the results markedly. In Table 8 are shown the results from the standard model. This is similar to the
corresponding result in Table 2 in the article. In Table 9 is shown a comparison of a result from Grell et al. (31) with the
result using the same data subset but the geometric midpoint instead of the recorded origin. The two sets of estimated
αs are similar.
Table 8: Estimates and 95% Confidence Intervals for the standard model for the Interphone Grid Data With Preferred
Side of Use, N=792. The αs Represent the Elevation in Risk of Observing a Tumor Within a Given Interval Compared
to the Assumed Baseline Risk. The Intervals are Distances From the Ear Preferred for Mobile Phone Use.
0–55 mm 55–75 mm 75–95 mm 95–115 mm >115 mm
Model No. α1 95% CI No. α2 95% CI No. α3 95% CI No. α4 95% CI No. - 95% CI
Geometric mean 47 2.09 1.60, 3.80 159 1.88 1.48, 2.45 224 1.40 1.15, 1.81 153 1.04 1.00, 1.43 209 1.00 -
Abbreviations: CI, confidence interval.
32

Table 9: Comparison of Tumor Points for the Interphone Grid Data With Single Voxel Origin Recorded by Neuroradi-
ologists or Calculated Geometric Midpoint, N=478
0–55 mm 55–75 mm 75–95 mm 95–115 mm >115 mm
Tumor points No. α1 SE No. α2 SE No. α3 SE No. α4 SE No. - SE
Origin pointa 25 1.82 0.32 100 1.82 0.28 127 1.48 0.22 105 1.09 0.18 121 1.00 -
Geometric mean 24 1.70 0.56 105 1.70 0.30 126 1.70 0.30 95 1.00 0.23 128 1.00 -
Abbreviations: SE, standard error.
a Result from Grell et al. (31)
33