this chapter examines the economic impact of trade flows and … · web viewbut post-war west...
TRANSCRIPT
TDR 2007, chapter IV
TDR 2007 - Chapter IV
REGIONAL COOPERATION AND TRADE INTEGRATION AMONG DEVELOPING COUNTRIES
The main forces that have shaped the process of globalization over the past two decades have also dominated recent trends in regional integration. The tendency to give priority to market forces in determining factor allocation is reflected in the rapidly increasing number of regional and bilateral free trade agreements (FTAs) or preferential trade agreements (PTAs) discussed in chapter III. There have been few initiatives to strengthen proactive national policies that focus on creating conditions favourable to capital formation, industrialization and structural change compared to initiatives for pushing trade and investment liberalization further than what has been achieved at the multilateral level.
Notwithstanding this evolution towards preferential North-South agreements, intraregional trade in a number of regional blocs of developing countries has been growing faster than their trade with countries in other regions. Moreover, the composition of intraregional trade suggests an important potential for export diversification, and thus for accelerating industrial development.
Intraregional trade in a number of regional blocs of developing countries has been growing faster than their extraregional trade.
This chapter first provides an overview of the basic concepts and forms of regional economic integration, followed by an assessment of regional integration processes and recent regional cooperation initiatives from a development perspective, including the different institutional forms of such cooperation. Sections B and C then turn to regional trade experiences in developing countries and economies in transition. They take a closer look at the extent to which intraregional trade, through its specific characteristics, could foster industrial development, which for most developing countries is the main vehicle for catching up with the more advanced economies. It is shown that the total value and the product composition of intraregional trade, depends on several factors. A formal trade integration agreement is one of these factors, but other factors, including macroeconomic and structural conditions and additional areas of regional cooperation, can be as or even more important. Section D concludes, highlighting South-South regional trade cooperation as a complementary vehicle for moving towards greater integration into the world economy.
A. Forms of regional cooperation and effective trade integration
Regional economic cooperation is primarily associated with trade agreements. These may involve the granting of tariff preferences, free trade commitments, or the creation of customs unions. More advanced forms of regional cooperation are the creation of common markets or economic unions, where formal cooperation extends into other areas, such as the movement of capital and persons and macroeconomic and sectoral policies. Within a tariff preference arrangement, contracting parties grant lower tariff rates to products originating in the partner country (or countries) than for products originating in the rest of the world. A free trade agreement goes further, since it eliminates “the duties and other restrictive regulations of commerce (...) on substantially all the trade between the constituent territories in products originating in such territories” (GATT, Article XXIV (8) (b)). Contracting countries constitute a customs union if, in addition, they apply “substantially the same duties and other regulations of commerce” to the trade with countries that
1

TDR 2007, chapter IV
are not part of the union (GATT, Article XXIV (8) (a)). Advancing along the road towards formal economic integration is the common market, which adds to the previously mentioned provisions the free movement of labour and capital among the participants. Finally, an economic union is achieved when members also harmonize their economic policies (table 4.1).
Table 4.1
MAIN CHARACTERISTICS OF DIFFERENT TYPES OF TRADE INTEGRATION ARRANGEMENTSReduction Elimination Commonof tariffs in of tariffs in tariffs for Harmonization
intraregional intraregional the rest of Free factor of economictrade trade the world mobility policies
Preferential trade agreement YesFree trade agreement YesCustoms union Yes Yes Coordination desirableCommon market Yes Yes Yes Coordination desirableEconomic union Yes Yes Yes Yes
Source: UNCTAD secretariat.
Each of these integration steps entails deeper commitments by participants, and requires higher levels of policy coordination. Moreover, in the course of an integration process, countries may have to transfer part of their national sovereignty in policy-making to institutions at the regional level. In a customs union, countries give up the right to set their individual import tariffs, and any modification is negotiated within the framework of regional institutions. Furthermore, members of a customs union or a common market need to coordinate other aspects of their economic policy, such as their monetary policy, exchange rates, various elements of fiscal policy and sectoral programmes, in order to avoid asymmetries and tensions among them that could jeopardize the regional agreement. For instance, volatile exchange rates between the currencies of a region with intense intraregional trade and strong financial relations may lead a country with an appreciating currency to resort to defensive trade measures vis-à-vis its intraregional partners. Similarly, if one of the members of a customs union tries to attract FDI by offering tax advantages or a loose environmental regulatory regime, it may trigger a “race to the bottom” in taxation and environmental standards, which would harm all the members of the union. Also, certain instruments of industrial policy may be applied at the regional level in order to maximize the potential gains from a wider market; at the very least, national incentives to industries may be harmonized in order to avoid unfair competition within the region and defensive reactions that would hinder intraregional trade (see chap. VI, sect. C). Finally, member countries may address economic asymmetries and inequalities within the region through coordinated policies and common tools, such as structural funds aimed at reducing economic and social disparities.
As a result, regional cooperation agreements that go beyond the reduction of legal trade barriers tend to progressively incorporate elements that, although trade-related, have a much broader impact on economic stability and development, such as monetary, fiscal and sectoral policies. In the case of common markets, this may include rules relating to migration and capital movements. In parallel, regions may have to develop some supranational institutions for managing the different aspects of integration, which may be quite diverse depending on the stage of development, the political circumstances and existing national institutions. In an economic and monetary union, member States formally give up national sovereignty over monetary and exchange-rate management, as a regional central bank assumes control over a common monetary policy and a common currency.
Early regional cooperation agreements, which were concluded mainly by countries at similar levels of development, shared common and closely interlinked political and economic objectives. These agreements typically had ambitious aims with regard to the degree of integration, often going well beyond those of preferential agreements or FTAs. This was the case, for instance, with the Southern African Customs Union (1910), the European Economic Community (1958), the Central American Common Market (1961), the Andean Pact (1969) and the Economic Community of West African States (1975).1 In some cases, complete economic union was the explicit ultimate goal.1 For member countries of the different regional blocs discussed in this TDR, see list at the beginning of the Report (page xvi).
2

TDR 2007, chapter IV
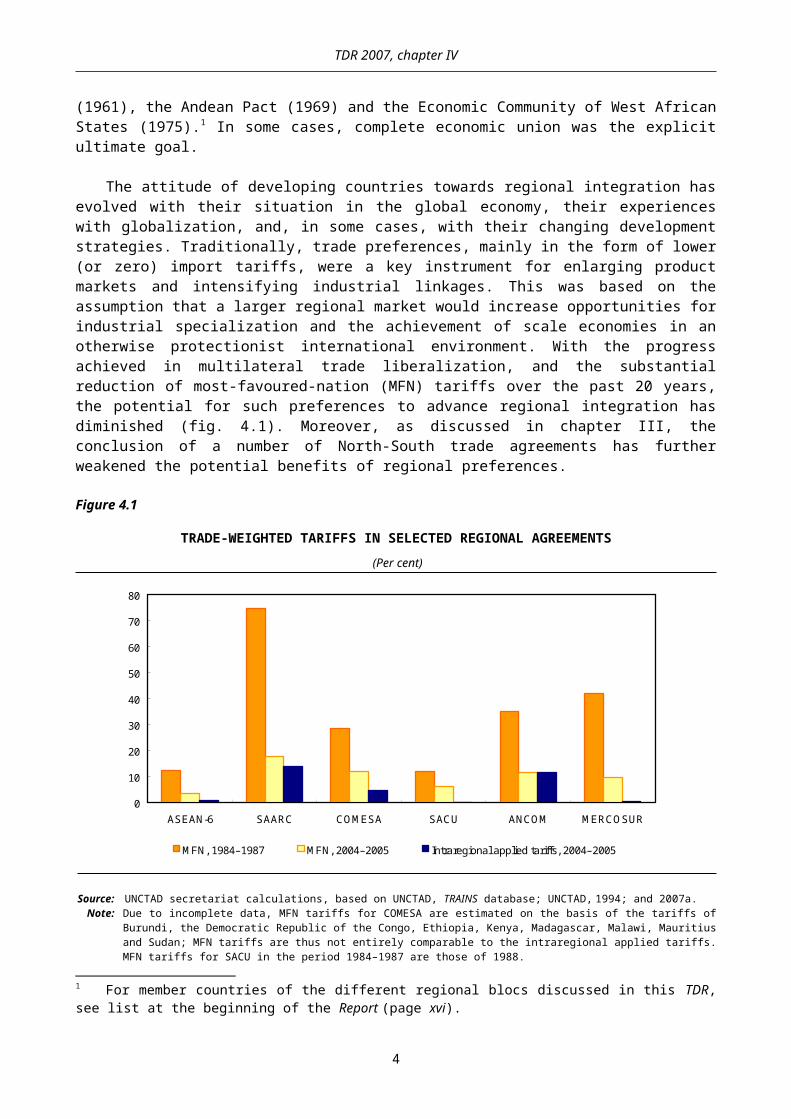
The attitude of developing countries towards regional integration has evolved with their situation in the global economy, their experiences with globalization, and, in some cases, with their changing development strategies. Traditionally, trade preferences, mainly in the form of lower (or zero) import tariffs, were a key instrument for enlarging product markets and intensifying industrial linkages. This was based on the assumption that a larger regional market would increase opportunities for industrial specialization and the achievement of scale economies in an otherwise protectionist international environment. With the progress achieved in multilateral trade liberalization, and the substantial reduction of most-favoured-nation (MFN) tariffs over the past 20 years, the potential for such preferences to advance regional integration has diminished (fig. 4.1). Moreover, as discussed in chapter III, the conclusion of a number of North-South trade agreements has further weakened the potential benefits of regional preferences.
Figure 4.1
TRADE-WEIGHTED TARIFFS IN SELECTED REGIONAL AGREEMENTS (Per cent)
0
10
20
30
40
50
60
70
80
ASEAN-6 SAARC COMESA SACU ANCOM MERCOSUR
MFN, 1984–1987 MFN, 2004–2005 Intraregional applied tariffs, 2004–2005
Source: UNCTAD secretariat calculations, based on UNCTAD, TRAINS database; UNCTAD, 1994; and 2007a.Note: Due to incomplete data, MFN tariffs for COMESA are estimated on the basis of the tariffs of Burundi, the Democratic Republic
of the Congo, Ethiopia, Kenya, Madagascar, Malawi, Mauritius and Sudan; MFN tariffs are thus not entirely comparable to the intraregional applied tariffs. MFN tariffs for SACU in the period 1984–1987 are those of 1988.
This does not mean, however, that preferential access among regional parties has lost all its relevance; it may still be an important tool for accelerating intraregional trade and industrial integration within a region, even if it may not be sufficient by itself to advance the processes of industrialization and diversification. In most cases, this will also require a supportive environment of fast output growth and appropriate industrial and macroeconomic policy measures. Regional tariffs could still be an important means of supporting sectoral policies, even if the average import tariffs remains relatively low (TDR 2006: 174–179). Indeed, relatively high tariffs on specified products have served to promote specific activities, such as the automobile industry, in some regional arrangements.2 But post-war West European integration and the East and South-East Asian experience with regional integration both show that a macroeconomic environment that is favourable for capital accumulation and strong industry-driven growth can be as important for unleashing a regional integration dynamic.
2 In the Southern Common Market (MERCOSUR), the automobile industry is protected with the highest tariff rate (35 per cent) of the common tariff structure.
3
TDR 2007, chapter IV
Preferential access among regional members may still be an important tool for accelerating intraregional trade and industrial integration.
Indeed, trade liberalization was not the driving force behind either post-war European integration or the more recent East and South-East Asian experiences. In both cases, sustained periods of very high growth, driven by a multiplicity of interdependent factors, but including high rates of capital formation, provided the context in which various economic thresholds linked to industrial development were crossed and integration could proceed in a reasonably smooth and measured manner (Sodersten, 1970: 442; ADB, 2006). In both cases too, strong States were key to integration among neighbouring countries, and the basis on which convergence and regional integration were able to progress in a measured and relatively stable manner. From the mid-1950s, an accelerating pace of European integration reflected the very rapid post-war recovery, the high level of economic and industrial development already reached and the relatively small economic and social gaps between neighbouring countries. When intra-European FDI finally took off in the 1960s, having lagged behind the rise of European inter-industry and intra-industry trade, it was concentrated in high-technology and information-intensive sectors that were characterized by increasing returns and growing high-wage sectors, tacit knowledge and spillovers (Dunning, 1984: 96–99). By the mid-1970s, the shedding of manufacturing jobs associated with “positive deindustrialization” in the more advanced economies (Rowthorn and Wells, 1986), provided room for the new and less advanced members to build their own investment-export nexus around closer regional ties, perhaps best demonstrated by the very rapid growth and convergence of Ireland. This pattern is more difficult to detect in most of the subsequent regional arrangements, including in the recently enlarged EU itself, where the income gap between the new and old members is considerably wider than in the original grouping, in some instances resembling more of a North-South divide. A similar situation is found in North America, when long-standing intra-industry trade and FDI flows between Canada and the United States were extended south under NAFTA. However, the economic gap in this case is greater still, and in the absence of institutional mechanisms that might support the convergence process, the integration pattern has been hesitant and fragmented, although very advanced in some key industries, such as automobiles (Mortimore, 1998).
The pattern of development and integration in East and South-East Asia has resembled some of the features of European integration, but with distinct characteristics due to the influences and legacies of colonial rule, the economic gap between Japan and its neighbours, and the specific demands of late industrialization. Here, the integration process may have followed a more sequenced path, linking stages of industrialization with regional development. In this process, the leading economies upgraded their economic activity to more and more sophisticated manufactures thus opening up opportunities for their less developed neighbours to enter into a regional division of labour by increasing their resource-based and labour-intensive industries that could no longer be competitively supplied by the front runners. This “flying geese” pattern, enabled trade and FDI to serve as vehicles for “recycling” comparative advantage; and, beginning with post-war Japan, there was a deliberate use of pro-investment macroeconomic policies along with strategic industrial and technology policies (Sakakibara and Yamakawa, 2003). More recently, since the early 1990s, China has increasingly contributed to shaping the pattern of regional integration in East and South-East Asia.
Until the end of the 1990s, China was not a member of any regional free trade or economic cooperation arrangement except the Asia-Pacific Economic Cooperation (APEC) forum, nor did it have any bilateral free trade or investment agreement. Thus the Chinese proposal for a free trade area with the Association of Southeast Asian Nations (ASEAN) in November 2000 marked a policy shift by its Government to embark on regionalism as a complement to its global external economic relations. Despite the absence of formal regional agreements, economic integration between China and other Asian economies, particularly in East and South-East Asia, had been close due to an investment and trade nexus driven mainly by multinational companies. The emergence of China as an FDI destination because of its low production costs – which are even lower than those prevailing in ASEAN countries – first attracted Chinese investors from Hong Kong (China), Taiwan Province of China and other Asian countries. When companies from Taiwan Province of China, in particular, accelerated production relocation to the mainland, companies from Japan and the Republic of Korea began a strong push to sell to China. This was followed by a rapid increase in FDI from
4
TDR 2007, chapter IV
these two countries with China’s potential as an important market becoming apparent. By the end of 2006, Japan had become the second largest source country of FDI in China, while the Republic of Korea was the fourth largest, and China accounted for 40 per cent of the latter’s total FDI.3 ASEAN countries also increasingly invested in China. Over the years, China has increasingly taken on processing and assembly operations, thus becoming an export platform for many transnational corporations (TNCs).
Trade policy has played an important role in the steep rise of China’s imports and exports. Tax and tariff exemptions for imports destined for processing have been a large incentive for foreign investors to develop processing facilities in China. As a result, much of the FDI to China has been trade-related, targeting production for export or re-export. The cumulative effect of FDI on China’s exports has been significant: by 2005, 60 per cent of its exports originated from foreign-funded companies in China, and processed goods comprised 60 per cent of its total trade. At the same time China’s imports from ASEAN have also shifted from primary products to manufactured products (e.g. electrical and electronic machinery and mechanical appliances), which amount to about 50 per cent of its total imports from ASEAN.4 This might be due to increasing intra-industry trade in manufactured products between members of ASEAN and China. Accordingly, China’s trade balance with ASEAN turned from a surplus to a deficit in 1992, and this has been growing ever since, while it has had a rising surplus in its trade balance with the rest of the world.
To sum up, trade and investment flows within East and South-East Asia have been shaped largely by two countries: Japan and China. And even though they are not members of ASEAN, they have played a crucial role in extending and deepening regional integration within that bloc. Beginning in the early 1980s Japanese corporations, saw their market shares threatened by persistent appreciations of the yen and a growing number of trade disputes, which they sought to circumvent partly by relocating their production to their regional neighbours. The strong interdependence between Japanese FDI and intraregional trade flows turned ASEAN into an integrated production and trading region until the middle of the 1990s. The largest proportion of manufactured goods, particularly IT products, were traded within and between Japanese TNCs, and international competitiveness and an increase in overseas market shares became the major motives for Japanese investments at home and within ASEAN. In the first half of the 1990s, China emerged as an important regional power. Its growing imports from ASEAN countries gave a boost to those economies and further strengthened intraregional trade flows and the competitiveness of its final export products in the international production chain. Thus the Asian experience shows that in certain circumstances regional trade integration does not necessarily require full-scale formal cooperation; it can also be accelerated by corporate decisions in an appropriate macroeconomic and trading environment.
Closer regional integration in Latin America has been hindered by recurrent financial and economic crises, and in Africa by slow growth and persistent dependence on the production and export of primary commodities.
Efforts aimed at closer regional integration among developing countries in other regions have met with less favourable conditions and have been hindered by recurrent financial and economic crises, as in Latin America; or by slow growth and persistent dependence on the production and exports of primary commodities, as in Africa. Even if cross-border industrial linkages are far less pronounced than in other parts of the world, intraregional trade has increased in many regions, and in many cases has considerable potential to support the development process. The following section takes a closer look at the different integration experiences in some developing regions and economies in transition.
3 Ministry of Commerce of China website, at: www. mofcom.gov.cn (accessed on 2 April 2007). 4 China-ASEAN Trade Cooperation Has Entered a New Development Phase in 2005, Press Office of MOFCOM, 2005; available at: www.mofcom.gov. cn/ai/8/dyncolumn.html.
5

TDR 2007, chapter IV
B. The relative importance of trade flows in regional integration among developing countries
1. Measures of regional trade integration
Despite the erosion of regional tariff preferences, in general, intraregional trade among developing countries has continued to expand over the past 20 years, not only in absolute terms but also compared to extraregional trade. This is true both for geographical regions and for regional cooperation arrangements. In Africa, Latin America and, particularly, in East and South-East Asia, the share of intraregional trade in total trade has increased since the mid-1980s, despite faster trade liberalization at the global level. In East and South-East Asia, intraregional trade accounts for more than 40 per cent of total trade (fig. 4.2A), while in Latin America it has fluctuated between 15 and 20 per cent of the region’s total trade since the 1970s. However, this is heavily influenced by Mexico, whose trade – mainly with Canada and the United States – represents more than 40 per cent of the regional total, twice as much as in the 1980s. If Mexico is excluded, the share of Latin American intraregional trade has grown significantly since the late 1980s, to account for about one quarter of its total trade. In Africa, the share of intraregional trade has also increased since the mid-1980s, albeit more slowly and at a lower level, from less than 5 per cent to close to 10 per cent of total trade.
Another indicator showing how much the regional factor may influence the direction of trade is the trade intensity index, which compares the share of intraregional trade with the relative importance of that region in global trade. The value of this index is 1 when the share of intraregional trade of a region’s total trade is equivalent to the share of the region’s total trade in world trade. In this case there is no geographical bias in the trade relations of the countries belonging to that region. The more this index exceeds unity, the stronger is the regional bias in external trade (fig. 4.2B).
On this measure, there is a regional bias in all geographical regions. It is the strongest in Latin America, excluding Mexico, where it has also increased the fastest since the 1980s; although it has fallen since 2003 under the impact of rising prices of primary commodities exported by Latin American countries to destinations outside the region. In East and South-East Asia, this index followed a declining trend from the early 1970s to the mid-1990s, and since then it has remained stable at a relatively low level. This is because the sharp increase in intraregional trade has been accompanied by an equally strong growth in the share of that region’s trade in global trade. In Africa, intraregional trade intensity has grown significantly since the mid-1980s, although from very low levels, reflecting both the expansion of intraregional trade and the relative stagnation in total African trade. As in Latin America, the recent fall of the trade intensity index in Africa is mainly the result of commodity price developments.
6
TDR 2007, chapter IV
Figure 4.2
INTRAREGIONAL TRADE INDICATORS FOR SELECTED DEVELOPING REGIONS, 1970–2006
0
5
10
15
20
25
30
35
40
45
50
1970 1976 1982 1988 1994 2000 2006
Africa
East and South-East Asia
A. Share of intraregional trade in total tradea
(Per cent)
Latin America and the Caribbean (excl. Mexico)
Other Asia
0
1
2
3
4
5
6
7
8
9
1970 1976 1982 1988 1994 2000 2006
Africa
B. Intraregional trade intensity indexb
Latin America and the Caribbean (excl. Mexico)
Other Asia
East and South-East Asia
Source: UNCTAD secretariat calculations, based on IMF, Direction of Trade Statistics database; and UNCTAD Handbook of Statistics database.XAA + MAA
a , where XAA and MAA are intraregional exports and imports of region A, XA + MA and XA and MA are total exports and imports of region A.
XAA + MAA XA + MA b ÷ , where XW and MW are world exports and imports.
XA + MA XW + M W - (XA + MA)
The growing relative importance of intraregional trade in all developing regions over the past 20 years, despite the broad trend towards globalization and the reduction of trade barriers at the global level, confirms the important role of de facto trade-related advantages stemming from geographical proximity, lower transaction costs, and tacit knowledge owing to repeated interaction or cultural and historical affinity (Rosenthal and Strange, 2004).
7

TDR 2007, chapter IV
The volume of intraregional trade varies considerably among different formal regional blocs, corresponding roughly to the stage of development of their member States in terms of per capita income and degree of industrialization. For instance, intraregional trade is very significant within the EU and NAFTA, where it represented 60 per cent and 45 per cent, respectively, of total trade during the period 2000–2006. In the Commonwealth of Independent States (CIS), intraregional trade declined for much of the 1990s as the member States underwent a serious adjustment crisis, but it is still significant, accounting for 25 per cent of the region’s total trade in 2000–2006.
Figure 4.3 shows the evolution of intraregional trade in selected regional agreements,5 using two indicators: the total share of intraregional trade, which is obtained by comparing the aggregate intraregional trade to the aggregate total trade of the group of countries; and the average share of intraregional trade, which is the simple average of each country’s share of intraregional trade. The combination of the two measures is indicative of the degree of heterogeneity of each bloc. In regional agreements involving partners of very different economic size, the first indicator is strongly influenced by the geographical trade patterns of the larger member States; however, the relative importance of the members of a regional agreement as markets and as suppliers of goods may vary considerably among participants, and tends to be greater for smaller economies. In such cases, the second indicator (simple average) will show a higher level of intraregional trade than the first (aggregate share). This is clearly the case in MERCOSUR, the South Asian Association for Regional Cooperation (SAARC) and the Southern African Development Community (SADC). The difference is also significant in NAFTA and the CIS, where the share of intraregional trade is considerably higher for the smaller member countries. For instance, in 2006, United States trade with NAFTA partners accounted for 30 per cent of its total trade, while that proportion exceeded 70 per cent for Canada and Mexico. Similarly, trade with other CIS members represented only 11 per cent of the entire trade of the Russian Federation, but nearly 40 per cent, on average, of the total trade of the other CIS countries.
2. Latin America and the Caribbean
Among the four initial members of MERCOSUR, Argentina, Brazil, Paraguay and Uruguay,6
intraregional trade grew rapidly between 1990 and 1998, not only as a result of the process of integration itself, but also because during this period demand for imports rapidly increased as Latin America emerged from the debt crisis of the 1980s. MERCOSUR countries, especially Argentina and Brazil, have a diversified export structure, owing to their relatively advanced industrial development. As a consequence, they have been able to respond to the expanding domestic demand of regional partners in a large variety of goods. However, as economic crises struck the region again between 1999 and 2002, imports of MERCOSUR countries fell and intraregional exports plummeted, while the level of their exports to the rest of the world remained roughly the same. These developments are reflected in the pattern of intraregional exports: their share in the region’s total exports initially jumped from 8.9 per cent in 1990 to 25.0 per cent in 1998, and then contracted to 11.5 per cent in 2002. With the subsequent economic recovery, intraregional exports expanded more rapidly than overall exports. The share of intraregional imports has been more stable, at around 20 per cent, since intra- and extraregional imports have expanded and contracted in parallel. The overall share of intraregional trade in the region’s total trade, of about 15 per cent in 2005–2006, is still lower than it was in the late 1990s. Of the MERCOSUR members, Brazil, whose trade represents 70 per cent of the region’s total trade, has a relatively low share of intraregional trade (10 per cent), whereas for the other member countries, MERCOSUR is the most important trading partner.
5 Unless otherwise specified, all the data used in this section that is related to the trade of countries and groups of countries are based on the IMF Direction of Trade Statistics database.6 Since the Bolivarian Republic of Venezuela left ANCOM and started the process for joining MERCOSUR only in 2006, it has not been included as part of MERCOSUR for the purpose of this analysis.
8

TDR 2007, chapter IV
Figure 4.3
SHARE OF INTRAREGIONAL TRADE IN TOTAL TRADE: SELECTED REGIONAL BLOCS
(Total for the bloc and unweighted average of individual countries in per cent)
ANCOM
0
5
10
15
20
25
30
1960 1970 1980 1990 2000 '06
MERCOSUR
05
10152025303540
1960 1970 1980 1990 2000 '06
CACM
0
5
10
15
20
25
30
1960 1970 1980 1990 2000 '06
CARICOM
0
5
10
15
20
25
30
1981 1986 1991 1996 2001 2006
TotalAverage
ASEAN
0
5
10
15
20
25
30
35
1981 1986 1991 1996 2001 2006
SAARC
0
5
10
15
20
25
30
1981 1986 1991 1996 2001 2006
GCC
0
5
10
15
20
25
30
1976 1981 1986 1991 1996 2001 2006
CIS
0
10
20
30
40
50
60
70
1994 1997 2000 2003 2006
SADC
0
5
10
15
20
25
30
1990 1994 1998 2002 2006
UEMOA
0
5
10
15
20
25
30
1970 1976 1982 1988 1994 2000 2006
CEMAC
0
5
10
15
20
25
30
1981 1986 1991 1996 2001 2006
COMESA
0
5
10
15
20
25
30
1981 1986 1991 1996 2001 2006
ECOWAS
0
5
10
15
20
25
30
1981 1986 1991 1996 2001 2006
NAFTA
0
10
20
30
40
50
60
70
1960 1970 1980 1990 2000 '06
EU-15
0
10
20
30
40
50
60
70
1960 1970 1980 1990 2000 '06
Source: UNCTAD secretariat calculations, based on IMF, Direction of Trade Statistics database.Note: The periods differ, depending on availability of comparable data.
9

TDR 2007, chapter IV
In the Andean Community of Nations (ANCOM), the share of intraregional trade is lower than in MERCOSUR, although it has been increasing since the early 1990s. This is largely due to the weight of primary commodities in these countries’ exports, which go mainly to developed countries. In the case of the Bolivarian Republic of Venezuela – whose exports are dominated by oil and account for roughly half of total ANCOM exports – less than 5 per cent of the country’s total exports were directed to other ANCOM countries by 2006. On the other hand, one fifth of Colombia’s exports, which are more diversified, go to other ANCOM partners. As in MERCOSUR, the share of intraregional imports is more significant than that of intraregional exports. A significant and growing share of ANCOM countries’ trade is with other Latin American countries: it reached about 30 per cent of total ANCOM trade in 2000–2006. This indicates that a wider regional agreement (such as the proposed Union of the South involving all South American countries) would already be able to count on considerable trade among the members.
In the Central American Common Market (CACM), one of the earliest regional cooperation initiatives among developing countries, the trade agreement of 1961 gave a considerable boost to intraregional trade, which surged from 7 per cent of total trade in 1960 to 25 per cent in 1968–1970. The rationale for the agreement among its five small members was to create a wider market for their manufacturing industries. The strategy was successful inasmuch as the share of manufactures in the region’s GDP rose from 14 to 18 per cent during the 1960s (ECLAC, 2005). The relative decline of intraregional trade in the 1980s was due to a prolonged recession as a result of the debt crisis, as well as to regional conflicts. Moreover, some CACM members were dissatisfied with what they considered an uneven distribution of the costs and benefits of the common market. As a consequence, Honduras left the group in the late 1970s and reinstated customs tariffs on imports from its former partners, and Costa Rica and Nicaragua imposed new barriers on imports from other CACM members (Déniz Espinós, 2006). Although economic and political conditions once again became more favourable for intraregional trade in the 1990s, and Honduras rejoined the CACM, intraregional trade as a share of total trade did not fully recover, remaining at about 15 per cent of total trade. This was not least because, meanwhile, the group’s members had strengthened their trade relations with the United States, which led to the creation of the Central American Free Trade Association (CAFTA).7
3. Developing Asia
Of all regional cooperation agreements among developing countries, ASEAN has the highest share of intraregional trade in its total trade: 33 and 26 per cent by simple and weighted averages respectively (fig. 4.3). Although ASEAN was created as a political rather than an economic grouping, trade among its participants has consistently increased since the mid-1970s. Trade liberalization was formalized only in 1992 with the launching of the ASEAN Free Trade Area (AFTA). Trade expansion in ASEAN was largely due to the links of the member States with other economies in East and South-East Asia. Strong regional integration began in the mid-1980s when, under a combination of macroeconomic and structural pressures (Akyüz, 1998), Japanese FDI flows to East Asia started to grow. Vertical production relations in the electronics industry, especially from the beginning of the 1990s, became a more prominent feature of regional integration, involving also the second-tier NIEs and China. The strong growth in the volume of intraregional trade, largely through intra-industry trade in intermediate goods since the late 1980s, combined with intraregional FDI flows, has been an important feature of the East Asian experience over the past two decades; but reliance on markets for final goods outside the region has also continued unabated (Sakakibara and Yamakawa, 2003).
In East and South-East Asia, strong growth in intraregional trade is connected with the rise of regional production networks.
7 CAFTA consists of a series of bilateral FTAs between the United States, on one side, and individual Central American countries on the other. By spring 2007, the Costa Rican Parliament had not yet ratified the treaty, and a referendum on it was announced.
10
TDR 2007, chapter IV
These trends are connected with the rise of regional production networks. As discussed in previous TDRs these networks involve large TNCs which produce a standardized set of goods in several locations, or groups of small and medium-sized enterprises that are located in different countries and linked through international subcontracting to a lead coordinating firm. Both types of networks exist in East Asia, though the first kind is more prevalent. China has contributed significantly to the accelerating pace of intraregional trade since the late 1980s, with large firms from the region relocating assembly operations to take advantage of cost conditions. These firms have become important exporters of intermediate goods to China. Participation in these networks has also been part of the development impetus in South-East Asia, albeit confined to a small number of industries.
Regional production networks have emerged mainly in the electrical and electronics industries and, in the context of fast output growth in East and South-East Asia have contributed to the rapid expansion of intraregional trade. In 2006, the trade of ASEAN members with other developing countries in East and South-East Asia accounted for almost 50 per cent of total ASEAN trade, compared to 30 per cent in 1990. This dynamic shows how trade flows may be driven not only by formal agreements, but also by de facto regional production networks. Its success has encouraged negotiations for the establishment of a free trade area that would include ASEAN countries, China, the Republic of Korea and Japan.
Trade flows may be driven not only by formal agreements, but also by de facto regional production networks.
Outside East and South-East Asia, the experience with production networks is more problematic, particularly where FDI has been attracted against a backdrop of weak (or even declining) domestic capital formation and, in some instances, even “deindustrialization”. In the absence of strong internal integration, FDI can lead to a dualistic development pattern based on enclave type development. 8 There is also the added danger of it leading to an overproduction of standardized products with a high import content, as in the assembly industries, which threatens to lock countries into low-wage, low value-added activities characterized by diminishing returns and a large informal sector.
Similar to the impact of the crises in Latin American countries that affected the integration process in MERCOSUR, the Asian financial crisis in 1997–1998 led to a fall in intraregional exports in East and South-East Asia in general, and in ASEAN in particular. However, the impact in ASEAN was less severe, and the Asian economies as well as their intraregional trade flows recovered more quickly. In ASEAN, intraregional exports fell by 20 per cent between 1996 and 1998, compared to 50 per cent in MERCOSUR between 1998 and 2002. The main reason for the weaker impact of the crisis is that much of the trade between ASEAN countries is composed of intermediate goods whose final destination, after being transformed, is outside the region. Thus the resilience of the final demand maintained the intraregional trade in parts and components.
Regional integration is much less dynamic in South Asia, where the establishment of the South Asian Association for Regional Cooperation (SAARC) in 1985 has not been followed by fast growth in intraregional trade, which in aggregate terms does not exceed 5 per cent of the region’s total trade. This very limited intraregional trade is mainly because trade relations of the largest economies in the region, India and Pakistan, with the other members, and particularly with each other, are of minor importance compared to their extraregional trade. Nevertheless, SAARC countries, especially India, are important trading partners for the smaller members of the bloc.9 These asymmetries explain the gap between the two measures of intra-
8 This has long been understood to occur with FDI in the primary sector, where imported capital, skilled labour and inputs, have tended to generate large export earnings but weak local linkages, and countries strongly reliant on their primary sector have been particularly vulnerable to unfavourable movements in their terms of trade. For an analysis of the linkages generated by FDI in extractive industries, see UNCTAD, 2007b. 9 In 2005/2006 SAARC members accounted for 57 per cent of Nepal’s exports and for 48 per cent of its imports. The respective figures for Sri Lanka are 10 and 21 per cent, for the Maldives 15 and 17 per cent, and for Bangladesh 2 and 14 per cent.
11

TDR 2007, chapter IV
regional trade shown in figure 4.3, with very low total intraregional trade but a significant average indicator for the countries.
In the countries that form the Gulf Cooperation Council (GCC), established as a customs union in 2003 to strengthen economic linkages and to increase the contribution of the industrial sector to their gross national product, the share of intraregional in total trade has remained modest mainly because the exports of all the members are dominated by fuels. The share of intraregional imports in total imports of the members is more significant, especially for Bahrain and Oman, and to a lesser extent Kuwait and Qatar. These imports consist mainly of manufactures from Saudi Arabia and the United Arab Emirates. The recent surge in the GCC countries’ value of exports due to high oil prices has further reduced the share of intraregional trade in total trade, although intraregional trade in GCC has expanded in absolute terms, with two-thirds of this expansion due to trade in manufactures. In the long run a sustained improvement in intraregional manufacturing trade could help GCC countries in their efforts to diversify their economies (Fasano and Iqbal, 2003).
4. Africa
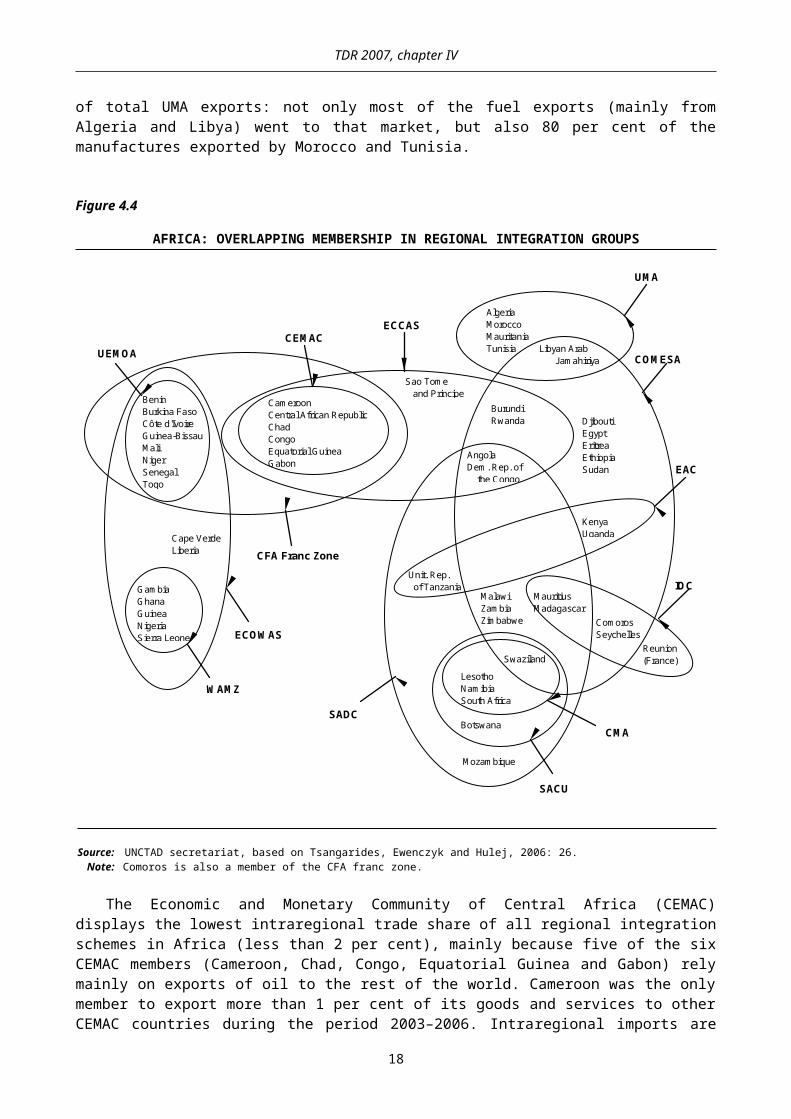
African countries typically belong to several RTAs (fig. 4.4), but this has not always been accompanied by significant intraregional trade. Trade within the Arab Maghreb Union (UMA), the Economic and Monetary Community of Central Africa (CEMAC) and the Common Market for Eastern and Southern Africa (COMESA) has not exceeded 5 per cent of their total trade. Intraregional trade in UMA is particularly low, despite the relatively diversified manufactured exports of some of its members (Morocco and Tunisia). In 2005, Western Europe accounted for two thirds of total UMA exports: not only most of the fuel exports (mainly from Algeria and Libya) went to that market, but also 80 per cent of the manufactures exported by Morocco and Tunisia.
12

TDR 2007, chapter IV
Figure 4.4
AFRICA: OVERLAPPING MEMBERSHIP IN REGIONAL INTEGRATION GROUPS
BeninBurkina FasoCôte d'IvoireGuinea-BissauMaliNigerSenegalTogo
CameroonCentral African RepublicChadCongoEquatorial GuineaGabon
GambiaGhanaGuineaNigeriaSierra Leone
Cape VerdeLiberia
CEMAC
COMESA
ECCAS
EAC
ECOWAS
IOC
SACU
SADC
UEMOA
WAMZ
Sao Tome and Principe
BurundiRwanda
AngolaDem. Rep. of the Congo
Unit. Rep. of Tanzania
MalawiZambiaZimbabwe
MauritiusMadagascar
Swaziland
LesothoNamibiaSouth Africa
Botswana
Mozambique
ComorosSeychelles
Reunion(France)
DjiboutiEgyptEritreaEthiopiaSudan
KenyaUganda
CFA Franc Zone
CMA
AlgeriaMoroccoMauritaniaTunisia Libyan Arab Jamahiriya
UMA
Source: UNCTAD secretariat, based on Tsangarides, Ewenczyk and Hulej, 2006: 26. Note: Comoros is also a member of the CFA franc zone.
The Economic and Monetary Community of Central Africa (CEMAC) displays the lowest intraregional trade share of all regional integration schemes in Africa (less than 2 per cent), mainly because five of the six CEMAC members (Cameroon, Chad, Congo, Equatorial Guinea and Gabon) rely mainly on exports of oil to the rest of the world. Cameroon was the only member to export more than 1 per cent of its goods and services to other CEMAC countries during the period 2003–2006. Intraregional imports are significant in the two landlocked countries of this bloc, the Central African Republic and Chad, accounting for between 11 and 17 per cent of their imports during this period, most of which originated in Cameroon.
Trade links between the members of the West African Economic and Monetary Union (UEMOA) are much more developed. Together with CEMAC and Comoros, this Union belongs to the CFA franc zone. UEMOA is also part of the larger ECOWAS (fig. 4.4) and intraregional trade in both these groupings during the period 2003–2006 accounted for around 10 per cent of total trade. Although CEMAC and UEMOA are part of the same monetary zone (see chap. V) and thereby exchange-rate risk is ruled out, trade between them is almost non-existent. By contrast, UEMOA has relatively strong trade links with the other countries forming ECOWAS as well as with other subregions in Africa. In 2006, 26 per cent of UEMOA’s exports
13

TDR 2007, chapter IV
went to ECOWAS and 32 per cent to Africa as a whole, while 20 per cent of its imports originated from ECOWAS and 23 per cent from Africa.
Trade integration in ECOWAS has advanced very slowly since the early 1990s and intraregional trade has been highly concentrated in a few countries. Three countries (Nigeria, Côte d’Ivoire and Senegal) account for almost 90 per cent of all intraregional exports, and for almost 50 per cent of all intraregional imports. The relatively low intraregional trade in ECOWAS is partly due to the small share of Nigeria intraregional trade, considering that the country accounts for 75 per cent of total ECOWAS exports and 45 per cent of its imports. If Nigeria is excluded, intraregional trade increases to 20 per cent of total trade. Still, this average conceals wide differences among the member countries. Intraregional trade is substantially above average for landlocked countries such as Burkina Faso, Mali and Niger, and also for Senegal and Togo that supply the region with a few manufactures.
The relatively low level of intraregional trade in ECOWAS is also explained by the high dependence of most member countries on exports of primary commodities, and by a trade liberalization scheme that has very strict rules of origin. Access to the regional market is especially difficult for those firms and sectors that are at an early stage of development, given the low degree of internal integration. Such firms have to rely on imported inputs, and the content of domestic value added in their products is often too small to satisfy the rules of origin. In early 2000, only 17 manufacturing firms were able to comply with these rules (Shams, 2003). Other obstacles to intraregional trade are bureaucratic and physical ones, such as road charges, transit fees and administrative delays at borders and ports, which raise transport costs and render deliveries unreliable.
Intraregional trade is more important in the Southern African Development Community (SADC), and especially among the more limited number of members of SACU within that Community, which have close trade links with the largest member of the group, South Africa. The discrepancy between the two trends for SADC in figure 4.3 confirms the relatively greater importance of intraregional trade for the smaller countries of these RTAs.10 Angola, the second largest economy after South Africa within SADC has practically no trade relations with other African countries: its manufactured imports come almost exclusively from developed countries and Asian developing countries, and only a small fraction of its exports, almost exclusively crude oil, are exported to other African countries where refining capacities are either absent or very limited. However, for some SADC countries, in particular Malawi, Mozambique, Zambia and Zimbabwe, SADC is the major source of their imports, and it also accounts for 22 per cent, 16 per cent, 36 per cent and 45 per cent, respectively, of their total exports in 2005–2006.11
In sum, the relatively small weight of intraregional trade in Africa, despite the existence of several (and frequently overlapping) RTAs, is due largely to their structure of production and the composition of their exports. As many countries are still specialized in a small number of primary commodities, while most of their imports consist of manufactures, the potential for intraregional trade is limited. The export-oriented production of labour-intensive manufactures in some countries, such as Cape Verde, Lesotho, Mauritius, Morocco and Tunisia is directed primarily to the European and United States markets. However, intraregional trade is significant for several relatively small economies, particularly the landlocked countries.
5. Commonwealth of Independent States (CIS)
In contrast to most regional groupings in Africa, Asia and Latin America, which have experienced an increase in intraregional trade over the past two decades, the experience of the CIS during the 1990s was one of economic disintegration, despite the conclusion of numerous agreements.12 With the break-up of the
10 Exports from most SACU members are overwhelmingly directed to the rest of the world, in particular the EU and the United States. With regard to imports, however, Botswana, Lesotho, Namibia and Swaziland are highly dependent on South Africa, which accounts for 70 per cent or more of each of these countries’ total imports (Metzger, 2006: 52).11 These strong trade links appear to be due mainly to bilateral trade agreements between these countries and South Africa rather than to trade liberalization within SADC (Visser and Hartzenberg, 2004: 8–10).12 An in-depth analysis of the process of disintegration of the CIS and the former COMECON during the 1990s is provided in ECE, 2003.
14

TDR 2007, chapter IV
Soviet Union, a formerly well-integrated economic space lost the basic elements for its functioning: a high degree of protection vis-à-vis the rest of the world, a single currency and central production planning that also determined the geographic location of production. This was accompanied by a sharp fall in total GDP, which was the most pronounced in the manufacturing sector and in agriculture. The result was a decline in trade flows between the newly independent States, and a reorientation of trade towards other regions, especially Western Europe. While intra-Soviet trade in 1990 accounted for 77 per cent of the total trade of the Soviet Republics, the share of intra-CIS trade in total CIS trade fell to 34 per cent by 1994 and to 21 per cent in 2006 (Elborgh-Woytek, 2003).13
Intraregional trade among the members of the CIS has been declining, despite numerous regional agreements.
The declining share of intra-CIS trade was accompanied by a dramatic decline in total external trade at the beginning of the 1990s. Between 1991 and 1993, total exports and imports of CIS members fell by 65 per cent and 72 per cent respectively. Since then, trade volumes have been rising; after a new setback to trade expansion as a result of the rouble crisis of 1998, exports have recovered since the start of the new millennium. In recent years, most CIS countries have seen their exports surge, mainly due to price increases in their primary commodity exports. Since 2000, the CIS has been one of the fastest growing regions in the world, with all members posting solid GDP growth rates.
The geographic distribution of the trade of CIS members varies widely. Some remain fairly dependent on intra-CIS trade, both in terms of exports and imports: for Belarus, Turkmenistan, Tajikistan, Uzbekistan, the Republic of Moldova and Ukraine, more than one third of total trade still takes place with other CIS partners; but for the Russian Federation, intraregional trade represented less than 12 per cent of its total trade in 2006. In general, CIS members depend more heavily on their region for imports than for exports.14
Until the mid-1990s, the largest economy in the region, the Russian Federation, remained the main trading partner for most CIS members, but by 2005 it was the main trading partner only for Belarus, Ukraine and Uzbekistan. For several CIS members, it was replaced by the EU-15, while Kyrgyzstan’s trade is mainly with China and Turkmenistan’s is with Ukraine. Geographical proximity is playing an important role in determining the direction of trade of the different CIS members. Thus, the Islamic Republic of Iran and Turkey have become important trading partners for the Caucasus countries, China is gaining importance for the Central Asian countries and for the European members of the CIS, they are the countries of Central Europe (which have all become members of the EU) and South-East Europe.
* * *
Trade agreements per se, whether bilateral or plurilateral, do not automatically lead to increased trade among the parties. Many other factors, particularly those related to the supply and demand structures of the members’ economies, have a considerable influence on intraregional trade performance and its potential impact on their growth and development. A static view of the effects of regional agreements may therefore be misleading. The dynamics of the various regional blocs discussed in this section indicate that the intensity of intraregional trade among developing and transition economies is conditioned by several factors, which may reinforce each other; these include the absorptive capacity of the individual domestic markets for the
13 Data after 1994 are from the IMF, Direction of Trade Statistics database. For longer term assessments of trade relations in the former Soviet Union and the CIS, see Belkindas and Ivanova, 1995.14 Differences in reported imports and exports between pairs of countries within the CIS are often larger than what is reflected in transport costs, indicating a general problem of data reliability. Problems with data and reporting with regard to CIS trade are discussed in Freinkman, Polyakov and Revenco, 2004: 1–5.
15
TDR 2007, chapter IV
products of neighbouring countries, which is mainly determined by the relative size of the economies of the region and their per capita incomes and production structures. The potential of RTAs to generate trade among their members, which could help stimulate diversification (resulting possibly in greater complemen-tarities), competition and economies of scale, and promote structural change, is generally circumscribed by weak growth, particularly of the manufacturing sector.
C. Composition of intraregional trade
The benefits of international trade for economic development generally depend on a variety of factors; they cannot be measured simply by the increase in the total value of exports. The degree of the positive impacts of trade expansion on long-term growth will depend on the extent of the linkages between the export sector and the rest of the economy, the amount of employment it creates, the extent of the technological spillovers to the rest of the economy, the proportion of domestic value added in the value of exports, the revenue it generates and the share of that revenue that accrues to domestic actors, which in turn will lay the basis for a strong export-profit-investment nexus (Akyüz and Gore, 1994; see also TDRs 1996, chap. II; 2003, chap. IV; and 2005, chap. II).
The export sector may have strong linkages with the rest of the economy or it may be a mere enclave, which can be the case when, in a country with limited domestic capabilities, the export sector is based on specific resource endowments such as abundant labour or natural resource deposits. The benefits from hosting TNCs are most positive when inputs are sourced locally and when the host country already has sufficient manufacturing capabilities and human capital to take advantage of potential spillovers (Rodriguez-Clare, 1996). The development effects of FDI for the host country depend on a range of factors, including the amount of technological spillovers from affiliates to domestic enterprises, the creation of backward and forward linkages within the economy, and the impact on domestic investment and employment (UNCTAD, 2007c: 13). In the first-tier Asian newly industrializing economies (NIEs), such spillovers occurred because the very high rate of capital formation and accompanying industrial policies in these countries meant that domestic firms with absorptive capacity were able to capture some of the “collateral benefits” from hosting FDI. Such effects are more difficult to find in countries where international production networks have been more visible but policy intervention has been weaker. In some cases, high rates of both domestic and foreign investment have helped fuel rapid growth by exploiting a combination of abundant supplies of labour and natural resources. However, reliance on imported inputs or foreign-owned suppliers has meant that the constellation of linkages characteristic of internal integration are weak or missing, limiting the benefits that may otherwise arise from FDI-induced competitiveness.
Internal integration increases the chances of benefiting from FDI, and for the gains from international trade to be dispersed throughout the economy. As long as the export sector is limited to a narrow package of activities, even in the context of international production networks, the likelihood that a dynamic process of upgrading of activities to a more skill-intensive and sustained pattern of industrial growth will occur is rather limited. On the other hand, when TNCs do not integrate into their host economies, they have a much wider choice of sites, which makes them more footloose and thus strengthens their bargaining position with the host government. This can give rise to excessive and unhealthy competition to attract FDI (through fiscal and trade-related concessions), skewing the gains from international and regional trade in favour of TNCs.
In the absence of strong internal integration, TNC-driven industrialization can lead to an enclave-type development pattern, where the production of standardized goods with a high import content threatens to lock countries into low-wage, low-value-added activities characterized by diminishing returns and a growing informal sector. This pattern has been identified in parts of Latin America and the Caribbean, and North Africa. Regional cooperation, including through preferential trade agreements, might still be used to attract FDI. But if this comes at the expense of policy space, it could risk leading to a skewed pattern of development. The use of deliberate macroeconomic, industrial and technological policies are necessary to reduce the probability of the export sector becoming just an enclave. It can also be influenced by the kind of activities in which an economy specializes.
16

TDR 2007, chapter IV
Depending on the specific circumstances and policies in a country, exports of primary commodities can have a strong impact on growth, especially if they generate profits for local agents that are reinvested in a way that contributes to the creation of productive capacity, productivity growth and diversification, in particular in the manufacturing sector. In general, manufacturing activities are more likely than primary activities to create economic linkages with the rest of the economy. The industrialization process should attempt to move into sectors that are more technology- and skill-intensive, with the ability to generate technological spillovers to the rest of the economy. A comparison of the composition of intraregional trade and extraregional trade suggests that the former in many cases offers greater potential for upgrading of exports and manufacturing than the latter.
In many cases intraregional trade offers greater potential for upgrading manufacturing and exports than extraregional trade.
Figure 4.5 shows the composition of the trade of different regional groupings with their main trading partners by major product category. In Latin America, much of the trade of MERCOSUR, ANCOM and CACM with developed economies follows a traditional pattern: exports consist mainly of primary products and labour-intensive manufactures, while imports consist mainly of medium- and high-technology-intensive manufactures. Western Europe and Japan buy mainly agricultural goods from MERCOSUR and CACM, and mining products from ANCOM. United States imports from Latin America are more diversified: in addition to fuels from ANCOM (mainly the Bolivarian Republic of Venezuela) and agricultural goods from CACM (coffee, fruits), it imports a variety of manufactures from MERCOSUR and labour-intensive manufactures and electronic parts from CACM, originating mainly from the maquila assembly industries. Similarly, the trade of these Latin American blocs with developing regions outside Latin America is dominated by manufactured imports and by primary exports, such as agricultural goods from MERCOSUR and oil from ANCOM.
17
TDR 2007, chapter IV
Figure 4.5
COMPOSITION AND DIRECTION OF TRADE, SELECTED REGIONS (2003–2005 average, in per cent)
MERCOSUR: exports
0%
20%
40%
60%
80%
100%
World Dev'd econ.
MERCOSUR
Other LAC
Other regions
MERCOSUR: imports
0%
20%
40%
60%
80%
100%
World Dev'd econ.
MERCOSUR
Other LAC
Other regions
ANCOM: exports
0%
20%
40%
60%
80%
100%
World Dev'd econ.
ANCOM Other LAC
Other regions
ANCOM: imports
0%
20%
40%
60%
80%
100%
World Dev'd econ.
ANCOM Other LAC
Other regions
CACM: exports
0%
20%
40%
60%
80%
100%
World Dev'd econ.
CACM Other LAC
Other regions
CACM: imports
0%
20%
40%
60%
80%
100%
World Dev'd econ.
CACM Other LAC
Other regions
A. Latin America
High- and medium-skill and technology-intensive manufactures (STI)Other manufactures (incl. electronics)Agricultural products FuelsMinerals, ores and metals (incl. gold)Other products
18
TDR 2007, chapter IV
Figure 4.5 (continued)
COMPOSITION AND DIRECTION OF TRADE, SELECTED REGIONS (2003–2005 average, in per cent)
COMESA: exports
0%
20%
40%
60%
80%
100%
World Dev'd econ.
COMESA
OtherAfrica
Other regions
COMESA: imports
0%
20%
40%
60%
80%
100%
World Dev'd econ.
COMESA
OtherAfrica
Other regions
SADC: exports
0%
20%
40%
60%
80%
100%
World Dev'd econ.
SADC OtherAfrica
Other regions
SADC: imports
0%
20%
40%
60%
80%
100%
World Dev'd econ.
SADC OtherAfrica
Other regions
UEMOA: exports
0%
20%
40%
60%
80%
100%
World Dev'd econ.
UEMOA OtherAfrica
Other regions
UEMOA: imports
0%
20%
40%
60%
80%
100%
World Dev'd econ.
UEMOA OtherAfrica
Other regions
B. Africa
High- and medium-skill and technology-intensive manufactures (STI)Other manufactures (incl. electronics)Agricultural products FuelsMinerals, ores and metals (incl. gold)Other products
19

TDR 2007, chapter IV
Figure 4.5 (concluded)
COMPOSITION AND DIRECTION OF TRADE, SELECTED REGIONS (2003–2005 average, in per cent)
ASEAN: exports
0%
20%
40%
60%
80%
100%
World Dev'd econ.
ASEAN Otherdev'g Asia
Other regions
ASEAN: imports
0%
20%
40%
60%
80%
100%
World Dev'd econ.
ASEAN Otherdev'g Asia
Other regions
East and South-East Asia: exports
0%
20%
40%
60%
80%
100%
World Dev'd econ.
East and South-East
Asia
Other regions
East and South-East Asia: imports
0%
20%
40%
60%
80%
100%
World Dev'd econ.
East and South-East
Asia
Other regions
C. Asia
D. CIS
CIS: exports
0%
20%
40%
60%
80%
100%
World Dev'd econ.
CIS Otherecon. intransition
Otherregions
CIS: imports
0%
20%
40%
60%
80%
100%
World Dev'd econ.
CIS Otherecon. in
transition
Otherregions
Other manufactures (incl. electronics)FuelsOther products
High- and medium-skill and technology-intensive manufactures (STI)Agricultural products Minerals, ores and metals (incl. gold)
High- and medium-skill and technology-intensive manufactures (STI)Electronics (excl. parts and components) Primary commodities
Parts and components for electronic goods (PCE)Other manufacturesOther products
Source: UNCTAD secretariat calculations, based on UN/DESA estimates; and UN COMTRADE.Note: For the composition on product categories, see the notes to this chapter. LAC = Latin America and the Caribbean.
20

TDR 2007, chapter IV
Intraregional exports comprise a much larger share of manufactures, including a high proportion of medium- and high-technology products: 70 per cent in MERCOSUR and more than 60 per cent in ANCOM and CACM. The composition of extraregional exports of CACM and MERCOSUR with other countries in Latin America and the Caribbean is diversified, with a higher share of manufactures than their exports to the rest of the world. Thus, for most Latin American countries, regional markets are the leading destinations for their manufactured exports, especially for skill- and technology-intensive manufactures.
This is confirmed by examining the exports of different product categories disaggregated by their geographical destination (fig. 4.6). In MERCOSUR, 50 per cent of the exports of high- and medium-skill and technology-intensive manufactures go to Latin American countries, although total exports to Latin America represent only 29 per cent of total MERCOSUR exports. The difference is even greater in the case of ANCOM: 70 per cent of the exports of the more technology-intensive manufactures go to Latin American countries, particularly to other ANCOM partners, compared to 20 per cent of all intraregional exports in total exports. In the case of CACM, more than 40 per cent of the exports of high- and medium-skill and technology-intensive manufactures go to other CACM partners, almost 20 per cent to other Latin American countries, and 35 per cent to the United States and Canada. The importance of regional markets for this product category is corroborated by a country-by-country examination. In Argentina, Colombia, Ecuador and Uruguay, exports to Latin America account for between 32 and 40 per cent of total exports; but the share of exports of the more technology- and skill-intensive manufactures that goes to Latin American countries is close to 80 per cent in all these countries, and reaches 90 per cent in Uruguay. Even in Brazil and Chile, for which the Latin American market is less important – in Brazil owing to its size, and in Chile to its specialization in primary goods – almost 45 per cent of this category (i.e. the higher end of the technology- and skill-intensive manufactured exports) goes to the regional market.
21
TDR 2007, chapter IV
Figure 4.6
DESTINATION OF EXPORTS BY BROAD PRODUCT CATEGORY, SELECTED REGIONAL BLOCS(2003–2005 average, in per cent)
ANCOM
0%
20%
40%
60%
80%
100%
Total STI manf. Other manf. (incl. electr.)
Agricult. prod. Fuels Minerals andmetals
ANCOM Other developing AmericaDeveloped America Developed EuropeDeveloped Asia and Oceania Other regions
CACM
0%
20%
40%
60%
80%
100%
Total STI manf. Other manf. (incl. electr.)
Agricult. prod. Fuels Minerals andmetals
CACM Other developing AmericaDeveloped America Developed EuropeDeveloped Asia and Oceania Other regions
COMESA
0%
20%
40%
60%
80%
100%
Total STI manf. Other manf. (incl. electr.)
Agricult. prod. Fuels Minerals andmetals
COMESA Other AfricaDeveloped America Developed EuropeDeveloped Asia and Oceania Other regions
MERCOSUR
0%
20%
40%
60%
80%
100%
Total STI manf. Other manf. (incl. electr.)
Agricult. prod. Fuels Minerals andmetals
MERCOSUR Other developing AmericaDeveloped America Developed EuropeDeveloped Asia and Oceania Other regions
UEMOA
0%
20%
40%
60%
80%
100%
Total STI manf. Other manf. (incl. electr.)
Agricult. prod. Fuels Minerals andmetals
UEMOA Other AfricaDeveloped America Developed EuropeDeveloped Asia and Oceania Other regions
SADC
0%
20%
40%
60%
80%
100%
Total STI manf. Other manf. (incl. electr.)
Agricult. prod. Fuels Minerals andmetals
SADC Other AfricaDeveloped America Developed EuropeDeveloped Asia and Oceania Other regions
Figure 4.6 (concluded)
22

TDR 2007, chapter IV
DESTINATION OF EXPORTS BY BROAD PRODUCT CATEGORY, SELECTED REGIONAL BLOCS
(2003–2005 average, in per cent)
ASEAN
0%
20%
40%
60%
80%
100%
Total STI manf. PCE Electron.(excl. PCE)
Other manf.
Primary commod.
ASEAN Other developing AsiaDeveloped America Developed EuropeDeveloped Asia and Oceania Other regions
CIS
0%
20%
40%
60%
80%
100%
Total STI manf. Other manf. (incl. electr.)
Agricult. prod. Fuels Minerals andmetals
CIS Other transition economiesDeveloped America Developed EuropeDeveloped Asia and Oceania Other regions
Source: UNCTAD secretariat calculations, based on UN/DESA estimates; and UN COMTRADE. Note: For the composition on product categories, see the notes to this chapter.
STI = High- and medium-skill and technology-intensive manufactures;PCE = Parts and components for electrical and electronic goods.
In the African regions, data for the period 2003–2005 indicate that the composition of trade is partly determined by its trading partners (fig. 4.5B). Primary products, mostly fuels, constitute more than three quarters of COMESA exports to developed economies and developing regions other than Africa, while imports from these economies and regions comprise mainly manufactures. Trade with African countries is much more balanced. While manufactured exports from COMESA represent only a small fraction of its total exports, it is nevertheless notable that manufactures account for more than 40 per cent of exports within COMESA and almost 50 per cent of exports to other African countries; half of these are high- and medium-technology-intensive and skill-intensive. As a result, more than 60 per cent of the more sophisticated manufactured exports are sold in Africa (fig. 4.6). The trade structure of UEMOA resembles that of COMESA, but UEMOA’s exports of manufactures contain a higher share of medium- and high-technology-intensive products than COMESA’s, and the share of manufactures exported to African countries outside the regional group is much smaller than that of COMESA. The share of manufactures in UEMOA’s intraregional exports rose from less than 30 per cent in 1995 to over 40 per cent in 2005.
In SADC, and in particular in the subgroup SACU, manufactures comprise a larger share of exports in both intra- and extraregional trade than in the other African subregions, largely on account of the largest economy in the region, South Africa (fig. 4.5B).15 The share of manufactures in intraregional exports is particularly high within SADC and with other countries in Africa. Nevertheless, developed economies remain by far the most important market for SADC exports, both primary and manufactured (fig. 4.6). In view of the supply capacity for manufacturing within SADC, this level of intraregional trade seems quite modest. In the case of the SACU subregion, intraregional exports consist mainly of manufactures from South Africa, with few trade flows in the other direction. This is partly due to the relative size of the South African economy, but there also appears to remain considerable scope for South Africa to open its markets to more imports from its SACU partners.16 Nevertheless, similar to the UEMOA experience, the product
15 In SACU (that is not included in figures 4.5 and 4.6), manufactures accounted for around 60 per cent of exports to developed-country markets, and for two thirds of all SACU exports to African countries in 2002–2005.While the largest share of these manufactured exports is from South Africa, it is worth noting that smaller SACU partners also have a significant share of manufactures in their total exports.16 Several observers have drawn attention to the protection of the South African market by restrictive local content requirements within SACU, on the one hand, and South Africa granting of unilateral tariff rebates on a number of extraregional imports, on the other (Gaomab and Hartmann, 2006: 54–55; Kalenga, 2005: 19–20; WTO, 2003: x).
23

TDR 2007, chapter IV
composition of intraregional exports in SACU has also shifted towards a greater share of manufactures and technologically more sophisticated products, and such upgrading has also occurred in extraregional exports.
In ASEAN intra- and extraregional trade, more than 75 per cent of both exports and imports are manufactures, particularly electronic goods (fig. 4.5C). In their trade with developed regions, ASEAN countries import mainly high- and medium-skill- and technology-intensive manufactures, and electronic parts and components, while their exports of manufactures are more diversified, including also labour-intensive goods and finished electronic products. There is intense trade of electronic parts and components with East and South-East Asian developing countries, including with ASEAN partners, which reflects the existence of a dense regional production network in electronics industries. On the other hand, given their low endowments of industrial raw materials relative to their level of industrialization and consumption, East and South-East Asian countries, including the members of ASEAN, with a few exceptions, rely to a large extent on imports of primary commodities, especially fuels, from other developing regions. The import structure of ASEAN is very similar to that of the wider geographical region of East and South-East Asia, the main difference being that the share of parts and components of electronic goods in total imports from and exports to developed countries is considerably higher for ASEAN, indicating that international production networks play a greater role for its members than for other countries in the wider geographical region.
The fact that the international trade of ASEAN countries is closely related to such production networks explains much of its recent dynamism: ASEAN’s total and intraregional trade grew at annual average rate of 18 per cent and 21 per cent, respectively, between 2003 and 2005. The trade pattern of the East and South-East Asian region as a whole reflects the way its production structure is organized. It imports high- and medium-technology-intensive goods, including capital goods, mainly from developed countries, electronic parts and components mainly from within the region, and primary commodities mainly from other developing regions. It exports a large proportion of labour-intensive manufactures and final electronic goods to developed countries, while high- and medium-technology-intensive goods and electronic parts and components are traded largely within the region.
The product composition of exports from the CIS to the rest of the world changed dramatically during the 1990s, with a rapid decline in manufacturing – in both absolute and relative terms – reflecting the decline in the manufacturing industries of the former Soviet Union. Yet in intraregional trade the share of manufactured exports remained relatively stable in the second half of the 1990s and has even increased slightly since 2000. In the natural-resource-rich countries, these earlier losses were compensated to a large extent – and in some cases overcompensated – by increasing export volumes and higher prices of exports of oil, natural gas and other raw materials. Other countries, such as Georgia and the Republic of Moldova, had to rely on agricultural exports. Although commodity prices have shown a rising trend since 2002, this shift to primary commodities has increased the vulnerability of CIS members to external shocks, and may weaken their potential for long-term growth, especially as it is largely the result of a decline in manufacturing. Most governments in these economies recognize this problem, but a large proportion of the domestic and foreign investment in them still goes to the extractive industries where high returns can be expected in the short run (ECE, 2005: 62). Another problem regarding the specialization of several CIS members in extractive industries is that this sector is capital-intensive and requires relatively little labour, which means that it cannot directly contribute to substantial job creation.
Trade within the same geographical region can often be more conducive to diversification, structural change and industrial upgrading than overall trade.
Summing up, regional blocs of developing countries and economies in transition constitute important and, in many cases, dynamic markets for the manufactured exports of their members, even if the size of these markets is relatively small. Evidence suggests that owing to its product composition, trade within the same geographical region can often be more conducive to diversification, structural change and industrial upgrading than overall trade. Geographical proximity matters as much as the initial domestic structure of
24
TDR 2007, chapter IV
economic activity in each country, but RTAs, as well as other arrangements at the regional level that foster trade integration and greater product diversity, especially in the manufacturing sector, can enhance the positive impact of intraregional trade. Obviously, the geographical directions of external integration – intraregional, with other developing regions or with developed countries – are not mutually exclusive: a country may benefit from expanding its exports to all these markets. However, for a developing country seeking to move up the production ladder and, in particular, to accelerate and upgrade domestic technology and manufacturing, stronger regional integration can provide an important impetus.
D. The potential role of South-South regional trade agreements
Regional economic integration arrangements among developing countries have been considered key to promoting industrialization, as exemplified in the arguments put forward for the creation of a Latin American common market in the late 1950s. In Latin America, where several countries had reached a significant degree of industrial development, regional integration was seen as providing the necessary elements for industrial upgrading, since new, more complex industrial structures necessitated economies of scale through the provision of a larger market. As stated by ECLAC (1959: 329) production should not remain “in twenty separate compartments”. Moreover there was a growing awareness that without such industrial upgrading, the gap vis-à-vis the more advanced industrial countries would keep widening.
The expansion of intraregional trade and, in particular, the importance of regional markets for manufactures, discussed in the previous sections, confirm that regionalism can help the process of industrialization and efficiency gains through intra-industry trade. However, the distribution of the gains among the members of a regional bloc and the economic agents may be quite unevenly spread. A priori, one would expect the smaller countries (and the smaller firms) to benefit the most from a wider market. But the free play of market forces may accentuate inequalities when initial conditions are unequal. In the absence of policies aimed at reducing asymmetries, the more developed countries – and geographical regions within countries – tend to benefit more from the larger regional space than the less advanced countries or regions. Similarly, TNCs may benefit from the wider economic space by being able to organize their production and distribution networks at the regional level much more easily than small- and medium-sized firms.
Regionalism can help the process of industrialization and efficiency gains through intra-industry trade. However, the benefits may be unevenly distributed.
One indicator of the distribution of gains within a regional bloc is the intraregional structure of trade surpluses and deficits (table 4.2). It appears that, in general, countries at higher levels of industrial development and diversification, such as South Africa in SADC, Côte d’Ivoire in UEMOA, Kenya in COMESA, India in SAARC, Brazil in MERCOSUR, Colombia in ANCOM and the Russian Federation in the CIS, achieved surpluses in their trade with their regional partners, while the less advanced (and frequently smaller) members of the blocs recorded intraregional trade deficits. This asymmetry is exacerbated by the fact that the trade surpluses in the larger, more developed members usually account for a small proportion of their GDP, while the deficits in the smaller, less developed members often represent a significant proportion of their GDP.
Table 4.2
INTRAREGIONAL TRADE BALANCE IN SELECTED REGIONAL BLOCS, 2000–2006(Millions of dollars and per cent, annual average)
Surplus countries Deficit countries
Value of Trade balance Value of Trade balance
25

TDR 2007, chapter IV
trade balance in per cent trade balance in per cent($ million) of GDP ($ million) of GDP
UEMOA
Côte d’Ivoire 619 4.4 Mali -372 -8.9Senegal 171 2.6 Burkina Faso -246 -6.1Togo 60 3.4 Niger -82 -3.3
Others -117 -3.1
SADCSouth Africa 3 022 1.7 Zambia -557 -10.1
Mozambique -533 -10.3Zimbabwe -474 -11.2Others -1 600 -3.3
COMESAKenya 708 4.4 Uganda -346 -4.8Zimbabwe 57 1.3 Sudan -146 -0.8Mauritius 52 1.0 Dem. Rep. of the Congo -146 -2.3Egypt 34 0.0 Others -365 -0.8
CACMCosta Rica 432 2.4 Honduras -408 -5.6Guatemala 355 1.4 Nicaragua -264 -6.0
El Salvador -102 -0.7
MERCOSURBrazil 1 308 0.2 Paraguay -643 -9.4
Uruguay -597 -3.8Argentina -225 -0.1
ANCOMColombia 1 237 1.3 Peru -806 -1.2Bolivia 174 2.0 Ecuador -728 -2.6
Venezuela (Bolivarian Republic of) -331 -0.3
SAARCIndia 2 845 0.4 Bangladesh -1 518 -2.7
Sri Lanka -933 -4.7Others -401 -0.4
CISRussian Federation 7 213 1.4 Ukraine -5 857 -10.0Turkmenistan 1 131 21.8 Belarus -3 139 -15.2Uzbekistan 38 0.3 Kazakhstan -2 300 -5.9
Others -2 133 -9.1
Source: UNCTAD secretariat calculations, based on IMF, Direction of Trade Statistics database; national sources; and UNCTAD Handbook of Statistics database.
These asymmetries are due largely to structural factors, but in many cases also to economic policies. In a customs union or a common market, the structure of the common external tariff and the local content requirements may suit some members more than others. Moreover, the members of a regional agreement frequently follow their own industrial policies, either in accord with their partners or unilaterally. These policies may be “defensive”, if aimed at protecting some economic activities or firms, or “offensive”, if their objective is to encourage exports and investment in specific sectors. In any case, there is a risk that the lack of coordination of industrial policies could lead to “beggar-thy-neighbour” behaviour, rendering economic convergence among the regional partners more difficult and eventually weakening the integration process. Differing financial and institutional capacities among the members of a regional bloc for encouraging production and exports could also accentuate existing asymmetries within the bloc. The EU dealt with this problem by harmonizing the different public support policies of its members, and by adding a Community dimension to structural policies. Its structural and cohesion funds help to support regional development projects in the less advanced – mostly outlying – regions within the EU and also imply a net financial transfer from members with higher per capita incomes to those with lower incomes.
26

TDR 2007, chapter IV
In regional cooperation initiatives among developing countries, addressing disequilibria and inequalities has received relatively little attention so far, but there are examples from Africa and Latin America of an awareness of the need to find a regional approach to these issues. SACU contains provisions to encourage the development of the less advanced members and the diversification of their economies. Since 1969, South Africa has made net financial transfers to the governments of the other four SACU member States through a common revenue fund, which pools all the tariff revenues of the five countries. Distinct from the practice in other customs unions, the distribution of customs duties among member countries is based on their respective shares in both extraregional and intraregional imports. South Africa has a much higher propensity for extraregional imports than the other SACU members, and a lower propensity for intraregional imports. Thus the smaller SACU members derive a greater proportion of benefits than their participation in the revenue pool. The rationale for this redistribution is to compensate the smaller economies for the asymmetries and price effects that could result from their membership in the customs union, and for the loss of some fiscal and policy autonomy (Hansohm and Adongo, 2006; Flatters and Stern, 2005; and Kalenga, 2005). The SACU agreement also contains provisions for the use of instruments in support of industrialization and diversification, taking into account the specific circumstances of the smaller and less advanced member States and their needs in terms of financial support and policy space for industrial support measures. For example, it allows the smaller SACU members to protect their nascent industries by imposing restrictions on certain imports, whether from South Africa or non-SACU countries.17 In 2002, public sector revenues from SACU import tariffs amounted to 4.5 per cent of GDP in Botswana, 7.8 per cent in Namibia, 12.9 per cent in Swaziland and 19.8 per cent in Lesotho, compared to only 1.2 per cent in South Africa (Flatters and Stern, 2005; Iyambo et al., 2002).The 2002 revision of the initial SACU agreement dating back to 1969 has rendered the revenue-sharing formula less favourable for the smaller member States, but it continues to have a strong redistributive effect that is fairly significant for them.
The question of economic asymmetries has also received greater attention in the two South American regional blocs, ANCOM and MERCOSUR. Although the role of the State in shaping regional integration was reduced in the 1990s, this did not preclude the continuation of national promotion policies, which tended to put producers in the smaller or less advanced countries with less powerful promotion instruments at a disadvantage. Due to the lack of coordination in this area, trade liberalization repeatedly led to conflicts and to defensive – and sometimes unilateral – measures. This was aggravated by macroeconomic shocks, in particular abrupt shifts in real exchange rates, which prompted the temporary reintroduction of internal tariffs and other barriers to trade. Thus a process of effective integration will benefit as much from regional measures to prevent monetary instability, which hinders the creation of economic linkages in the wider economic space, as from measures that prevent contradicting support policies by the member States (Porta, 2007).
In recent years, there have been some efforts at addressing the problem of asymmetries. For example, in 2004 ANCOM launched the Andean System of Credit Guarantee for small and medium-sized enterprises and a system for promoting intraregional exports; and in July 2005 MERCOSUR established a Structural Convergence Fund that supports investments in the member States aimed at helping to improve the distribution of costs and benefits in the enlarged market (box 4.1).18
Box 4.1
17 All SACU members are WTO members. In a 2003 report on SACU, the WTO secretariat expressed some concerns relating to the imposition of duties using a formula based on reference prices. It was believed that this may undermine SACU countries’ compliance with their tariff bindings and with their obligations under the Customs Valuation Agreement. Concerns were also expressed about differences in tariff bindings among SACU countries, and about the extensive use of anti-dumping and other contingency trade remedies by South Africa on behalf of the customs union (WTO, 2003: ix).18 With a view to reconciling national industrial policies, since 2006 Argentina and Brazil have agreed to a mechanism of competitive adaptation, under which the introduction of protective tariffs in bilateral trade are allowed for a maximum period of four years in case of a sudden surge of imports in one country that threatens a productive sector. During this period the government and the private sector in the protected country must restructure that sector.
27
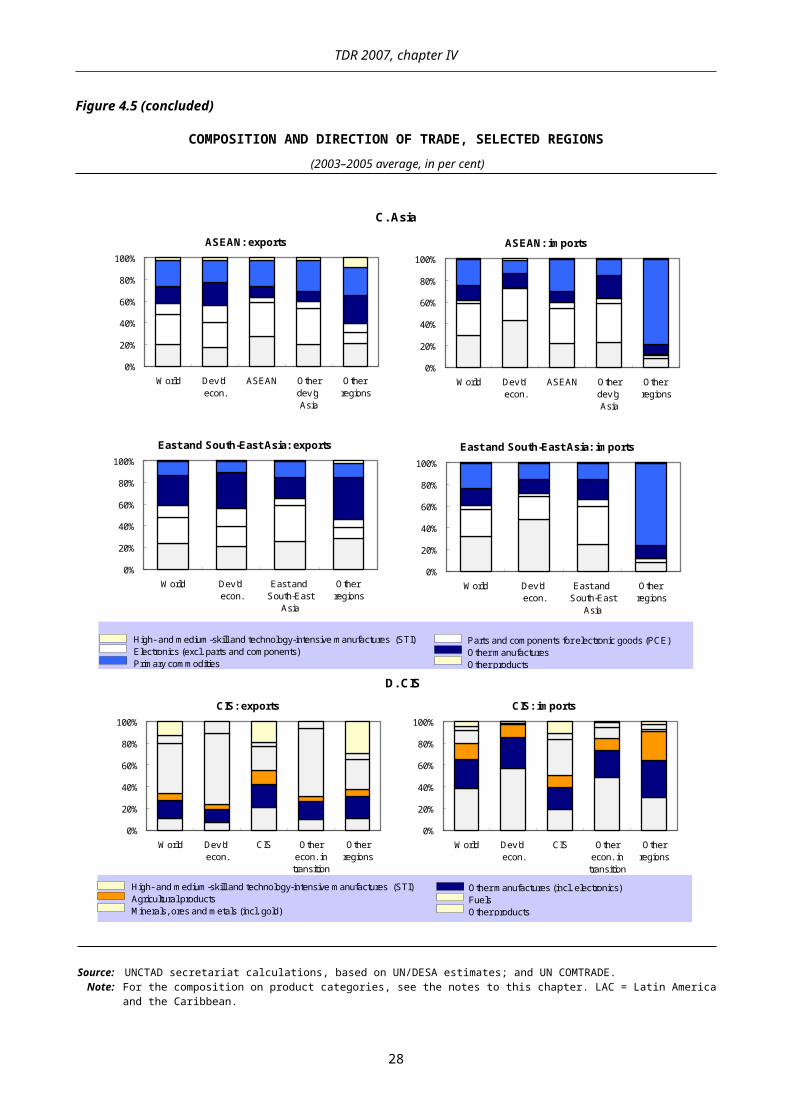
TDR 2007, chapter IV
THE MERCOSUR STRUCTURAL CONVERGENCE FUND (FOCEM)
The MERCOSUR Structural Convergence Fund (FOCEM) addresses the problem of economic asymmetries within the common market. It is an instrument for transferring funds from Argentina and Brazil to Paraguay and Uruguay. The members of MERCOSUR contribute to the Fund in the following proportions: Brazil 70 per cent, Argentina 27 per cent, Uruguay 2 per cent and Paraguay 1 per cent. Total annual committed contributions amount to $100 million between 2006 and 2015. The Fund co-finances the individual projects submitted by each member State, but the distribution of the total resources among the four countries is predetermined: Paraguay will receive 48 per cent of total grants, Uruguay 32 per cent, and Argentina and Brazil 10 per cent each. The first 11 projects that had been presented to FOCEM by January 2007 include projects in housing (Paraguay), road construction (Uruguay and Paraguay), and support for micro-firms (Paraguay). FOCEM also plans to finance a laboratory for biological security and food control (Paraguay), the development of software, biotechnology and electronics industries (Uruguay) and a programme to prevent foot-and-mouth disease (in the four MERCOSUR members plus Bolivia).
* * *
In sum, the growing volume of intraregional trade, and in particular, the greater importance of regional compared to global markets as outlets for manufactures produced in developing regions supports the strategy of linking industrialization and regionalism. In practically all regional blocs involving developing and transition economies, regionally produced manufactures, including the more skill- and technology-intensive product categories, find markets more easily in countries in the same region than in international markets further away. There is therefore considerable scope for developing and transition economies to benefit from advantages of geographical and cultural proximity when seeking to develop their industries and upgrade their production. Regional industrial cooperation does not preclude integration into the wider global economy, but it may serve as a vehicle to achieve global competitiveness. For it to be successful, members of the regional bloc need to cooperate in certain policy areas that may include agreeing to the full liberalization of intraregional trade, and, in customs unions, establishing a common external tariff. However a regional dynamic will rarely be triggered by trade liberalization alone. Like the catch-up process in a single country, a common effort to reduce the gap with more advanced economies, is more likely to succeed when measures related to trade and finance are complemented by other measures, as discussed elsewhere in this Report. For regional integration to be viable in the long run, some common regional policies and institutions may need to be developed to prevent greater income divergence among and within member States as a result of integration, which might trigger defensive measures on the part of the disadvantaged members and weaken the integration process.
An approach to regional cooperation that focuses on trade liberalization alone is unlikely to achieve the desired results.
An approach to regional cooperation, whether it is among developing countries or between developed and developing countries, that focuses on trade liberalization alone may be consistent with the view of regional agreements as building blocs for a system of global free trade and capital flows. However, if regional integration is understood as an element of a broader development strategy aimed at faster domestic capital accumulation and technological progress in the most promising industrial and service sectors according to the local circumstances, this approach is unlikely to achieve the desired results. It would imply that governments have to give up policy options that were decisive for industrial development in almost all
28

TDR 2007, chapter IV
of today’s developed and the more advanced developing countries, without gaining additional policy space through regional cooperation.
Regional integration should be an element of a broader development strategy aimed at faster domestic capital accumulation and technological progress.
An alternative approach would consider regional integration among developing countries as providing a space for a development strategy based on industrialization. This has greater chances to succeed than isolated national strategies, especially for countries with small domestic markets. It will require giving up some sovereignty in national policy-making, but at the same time members may find their policy space enlarged through cooperation at the regional level. A regional economic space must provide a durable framework for long-term decisions, in order for an enlarged market to provide incentives for investment and structural change. Allowing the relatively free movement of goods would not be enough to assure the sustainability of that framework. Proactive regional economic policies should also be developed that aim at fostering structural change, taking advantage of potential complementarities and specialization among the member countries and increasing the productive capacities of the less developed members.
Notes for figures 3.5, 4.5 and 4.6: The product categories are based on the Standard International Trade Classification (SITC), Rev. 3: High-skill and technology-intensive manufactures (SITC_5+792+87+88+891-525); Medium-skill and technology-intensive manufactures (SITC_62+893+71+72+73+74+771+773+774+778+781+782+783+784); Low-skill and technology-intensive manufactures (SITC_67+69+78-781-782-783-784+79-792); Labour- and resource-intensive manufactures (SITC_61+63+64+65+66+82+83+84+85); Electronics (excluding parts and components) (SITC_751+752+761+762+763+775); Parts and components for electrical and electronic goods (SITC_759+764+772+776); Manufactured goods (SITC_5+6+7+8-68); Agricultural products (SITC_0+1+2-27-28+4); Fuels (SITC_3); Minerals, ores and metals (SITC_27+28+68+97); Primary commodities (SITC_0+1+2+3+4+68+97).
References
ADB (2006). Asian Development Outlook 2006. Hong Kong, China, Asian Development Bank.AfDB (2004). Southern Africa. Regional Assistance Strategy Paper (2004–2008). African Development Bank Group,
August. Available at: www.afdb.org/pls/portal/docs/PAGE/ADB_ADMIN_PG/DOCUMENTS/OPERATIONSINFORMATION/SADC%20RASP%202004-2008.PDF.
Akyüz Y (1998). New Trends in Japanese Trade and FDI: Post-Industrial Transformation and Policy Challenges. In: Kozul-Wright R and Rowthorn R, eds. Transnational Corporations and the Global Economy. London, Macmillan.
Akyüz Y and Gore C (1994). The investment-profits nexus in East Asian industrialization. UNCTAD Discussion Paper no. 91. Geneva, UNCTAD.
Belkindas MV and Ivanova OV (1995). Foreign Trade Statistics in the USSR and Successor States. Washington, DC, World Bank.
Broadman HG (2005). From disintegration to reintegration: Eastern Europe and the former Soviet Union in international trade. Washington, DC, World Bank.
Déniz Espinós J (2006). La integración económica de América Latina y el Caribe. In: Alcántara M, Paramio L, Freidenberg F and Déniz J, eds. Reformas económicas y consolidación democrática (1980–2006). Madrid.
29
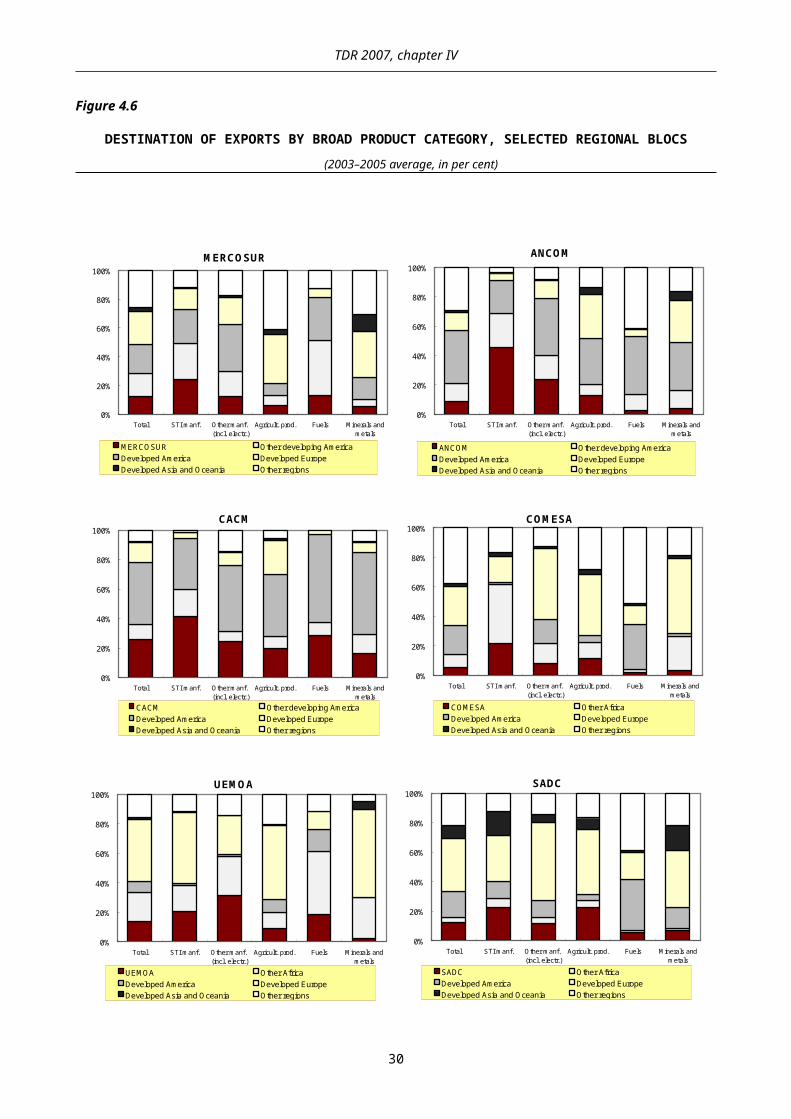
TDR 2007, chapter IV
Dunning J (1984). Changes in the level and structure of international production: The last 100 years. In: Cassan M, ed. The Growth of International Business. London, Allen and Unwin.
ECA (2004). Assessing regional integration in Africa. ECA Policy Research Report. Addis Ababa, Ethiopia.ECE (2003). Economic Survey of Europe 2003, No.1. United Nations publication, sales no. E.03.II.E.26, Geneva.ECE (2004). Regional trade Agreements in the ECE. Available at: ecetrade.typepad.com/rtas.ECE (2005). Economic Survey of Europe 2005, No. 2. United Nations publication, sales no. E.05.II.E.27, Geneva.ECLAC (1959). El mercado común latinoamericano, Santiago de Chile. Reproduced in Cincuenta años de pensamiento
de la CEPAL, selected writings, Vol. 1, Santiago de Chile Fondo de Cultura Económica-CEPAL, 1998.ECLAC (2005). Cuadernos estadísticos de la CEPAL No. 32, December.Elborgh-Woytek K (2003). Of openness and distance: trade developments in the Commonwealth of Independent States,
1993–2002. IMF Working Paper 207, Washington, DC, International Monetary Fund, March.Fasano U and Iqbal Z (2003). GCC Countries: From Oil Dependence to Diversification. Washington, DC, International
Monetary Fund, September.Flatters F and Stern M (2005). Implementing the SACU Revenue-Sharing Formula: Customs revenues. Paper prepared
for the South Africa National Treasury, 8 April.Freinkman L, Polyakov E and Revenco C (2004). Trade performance and regional integration of the CIS countries,
Working Paper No. 38, Washington, DC, World Bank.Gaomab M and Hartmann P (2006). The economics of the 2002 SACU Agreement. Journal of Law and Economics in
International Trade, 2 (2): 51–86, July.Gorg H and Greenaway D (2001). Foreign direct investment and intra-industry spillovers. Paper prepared for the
UNECE/EBRD Expert Meeting “Financing for Development”, Geneva, 3 December.Hansohm D and Adongo J (2006). Dealing with inequality in SACU. Journal of Law and Economics in International
Trade, 2 (2): 3–26, July.Iyambo AP et al. (2002). Assessing the impact of the EU-South Africa Agreement on Trade, Development and
Cooperation (ATDC) on Namibia’s public revenue. BoN Working Paper No. 3, Bank of Namibia, Windhoek, December.
Kalenga P (2005). Overview of Namibia’s participation in regional economic integration. In: Research Department of Bank of Namibia, ed. The Benefits of Regional Integration for Smaller Countries. Annual Symposium 2005 . Bank of Namibia, Windhoek.
Metzger M (2006). The Common Monetary Area in Southern Africa: a typical South-South coordination project? In: Fritz B and Metzger M, eds. New Issues in Regional Monetary Coordination: Understanding North-South and South-South Arrangements. Houndsmill, Palgrave Macmillan.
Mortimore M (1998). Mexico’s TNC-centric industrialization process. In: Kozul-Wright R and Rowthorn R, eds. Transnational Corporations and the Global Economy. London, Macmillan.
Porta F (2007). La integración sudamericana en perspectiva. Problemas y dilemas. Background Paper for TDR 2007. Mimeo.
Rodriguez-Clare A (1996). Multinationals, linkages and economic development, American Economic Review 86: (4) 852–873.
Rosenthal S and Strange WC (2004). Evidence on the Nature and Source of Agglomeration Economies. The Handbook of Urban and Regional Economics, Vol. 4. Amsterdam, Elsevier.
Rowthorn R and Wells J (1986). Deindustrialisation and Foreign Trade. Cambridge, Cambridge University Press.Sakakibara E and Yamakawa S (2003). Regional Integration in East Asia: Challenges and Opportunities - Part I:
History and Institutions. World Bank Policy Research Working Paper 3078, June. Available at: SSRN: http://ssrn.com/abstract=636440.
Shams R (2003). Regional integration in developing countries: some lessons based on case studies. Discussion Paper No. 251, Hamburg Institute of International Economics.
Sodersten B (1970). International Economics. London, Macmillan. South Centre (2007). The ASEAN Experience: Insights for Regional Political Cooperation. Geneva, Switzerland.Tsangarides CG, Ewenczyk P and Hulej M (2006). Stylized facts on bilateral trade and currency unions:
Implications for Africa. IMF Working Paper, WP/06/31. Washington, DC, International Monetary Fund, January.UNCTAD (1994). Repertorio de regímenes de importación. UNCTAD/DMS/2/Rev.1(Part1).UNCTAD (1998). The integration of selected economies in transition into the international trading system, and its
implications for their trade with developing countries. Report by the UNCTAD secretariat, UNCTAD/ITCD/TSB/3/Add.1, Geneva.
UNCTAD (2007a). Market access, market entry and competitiveness. TD/B/COM.1/83, Geneva, February.UNCTAD (2007b). World Investment Report. United Nations publication, sales no. E.07.II.D.9, New York and Geneva. UNCTAD (2007c). Report of the Secretary-General of UNCTAD to UNCTAD XII. Globalization for development:
Opportunities and challenges. United Nations, TD/413, Geneva, 4 July.UNCTAD (various issues). Trade and Development Report. United Nations publication, New York and Geneva.
30

TDR 2007, chapter IV
Visser M and Hartzenberg T (2004). Trade liberalization and regional integration in SADC: Policy synergies assessed in an industrial organization framework. Working Paper 3, Trade Law Centre for Southern Africa (TRALAC), Stellenbosch. Available at: www.tralac.org/scripts/content.php?id=2832.
WTO (2003). Trade Policy Review. Southern African Customs Union. Report by the Secretariat. WT/TPR/S/114, Geneva, World Trade Organization, 24 March.
31