the$sun$never$setsin$the$south$! · pdf filemalayalam$ general entertainment$ movies$ news$...
TRANSCRIPT

1
The Sun never sets in the South !
FEBRUARY 16, 2016
2 2
Some of the statements made in this presentation are forward-looking statements and are based on the current beliefs, assumptions, expectations, estimates, objectives and projections of the Directors and Management of Sun TV Network Ltd. (STNL) about its business and the industry and markets in which it operates. These forward-looking statements include, without limitation, statements relating to revenues and earnings. The words “believe”, “anticipate”, “expect”, “intend”, “estimate”, “project” and similar expressions are also intended to identify forward-looking statements. These statements are not guarantees of future performance and are subject to risks, uncertainties and other factors, some of which are beyond the control of STNL and are difficult to predict. Consequently, actual results could differ materially from those expressed or forecast in the forward-looking statements as a result of, among other factors, changes in economic and market conditions, changes in the regulatory environment and other business and operational risk. STNL does not undertake to update these forward-looking statements to reflect events or circumstances that may arise after publication.

3 3
¡ Television Broadcasting
¡ FM Radio Broadcasting
¡ Movie Distribution/Production
¡ SunRisers – Hyderabad – IPL Franchise

4 4
18 FM Radio licenses
Focused on southern cities
Strategic alliance with RED FM (Radio) 48.9 % beneHicial interest
3 FM Radio stations in Mumbai, Delhi and
Kolkata
Sun TV Network Ltd (Broadcasting , Production, Entertainment)
23 FM Radio licenses
Focused on Northern, Eastern & Western parts of the country
97.78 % subsidiary
59.44 % subsidiary
Kal Radio Ltd (Radio) South Asia FM Ltd (Radio)
Sun Pictures (Movie
Distribution /Production)
Divisions of STNL
SunRisers Hyderabad
(IPL Franchise)
5 5
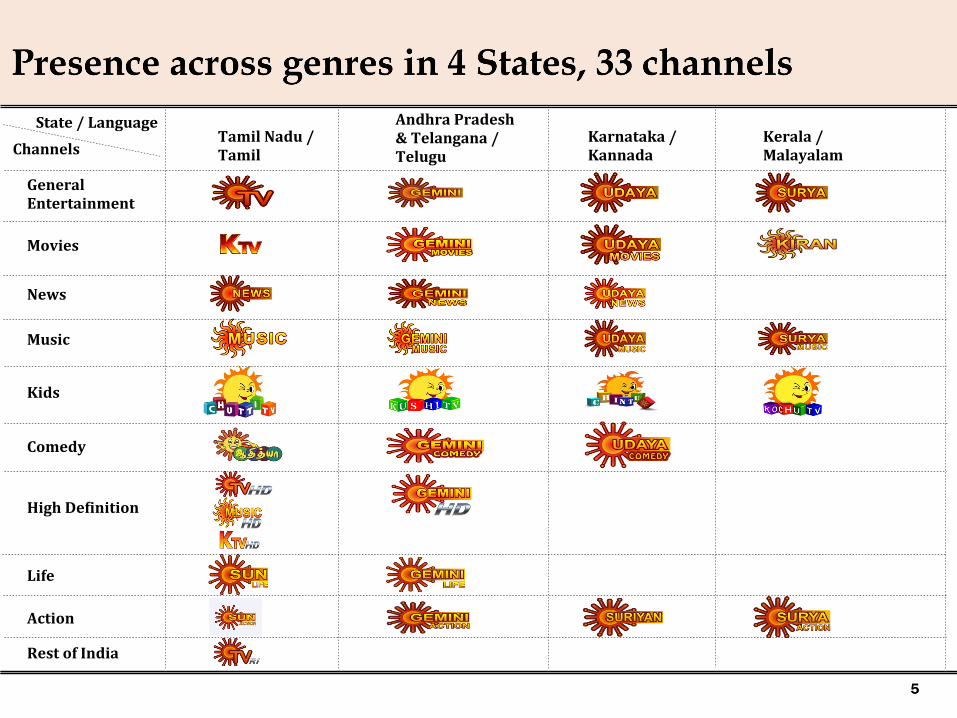
Tamil Nadu / Tamil
Andhra Pradesh & Telangana / Telugu
Karnataka / Kannada
Kerala / Malayalam
General Entertainment
Movies
News
Music
Kids
Comedy
High DeJinition
Life
Action
Rest of India
Channels State / Language

6

7 7
¡ India the top investment destination in H1 2015, beating China
¡ This is despite sharp decline in FDI into emerging markets
¡ FDI inHlow has more than doubled over H1 2014 i.e. a growing trend
Source: ft.com
0
5
10
15
20
25
30
35
H1 2014 H1 2015
FDI into India (Bn USD)
8 8
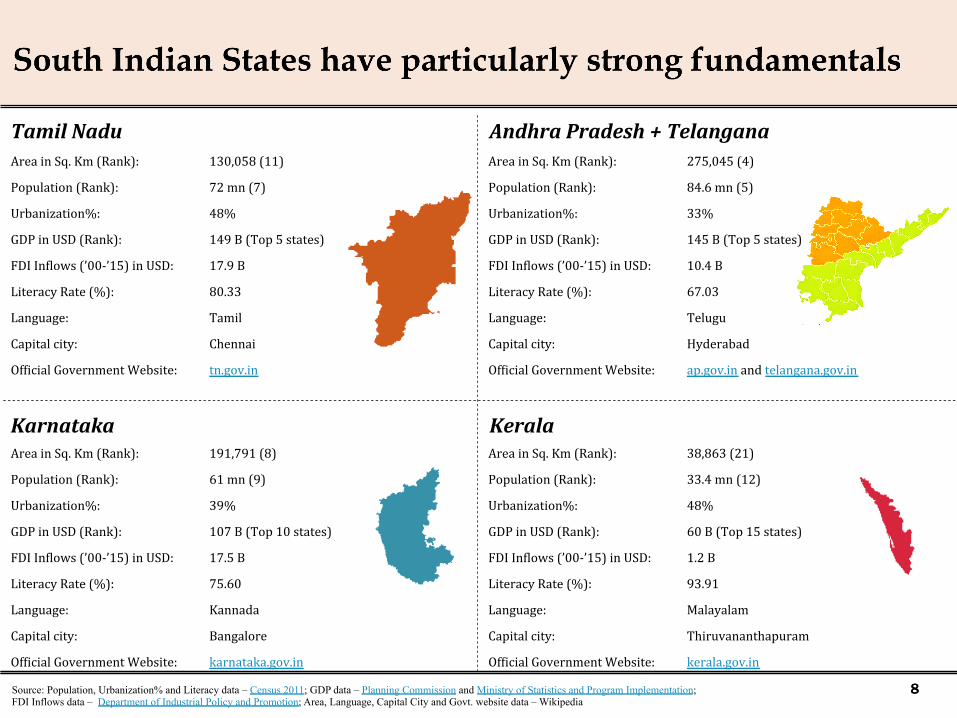
Tamil Nadu Area in Sq. Km (Rank):
Population (Rank):
Literacy Rate (%):
Urbanization%:
Language:
Capital city:
GDP in USD (Rank):
OfHicial Government Website:
130,058 (11)
72 mn (7)
80.33
48%
Tamil
Chennai
149 B (Top 5 states)
tn.gov.in
FDI InHlows (’00-‐’15) in USD: 17.9 B
Karnataka Area in Sq. Km (Rank):
Population (Rank):
Literacy Rate (%):
Urbanization%:
Language:
Capital city:
GDP in USD (Rank):
OfHicial Government Website:
191,791 (8)
61 mn (9)
75.60
39%
Kannada
Bangalore
107 B (Top 10 states)
karnataka.gov.in
FDI InHlows (’00-‐’15) in USD: 17.5 B
Andhra Pradesh + Telangana Area in Sq. Km (Rank):
Population (Rank):
Literacy Rate (%):
Urbanization%:
Language:
Capital city:
GDP in USD (Rank):
OfHicial Government Website:
275,045 (4)
84.6 mn (5)
67.03
33%
Telugu
Hyderabad
145 B (Top 5 states)
ap.gov.in and telangana.gov.in
FDI InHlows (’00-‐’15) in USD: 10.4 B
Kerala Area in Sq. Km (Rank):
Population (Rank):
Literacy Rate (%):
Urbanization%:
Language:
Capital city:
GDP in USD (Rank):
OfHicial Government Website:
38,863 (21)
33.4 mn (12)
93.91
48%
Malayalam
Thiruvananthapuram
60 B (Top 15 states)
kerala.gov.in
FDI InHlows (’00-‐’15) in USD: 1.2 B
Source: Population, Urbanization% and Literacy data – Census 2011; GDP data – Planning Commission and Ministry of Statistics and Program Implementation; FDI Inflows data – Department of Industrial Policy and Promotion; Area, Language, Capital City and Govt. website data – Wikipedia
9
10 10
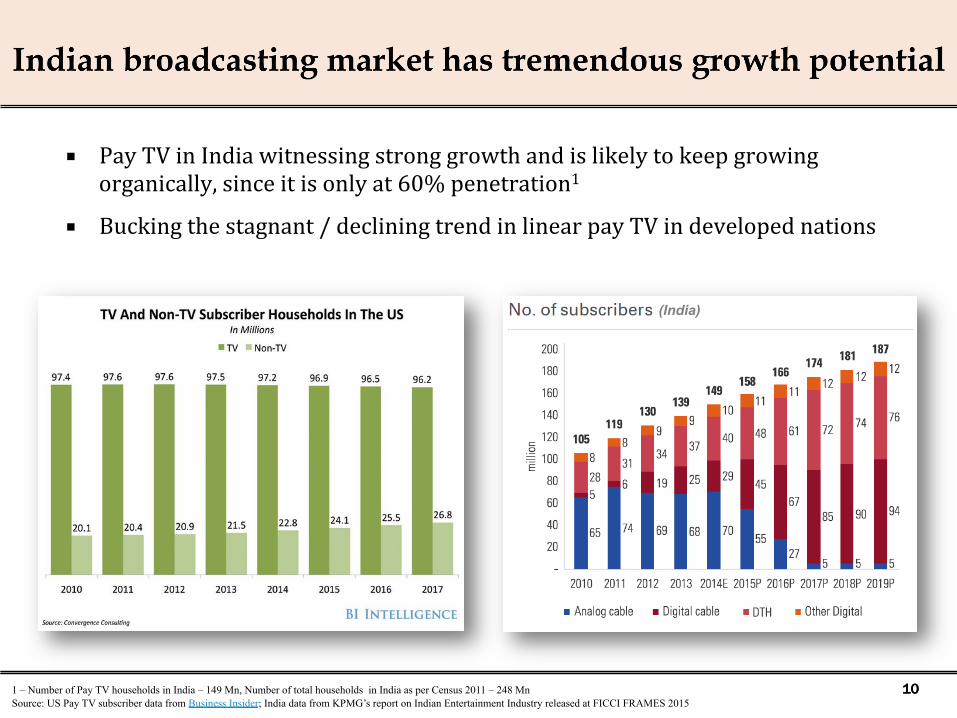
¡ Pay TV in India witnessing strong growth and is likely to keep growing organically, since it is only at 60% penetration1
¡ Bucking the stagnant / declining trend in linear pay TV in developed nations
1 – Number of Pay TV households in India – 149 Mn, Number of total households in India as per Census 2011 – 248 Mn
Source: US Pay TV subscriber data from Business Insider; India data from KPMG’s report on Indian Entertainment Industry released at FICCI FRAMES 2015
(India)
11 11
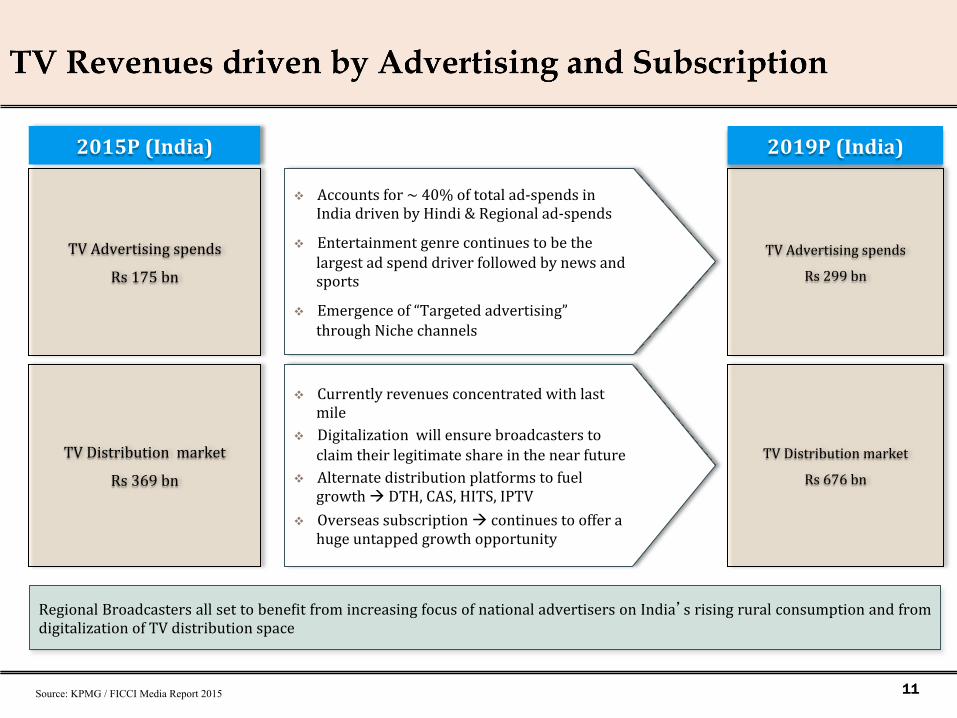
2015P (India) 2019P (India)
TV Advertising spends
Rs 175 bn
TV Advertising spends
Rs 299 bn
TV Distribution market
Rs 369 bn
TV Distribution market
Rs 676 bn
v Accounts for ~ 40% of total ad-‐spends in India driven by Hindi & Regional ad-‐spends
v Entertainment genre continues to be the largest ad spend driver followed by news and sports
v Emergence of “Targeted advertising” through Niche channels
v Currently revenues concentrated with last mile
v Digitalization will ensure broadcasters to claim their legitimate share in the near future
v Alternate distribution platforms to fuel growth à DTH, CAS, HITS, IPTV
v Overseas subscription à continues to offer a huge untapped growth opportunity
Regional Broadcasters all set to beneHit from increasing focus of national advertisers on India’s rising rural consumption and from digitalization of TV distribution space
Source: KPMG / FICCI Media Report 2015
12 12
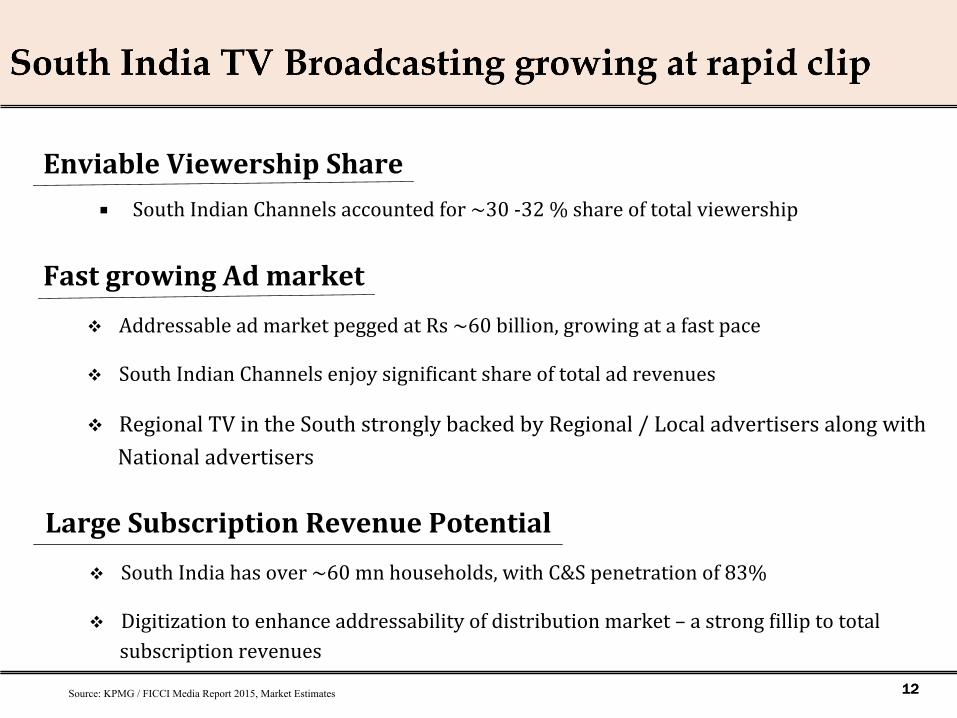
¡ South Indian Channels accounted for ~30 -‐32 % share of total viewership
Source: KPMG / FICCI Media Report 2015, Market Estimates
Enviable Viewership Share
v Addressable ad market pegged at Rs ~60 billion, growing at a fast pace
v South Indian Channels enjoy signiHicant share of total ad revenues
v Regional TV in the South strongly backed by Regional / Local advertisers along with National advertisers
Fast growing Ad market
v South India has over ~60 mn households, with C&S penetration of 83%
v Digitization to enhance addressability of distribution market – a strong Hillip to total subscription revenues
Large Subscription Revenue Potential
13 13
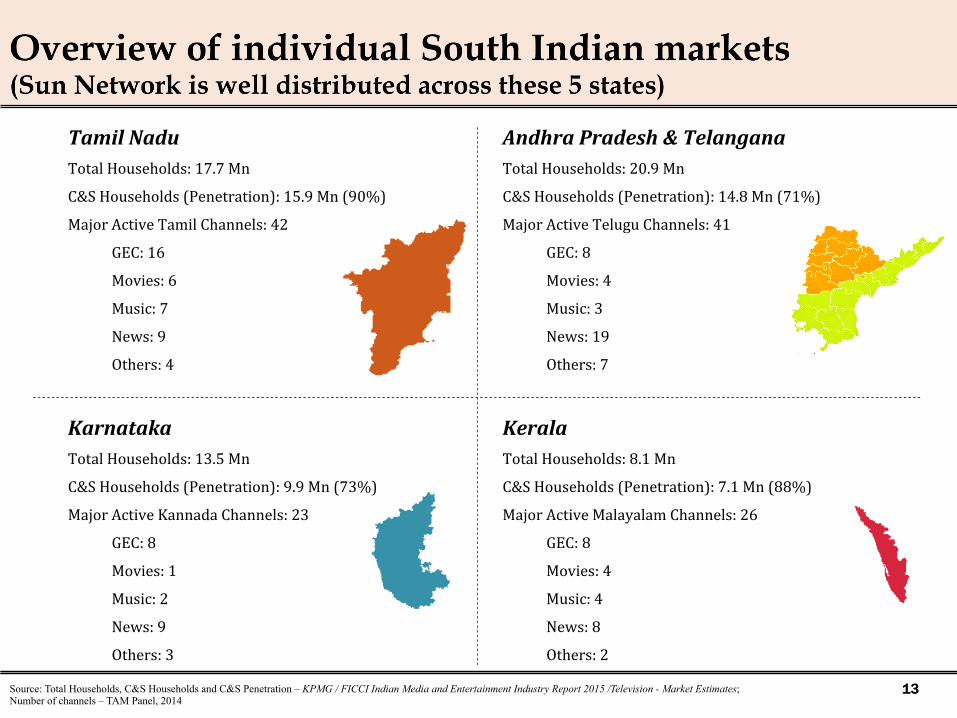
Tamil Nadu Total Households: 17.7 Mn
C&S Households (Penetration): 15.9 Mn (90%)
Major Active Tamil Channels: 42
GEC: 16
Movies: 6
Music: 7
News: 9
Others: 4
Karnataka Total Households: 13.5 Mn
C&S Households (Penetration): 9.9 Mn (73%)
Major Active Kannada Channels: 23
GEC: 8
Movies: 1
Music: 2
News: 9
Others: 3
Andhra Pradesh & Telangana Total Households: 20.9 Mn
C&S Households (Penetration): 14.8 Mn (71%)
Major Active Telugu Channels: 41
GEC: 8
Movies: 4
Music: 3
News: 19
Others: 7
Kerala Total Households: 8.1 Mn
C&S Households (Penetration): 7.1 Mn (88%)
Major Active Malayalam Channels: 26
GEC: 8
Movies: 4
Music: 4
News: 8
Others: 2
Source: Total Households, C&S Households and C&S Penetration – KPMG / FICCI Indian Media and Entertainment Industry Report 2015 /Television - Market Estimates; Number of channels – TAM Panel, 2014

14
15 15
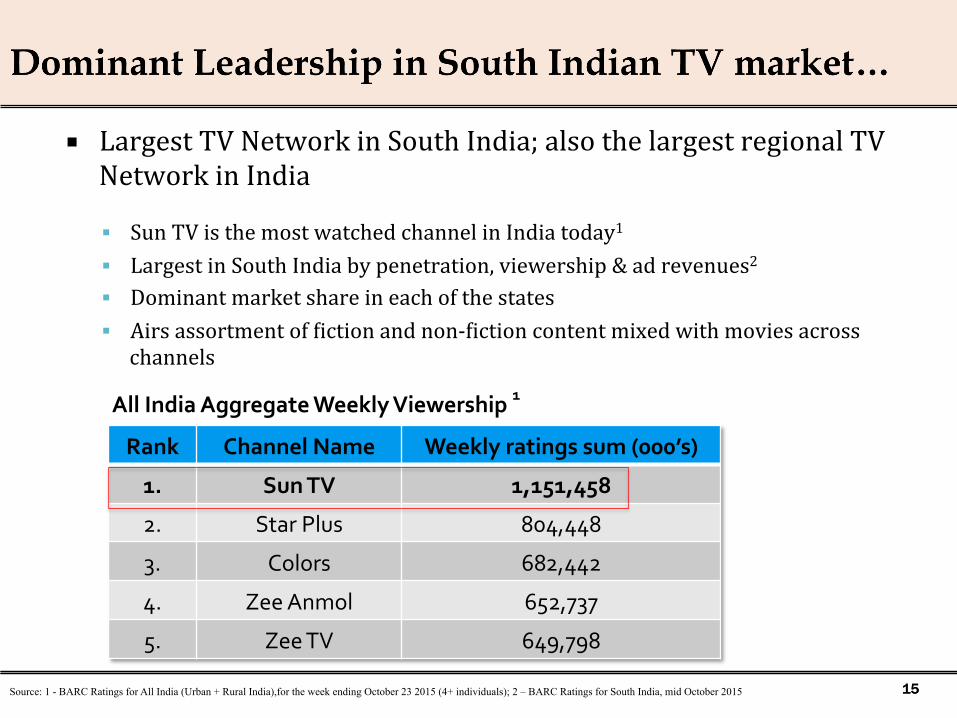
¡ Largest TV Network in South India; also the largest regional TV Network in India
§ Sun TV is the most watched channel in India today1
§ Largest in South India by penetration, viewership & ad revenues2
§ Dominant market share in each of the states § Airs assortment of Hiction and non-‐Hiction content mixed with movies across channels
Source: 1 - BARC Ratings for All India (Urban + Rural India),for the week ending October 23 2015 (4+ individuals); 2 – BARC Ratings for South India, mid October 2015
Rank Channel Name Weekly ratings sum (000’s) 1. Sun TV 1,151,458
2. Star Plus 804,448
3. Colors 682,442
4. Zee Anmol 652,737
5. Zee TV 649,798
All India Aggregate Weekly Viewership 1

16 16
¡ Committed to staying ahead of the curve
§ Innovation and leadership ▪ One of the Hirst Regional GE channels in country to adopt HD ▪ Forged early partnerships with OEMs to pre-‐load Sun TV app on their devices
§ Segmenting the addressable market, ahead of digitization ▪ Established presence across key Pay TV genres that are likely to grow – Eg: Kids, Comedy, Action
§ Investments in state of the art technology
¡ Strategic and Long-‐term Content Partnerships § Exclusive contracts with leading content producers; an ecosystem that is Hiercely loyal § A formidable movie library with perpetual and exclusive rights
¡ Prudent Business Practices § Tight control on content costs; extremely conservative on leverage § Unique business model that mitigates risks

17 17
¡ Advertising Revenue
§ TV remains the medium of choice for large advertisers in India
§ Increasing trends of higher ad spends in the South, driven by high per-‐capita income in South India
§ Leading to consistent year-‐on-‐year growth for Sun TV’s Ad Revenue over last Hive Hiscals
Language Ad market size (Rs bn)
Tamil 30.0
Telugu 20.0
Kannada 6.0
Malayalam 4.0
Total 60.0
7.9
9.7 9.5 10.5
10.7 11.4
0.0
2.0
4.0
6.0
8.0
10.0
12.0
FY10 FY11 FY12 FY13 FY14 FY15
Sun TV Ad Revenues
CAGR ~ 7.61%
(Rs bn)
Source: KPMG / FICCI Indian Media and Entertainment Industry Report 2015 /Television / Market Estimates

18 18
Over 60% share of Subscription revenue from South India accrues to Sun TV Network
v DTH penetration is increasing at rapid pace
v Revenue opportunities from the South Indian diaspora in overseas markets being further tapped
Language Households (mn)
Television households
(mn)
C&S households
(mn)
Tamil 17.7 16.4 15.9
Telugu 20.9 15.1 14.8
Kannada 13.5 10.0 9.9
Malayalam 8.1 7.6 7.1
Total 60.2 49.1 47.7
Sun TV Subscription Revenue
Source: KPMG / FICCI Indian Media and Entertainment Industry Report 2015 /Television - Market Estimates
0.0
1.0
2.0
3.0
4.0
5.0
6.0
7.0
8.0
9.0
FY10 FY11 FY12 FY13 FY14 FY15
0.6 0.7 0.8 1.0 1.2 1.4 1.6
2.1 1.6 1.4 2.0 2.1
1.8
2.9 3.3 3.7
4.5 5.3
DTH Revenue Pay Channel Revenue Overseas Income
(Rs Bn)
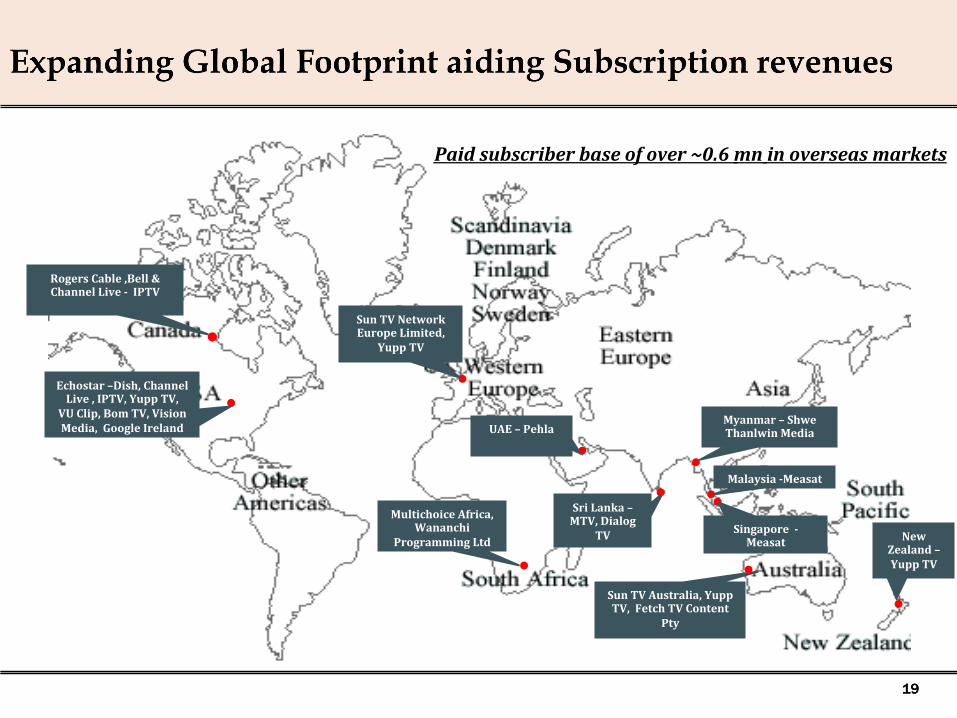
19 19
Echostar –Dish, Channel Live , IPTV, Yupp TV,
VU Clip, Bom TV, Vision Media, Google Ireland UAE – Pehla
Multichoice Africa, Wananchi
Programming Ltd
Malaysia -‐Measat
Singapore -‐Measat
Sun TV Network Europe Limited,
Yupp TV
Rogers Cable ,Bell & Channel Live -‐ IPTV
Sri Lanka – MTV, Dialog
TV
Sun TV Australia, Yupp TV, Fetch TV Content
Pty
Paid subscriber base of over ~0.6 mn in overseas markets
Myanmar – Shwe Thanlwin Media
New Zealand – Yupp TV

20

21 21
¡ In mature South Indian Markets, twin opportunities: Digitization + Growth in Pay TV ARPUs § Digitization will grow the addressable TV audience, improving subscription revenue realization
§ India’s Pay TV ARPU among lowest in the world; Increase in ARPUs will further reduce dependence on advertising, ensuring growth even in times of wider economic stagnation
India’s pay TV ARPU less than most countries’
0
20
40
60
80
India China Malaysia Thailand Brazil UK USA
3 7 16 20
56 71 80
Pay TV ARPU (USD)
Source: PWC-CII Media Industry report
Digital penetration of Pay TV subscribers
0
20
40
60
80
100
Hong Kong
Malaysia Singapore Indonesia Japan Sri Lanka Thailand India
100 100 100 99 90
77
57
28
%
Source: Credit Suisse report titled, India Media Sector, dated April 16, 2013
% Subscribers
22 22
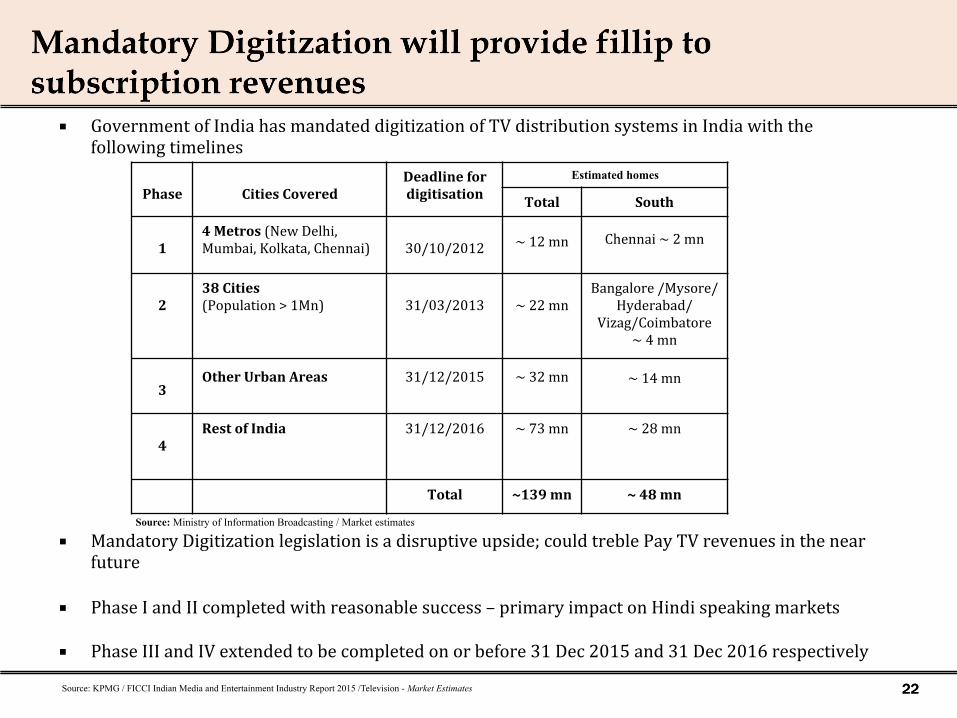
¡ Government of India has mandated digitization of TV distribution systems in India with the following timelines
¡ Mandatory Digitization legislation is a disruptive upside; could treble Pay TV revenues in the near future
¡ Phase I and II completed with reasonable success – primary impact on Hindi speaking markets
¡ Phase III and IV extended to be completed on or before 31 Dec 2015 and 31 Dec 2016 respectively
Source: KPMG / FICCI Indian Media and Entertainment Industry Report 2015 /Television - Market Estimates
Phase
Cities Covered
Deadline for digitisation
Estimated homes
Total South
1
4 Metros (New Delhi, Mumbai, Kolkata, Chennai)
30/10/2012
~ 12 mn
Chennai ~ 2 mn
2
38 Cities (Population > 1Mn)
31/03/2013
~ 22 mn
Bangalore /Mysore/Hyderabad/
Vizag/Coimbatore ~ 4 mn
3
Other Urban Areas
31/12/2015
~ 32 mn
~ 14 mn
4
Rest of India 31/12/2016
~ 73 mn ~ 28 mn
Total ~139 mn ~ 48 mn
Source: Ministry of Information Broadcasting / Market estimates

23
24 24
¡ Two subsidiaries § Kal Radio Limited and South Asia FM Limited
¡ 46 stations operational § 7 stations under Brand Suryan FM in Tamil Nadu § 39 stations under Brand Red FM in the Rest of India
¡ Strong Revenues from the Metro stations § Metro stations account for 50% of total Radio Revenues
¡ Well poised in mini metros § Future growth to be driven by mini metros
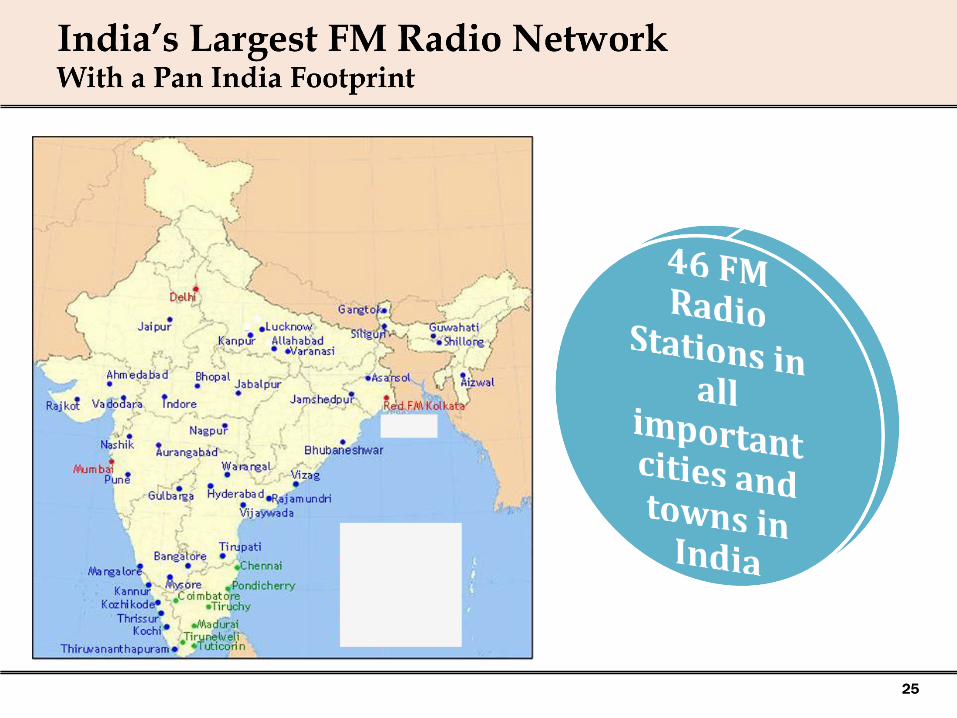
25 25
26 26
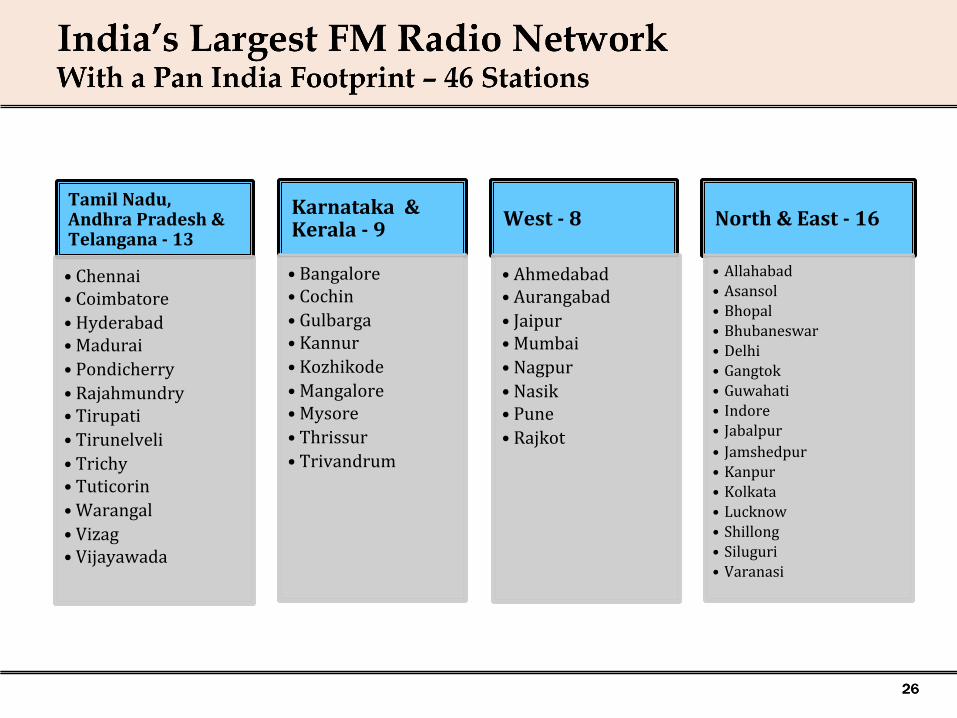
Tamil Nadu, Andhra Pradesh & Telangana -‐ 13
• Chennai • Coimbatore • Hyderabad • Madurai • Pondicherry • Rajahmundry • Tirupati • Tirunelveli • Trichy • Tuticorin • Warangal • Vizag • Vijayawada
Karnataka & Kerala -‐ 9
• Bangalore • Cochin • Gulbarga • Kannur • Kozhikode • Mangalore • Mysore • Thrissur • Trivandrum
West -‐ 8
• Ahmedabad • Aurangabad • Jaipur • Mumbai • Nagpur • Nasik • Pune • Rajkot
North & East -‐ 16
• Allahabad • Asansol • Bhopal • Bhubaneswar • Delhi • Gangtok • Guwahati • Indore • Jabalpur • Jamshedpur • Kanpur • Kolkata • Lucknow • Shillong • Siluguri • Varanasi
27 27
¡ Increasing share of Radio in total ad pie § Current share of Radio in total ad pie at ~ 4.5% compared to global average of ~8%
¡ Cost effective medium § SMEs and local advertisers to drive growth
¡ Share of regional advertisers to increase § Share to increase from current ~ 40% to global average of ~ 60%
¡ Phase III to facilitate penetration into tier II & tier III cities § Increased national reach
¡ Positive regulatory reforms to further accelerate growth § Content restrictions to be liberalized § Ownership of multiple licenses in same city § Infrastructure sharing between stations

28 28
¡ TV Broadcasting § India’s No 1 TV Broadcaster
¡ F M Radio Broadcasting § India’s largest private FM player
¡ Movie Distribution / Production § One of India’s largest Corporate Movie Distribution / Production houses
¡ SunRisers – Hyderabad – IPL Franchise § An opportunity to blend the India’s most loved and watched Game of “Cricket” with Media & Entertainment

29
30 30
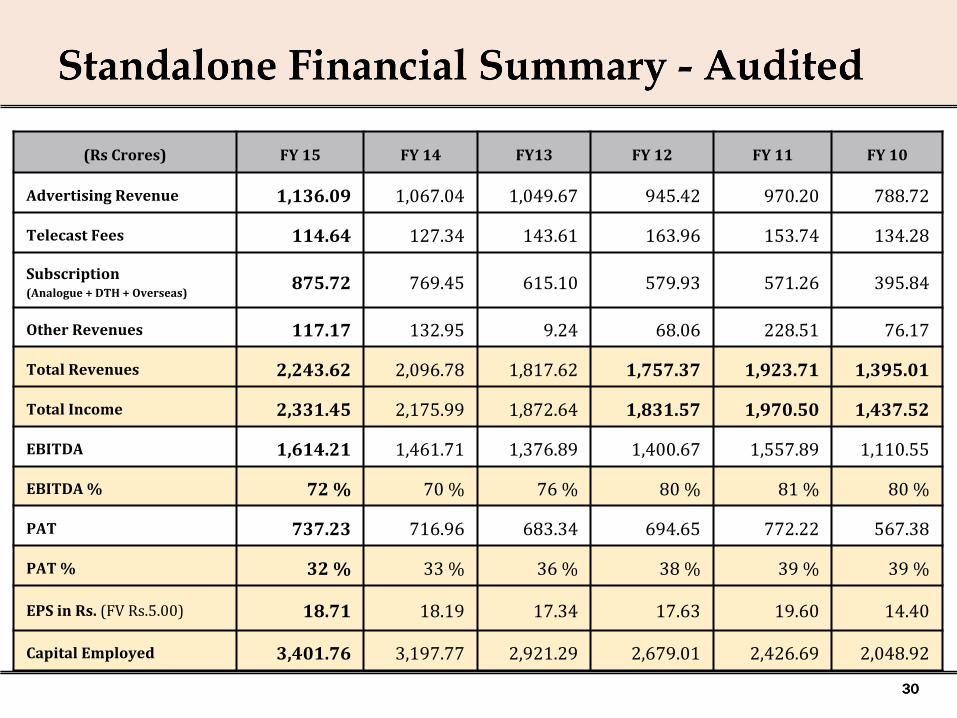
(Rs Crores) FY 15 FY 14 FY13 FY 12 FY 11 FY 10
Advertising Revenue 1,136.09 1,067.04 1,049.67 945.42 970.20 788.72
Telecast Fees 114.64 127.34 143.61 163.96 153.74 134.28
Subscription (Analogue + DTH + Overseas) 875.72 769.45 615.10 579.93 571.26 395.84
Other Revenues 117.17 132.95 9.24 68.06 228.51 76.17
Total Revenues 2,243.62 2,096.78 1,817.62 1,757.37 1,923.71 1,395.01
Total Income 2,331.45 2,175.99 1,872.64 1,831.57 1,970.50 1,437.52
EBITDA 1,614.21 1,461.71 1,376.89 1,400.67 1,557.89 1,110.55
EBITDA % 72 % 70 % 76 % 80 % 81 % 80 %
PAT 737.23 716.96 683.34 694.65 772.22 567.38
PAT % 32 % 33 % 36 % 38 % 39 % 39 %
EPS in Rs. (FV Rs.5.00) 18.71 18.19 17.34 17.63 19.60 14.40
Capital Employed 3,401.76 3,197.77 2,921.29 2,679.01 2,426.69 2,048.92
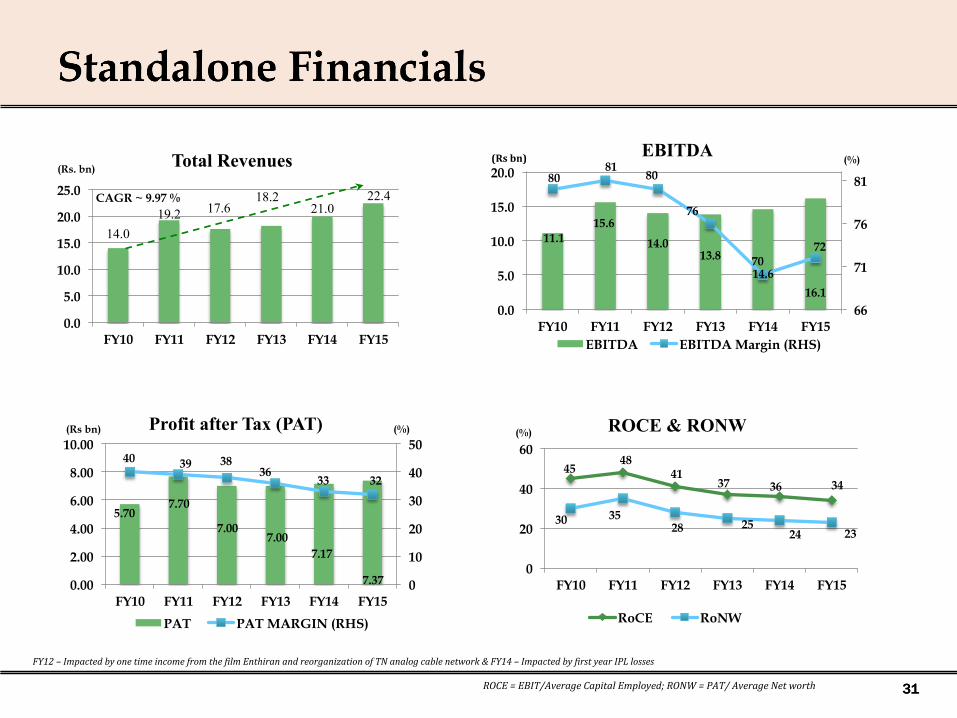
31 31 ROCE = EBIT/Average Capital Employed; RONW = PAT/ Average Net worth
14.0 19.2 17.6
18.2 21.0
22.4
0.0
5.0
10.0
15.0
20.0
25.0
FY10 FY11 FY12 FY13 FY14 FY15
Total Revenues (Rs. bn)
CAGR ~ 9.97 %
11.1 15.6
14.0 13.8
14.6
16.1
80 81
80
76
70 72
66
71
76
81
0.0
5.0
10.0
15.0
20.0
FY10 FY11 FY12 FY13 FY14 FY15
EBITDA
EBITDA EBITDA Margin (RHS)
(%) (Rs bn)
5.70 7.70
7.00 7.00
7.17
7.37
40 39 38 36
33 32
0
10
20
30
40
50
0.00
2.00
4.00
6.00
8.00
10.00
FY10 FY11 FY12 FY13 FY14 FY15
Profit after Tax (PAT)
PAT PAT MARGIN (RHS)
(Rs bn) (%)
45 48
41 37 36 34
30 35 28 25
24 23
0
20
40
60
FY10 FY11 FY12 FY13 FY14 FY15
ROCE & RONW
RoCE RoNW
(%)
FY12 – Impacted by one time income from the Pilm Enthiran and reorganization of TN analog cable network & FY14 – Impacted by Pirst year IPL losses
32 32
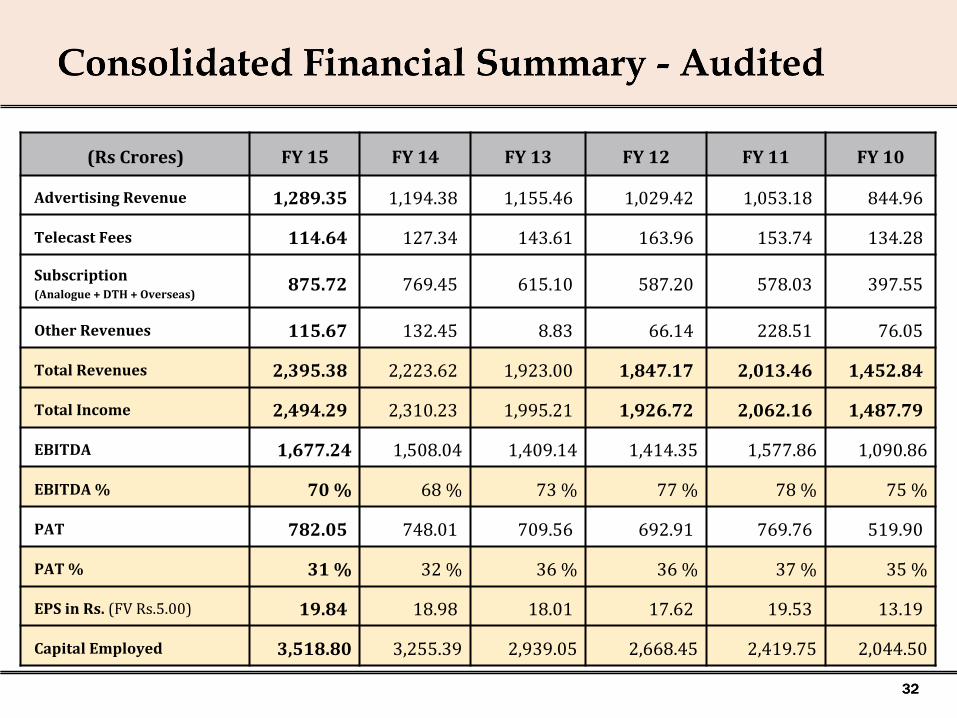
(Rs Crores) FY 15 FY 14 FY 13 FY 12 FY 11 FY 10
Advertising Revenue 1,289.35 1,194.38 1,155.46 1,029.42 1,053.18 844.96
Telecast Fees 114.64 127.34 143.61 163.96 153.74 134.28
Subscription (Analogue + DTH + Overseas) 875.72 769.45 615.10 587.20 578.03 397.55
Other Revenues 115.67 132.45 8.83 66.14 228.51 76.05
Total Revenues 2,395.38 2,223.62 1,923.00 1,847.17 2,013.46 1,452.84
Total Income 2,494.29 2,310.23 1,995.21 1,926.72 2,062.16 1,487.79
EBITDA 1,677.24 1,508.04 1,409.14 1,414.35 1,577.86 1,090.86
EBITDA % 70 % 68 % 73 % 77 % 78 % 75 %
PAT 782.05 748.01 709.56 692.91 769.76 519.90
PAT % 31 % 32 % 36 % 36 % 37 % 35 %
EPS in Rs. (FV Rs.5.00) 19.84 18.98 18.01 17.62 19.53 13.19
Capital Employed 3,518.80 3,255.39 2,939.05 2,668.45 2,419.75 2,044.50
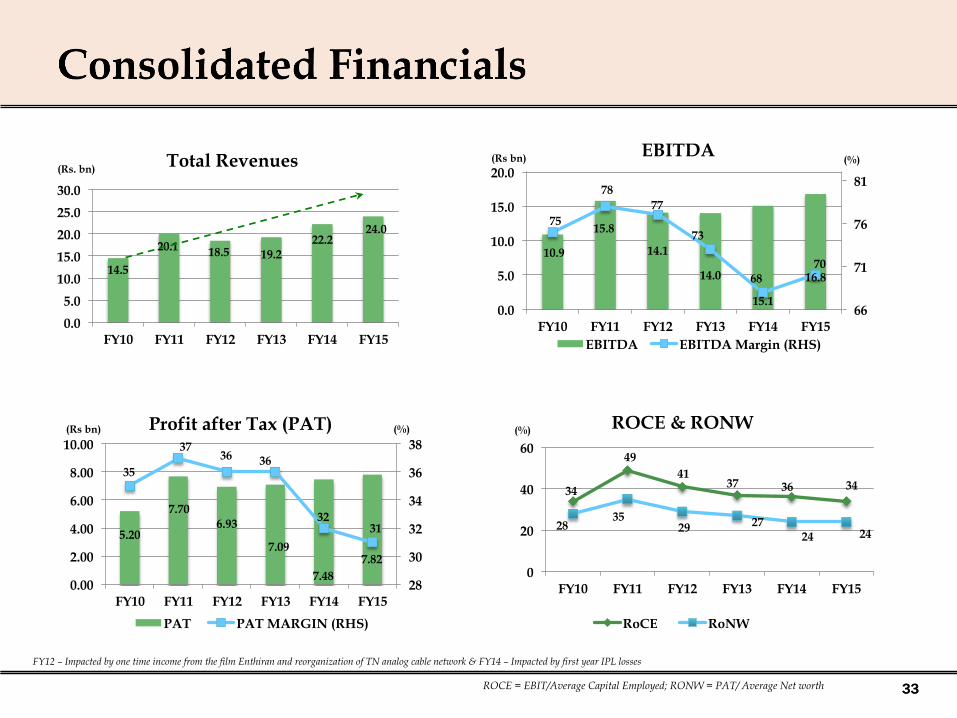
33 33 ROCE = EBIT/Average Capital Employed; RONW = PAT/ Average Net worth
14.5
20.1 18.5 19.2 22.2
24.0
0.0
5.0
10.0
15.0
20.0
25.0
30.0
FY10 FY11 FY12 FY13 FY14 FY15
Total Revenues (Rs. bn)
10.9
15.8
14.1
14.0
15.1
16.8
75
78 77
73
68 70
66
71
76
81
0.0
5.0
10.0
15.0
20.0
FY10 FY11 FY12 FY13 FY14 FY15
EBITDA
EBITDA EBITDA Margin (RHS)
(%) (Rs bn)
5.20
7.70 6.93
7.09
7.48 7.82
35
37 36 36
32 31
28
30
32
34
36
38
0.00
2.00
4.00
6.00
8.00
10.00
FY10 FY11 FY12 FY13 FY14 FY15
Profit after Tax (PAT)
PAT PAT MARGIN (RHS)
(Rs bn) (%)
FY12 – Impacted by one time income from the film Enthiran and reorganization of TN analog cable network & FY14 – Impacted by first year IPL losses
34
49 41
37 36 34
28 35
29 27 24 24
0
20
40
60
FY10 FY11 FY12 FY13 FY14 FY15
ROCE & RONW
RoCE RoNW
(%)
34 34
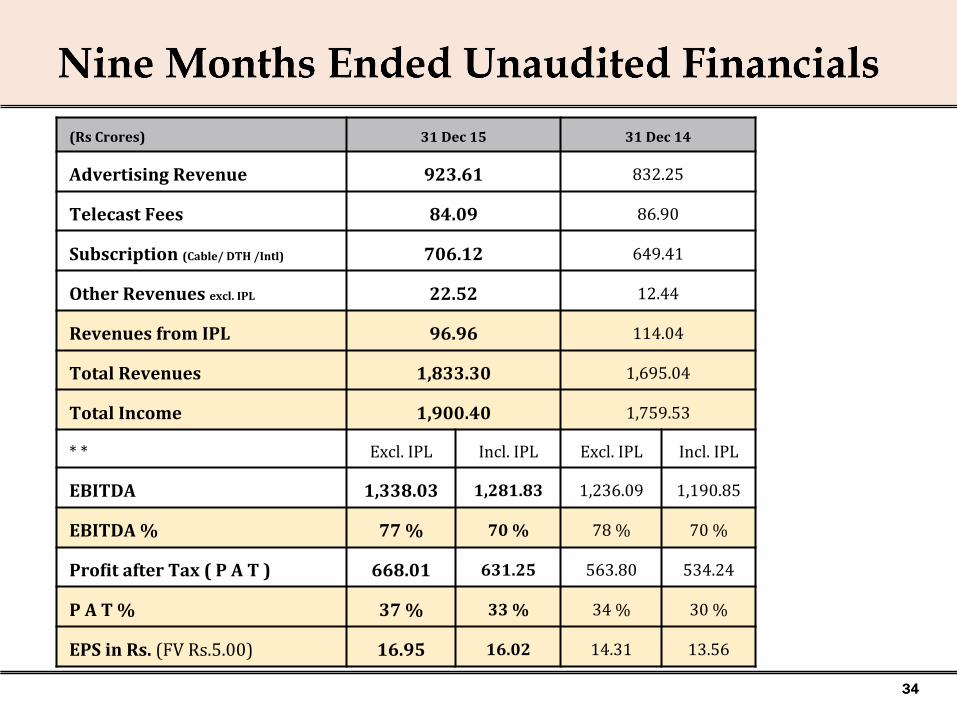
(Rs Crores) 31 Dec 15 31 Dec 14
Advertising Revenue 923.61 832.25
Telecast Fees 84.09 86.90
Subscription (Cable/ DTH /Intl) 706.12 649.41
Other Revenues excl. IPL 22.52 12.44
Revenues from IPL 96.96 114.04
Total Revenues 1,833.30 1,695.04
Total Income 1,900.40 1,759.53
* * Excl. IPL Incl. IPL Excl. IPL Incl. IPL
EBITDA 1,338.03 1,281.83 1,236.09 1,190.85
EBITDA % 77 % 70 % 78 % 70 %
ProJit after Tax ( P A T ) 668.01 631.25 563.80 534.24
P A T % 37 % 33 % 34 % 30 %
EPS in Rs. (FV Rs.5.00) 16.95 16.02 14.31 13.56

35 35
FY08 FY09 FY10 FY11 FY12 FY13 FY14 FY15
925.99 1,091.52
1.437.52
1.970.50 1,831.57 1,872.60
2,175.99 2,331.45
Total Income grew at CAGR of 14.10 %
(Rs. Crs)
FY08 FY09 FY10 FY11 FY12 FY13 FY14 FY15
466.59 572.76
788.72
970.20 945.42 1.049.70 1,067.04 1,136.09
Advertising Income grew at CAGR of 13.56%
(Rs. Crs)
FY08 FY09 FY10 FY11 FY12 FY13 FY14 FY15
366.98 437.11
567.38
772.22 694.65 683.30 716.96 737.23
PAT grew at CAGR of 10.48%
FY12 – Impacted by one time income from the film Enthiran and reorganization of TN analog cable network & FY14 – Impacted by first year IPL losses
(Rs. Crs)
Shares of the Company were listed on 24 April 2006 in NSE and BSE
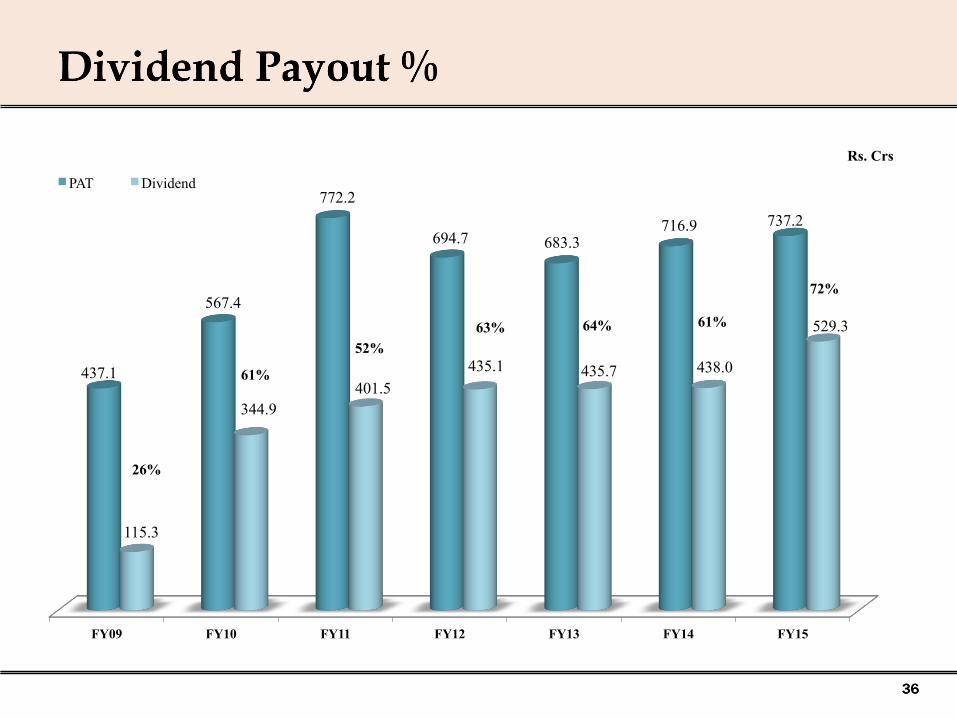
36 36
FY09 FY10 FY11 FY12 FY13 FY14 FY15
437.1
567.4
772.2
694.7 683.3 716.9 737.2
115.3
344.9 401.5
435.1 435.7 438.0
529.3
PAT Dividend
61%
52% 63% 64% 61%
72%
Rs. Crs
26%

37 FEBRUARY 16, 2016