thesis climatic and hydrologic processes leading to …
TRANSCRIPT

i
THESIS
CLIMATIC AND HYDROLOGIC PROCESSES LEADING TO RECENT WETLAND LOSSES IN
YELLOWSTONE NATIONAL PARK, USA
Submitted by
Derek M. Schook
Graduate Degree Program in Ecology
In partial fulfillment of the requirements
For the Degree of Master of Science
Colorado State University
Fort Collins, Colorado
Spring 2012
Master’s Committee:
Director: N. LeRoy Poff
Advisor: David J. Cooper
Michael J. Ronayne Stephanie K. Kampf

ii
ABSTRACT
CLIMATIC AND HYDROLOGIC PROCESSES LEADING TO RECENT WETLAND LOSSES IN
YELLOWSTONE NATIONAL PARK, USA
Wetlands both provide vital habitat within functioning environments and act as
landscape indicators by integrating catchment-scale hydrologic processes. Wetland drying
during the past few decades in Yellowstone National Park’s Northern Range has caused concern
among National Park managers and the public at large. My research was initiated to develop an
understanding of the processes controlling wetland water levels and contributing to wetland
decline in the Northern Range. To do this I integrated analyses of hydrology, climate, soils, and
vegetation. In 2009 I selected 24 study wetlands and instrumented each with an average of five
shallow groundwater monitoring well-and-piezometer nests. To quantify historic wetland area I
mapped hydric soils, analyzed aerial photographs, and identified geomorphic indicators of
higher water. Vegetation was sampled to characterize wetlands and plant-water relationships,
and I also conducted a soil seed bank study. The Trumpeter Lake focal site revealed
groundwater changes through time and was used to identify the timescale on which an
important wetland varies. Climate data indicated that warming and drying occurred during the
20th century, but that this pattern was within the natural range of variation for the study region
during the past 800 years. Hydrologic data revealed that study sites included locations of
groundwater discharge, recharge, and flow-through as well as water perched above the regional
water table. Hydrologic regimes were classified using a shape-magnitude framework and seven
wetland classes were characterized. Wetland classes exhibited variable hydrologic permanence
within and between the two study summers. Aerial photographs and hydric soil delineation both
confirmed formerly greater wetland abundance. These changes were linked to the wetland
classes and the presence or absence of surface water outlets. Wetland plant species inhabited

iii
areas of distinct water table depth and variation, and can be used to infer subsurface hydrologic
regime in the absence of extensive monitoring well networks. Continued monitoring of these
wetland basins and their watersheds is critical to expanding our understanding of the processes
supporting Northern Range wetlands and allowing us to better manage these valuable habitats.
Derek M. Schook
Graduate Degree Program in Ecology Colorado State University
Fort Collins, CO 80523 Spring 2012
iv
ACKNOWLEDGEMENTS
This work to which I sign my name as sole author is the culmination of efforts by many
people. My advisor, Dr. David Cooper, has been instrumental to the project's success from day
one, guiding research objectives and my personal and professional development throughout.
The project was funded through grants from the Canon Foundation, Yellowstone Foundation,
National Park Service, and Warner College of Natural Resources. Roy Renkin's contributions
aided field work and facilitated the CSU-NPS collaboration. Mary Hektner's role as park liaison
was valuable in developing research objectives and understanding NPS goals. Thanks to
collaboration with the Yellowstone Center for Resources, including Christie Hendrix, Stacey
Gunther, Hank Heasler, Cheryl Jaworowski, David Susong, and Tom Olliff. I thank Erin Ouzts for a
fun summer of dedicated field work. Jennifer Whipple identified dozens of wetland plant species
when my efforts came up short. Special thanks to my colleagues in the Cooper lab for mulling
over the project's details, reviewing drafts, and engendering an enjoyable work environment.
Stephen Gray shared climate reconstruction data, and Ken Pierce offered seasoned opinions of
Northern Range geology and hydrology. Committee members Mike Ronayne and Stephanie
Kampf supplied insight regarding the scope and goals of the project, as well as helpful revisions.
This project and my graduate degree have been facilitated by the Graduate Degree Program in
Ecology and the department of Forest and Rangeland Stewardship at Colorado State University.

v
TABLE OF CONTENTS
1. INTRODUCTION .................................................................................................................. 1
2. STUDY AREA ....................................................................................................................... 3
3. METHODS .......................................................................................................................... 5
3.1 WETLAND CHARACTERISTICS AND CLASSIFICATION .......................................................... 5 3.1.1 Hydrologic Data collection ........................................................................................ 5 3.1.2 Wetland Water Table Classification ......................................................................... 6 3.1.3 Wetland area analysis .............................................................................................. 8
3.2 CLIMATE .............................................................................................................................. 9 3.2.1 2009-2010 weather ................................................................................................... 9 3.2.2 Historic datasets ...................................................................................................... 10
3.3 VEGETATION ..................................................................................................................... 10 3.3.1 Plant-hydrology relationship .................................................................................. 10 3.3.2 Soil seed bank study ................................................................................................ 11
3.4 TRUMPETER LAKE FOCAL SITE .......................................................................................... 12 3.4.1 Surveying and aerial photograph analysis ............................................................. 12 3.4.2 Aquifer flow paths ................................................................................................... 13
4. RESULTS ........................................................................................................................... 13
4.1 WETLAND HYDROLOGIC REGIMES .................................................................................... 13 4.1.2 Wetland Classification ............................................................................................ 16 4.1.3 Wetland size through time ..................................................................................... 18
4.2 CLIMATE ............................................................................................................................ 19 4.2.1 Trends in Yellowstone River discharge ................................................................... 19 4.2.2 Long-term climate trends........................................................................................ 20
4.3 VEGETATION ..................................................................................................................... 20 4.3.1 Vegetation-hydrology relationship ........................................................................ 20 4.3.2 Soil seed bank study ................................................................................................ 21
5. DISCUSSION ..................................................................................................................... 22
5.1 HYDROLOGICALLY-BASED WETLAND CLASSIFICATION .................................................... 23 5.2 HYDROLOGIC PROCESSES CONTROLLING YELLOWSTONE’S WETLANDS ......................... 24 5.3 HYDROLOGIC CONTROLS OF WETLAND VEGETATION ..................................................... 24 5.4 TRUMPETER LAKE WATERSHED DYNAMICS ..................................................................... 25 5.5 WEATHER, CLIMATE, AND WETLAND AREA CHANGES THROUGH TIME .......................... 27
6. CONCLUSIONS .................................................................................................................. 29
7. REFERENCES ..................................................................................................................... 31
8. FIGURES AND TABLES ....................................................................................................... 38
9. APPENDICES ..................................................................................................................... 54
APPENDIX A. ADDENDUM TO 2009-2010 WEATHER REPORT ......................................................... 54 APPENDIX B. LOCATION OF ALL WELLS .......................................................................................... 56 APPENDIX C. AERIAL PHOTOGRAPHY DATES ................................................................................... 60 APPENDIX D. HYDRAULIC CONDUCTIVITY MEASUREMENTS IN THE TRUMPETER LAKE WATERSHED .......... 61 APPENDIX E. TRUMPETER LAKE FOCAL SITE ANALYSIS ...................................................................... 63

vi
APPENDIX F. SOIL SEED BANK STUDY SPECIES LIST ........................................................................... 65 APPENDIX G. SOIL SEED BANK STUDY PLOT STRATIFICATION PROCEDURE ............................................ 67 APPENDIX H. EXAMPLE WETLAND HYDROGRAPHS FROM THE SEVEN CLASSES ...................................... 70 APPENDIX I. YELLOWSTONE RIVER ANNUAL DISCHARGE ................................................................... 72 APPENDIX G. PHOTOS OF WETLANDS FROM EACH CLASS.................................................................. 73

vii
LIST OF FIGURES
FIGURE 1. MAP OF THE YELLOWSTONE NATIONAL PARK AND ITS NORTHERN RANGE, USA ............................. 38
FIGURE 2. CLUSTER ANALYSIS DENDROGRAMS OF WATER TABLE VARIATIONS IN WELLS ................................... 39
FIGURE 3. HYDROGRAPHS OF THE SEVEN WELL CLASSES. ............................................................................ 40
FIGURE 4. CROSS SECTIONS AND HYDROGRAPHS FOR TWO EXAMPLE WETLANDS ............................................ 42
FIGURE 5. CROSS SECTION OF TRUMPETER LAKE WITH WATER TABLES FROM FOUR DATES ............................... 43
FIGURE 6. TRUMPETER LAKE WATER TABLE CONTOURS AND LAKE STAGES, 2010 ........................................... 44
FIGURE 7. SURFACE AREA-VOLUME RELATIONSHIP AT TRUMPETER LAKE. ..................................................... 45
FIGURE 8. STUDY AREA CLIMATE RECONSTRUCTION .................................................................................. 46
FIGURE 9. YELLOWSTONE RIVER DISCHARGE SHAPE-MAGNITUDE ANALYSIS CLASSES ....................................... 47
FIGURE 10. COMPARISON OF EARLY AND LATE YELLOWSTONE RIVER RUNOFF YEARS ...................................... 48
FIGURE 11. PLANT SPECIES WATER TABLE HYDROGRAPHS .......................................................................... 49
FIGURE 12. WETLAND PLANTS GERMINATING IN THE SOIL SEED BANK STUDY. ................................................ 50
LIST OF TABLES
TABLE 1. DESCIPTION OF THE 24 WETLAND STUDY SITES ............................................................................ 51
TABLE 2. ENVIRONMENTAL INFLUENCES ON WETLAND CLASS ASSIGNMENT ................................................... 52
TABLE 3. TEMPORAL RELATIONSHIP BETWEEN PRECIPITATION ON AND WETLAND SIZE ..................................... 53
TABLE 4. TRUMPETER LAKE SIZE RELATED TO PRECIPITATION FROM THE LAST DECADE ..................................... 53

1
1. INTRODUCTION
Wetlands are among the most valuable yet vulnerable habitats on Earth (Poff et al.,
2002; Bates et al., 2008; Winter, 2000). Hydrologic processes, which are influenced by climate,
geology, and landscape setting, are the dominant mechanisms creating and sustaining wetlands
(Mitsch and Gosselink, 2000; Hunt et al., 1996). Located at low points in their watersheds,
wetlands integrate catchment-scale processes and reflect environmental conditions (Williamson
et al., 2008; Bates et al., 2008; Long and Nestler, 1996). Additionally, the close proximity of the
water table and land surface in wetlands leaves these habitats susceptible to changing
hydrologic, landscape, and climatic conditions (Brooks, 2009; Bates et al., 2008).
Interactions among precipitation, evapotranspiration, groundwater, and surface water
create a wetland’s hydrologic regime. Distinguishing surface- from groundwater processes is
often complex because they interact at multiple spatial and temporal scales (Winter, 1999;
Schot and Winter, 2006; Devito et al., 2005). Subsurface stratigraphy and its hydraulic properties
play important roles in influencing wetland hydrologic processes (van der Kamp and Hayashi,
2009; Winter, 1999; Todd et al., 2006). Adjacent wetlands that appear similar can vary in
permanence (Brooks, 2000), and recent modeling in the prairie pothole region of the northern
American Great Plains has shown more permanent wetlands to be more susceptible to climate
change than temporary wetlands (Johnson et al., 2010). Further complicating hydrologic
assessments, groundwater sources sustaining a wetland may originate hundreds of kilometers
away, such as those that support Argentine desert oases (Jobbágy et al., 2011) and Death Valley,
California springs (Belcher et al., 2009). Groundwater flow paths also affect surface water
chemistry (van der Kamp and Hayashi, 2009; LaBaugh, 1987) and salinity (Jolly et al., 2008;
LaBaugh et al., 1998), factors that influence wetland species composition.

2
Basin wetlands found throughout the world exhibit a range of hydrologic regimes
(Winter, 1999). For example, playa wetlands of the southern Great Plains (Tiner, 2003; Tsai et
al., 2007) and vernal pools across the USA (Brooks, 2004; Pyke, 2004; Zedler, 2003) are
dependent on precipitation and evapotranspiration (ET) processes. These wetlands are
considered hydrologically isolated from ground- and surface waters. In contrast, Nebraska’s
Sandhills and Colorado’s Great Sand Dunes support wetland complexes that are connected via
groundwater flows in highly conductive soil (Winter, 1986; Wurster et al., 2003). Cook and
Hauer (2007) described wetlands in the Northern Rocky Mountains that formed in a dead-ice
glacial moraine, with some wetlands connected by near-surface flow and others being
hydrologically isolated. Fluxes between ground- and surface water in prairie pothole region
wetlands are highly variable temporally and spatially, and the direction of groundwater flow
may change seasonally (Woo and Rowsell, 1993; Rosenberry and Winter, 1997; Winter and
Rosenberry, 1995). The high degree of spatial and temporal variability in wetlands illustrates
that generalizing wetland function in an unstudied region can yield inaccurate assumptions.
Temperature and precipitation strongly influence wetland habitats and are forecasted
to change in the coming decades (Carpenter et al., 1992; Brooks, 2009). Past changes in climate
have been correlated with wetland disappearance in Alaska and Siberia (Klein et al., 2005; Smith
et al., 2005), and the trend is predicted to continue (Sorenson et al., 1998; Bates et al., 2008).
Understanding the effects of climate change on wetland biotic and hydrologic processes is
challenging due to the inherent spatial and temporal complexity in these habitats (Pilon and
Yue, 2002; Bates et al., 2008; Brooks, 2009).
Regional climate models for Yellowstone National Park (YNP) forecast an ecological shift
unprecedented in the Quaternary, yielding an uncertain future for the park’s water-based
ecosystems (Westerling et al., 2011; Bartlein et al., 1997). Many wetlands in YNP’s glacially-

3
influenced Northern Range have exhibited pronounced surface water declines during the past
four decades. However, these changes are poorly quantified (e.g., McMenamin et al., 2008), and
no previous research has investigated the processes causing these changes. Recent wetland loss
has already affected YNP’s native wetland species, including causing the loss of trumpeter swan
nesting habitat (Proffitt et al., 2010). Although some effects of wetland decline on key species
have been identified, the underlying processes altering the wetlands themselves remain
unknown and are important to guiding future conservation efforts.
The geologic diversity of YNP has created high environmental heterogeneity, precluding
a broad characterization of wetland processes. To address this variation, I used concepts from
other classifications (e.g., Acreman et al., 2009; Dahl, 2011; Rains, 2011; Junk et al., 2011) to
create a framework for grouping wetlands according to their hydrologic processes. This research
addressing wetland change was framed within the following objectives: (1) classify wetlands
according to their hydrologic regime, including climatic and geomorphic processes, (2)
determine the patterns and magnitude of water level decline that occurred during the late 20th
and early 21st centuries and assess whether this change is within the natural range of variation,
and (3) investigate a focal site that has experienced dramatic water level changes to gain a more
complete understanding of wetland processes. The upper Yellowstone River watershed provides
a unique opportunity to investigate hydrologic processes in a relatively pristine hydrologic
setting. To address the study objectives I integrated wetland and watershed hydrology, climate,
soils, and vegetation to create an integrated view of the processes supporting Northern Range
wetlands.
2. STUDY AREA
2.1 Site Description

4
The 1,400 km2 Northern Range is located in Wyoming and Montana and comprises
much of YNP’s northern quarter (Fig. 1). Douglas fir (Pseudotsuga menziesii Mirbel) and
lodgepole pine (Pinus contorta Loudon) dominate the higher elevation forests, while lower
elevations are dominated by sagebrush steppe (Artemisia tridentata Nutt; nomenclature follows
USDA PLANTS (NRCS, 2011)). Lower elevations (1800-2000 m) receive 41 cm average annual
precipitation, with over half falling as snow (NCDC, 2011). Most of the study area was covered
by glaciers during the Pinedale Glaciation, which ended approximately 15 kya. Today’s
environment is heavily influenced by glacial scouring and till deposition that has created a
heterogeneous landscape with abundant depressions that support today’s wetlands. Clay rich
mollisols and inceptisols surround the study sites (YCR, 2009). In recent years, park staff and
visitors have observed a pronounced lowering of surface water levels in these wetlands, but
quantitative and process-based information explaining the phenomenon is lacking.
In 2009, 24 non-riparian wetlands were selected as study sites to characterize Northern
Range wetland types (Table 1). Study sites ranged from 1783 – 2284 m elevation. Sites included
both mineral and organic soils, and common plant species included Carex atherodes, C.
utriculata, Juncus arcticus, Eleocharis palustris and Schoenoplectus acutus. Study wetlands
receive water from direct precipitation, groundwater, and overland flows. Through the 20th and
early 21st centuries, some Northern Range wetland water levels were stable, while others varied
greatly (Engstrom et al., 1991). Several wetlands exhibited distinct indicators of former high
water levels, including relict vegetation, lichen trimlines, and eroded shorelines. Biotic factors
including high large herbivore density can disturb vegetation and soils, especially in wetlands.
Northern Range bison populations are the highest on record and elk populations have been
nearly twice as high during the past three decades compared to the previous four (YNP, 1997;
Wallen, 2010; Wyman, 2011).

5
The Trumpeter Lake focal site was selected for a more detailed analysis because it has
purportedly undergone major water level declines and trumpeter swans formerly nested here.
However, lower water levels have changed the lake’s habitat structure, leaving it unsuitable for
nesting today. The lake is located near the confluence of the Lamar and Yellowstone Rivers in
dead-ice moraine terrain. Its watershed has hummocky topography comprised of low-
permeability unconsolidated glacial till with a high density of granitic glacial erratics (Pierce,
1979). Upland soils were identified as loam and lake-bottom soil as clay-loam using the
hydrometer method particle size analysis (Gee and Bauder, 1979), suggesting that porosities
were approximately 46% (Rawls et al., 1982).
2.2 Study Period weather
Weather patterns during the study period influenced the measured wetland water
levels. 2009 and 2010 annual temperatures were both within 0.3° C of the post-1931 average.
Total precipitation in water year 2009 (1 Oct 2008 – 30 Sep 2009) was 97% and snowfall 120% of
average, while 2010 total precipitation was 83% and snowfall 53% of average (NCDC, 2011).
Early June through early July was the wettest period in 2009, while late May through mid-June
was the wettest period in 2010 (Appendix A). Weather station comparison for 2010 data
indicated that sites throughout the study area experienced similar precipitation conditions.
Pearson’s R correlation coefficients among the three rain gauges within the study area ranged
from 0.84 to 0.97.
3. METHODS
3.1 WETLAND CHARACTERISTICS AND CLASSIFICATION
3.1.1 Hydrologic Data collection

6
103 shallow groundwater monitoring wells were installed at the 24 wetland study sites
in 2009, and 18 wells were added in 2010 (Appendix B). Wells were distributed to measure
water tables on all sides of each study wetland and to characterize the hydrologic niches of
dominant plant species. Staff gauges were installed in all wetlands with ponded surface water to
measure its depth. Monitoring wells were hand-augered using a 10 cm diameter bucket auger to
a depth either below the anticipated water table low or as deep as possible in rocky soils. Wells
were constructed from 4.2 cm I.D. schedule 40 PVC pipe that was continuously slotted
throughout the anticipated zone of water table fluctuation. Augered holes were backfilled with
native soil. To measure hydraulic head in various soil layers, an average of two nested 2.1 cm
I.D. PVC piezometers were placed adjacent to each well within the top two meters of soil. Water
depth was measured manually with an electric tape approximately biweekly in 2009 and weekly
in 2010 (Shaffer et al., 2000), and readings were used to interpolate weekly values. A rotating
laser level was used to determine the relative elevation of wells within a wetland.
3.1.2 Wetland Water Table Classification
Classifying monitoring wells based on measured water tables was the first step toward
wetland classification. The majority of wells were installed in May 2009, and I used 3 June 2009
as the first date for analyzing well, staff gauge, and piezometer data. I excluded from analysis
instruments installed in late 2009 or in 2010 along with those that dried too early to provide
data throughout each summer. For classification, each well’s initial water level was standardized
to a common datum, and subsequent readings were relative to this point. Standardization
permitted the ecologically significant analysis of surface and groundwater changes independent
of their absolute ground-surface elevations (van der Kamp and Hayashi, 2009).
7
I grouped wells with similar water table variations using a hierarchical combination of
multivariate statistics and well-nest informed assignment. Wells with two distinctive hydrologic
regimes were first identified by analyzing hydrologic patterns. Wells in a stable group had less
than 3 cm of water level variation during the two-year study period. Secondly, wells in a perched
group had surface water that disappeared abruptly and nested piezometers that never
contained water, revealing an unsaturated layer below surface water. These groups were
deemed unique from all other wells, which contained transient water levels connected to
groundwater systems.
For the remaining 83 wells, I conducted a two-step “shape-magnitude” cluster analysis
to produce a composite classification by separately analyzing the timing (i.e. shape) and
magnitude of water table variations. This approach has been used for analyzing weather
patterns and stream discharge (Laize and Hannah, 2010; Bower et al., 2004; Hannah et al.,
2000), and recently groundwater (Upton and Jackson, 2011). To classify shape, each well’s
weekly water table data were standardized to a common degree of variation using a z-scores
transformation (mean = 0, st. dev. = 1). This transformation isolated the seasonality and rate of
water table change independent of its magnitude. Transformed data were grouped using
hierarchical agglomerative cluster analysis using Euclidian distance and Ward’s group linkage
method (Laize and Hannah, 2010; Bower et al., 2004) with the program PC-ORD (McCune and
Mefford, 2006). The resultant dendrogram was pared at 40% information remaining, producing
three groups of wells, each with distinct hydrograph characteristics.
For the magnitude analysis, I combined seven water table variables: minimums, means
and standard deviations for each 2009 and 2010, and maximum elevation for 2010 (Bower et al.
2004, Harris et al. 2000). All magnitude indices were standardized by conversion to z-scores to
eliminate uneven weighting of classes (Hannah et al., 2000; van Tongeren, 1987). A second
8
cluster analysis was performed on the magnitude data using the procedure described above but
pruned at 0% information remaining, which produced two groups, one with larger and one with
smaller water table changes (Fig. 2). The three shape and two magnitude classes were then
crossed to yield six possible well hydrograph classes, five of which occurred in the study
wetlands. The five shape-magnitude classes combined with the perched and stable well groups
identified previously produced seven well classes (Fig. 3). Wells within most wetlands were in a
single class, allowing wetlands to be grouped by these classes. A unique wetland class was
created to accommodate the two sites that contained wells from three or four well classes.
To compare the wetland classification to local environments, I compared wetland
classes to 14 environmental variables. Chi-squared analysis was conducted on the six binary
categorical variables: surface water inflow, surface water outflow, peat presence, organic
matter in basin, clay in basin, and bulrush (Schoenoplectus acutus) as the dominant wetland
plant species. I define a wetland “basin” as a depression with surface water, not synonymous
with a wetland’s watershed. One-way ANOVA, similar to chi-square analysis but used for
quantitative variables, was conducted on eight variables: elevation, average annual
precipitation, maximum observed surface water area, watershed size, duration to slowest
piezometer’s equilibration, maximum piezometer positive head, electrical conductivity (EC) in
the basin, and EC of groundwater inflow. To supplement these analyses, I created a classification
tree via CART analysis (De’ath and Fabricius, 2000) in the rpart package (Therneau and Atkinson,
2009) using the statistical program R 2.10.1 (R Development Core Team, 2009).
3.1.3 Wetland area analysis
Hydric soils: At 16 of the 24 study sites the maximum elevation of wetland soils could be
identified using the hydric soil indicators protocol in the Corps of Engineers’ Wetlands
9
Delineation Manual (USACE, 2010). The boundary between wetland and upland soil was
determined using soil pits and morphological indicators including chroma less than two, oxidized
root channels, and mottled matrices. The distance between modern water level and the hydric
soil’s upper boundary was analyzed among wetland classes using an ANOVA and between outlet
vs. closed-basin wetlands using a t-test.
Aerial photograph analysis: Aerial photographs from 1954, 1969, 1991, 1994, 1998,
2001, 2006, and 2009 were used to quantify the ponded area through time (photo dates in
Appendix C). Dense vegetation obscured the identification of surface water perimeters at ten of
the study sites, so 14 wetlands were used in the analysis. Photos were georectified to 2009 NAIP
imagery using 2nd and 3rd degree polynomials, and wetland surface area was delineated in
ArcMap v. 10 (ESRI, 2010). To standardize wetland area (Niemuth et al., 2010), each wetland’s
maximum area was assigned 1, and other years represented a proportion of 1. Wetland areas
were compared to annual precipitation totals (NCDC, 2011) at either the Tower or Mammoth
weather station, depending on proximity. I used regression models between the two stations to
estimate missing monthly precipitation values (Iglesias et al., 2006; Pegram and Pegram, 1993).
SAS (SAS Institute, 2010) was used to conduct a multiple regression comparing each wetland’s
proportion “full” to percent of average total precipitation for time steps of the past 2, 4, and 8
years. A wetland’s best correlated time step is reported for all p < 0.10.
3.2 CLIMATE
3.2.1 2009-2010 weather
I analyzed daily precipitation records for May through August of 2009 and 2010. Climate
data are available since 1931 for the Mammoth and Tower weather stations (NCDC, 2011). All
study wetlands are located within 12 km of one station and 350 m elevation of both stations

10
(Fig. 1). In 2010 a HOBO tipping bucket rain gauge (Onset Computer Corp.) was installed (UTM
Zone 12N 549867 E, 4973438 N) to measure precipitation near Trumpeter Lake. I performed
linear regression analysis on 2010 weekly precipitation data among the Tower, Mammoth, and
HOBO rain gauges to analyze spatial variability among study sites.
3.2.2 Historic datasets
The Yellowstone River above the Corwin Springs gauging station (USGS gauge
#06191500) drains 6783 km2, including the entire Northern Range within YNP. Mean daily
discharge data are available for the period 1911-2010. The shape-magnitude framework
described above was used to analyze Yellowstone River discharge trends. To classify magnitude
from each year, the maximum, minimum, mean, and standard deviation of monthly discharge
data were used for annual hydrographs. The Palmer Drought Severity Index (PDSI), a metric of
dryness (Dingman, 2002), is also reported for the Yellowstone River drainage basin from 1895-
2010 (NCDC, 2011).
3.3 VEGETATION
3.3.1 Plant-hydrology relationship
Vegetation in the study basins was typically distributed in concentric zones controlled by
water depth and duration. In 2009 I estimated the canopy cover of each plant species present in
a 2 m x 50 cm plot centered on each well and oriented parallel to vegetation zones. To
determine the hydrologic conditions supporting common plant species, I calculated the mean
weekly water table depth for all species comprising ≥ 20% cover at four or more wells. This
included Carex aquatilis, C. atherodes, C. pellita, C. utriculata, Eleocharis palustris, Phleum
pretense, Poa pratensis, Schoenoplectus acutus, and four Salix species, S. boothii,

11
S.drummondiana, S. geyeriana, and S. pseudomonticola. The Salix were all found in peatlands,
had similar hydrologic niches, and were combined for analysis.
3.3.2 Soil seed bank study
Soil seed banks were investigated to assess a wetland’s ability to revegetate if higher
water levels return. Although some wetland plants reproduce asexually through rhizomes, many
species produce persistent seed banks that stay viable for decades. The soil seed bank was
analyzed at 12 wetlands that represented a variety of Northern Range environments. Soil
samples were collected along two transects beginning at either the middle of the wetland basin
or approximately 40 cm below surface water in deep wetlands. Transects extended to the
surrounding upland vegetation. Each transect included five to seven plots spaced at 30 to 60 cm
elevation intervals, corresponding to the vertical relief between wetland bottom and upland. A
25 x 25 x 5 cm thick soil block was collected from each plot at the ground surface, air dried, and
sieved to remove roots and rhizomes. Each sample was spread onto sterile Pro-Mix BX soil in a
Colorado State University greenhouse and analyzed using the seedling emergence method
(Roberts, 1981). Soils were subjected to waterlogged conditions, which have been shown to be
superior to ponding for eliciting germination of wetland species (Boedeltje et al., 2002). Vega
and Sierra (1970) found that 83% of seedlings emerging in three years germinated in the first
year. For this study all plants identifiable within 14 months were included.
For statistical analysis, plots on each transect were assigned a value from 0 to 1,
representing their proportional elevation from the wetland’s interior to the surrounding upland.
This method produced a relatively even distribution of a given wetland’s plots among elevation
classes, and it preserved the role of scale in variously-sized watersheds. All 140 plots were
12
stratified into seven elevation classes that were analyzed using Kruskal-Wallis and Mann-
Whitney U tests with the program SAS (2010).
3.4 TRUMPETER LAKE FOCAL SITE
3.4.1 Surveying and aerial photograph analysis
Because of its ecological significance and importance to the public, Trumpeter Lake was
chosen as a focal site. A lichen trimline on glacial erratics around the lake indicates that lake
stage was higher in the recent past (Marsh and Timoney, 2005; Hale, 1974). In northern Alberta,
Marsh and Timoney (2005) showed that trimlines can persist 33-65 years. The declined lake
water level has triggered soil erosion and habitat alteration detrimental to trumpeter swans and
other native species. I used a total station to survey the zone between the water’s edge and the
maximum possible Trumpeter Lake stage. An existing bathymetric dataset was used to estimate
land surface’s elevation under surface water (Jones et al., 1978). Data were imported to ArcMap
10.0 where a triangulated irregular network (TIN) surface was created. Surface water polygons
were derived from each of the eight air photos and superimposed on the TIN to determine lake
stage in each photo. The topographic survey allowed me to analyze lake volume in addition to
area (Hayashi and van der Kamp, 2000). To minimize seasonality bias, I analyzed lake sizes on a
common day of year by calculating changes in lake stage between the photo date and August
15. To do this I subtracted the measured precipitation from evaporative loss, which was
estimated using historic monthly (Pochop et al., 1985) and annual (WCA, 2008) pan evaporation
measurements. This value was added to lake stage if the photo was taken before August 15, or
subtracted from photo stage if taken after August 15. The calculated stage superimposed on the
TIN produced lake sizes for a common day of the year. 2010 lake size was measured in the field.
13
To investigate the time scale on which Trumpeter Lake functions, regression analysis was used
to compare lake area and volume to precipitation totals over the previous 1, 2, …, 10 years.
3.4.2 Aquifer flow paths
The time lag between precipitation input and subsequent water level changes in the
wetland basin is influenced by aquifer saturated hydraulic conductivity (Ks). Two methods were
used to calculate Ks, the Hvorslev slug test (Fetter, 1994) measured water’s return rate in
groundwater monitoring wells in the Trumpeter Lake watershed. A double-ring infiltrometer
(ASTM, 2003) was used to calculate Ks at the ground surface and at 50 cm depth on lake-margin
and upland till environments. Water samples taken in the Trumpeter Lake watershed were
analyzed for Ca2+/Na+ ratios. Differences in this ratio reflect different flow paths.
4. RESULTS
4.1 WETLAND HYDROLOGIC REGIMES
4.1.1 Wetland hydrology
Northern Range wetlands exhibited several indicators of surface water decline. At three
sites, OR, LT, and TL, eroded former shorelines occurred > 200 cm in elevation above the 2009-
2010 maximum surface water level (see Table 1 for wetland acronyms). Lichen trimlines, created
when surface water drowned established lichen colonies (Marsh and Timoney, 2005; Hale,
1974), occurred on rocks surrounding wetland basins at BM (95 cm above maximum measured
water), CR (105 cm), LT (230 cm), and TL (250 cm). These rocks had little or no visible lichen
colonization below the trimline, suggesting that the high water period occurred within the past
few decades (Timoney and Marsh, 2004). A third indication of former water depth was the
location of dead stands of bulrush, an emergent marsh species. These slowly decaying plants

14
occurred on highly organic soils 20-30 cm thick and were 180, 185, and 200 cm above the study
period’s highest surface water at OR, LT, and TL.
During my study period surface water levels declined through the growing season at 22
of the 24 study wetlands, and all of these sites had lower water levels during 2010 than 2009
(Fig. 4). In 2009 all 24 study sites supported surface water in early summer and 15 retained it
through mid-August, while in 2010, 22 sites had surface water in early summer and 9 did in mid-
August. Water table variance during the summer differed by site. Wetlands DW and RL had
persistent inflow and outflow, and surface water levels varied < 3 cm during both summers. In
contrast, surface water level in BD, BG, and CP averaged 111-119 cm higher in 2009 than 2010.
Groundwater level patterns resembled those of surface water levels for most wetlands
(Fig. 4d). Each summer’s most intense two-week rain period, 29 mm in 2009 and 52 mm in 2010,
triggered groundwater rises (Fig. 3, Fig. 4c). In some sites groundwater levels varied more than
surface water (e.g. TL, BW), while at other sites the opposite occurred (e.g. BD, SV). 19 wetlands
most frequently experienced groundwater inflow from one side and outflow to the opposite
side, and thus were considered flow-through systems (Dingman, 2002). Hydraulic gradient
reversals, where the relative elevations of groundwater and surface water reverse, were
documented at seven sites (Fig. 5e). Following the periods of heaviest rain (e.g., the first two
weeks of June 2010), LT and other wetlands switched from flow-through wetlands to having
groundwater inflow on all sides (Fig. 4a). Wetlands MC, BP, and WA were perched above the
regional water table.
Piezometric head data revealed that vertical gradients were small and groundwater
flows were predominantly horizontal. Only 17 of 217 piezometers had significant upward
gradients, characterized by a hydraulic head ≥ 5 cm from water table elevation. A spring
supporting DW had 22-23 cm of positive gradient, and one supporting TF and TL had 25-48 cm

15
of positive gradient. 12 of 17 piezometers with positive gradients took longer than one week
(median 10 weeks) to equilibrate following installation, suggesting they had low Ks and
produced little upward flow into the wetland. Seven piezometers consistently had more than 5
cm of negative gradient, indicating that downward flow is uncommon. The three perched sites
all had at least one deep piezometer that never contained water even when surface water was
present, revealing an unsaturated zone below surface water.
Wetlands containing surface water outflow at any time during the study period were
distinct from closed basins. These wetlands typically had inflowing groundwater, and their
surface outlets maintained relatively stable maximum water levels. They had similar early
summer water table levels in both study years. Five of the seven wetlands with outlets had peat
soils and are fens (Lemly and Cooper, 2011), and the other two are a large and deep lake (RL)
and a perched site (MC) that was often dry. Wetlands with outlets had less water table response
to early summer rains (mean 2 cm) than closed-basins (13 cm; t = 2.87, p = 0.005, Fig. 4c&d).
Sites with outlets responded to rain events in late summer only if surface outflow had ceased
(Fig. 4d).
The Trumpeter Lake wetland is a flow-through hydrologic system, with groundwater
inputs from the south and southeast (Fig. 5, Fig. 6). Na+/Ca2+ ratios from groundwater samples
indicated that two separate aquifers contribute to water tables in the watershed. A spring from
the bedrock aquifer had Na+/Ca2+ ratios around 13, while ratios from the surficial till aquifer
springs were around three. Trumpeter Lake stage declined by 23 cm in 2009 and 45 cm in 2010.
Seasonal water table maxima occurred in early June in both years. By late summer 2010, surface
water was higher than groundwater on all sides of the lake and recharged groundwater on all
fronts (Fig. 6d). Double-ring infiltrometer and slug tests in the Trumpeter Lake watershed
indicated that Ks values ranged from 0.003 to 1.7 m/day (Appendix D). The double-ring
16
infiltrometer yielded Ks values roughly an order of magnitude higher than the slug tests,
commensurate to the findings in till by van der Kamp and Hayashi (2009). These low
conductivity values indicate that it can take years between water’s arrival in the watershed and
its interaction with the lake.
4.1.2 Wetland Classification
Seven wetland classes were identified from water table variation patterns. Description
of these classes follows:
Stable surface water ,”stable”: DW, RL. Basins maintaining surface water within 3 cm of constant
due to consistent inflow and outflow. Dense emergent vegetation bordered the surface
water. Aerial photograph analysis indicated that wetland area has remained stable for
decades.
Perched water tables, ”perched”: BP, MC, WA. Wetlands with perched water. Water levels
steadily declined before disappearing. Some piezometers never contained water even
though a nested monitoring well did, indicating the piezometer was completed in or
below a confining layer.
Seasonally and yearly variable water tables, ”seasonal”: BD, BG, BM, BW, CP, CR, SV. Wetlands
with large water table decline during and between summers. 2010 water levels
averaged 75 cm lower than in 2009, more than double the between-year decline of any
other class. Winter snowpack created flow-through or recharge basins, and pronounced
water table rises following rain events indicated a close connection between
precipitation and water tables.
Peat soils with recovering water tables, ”P.R.”: DC, RP, SN. Fens supported by groundwater
discharge with water levels declining in late summer and recovering during the winter.
17
Recovering is defined by water tables increasing between study summers due to
recharge processes. 2009 water level declines occurred later in the summer and were
smaller than in 2010. All sites had surface water outlets that limited the water table’s
response to early summer rain.
Mineral soils with recovering water tables, ”M.R.”: MB, US. These mineral soil basin wetlands
had the largest water table declines, approximately 100 cm each summer. Water tables
recovered during the 2009-2010 winter.
Interannually variable water table persistence, ”I.V. ”: BE, IP, OR, SG, TF. Water tables declined
minimally in 2009 but much more in 2010. Sites included those with and without outlets
and having mineral and organic soils. Water table variation was relatively small and
unresponsive to precipitation events.
Spatially variable water table patterns, “S.V.”: TL, LT. Wetlands containing wells from at least
three of the well types described above. Water tables in different areas of these
wetlands varied distinctly, indicating that a combination of hydrologic patterns converge
and create spatial complexity.
Wetland class assignment was influenced by the interaction between each wetland and
its surrounding environment. Wetland class was correlated with the highly linked variables of
surface water outflow (x2 = 16.03, p = 0.01) and peat soil (x2 = 15.77, p = 0.02), variables that
were indicative of wetlands in classes P.R. and I.V. Surface water outlets constrained maximum
wetland water levels, dampened water table changes, and supported peat formation. The most
parsimonious classification tree in CART analysis contained only one split, divided at peat
presence or absence, a variable 92.5% correlated with surface water outflow. The overall CART
misclassification rate was 12.5%, compared to the majority misclassification rate of 29.2%.
18
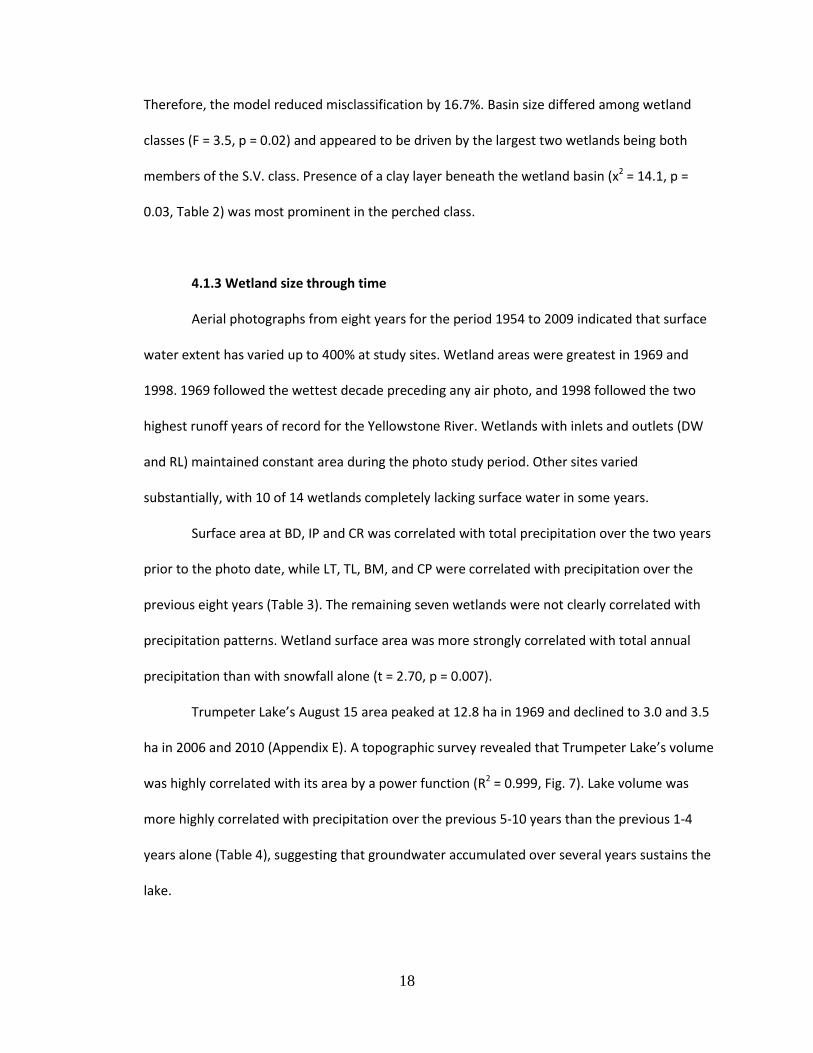
Therefore, the model reduced misclassification by 16.7%. Basin size differed among wetland
classes (F = 3.5, p = 0.02) and appeared to be driven by the largest two wetlands being both
members of the S.V. class. Presence of a clay layer beneath the wetland basin (x2 = 14.1, p =
0.03, Table 2) was most prominent in the perched class.
4.1.3 Wetland size through time
Aerial photographs from eight years for the period 1954 to 2009 indicated that surface
water extent has varied up to 400% at study sites. Wetland areas were greatest in 1969 and
1998. 1969 followed the wettest decade preceding any air photo, and 1998 followed the two
highest runoff years of record for the Yellowstone River. Wetlands with inlets and outlets (DW
and RL) maintained constant area during the photo study period. Other sites varied
substantially, with 10 of 14 wetlands completely lacking surface water in some years.
Surface area at BD, IP and CR was correlated with total precipitation over the two years
prior to the photo date, while LT, TL, BM, and CP were correlated with precipitation over the
previous eight years (Table 3). The remaining seven wetlands were not clearly correlated with
precipitation patterns. Wetland surface area was more strongly correlated with total annual
precipitation than with snowfall alone (t = 2.70, p = 0.007).
Trumpeter Lake’s August 15 area peaked at 12.8 ha in 1969 and declined to 3.0 and 3.5
ha in 2006 and 2010 (Appendix E). A topographic survey revealed that Trumpeter Lake’s volume
was highly correlated with its area by a power function (R2 = 0.999, Fig. 7). Lake volume was
more highly correlated with precipitation over the previous 5-10 years than the previous 1-4
years alone (Table 4), suggesting that groundwater accumulated over several years sustains the
lake.

19
For the 16 wetlands with an identified relict hydric soil, this soil’s upper boundary
differed significantly among wetland classes compared to the current surface water level (F =
3.29, P = 0.04). This finding provides a longer-term perspective supporting the wetland
classification, which was developed from two summers of hydrologic data. Hydric soil
boundaries at wetlands with an outlet were more similar to the 2009-10 water levels (n = 7,
mean = 31 cm ± 4 cm SE above 2009-10 mean peak) compared to closed-basin sites (n = 9, mean
= 128 ± 24 cm SE, Student’s t-test, t = 3.31, p = 0.005). The presence of hydric soils in locations
beyond the surface water elevations measured during field study provided evidence suggesting
that wetlands occupied greater areas in the past.
4.2 CLIMATE
4.2.1 Trends in Yellowstone River discharge
The 5-year mean discharge of the Yellowstone River was positively correlated with
wetland area over time (R = 0.89; Fig. 8a), suggesting that the river’s discharge record from
1911-2010 may be a good proxy for wetland area. Cluster analyses of annual Yellowstone River
discharge data produced three magnitude and four shape classes, the latter corresponding to
annual runoff peaks occurring in May, June-May, June, and June-July (Fig. 9). In the 26 years
since 1984 there have been no late peak and 10 early peak years, compared to their relatively
equal distribution of runoff timing in the decades prior to the 1980s (Fig. 10). The ratio of May
(early) to June-July (late) peaks in the last three decades is unprecedented in the discharge
record. Prior to 1984 the mean annual discharge peak occurred on June 11, but from 1985-2010
it occurred on May 30 (t-test, t = 4.67, p ˂ 0.001). The decade most similar to the early peak-
dominated 1990s and 2000s was the drought period of the 1930s. This decade was followed by
the 1940s, which had the most late peak years on record. The early peak 1990s, however, was

20
followed by a second successive early peak decade. Unlike discharge timing, the volume of
mean annual discharge did not change pre- and post-1984 (Student’s t-test, t = 0.38, p = 0.70).
4.2.2 Long-term climate trends
For the last 100 years, relative highs and lows in Yellowstone River discharge and PDSI
have co-occurred (Fig. 8). Since 1970 river discharge has oscillated around the mean of the past
century, while increased temperatures have produced consistently lower PDSI values. Although
PDSI trends suggest that the past four decades have been drier than most of the last century,
tree ring data indicate that conditions at least as dry as the past 40 years have occurred in YNP
several times in the past 800 years, for example circa 1250, 1500, 1700, and 1800 AD (Fig. 8d;
Gray et al., 2007). The relatively dry second half of the 20th century was preceded by the most
prolonged wet period of the past 800 years, lasting approximately 80 years from the late 19th
through the early 20th centuries (Gray et al., 2007). This wet period may have resulted in the
expansion of Northern Range wetlands to their largest extent in the past several centuries.
4.3 VEGETATION
4.3.1 Vegetation-hydrology relationship
The nine most common plant species in study wetlands occupied distinct hydrologic
regimes (Fig. 11). Carex aquatilis and C. utriculata occurred in locations with the highest water
tables in both years, having surface water throughout the first half of each summer. Carex
pellita, Schoenoplectus acutus, and Salix spp. were also found in wet locations with water tables
near the soil surface through mid-June in 2009. In 2010 their water tables were 10-20 cm below
ground in early summer and dropped to approximately 75 cm in late summer. Eleocharis
palustris occurred in locations that were saturated in early 2009, but the water tables dropped
21
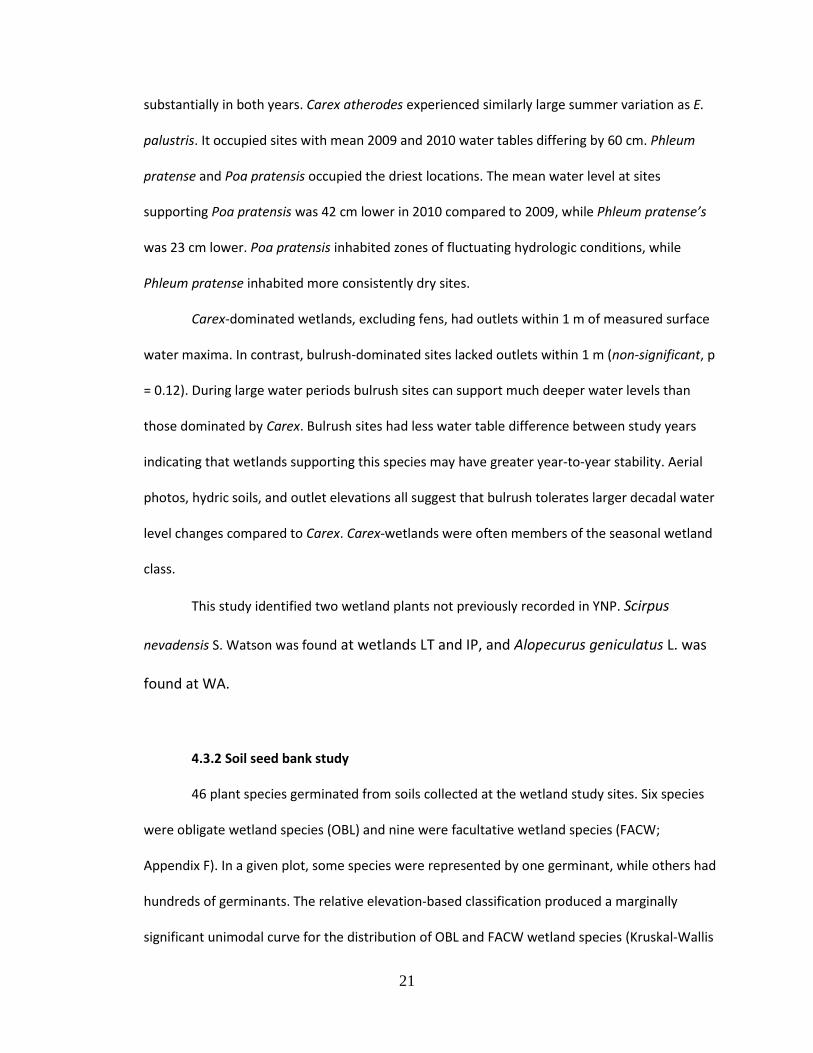
substantially in both years. Carex atherodes experienced similarly large summer variation as E.
palustris. It occupied sites with mean 2009 and 2010 water tables differing by 60 cm. Phleum
pratense and Poa pratensis occupied the driest locations. The mean water level at sites
supporting Poa pratensis was 42 cm lower in 2010 compared to 2009, while Phleum pratense’s
was 23 cm lower. Poa pratensis inhabited zones of fluctuating hydrologic conditions, while
Phleum pratense inhabited more consistently dry sites.
Carex-dominated wetlands, excluding fens, had outlets within 1 m of measured surface
water maxima. In contrast, bulrush-dominated sites lacked outlets within 1 m (non-significant, p
= 0.12). During large water periods bulrush sites can support much deeper water levels than
those dominated by Carex. Bulrush sites had less water table difference between study years
indicating that wetlands supporting this species may have greater year-to-year stability. Aerial
photos, hydric soils, and outlet elevations all suggest that bulrush tolerates larger decadal water
level changes compared to Carex. Carex-wetlands were often members of the seasonal wetland
class.
This study identified two wetland plants not previously recorded in YNP. Scirpus
nevadensis S. Watson was found at wetlands LT and IP, and Alopecurus geniculatus L. was
found at WA.
4.3.2 Soil seed bank study
46 plant species germinated from soils collected at the wetland study sites. Six species
were obligate wetland species (OBL) and nine were facultative wetland species (FACW;
Appendix F). In a given plot, some species were represented by one germinant, while others had
hundreds of germinants. The relative elevation-based classification produced a marginally
significant unimodal curve for the distribution of OBL and FACW wetland species (Kruskal-Wallis

22
test, chi-square = 11.76, df = 6, p = 0.07). Significantly more wetland species germinated just
above the midpoint of the wetland bottom and upland boundary compared to the lowest three
and highest classes (Mann Whitney U test, z = 2.00-2.88, p = 0.01-0.05; Fig. 12).
5. DISCUSSION
Multiple lines of investigation helped identify the patterns and processes driving
wetland losses on YNP’s Northern Range. Wetland area and water level is clearly linked to
weather and climate patterns, and the wetland sizes measured in this study have likely occurred
multiple times during the past millennium. The first decades after YNP’s designation as a
national park coincide with the most prolonged wet period of the past 800 years, which may
have produced unusually large wetlands. YNP’s climate has also warmed and dried during the
last century, and continued warming could surpass the natural range of variation that occurred
within the tree ring record and could lead to unprecedentedly small wetland areas. Wetlands
serve a valuable role in maintaining ecosystem integrity in YNP, which is one of the last places in
the conterminous United States where natural ecosystem processes dominate. Declines in YNP’s
native species have been linked to wetland reduction (McMenamin et al., 2008; Proffitt et al.,
2010) and continued drying will endanger additional species and cause further environmental
changes, such as shifting fens from carbon sinks to carbon sources (Chimner and Cooper, 2003).
Each study wetland’s local watershed controlled its hydrologic regime. This is distinct
from the influence of the broader regional hydrologic patterns identified in other wetland
settings (Florin et al., 1993; Merkey, 2006; Fig. 1). Wetland areas vary with climate, including
those in YNP, the prairie potholes (Johnson et al. 2004, Niemuth et al. 2010), southern Alaska
(Klein et al. 2005), and Siberia (Smith et al. 2005). Similar to wetlands in Argentina’s Monte
Desert (Jobbágy et al., 2011) and Nebraska’s Sandhills (Winter, 1986), groundwater sustained

23
many YNP study wetlands. A few wetlands lacked groundwater contributions, similar to playas
of the southern American Great Plains (Smith, 2003) and vernal pools in California (Keeley and
Zedler, 1998). Two study wetlands have apparently maintained stable water levels for decades,
while others have varied substantially. Rarely do wetlands in such close proximity function as
differently as has been documented here. The various hydrologic regimes of Northern Range
wetlands influence local ecosystem processes including soil microbial environments and lichen,
vascular plant, and animal communities.
5.1 HYDROLOGICALLY-BASED WETLAND CLASSIFICATION
Classification was a practical tool for creating a conceptual framework to compare
Northern Range wetland hydrologic regimes. Study wetlands differed to a degree approaching
the national-scale variability documented in classifications from the United States (Brinson et al.,
1993; Cowardin et al., 1979), Spain (Florin et al., 1993) and Amazonia (Junk et al., 2011). The
shape-magnitude framework incorporated the important roles of timing and degree of water
table changes to identify seven wetland hydrologic classes. Hydric soils analysis substantiated
the wetland classification by showing that the identified classes have functioned distinctly for
decades. Wetlands from the seasonal class provide habitat for species adapted to changing
surface water abundance, such as Carex atherodes, Carex utriculata and YNP’s four native
amphibians. The S.V. wetland class included large wetlands with multiple water sources.
Consistent saturation has allowed P.R. wetlands to accumulate organic matter and create peat
soils. Three of the five wetlands in the I.V. class were peatlands with groundwater inputs that
persisted for longer than those in the P.R. class. The two other I.V. sites were both closed basins
with mineral soil, but they differed from the M.R. and seasonal classes by having more
persistent groundwater inputs. Wetlands in the stable class were uncommon across the
24
Northern Range but may serve as isolated habitat refuges for wetland-dependent flora and
fauna during exceptionally dry times.
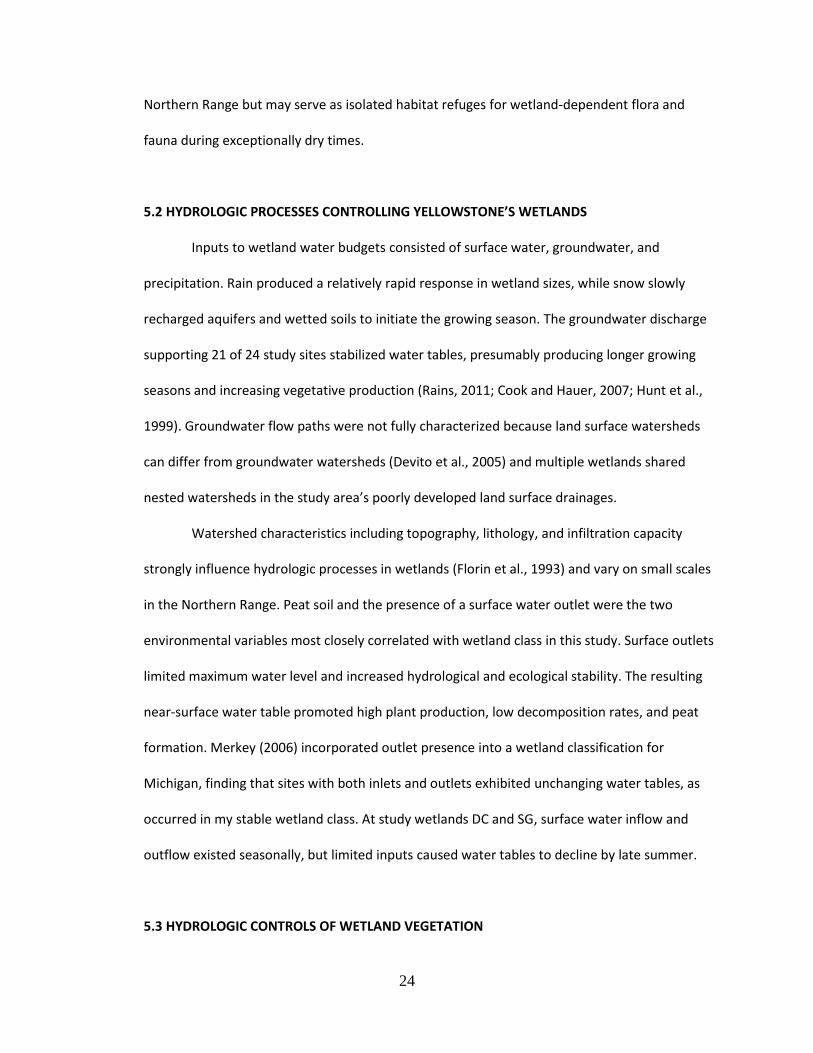
5.2 HYDROLOGIC PROCESSES CONTROLLING YELLOWSTONE’S WETLANDS
Inputs to wetland water budgets consisted of surface water, groundwater, and
precipitation. Rain produced a relatively rapid response in wetland sizes, while snow slowly
recharged aquifers and wetted soils to initiate the growing season. The groundwater discharge
supporting 21 of 24 study sites stabilized water tables, presumably producing longer growing
seasons and increasing vegetative production (Rains, 2011; Cook and Hauer, 2007; Hunt et al.,
1999). Groundwater flow paths were not fully characterized because land surface watersheds
can differ from groundwater watersheds (Devito et al., 2005) and multiple wetlands shared
nested watersheds in the study area’s poorly developed land surface drainages.
Watershed characteristics including topography, lithology, and infiltration capacity
strongly influence hydrologic processes in wetlands (Florin et al., 1993) and vary on small scales
in the Northern Range. Peat soil and the presence of a surface water outlet were the two
environmental variables most closely correlated with wetland class in this study. Surface outlets
limited maximum water level and increased hydrological and ecological stability. The resulting
near-surface water table promoted high plant production, low decomposition rates, and peat
formation. Merkey (2006) incorporated outlet presence into a wetland classification for
Michigan, finding that sites with both inlets and outlets exhibited unchanging water tables, as
occurred in my stable wetland class. At study wetlands DC and SG, surface water inflow and
outflow existed seasonally, but limited inputs caused water tables to decline by late summer.
5.3 HYDROLOGIC CONTROLS OF WETLAND VEGETATION
25
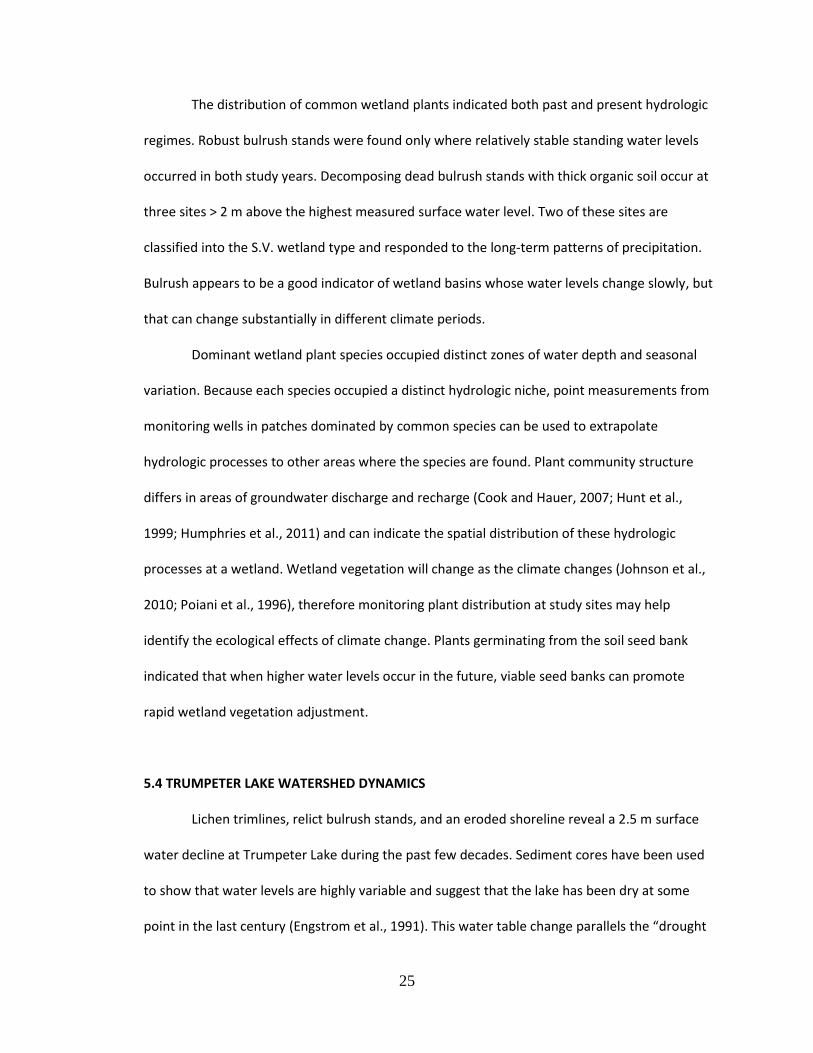
The distribution of common wetland plants indicated both past and present hydrologic
regimes. Robust bulrush stands were found only where relatively stable standing water levels
occurred in both study years. Decomposing dead bulrush stands with thick organic soil occur at
three sites > 2 m above the highest measured surface water level. Two of these sites are
classified into the S.V. wetland type and responded to the long-term patterns of precipitation.
Bulrush appears to be a good indicator of wetland basins whose water levels change slowly, but
that can change substantially in different climate periods.
Dominant wetland plant species occupied distinct zones of water depth and seasonal
variation. Because each species occupied a distinct hydrologic niche, point measurements from
monitoring wells in patches dominated by common species can be used to extrapolate
hydrologic processes to other areas where the species are found. Plant community structure
differs in areas of groundwater discharge and recharge (Cook and Hauer, 2007; Hunt et al.,
1999; Humphries et al., 2011) and can indicate the spatial distribution of these hydrologic
processes at a wetland. Wetland vegetation will change as the climate changes (Johnson et al.,
2010; Poiani et al., 1996), therefore monitoring plant distribution at study sites may help
identify the ecological effects of climate change. Plants germinating from the soil seed bank
indicated that when higher water levels occur in the future, viable seed banks can promote
rapid wetland vegetation adjustment.
5.4 TRUMPETER LAKE WATERSHED DYNAMICS
Lichen trimlines, relict bulrush stands, and an eroded shoreline reveal a 2.5 m surface
water decline at Trumpeter Lake during the past few decades. Sediment cores have been used
to show that water levels are highly variable and suggest that the lake has been dry at some
point in the last century (Engstrom et al., 1991). This water table change parallels the “drought

26
and deluge” conditions in semi-permanent wetlands of the prairie potholes (Johnson et al.,
2004). Ks values in the Trumpeter Lake watershed were on the order of dm/d at the land surface
and cm/d at 1-2 m depth, similar to values recorded in glacial till in the United Kingdom
(Cuthbert et al., 2010) and the prairie pothole region (van der Kamp and Hayashi, 2009). Higher
Ks surface values may result from the abundance of near-surface macropores created by root
channels and burrowing animals (Cuthbert et al., 2010; Todd et al., 2006). Near-surface Ks values
encompass only a fraction of the till’s thickness (K. Pierce, pers. comm.), but the bulk of water
movement is likely within this section due to decreasing Ks with depth in till aquifers (van der
Kamp and Hayashi, 2009). Groundwater discharging southeast of Trumpeter Lake may be
emerging where a zone of thin till permits water expulsion from the underlying bedrock (Todd et
al., 2006). However, chemical analysis of this water indicated that its origin is more likely from
the surficial till aquifer. A model of the lake’s water budget would help to analyze lake volume
variations, but a robust model calls for greater resolution of aquifer thickness, Ks variability, and
watershed ET.
The highest recorded population of Northern Range bison (Wallen, 2010) appears to be
having destructive effects on the Trumpeter Lake area vegetation and soil, likely driving
vegetation changes, denuding and eroding the land surface, and altering water infiltration. Bison
hooves sink > 30 cm into lake edge soil, promoting erosion. Rocks located between the former
and current lake perimeters have rust-colored stains on their bases, suggesting they were
recently beneath the soil surface and have been exposed by erosion. In addition, dead bulrush
2.0 m above the modern lake surface occurs in isolated clumps 20 cm above the surrounding
ground surface. All contemporary bulrush stands are comprised of homogenous clones that
cover the ground in dense continuous carpets, not clumps, indicating that a strong root system
and slow decomposition have prevented soil erosion at the dead bulrush locations. Additionally,

27
vegetation colonizing the zone between former and current Trumpeter Lake perimeters consists
of low-diversity stands of invasive Hordeum jubutum, Cirsium arvense, and Argentina anserina.
5.5 WEATHER, CLIMATE, AND WETLAND AREA CHANGES THROUGH TIME
Evidence on the Northern Range indicates that wetland water levels have declined, but
the processes of drying have varied by wetland. Seasonal wetlands had the greatest stage
changes during 2009-2010 and responded to early summer rains with >50 cm water table
increases. In contrast, wetlands in the stable, P.R., and I.V. classes exhibited little response to
rain events. These sites either had surface water outlets or were closed basins that buffered
response to individual precipitation inputs. Aerial photograph analysis indicated substantial
variability in water abundance, suggesting that in the future air photos should be taken over
broad spatiotemporal scales and at the same time each year (Niemuth et al., 2010). Some
wetlands revealed undetectable connections to precipitation in aerial photograph analysis, even
though it undoubtedly affects them. This could be due to the time scale on which a wetland’s
hydrologic regime functions being outside of the scale analyzed in aerial photos, or due to
interacting landscape factors. For example, WA is a basin located at the base of a bedrock
outcrop that may accumulate wind-blown snow (e.g., Rains, 2011).
Although watershed properties play an integral role in creating a wetland’s hydrologic
regime, it is likely that at larger time scales climate is more important (Laize and Hannah, 2010).
Data from the past century support the idea that climate change is responsible for wetland loss.
A warming trend has occurred in YNP, including exacerbated changes since the 1980s
documented here and by others (McMenamin et al., 2008; Wilmers and Getz, 2005). Johnson et
al. (2010) modeled climate change’s effects on wetlands of variable permanence, finding that
the less permanent sites (e.g. seasonal) are more resilient to climate change than more

28
permanent ones (e.g., S.V. and P.R.). This was because of the latter’s support from groundwater
and increased evapotranspiration losses from surface water persisting through summer.
Seasonal class wetlands can change from their maximum water extent to dry within 1-2 years,
but their flora and fauna are adapted to this variability. However, it is likely that during the
recent multi-decadal drying, P.R., S.V., and I.V. class wetlands have become drier as well. Under
projected climate changes, the growing season’s start and the timing of seasonal water table
decline will occur earlier, leading to additional drying, organic matter decomposition, and
wetland destabilization. Non-linear or threshold responses (Burkett et al. 2005) may limit fens’
ability to sequester carbon. Climate data reveal that during the past 115 years YNP has warmed
and dried, but tree ring data from Gray et al. (2007) through 1998 show that the recent dry spell
has been surpassed multiple times in the past 800 years. Since 1998 the Northern Range has
recorded a mean of 86% of historic annual precipitation, revealing further drying since this
dataset was collected. However, it is unlikely that 12 moderately dry years have shifted the
system to an unprecedented state. Gray et al. (2007) also document that the late 19th and early
20th centuries experienced the most prolonged wet cycle of the last 800 years. This suggests that
efforts to revert Northern Range wetland abundance to the pre-climate change era may be a
misguided attempt to reclaim an exceptionally wet “reference state”.
Wetland changes have been poorly documented because of the multitude of wetlands
on the landscape and the investment required to monitor even a single site. Lentic wetlands and
lotic waterways, although inherently different, each are driven by groundwater regimes that are
influenced by climate. This study suggests that Yellowstone River discharge data is a useful
proxy for wetland surface water area on the Northern Range. Comparison in other regions
should investigate the generality of this relationship. This study and others (McMenamin et al.,
2008; Stewart et al., 2005) have shown Rocky Mountain river hydrographs shifting to earlier

29
peaks, and Stewart et al. (2004) projected further advancement by 30-40 days throughout the
West. This hydrologic shift would initiate major ecosystem changes in wetlands, where the
water table position relative to the land surface is critically important to ecological processes.
6. CONCLUSIONS
Wetlands on Yellowstone’s Northern Range have declined in area during the recent
past, but the evidence suggests that current conditions are within the natural range of variation
for the past 800 years. Furthermore, it is often assumed that when Westerners arrived, YNP’s
landscape was in a relatively pristine state of equilibrium. However, this was a period of water
abundance. Weather patterns naturally oscillate between warm-dry and cool-wet conditions,
and the warmer and drier conditions of the last several decades have reduced wetland area and
surface water levels. If the recent climate trajectory continues, wetlands will dry further,
removing critical habitat for native species.
The research approach taken here has created a multifaceted perspective of YNP’s
recently dried wetlands. A combination of hydrology, soils, vegetation, and climate
investigations were used to synthesize why, how, and to what degree wetland changes have
occurred. Monitoring well data, aerial photographs, hydric soils, bulrush vegetation, and lichen
trimlines all illuminated the patterns and magnitudes of wetland changes. The hydrologic
wetland classification aided in creating an understanding of why these patterns have occurred.
Wetlands in different classes are differentially vulnerable to forecasted climatic changes, and
this should be considered in management. Wetlands from classes I.V., S.V., M.R., and P.R. were
relatively resilient to the different 2009 and 2010 weather patterns, indicating that longer-term
climatic processes more likely affect their water levels. If YNP climate continues to warm and

30
dry, wetlands in these classes and their associated ecological functions (e.g. carbon
sequestration, amphibian breeding, trumpeter swan nesting, etc.) will be vulnerable.
Preservation of landscape-scale ecological processes is a primary goal of the National
Park Service, and wetland health serves a central role in this endeavor. Two years of data were
collected in this study, but a thorough hydrologic study necessitates longer-term data collection
and analysis. My analyses indicate that wetland conditions such as those in the S.V. class may be
relatively common; however, decadal changes have affected our perception of the significance
of their drying. Wetlands from the seasonal, P.R., and I.V. classes formed a continuum from low
to high permanence. If these wetlands shift down a permanence class it could have dramatic
ecosystem consequences, including loss of peatlands that formed over millennia.
Climate change was the primary candidate causing wetland change addressed here, but
other factors should also be considered. YNP’s dynamic geology is a force underlying all surficial
processes in the Northern Range, and unprecedentedly high bison populations affect wetlands
by increasing the rate of soil erosion and vegetation change. Topsoil erosion should be
monitored in the Little America area because losing this relatively fertile soil may further
degrade these wetland ecosystems. Wetlands serve a critical role on the Northern Range
landscape, and we should continue to monitor them to recognize if-and-when conditions
surpass the ecosystem’s capacity to adjust.

31
7. REFERENCES
Acreman, M.C., Blake, J.R., Booker, D.J., Harding, R.J., Reynard, N., Mountford, J.O., Stratford,
C.J., 2009. A simple framework for evaluating regional wetland ecohydrological response to climate change with case studies from Great Britain. Ecohydrology 2, 1-17.
ASTM International, 2003. D3385-03: Standard test method for infiltration rate of soils in field using double-ring infiltrometer, 7 p., Washington, D.C.
Bartlein, P.J., Whitlock, C., Shafer, S.L., 1997. Future climate in the Yellowstone National Park region and its potential impact on vegetation. Conservation Biology 11 (3), 782–792.
Bates, B.C., Kundzewicz, Z.W., Wu, S., Palutikof, J.P., 2008. Climate Change and Water. Technical Paper of the Intergovernmental Panel on Climate Change, IPCC Secretariat, Geneva, 210 p.
Belcher, W.R., Bedinger, M.S., Back, J.T., Sweetkind, D.S., 2009. Interbasin flow in the Great Basin with special reference to the southern Funeral Mountains and the source of Furnace Creek springs, Death Valley, California, US. Journal of Hydrology 369 (1-2), 30-43.
Boedeltje, G., ter Heerdt, G., Bakker, J., 2002. Applying the seedling-emergence method under waterlogged conditions to detect the seed bank of aquatic plants in submerged sediments. Aquatic Botany 72 (2), 121-128.
Bower, D., Hannah, D.M., McGregor, G.R., 2004. Techniques for assessing the climatic sensitivity of river flow regimes. Hydrological Processes 18, 2515-2543.
Brinson, M.M., 1993. A hydrogeomorphic classification for wetlands. U.S. Army Corps of Engineers Wetlands Research Program Technical Report WRP-DE-4. 103 p.
Brooks, R.T., 2000. Annual and seasonal variation and the effects of hydroperiod on benthic macroinvertebrates of seasonal forest (“vernal”) ponds in central Massachusetts, USA. Wetlands 20, 707-715.
Brooks, R.T., 2004. Weather-related effects on woodland vernal pool hydrology and hydroperiod. Wetlands 24 (1), 104-114.
Brooks, R.T., 2009. Potential impacts of global climate change on the hydrology and ecology of ephemeral freshwater systems of the forests of the northeastern United States. Climatic Change 95, 469-483.
Carpenter, S.R., Fisher, S.G., Grimm, N.B., Kitchell, J.F., 1992. Global change and freshwater ecosystems. Annual Review of Ecology and Systematics 23, 119–139.
Chimner, R.A., Cooper, D.J., 2003. Influence of water table levels on CO2 emissions in a Colorado subalpine fen: an in situ microcosm study. Soil Biology and Biochemistry 35 (3), 345-351.
32
Cook, B.J., Hauer, F.R., 2007. Effects of hydrologic connectivity on water chemistry, soils, and vegetation structure and function in an intermontane depressional wetland landscape. Wetlands 27 (3), 719–738.
Cowardin, L.M., Carter, V., Golet, F.C., LaRoe, E.T., 1979. Classification of wetlands and deepwater habitats of the United States. U.S. Department of the Interior, Fish and Wildlife Service, Washington, D.C. 131 p.
Cuthbert, M.O., Mackay, R., Tellam, J.H., Thatcher, K.E., 2010. Combining unsaturated and saturated hydraulic observations to understand and estimate groundwater recharge through glacial till. Journal of Hydrology 391 (3-4), 263-276.
Dahl, T.E., 2011. Status and trends of wetlands in the conterminous United States 2004 to 2009. U.S. Department of the Interior, Fish and Wildlife Service, Washington, D.C. 108 p.
De’ath, G., Fabricius, K., 2000. Classification and regression trees: A powerful yet simple technique for ecological data analysis. Ecology 81 (11), 3178-3192.
Devito, K., Creed, I., Gan, T., Mendoza, C., Petrone, R., Silins, U., Smerdon, B., 2005. A framework for broad-scale classification of hydrologic response units on the Boreal Plain: is topography the last thing to consider? Hydrological Processes 19 (8), 1705-1714.
Dingman, S.L., 2002, Physical Hydrology. Vaveland Press, Long Grove, IL.
Engstrom, D.R., Whitlock, C., Fritz, S.C., Wright, H.E., 1991. Recent environmental changes inferred from the sediments of small lakes in Yellowstone’s northern range. Journal of Paleolimnology 5 (2), 139-174.
ESRI, 2010. ArcGIS Desktop. Redlands, CA.
Fetter, C.W., 1994. Applied Hydrogeology. Macmillan College, New York.
Florin, M., Montes, C., Rueda, F., 1993. Origin, hydrologic functioning, and morphometric characterisitcs of small, shallow, semiarid lakes (lagunas) in La Mancha, central Spain. Wetlands 13 (4), 247-259.
Gardner, P.W., Susong, D.D., Solomon, K.D., Heasler, H., 2010. Snowmelt hydrograph interpretation: Revealing watershed scale hydrologic characteristics of the Yellowstone volcanic plateau. Journal of Hydrology 383 (3-4), 209–222.
Gee, G., Bauder, J., 1979. Particle-size analysis by hydrometer - simplified method for routine textural analysis and a sensitiveity test of measurement parameters. Soil Science Society of America Journal 43 (5), 1004-1007.
Gray, S.T., Graumlich, L.J., Betancourt, J.L., 2007. Annual precipitation in the Yellowstone National Park region since AD 1173. Quaternary Research 68 (1), 18–27.
Hale, M.E., 1974. The Biology of Lichens. Edward Arnold, London.

33
Hannah, D., Smith, B., Gurnell, A., McGregor, G., 2000. An approach to hydrograph classification. Hydrological Processes 14 (2), 317-338.
Hayashi, M., van der Kamp, G., 2000. Simple equations to represent the volume-area-depth relations of shallow wetlands in small topographic depressions. Journal of Hydrology 237 (1-2), 74-85.
Humphries, M.S., Kindness, A., Ellery, W.N., Hughes, J.C., Bond, J.K., Barnes, K.B., 2011, Vegetation influences on groundwater salinity and chemical heterogeneity in a freshwater, recharge floodplain wetland, South Africa. Journal of Hydrology 411 (1-2), 130-139.
Hunt, R., Krabbenhoft, D., Anderson, MP, 1996. Groundwater inflow measurements in wetland systems. Water Resources Research 32 (3), 495-507.
Hunt, R., Walker, J., Krabbenhoft, D., 1999. Characterizing hydrology and the importance of ground-water discharge in natural and constructed wetlands. Wetlands 19 (2), 458-472.
Iglesias, P., Jorquera, H., Palma, W., 2006. Data analysis using regression models with missing observations and long-memory: an application study. Computational Statistics & Data Analysis 50 (8), 2028-2043.
Jobbágy, E., Nosetto, M., Villagra, P., Jackson, R., 2011. Water subsidies from mountains to deserts: their role in sustaining groundwater-fed oases in a sandy landscape. Ecological Applications 21 (3), 678–694.
Johnson, W. C., Werner, B., Guntenspergen, G.R., Voldseth, R.A., Millett, B., Naugle, D.E., Tulbure, M., Carroll, R.W.H., Tracy, J., and Olawsky, C., 2010. Prairie Wetland Complexes as Landscape Functional Units in a Changing Climate. BioScience 60, 128-140.
Johnson, W.C., Boettcher, S.E., Poiani, K.A., Guntenspergen, G., 2004. Influence of weather extremes on the water levels of glaciated prairie wetlands. Wetlands 24 (2), 385–398.
Jolly, I.D., McEwan, K.L., Holland, K.L., 2008. A review of groundwater-surface water interactions in arid/semi-arid wetlands and the consequences of salinity for wetland ecology. Ecohydrology 1, 43-58.
Jones, R.D., Varley, J.D., Gresswell, R.E., Jennings, D.E., Rubrecht, S.M., 1978. Fishery and aquatic management program in Yellowstone National Park, Wyoming. U.S. Fish and Wildlife Service Technical Report for 1978. Yellowstone National Park, WY.
Junk, W.J., Fernandez Piedade, M.T., Schoengart, J., Cohn-Haft, M., Adeney, J.M., Wittmann, F., 2011. A Classification of Major Naturally-Occurring Amazonian Lowland Wetlands. Wetlands 31 (4), 623-640.
van der Kamp, G., Hayashi, M., 2009. Groundwater-wetland ecosystem interaction in the semiarid glaciated plains of North America. Hydrogeology Journal 17 (1), 203-214.

34
Klein, E., Berg, E.E., Dial, R., 2005. Wetland drying and succession across the Kenai Peninsula Lowlands, south-central Alaska. Canadian Journal of Forest Research 35 (8), 1931–1941.
LaBaugh, J.W., 1987. Hydrology and chemistry of selected prairie wetlands in the Cottonwood Lake area, Stutsman County, North Dakota, 1979-82. U.S. Geological Survey Professional Paper 1431. Washington, D.C.
LaBaugh, J.W., Winter, T.C., Rosenberry, D.O., 1998. Hydrologic Functions of Prairie Wetlands. Great Plains Research 8 (1), 17-37.
Laize, C.L.R., Hannah, D.M., 2010. Modification of climate-river flow associations by basin properties. Journal of Hydrology 389 (1-2), 186-204.
Lemly, J.M., Cooper, D.J., 2011. Multiscale factors control community and species distribution in mountain peatlands. Botany 89, 689-713.
Long, K., Nestler, J., 1996. Hydroperiod changes as clues to impacts on Cache River Riparian Wetlands. Wetlands 16 (3), 379-396.
Marsh, J.E., Timoney, K.P., 2005. How long must northern saxicolous lichens be immersed to form a waterbody trimline? Wetlands 25, 495-499.
McCune, B., Mefford, M.J., 2006. PC-ORD. MjM Software, Gleneden Beach, OR.
McMenamin, S.K., Hadly, E.A., Wright, C.K., 2008. Climatic change and wetland desiccation cause amphibian decline in Yellowstone National Park. Proceedings of the National Academy of Sciences 105 (44), 16988-16993.
Merkey, D.H., 2006. Characterization of wetland hydrodynamics using HGM and subclassification methods in southeastern Michigan, USA. Wetlands 26 (2), 358–367.
Mitsch, W.J., Gosselink, J.G., 2000. Wetlands. John Wiley & Sons, New York.
National Climatic Data Center, 2011. NOAA. http://www.ncdc.noaa.gov.
Niemuth, N.D., Wangler, B., Reynolds, R.E., 2010. Spatial and Temporal Variation in Wet Area of Wetlands in the Prairie Pothole Region of North Dakota and South Dakota. Wetlands 30, 1053-1064.
Pegram, GC, Pegram, GGS, 1993. Integration of rainfall via multiquadric surfaces over polygons. Journal of Hydraulic Engineering 119 (2), 151-163.
Pierce, K.L., 1979. History and dynamics of glaciation in the northern Yellowstone National Park area. U.S. Geological Survey Professional Paper 729-F. Washington, D.C.
Pilon, P., Yue, S., 2002. Detecting climate-related trends in streamflow data. Water Science and Technology 45 (8), 89-104.

35
Pochop, L.O., Borrelli, K., Hasfurther, V., 1985. Design characteristics for evaporation ponds in Wyoming. Final Report submitted to the Wyoming Water Research Center, Laramie, WY.
Poff, N., Brinson, M.M., Day, J.W., 2002. Aquatic ecosystems and global climate change. Pew Center on Global Climate Change, Arlington, VA. 44 p.
Poiani, K., Johnson, W.C., Swanson, G., Winter, T.C., 1996. Climate change and northern prairie wetlands: Simulations of long-term dynamics. Limnology and Oceanography 41 (5), 871-881.
Proffitt, K.M., McEneaney, T.P., White, P.J., Garrott, R.A., 2010. Productivity and Fledging Success of Trumpeter Swans in Yellowstone National Park, 1987–2007. Waterbirds 33, 341-348.
Pyke, C., 2004. Simulating vernal pool hydrologic regimes for two locations in California, USA. Ecological Modelling 173 (2-3), 109-127.
R Foundation for Statistical Computing, 2009. R: A language and environment for statistical computing, Vienna, Austria.
Rains, M.C., 2011. Water Sources and Hydrodynamics of Closed-Basin Depressions, Cook Inlet Region, Alaska. Wetlands 31, 377-387.
Rawls, W., Brakensiek, D., Saxton, K., 1982. Estimation of soil-water properties: Transactions of the ASAE 25 (5), 1316-1328.
Roberts, H.A., 1981. Seed banks in soils, in: Advances in Applied Biology. Academic Press, Cambridge, 55 p.
Rosenberry, D., Winter, T.C., 1997. Dynamics of water-table fluctuations in an upland between two prairie-pothole wetlands in North Dakota. Journal of Hydrology 191 (1-4), 266-289.
SAS Institute Inc., 2010. SAS Enterprise Guide, Cary, North Carolina.
Schot, P., Winter, T., 2006. Groundwater-surface water interactions in wetlands for integrated water resources management - Preface. Journal of Hydrology 320 (3-4), 261-263.
Shaffer, P.W., Cole, C.A., Kentula, M.E., Brooks, R.P., 2000. Effects of measurement frequency on water-level summary statistics. Wetlands 20, 148-161.
Smith, L., Sheng, Y., MacDonald, G., Hinzman, L., 2005. Disappearing Arctic lakes. Science 308 (5727), 1429-1429.
Smith, L.M., 2003. Playas of the Great Plains. University of Texas Press, Austin, TX.
Sorenson, L., Goldberg, R., Root, T., Anderson, M.G., 1998. Potential effects of global warming on waterfowl populations breeding in the Northern Great Plains. Climatic Change 40 (2), 343-369.
36
Stewart, I., Cayan, D., Dettinger, M., 2004. Changes in snowmelt runoff timing in western North America under a “business as usual” climate change scenario. Climatic Change 62 (1-3), 217-232.
Stewart, I., Cayan, D., Dettinger, M., 2005. Changes toward earlier streamflow timing across western North America. Journal of Climate 18 (8), 1136-1155.
Therneau, T.M., Atkinson, B., 2009. R port by Brian Ripley. rpart: Recursive Partitioning. R package version 3.1-45.
Timoney, K.P., Marsh, J., 2004. Lichen trimlines in northern Alberta: establishment, growth rates, and historic water levels. The Bryologist 107 (4), 429–440.
Tiner, R.W., 2003. Geographically isolated wetlands of the United States. Wetlands 23 (3), 494–516.
Todd, A., Buttle, J., Taylor, C., 2006. Hydrologic dynamics and linkages in a wetland-dominated basin. Journal of Hydrology 319 (1-4), 15–35.
van Tongeren, O.F.R., 1987. Cluster analysis, in: Data Analysis in Community and Landscape Ecology, Cambridge University Press, Cambridge, 174-203 p.
Tsai, J.S., Venne, L.S., McMurry, S.T., Smith, L.M., 2007. Influences of land use and wetland characteristics on water loss rates and hydroperiods of playas in the Southern High Plains, USA. Wetlands 27 (3), 683–692.
Upton, K.A., Jackson, C.R., 2011. Simulation of the spatio-temporal extent of groundwater flooding using statistical methods of hydrograph classification and lumped parameter models. Hydrological Processes 25, 1949-1963.
United States Army Corps of Engineers, 2010. Regional supplement to the Corps of Engineers wetland delineation manual: Western mountains, valleys, and coast region (version 2.0). eds. Wakeley, J.S., Lichvar, R.W., Noble, C.V. ERDC/EL TR-10-3. US Army Engineer Research and Development Center, Vicksburg, MS.
USDA, NRCS, 2011. The PLANTS Database. http://plants.usda.gov. National Plant Data Team, Greensboro, NC.
Vega, M.R., Sierra, J.N., 1970. Population of weed seeds in a lowland rice field. Philipp. Agricst. 54, 1-7.
Wallen, R., 2010. Abundance and Distribution of Yellowstone Bison, July 2010. Yellowstone Center for Resources, Yellowstone National Park, WY.
Westerling, A.L., Turner, M.G., Smithwick, E.A.H., Romme, W.H., Ryan, M.G., 2011. Continued warming could transform Greater Yellowstone fire regimes by mid-21st century. Proceedings of the National Academy of Sciences 108, 13165-13170.

37
Williamson, C.E., Dodds, W., Kratz, T.K., Palmer, M.A., 2008. Lakes and streams as sentinels of environmental change in terrestrial and atmospheric processes. Frontiers in Ecology and the Environment 6, 247-254.
Wilmers, C.C., Getz, W.M., 2005. Gray Wolves as Climate Change Buffers in Yellowstone. PLoS Biology 3, e92.
Winter, T.C., 2000. The vulnerability of wetlands to climate change: a hydrologic landscape perspective. Journal of the American Water Resources Association 36 (2), 305–311.
Winter, T.C., 1986. Effect of groundwater recharge on configuration of the water-table beneath sand dunes and on seepage in lakes in the Sandhills of Nebraska, USA. Journal of Hydrology 86 (3-4), 221-237.
Winter, T.C., 1999. Relation of streams, lakes, and wetlands to groundwater flow systems. Hydrogeology Journal 7, 28-45.
Winter, T.C., Rosenberry, D.O., 1995. The interaction of ground-water with prairie pothole wetlands in the Cottonwood Lake area, east-central North Dakota, 1979-1990. Wetlands 15 (3), 193-211.
Woo, M.K., Rowsell, R.D., 1993. Hydrology of a prairie slough. Journal of Hydrology 146, 175–207.
Wurster, F.C., Cooper, D.J., Sanford, W.E., 2003. Stream/aquifer interactions at Great Sand Dunes National Monument, Colorado: influences on interdunal wetland disappearance. Journal of Hydrology 271 (1-4), 77–100.
Wyman, T., 2011. 2010-2011 Annual Winter Trend Count of Northern Yellowstone Elk: Yellowstone Center for Resources, Yellowstone National Park, WY.
Wyoming Climate Atlas, 2008, Evaporation. http://www.wrds.uwyo.edu/sco/climateatlas/evaporation.html.
Yellowstone Center for Resources, 2009. Yellowstone soils GIS layer, Yellowstone National Park, WY.
Yellowstone National Park, 1997. Yellowstone’s Northern Range: complexity & change in a wildland ecosystem. National Park Service, Mammoth Hot Springs, WY.
Zedler, P., 2003. Vernal pools and the concept of “isolated wetlands”. Wetlands 23 (3), 597-607.
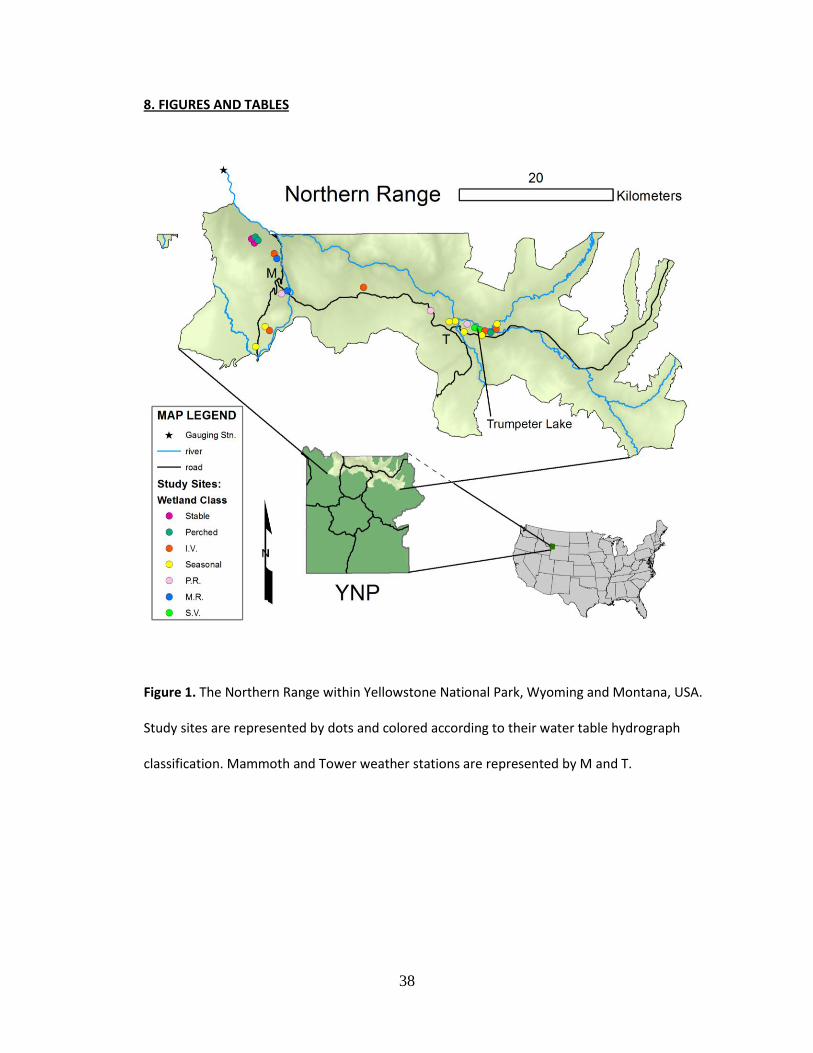
38
8. FIGURES AND TABLES
Figure 1. The Northern Range within Yellowstone National Park, Wyoming and Montana, USA.
Study sites are represented by dots and colored according to their water table hydrograph
classification. Mammoth and Tower weather stations are represented by M and T.

39
Figure 2. Cluster analysis results for the 80 wells analyzed using the shape-magnitude framework. A) dendrogram of hydrograph shape
with pruning at 50% similarity which produced 3 classes. B) dendrogram of magnitude with pruning at 40% similarity which produced
two classes. Note that the first two letters in well names are wetland IDs.

40
Figure 3. Water table elevations for the seven well classes during summers 2009 and 2010.
Lines are average weekly water table values for all wells in each class, except for the perched
class which depicts an example well that dried in June 2010. The S.V. wetland type described in
the Results was comprised of at least three of these well types. Each of these well classes was
developed into a unique wetland class except shape1-mag2, which was too uncommon (n = 6)
to constitute its own class. Bars represent weekly precipitation.
Jun
3Ju
n 10
Jun
17Ju
n 24
Jul 1
Jul 8
Jul 1
5Ju
l 22
Jul 2
9Aug
5Aug
12
Aug
19
May
13
May
20
May
27
Jun
3 J
un 1
0 J
un 1
7 J
un 2
4 J
ul 1
Jul
8 J
ul 1
5 J
ul 2
2 J
ul 2
9 A
ug 5
Aug
12
Aug
19
Weekly
Ppt. (
mm
)
0
20
40
60
Ele
v. above a
sta
ndard
ized d
atu
m (
cm
)
860
880
900
920
940
960
980
1000
seasonal
shape1-mag2
I.V.
P.R.
static
perched
M.R.
2009 2010

41

42
Figure 4. Panes A & B show cross sections of wetlands LT and DC. Solid lines represent ground surface, and dashed lines are water table
elevations on 10 June 2010 (grey) and 5 August 2010 (black). Water tables were interpolated from groundwater monitoring wells (thick bars).
Piezometers (thin bars) nested with wells reveal vertical hydrologic gradients. Note that piezometers at left in pane A show an upward
gradient, but all other piezometers show nominal vertical gradients. Bars indicate water level on 10 June (gray) and 5 August (black). Panes C
and D are hydrographs showing water level in wells and piezometers from A and B during summers 2009 and 2010. Solid lines are wells, and
dotted and dashed lines are piezometers nested with the well of the same color. Hydrograph colors correspond to the same colored wells
illustrated as dots on plan view insets in panes A and B. Labels in C and D correspond to well types; wetland LT was a S.V. wetland and DC was
a P.R. wetland. Hydrographs revealed characteristics of site hydrology, including locations that: spiked in response to rain (blue in C and D),
declined earlier in the drier 2010 (pink in C, all in D), had strong positive head (blue in C), had slowly-equilibrating piezometers that revealed a
low hydraulic conductivity layer (pink dash-dot in D), and did not spike in response to early summer rain because of surface outflow (all in D).

43
Figure 5. Cross section of Trumpeter Lake illustrating the water table on four dates in 2010.
Ground surface, the thick line, was determined from a topographic survey. Grey bars represent
monitoring wells, identified with stars on plan view inset showing all wells, which were used to
interpolate water tables. Trumpeter Lake had groundwater inflow from the south in early
summer, but by late summer a near-shore groundwater trough appeared. This indicates that the
lake shifted from a groundwater flow-through system to groundwater recharge on all sides.
Vertical exaggeration is 80:1.

44
Figure 6. Trumpeter Lake water table contours (m.a.s.l.) for summer 2010, interpolated from 15
monitoring wells. Through 15 July this was a flow-through wetland, with the water table
gradient from south to north. D) shows that in late summer surface water locally recharged
groundwater (black arrows), even though the larger flow system was still flow-through. Water
table elevation declined as the summer progressed beyond the early-June peak. Multiple
groundwater interpolation methods were explored (e.g. IDW, kriging, spline), however, I
manually delineated water table contours as this method is frequently more accurate (Bill
Sanford, pers. comm.).

45
Figure 7. Surface area-volume relationship at Trumpeter Lake during nine years. Areas were
derived from aerial photography (n = 8) and field data (n = 1). Corresponding volumes were
calculated by overlaying the lake area on a TIN.
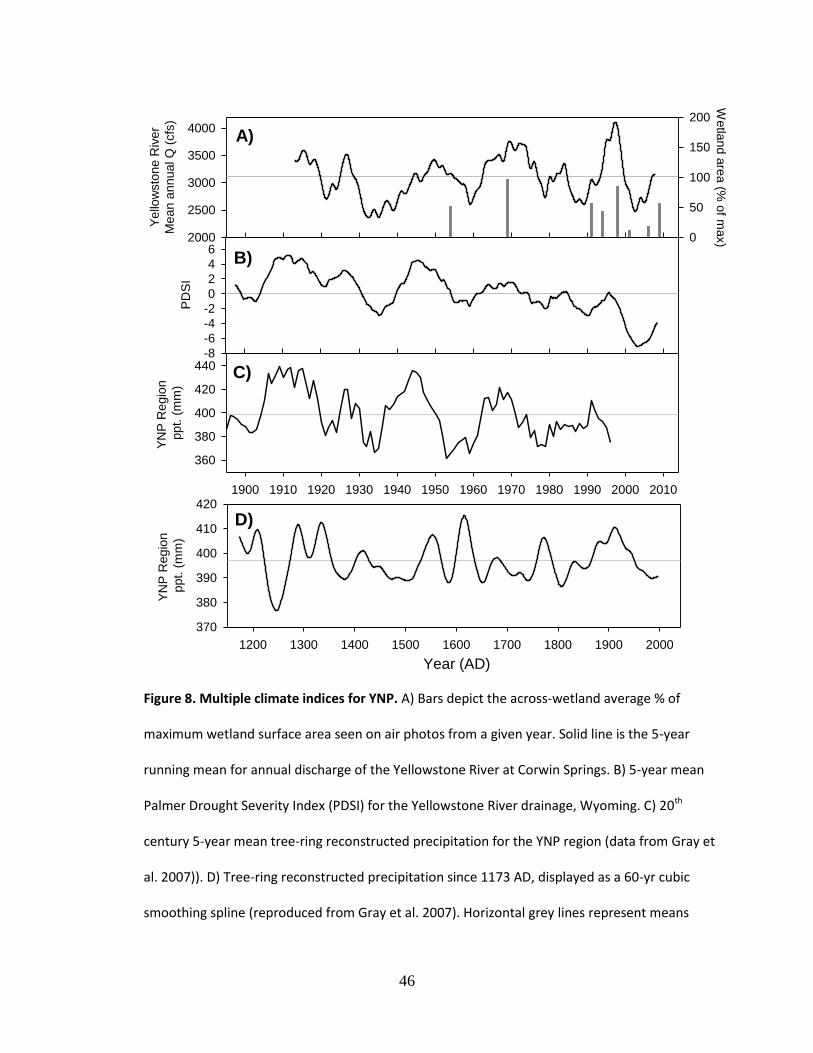
46
Figure 8. Multiple climate indices for YNP. A) Bars depict the across-wetland average % of
maximum wetland surface area seen on air photos from a given year. Solid line is the 5-year
running mean for annual discharge of the Yellowstone River at Corwin Springs. B) 5-year mean
Palmer Drought Severity Index (PDSI) for the Yellowstone River drainage, Wyoming. C) 20th
century 5-year mean tree-ring reconstructed precipitation for the YNP region (data from Gray et
al. 2007)). D) Tree-ring reconstructed precipitation since 1173 AD, displayed as a 60-yr cubic
smoothing spline (reproduced from Gray et al. 2007). Horizontal grey lines represent means
1900 1910 1920 1930 1940 1950 1960 1970 1980 1990 2000 2010
YN
P R
eg
ion
pp
t. (
mm
)
360
380
400
420
440
PD
SI
-8
-6
-4
-2
0
2
4
6
Ye
llow
sto
ne
Riv
er
Me
an
an
nu
al Q
(cfs
)
2000
2500
3000
3500
4000
We
tlan
d a
rea
(% o
f ma
x)0
50
100
150
200
Year (AD)
1200 1300 1400 1500 1600 1700 1800 1900 2000
YN
P R
eg
ion
pp
t. (
mm
)
370
380
390
400
410
420
A)
B)
C)
D)

47
during the plotted period in A, C, and D, while in B it depicts the PDSI average by definition, 0.
Note the unique x-axis for D.
Figure 9. Yellowstone River discharge shape-magnitude analysis classes. A) Mean annual
hydrograph of all wells constituting each of the four shape classes, termed according to their
timing of maximum discharge. B) Mean annual hydrograph of the 3 magnitude classes, big,
medium, and small.
Oct Nov Dec Jan Feb Mar Apr May Jun Jul Aug Sep
Me
an
Mo
nth
ly Q
(cfs
)
0
3000
6000
9000
12000
15000
Big
Medium
Small
z-s
co
re
-1
0
1
2
May
June-May
June
June-July
A)
B)

48
1910s 1920s 1930s 1940s 1950s 1960s 1970s 1980s 1990s 2000s
Fre
qu
en
cy (
ye
ars
)
0
1
2
3
4
5June-July
May
Figure 10. Chronology of the earliest and latest Yellowstone River runoff years, showing that
early runoff has been unusually prevalent recently. Note: 1) Bars do not sum to 10 because the
two middle classes were omitted for clarity; 2) The decade most closely resembling the 1990s
and 2000s is the 1930s, the Dust Bowl years; 3) There is substantial inter-decadal fluctuation and
no apparent 100-year trend. However, the 1970’s forward reveals a “slingshot” from late to
early peaks, presumably inciting wetland decline.

49
Figure 11. Water table hydrographs for the nine most prevalent plant species. Graphs illustrate
species’ water table means ± 1 standard deviation. Data are derived from averaging water tables
for all wells with ≥ 20% cover of the identified species.
Salix spp.
Wa
ter
tab
le h
eig
ht
ab
ove
gro
un
d (
cm
)
-150
-100
-50
0
Carex utriculata
-150
-100
-50
0
Schoenoplectus acutus
Poa pratensis
2009Jun
3
Jun
17
Jul 1
Jul 15
Jul 29
A
ug
12
--
----
----
- M
ay 1
3
M
ay 2
7
J
un
10
J
un
24
J
ul 8
Jul 22
Aug
5
Aug
19
-150
-100
-50
0
Eleocharis palustris
Carex pellita
2009
Jun
3
Jun
17
Jul 1
Jul 15
Jul 29
A
ug
12
--
----
----
- M
ay 1
3
M
ay 2
7
J
un
10
J
un
24
J
ul 8
Jul 22
Aug
5
Aug
19
-150
-100
-50
0
Carex aquatilis
2010 2010 2010
Pleum pratense
2009
Jun
3
Jun
17
Jul 1
Jul 15
Jul 29
A
ug
12
--
----
----
- M
ay 1
3
M
ay 2
7
J
un
10
J
un
24
J
ul 8
Jul 22
Aug
5
Aug
19
Carex atherodes
Eleocharis palustris

50
Plot position: percent from lowland to upland
0% 17-25% 33-40% 50% 60-67% 75-83% 100%
Num
ber
of w
etland
spe
cie
s g
erm
ina
ting
per
plo
t
0.0
0.5
1.0
1.5
2.0
a
a
a
ab
b
ab
a
Figure 12. Mean number of wetland species ± se germinating per plot in the soil seed bank
study. Bars represent the seven elevation classes, with the x-axis stratifying plots by their
percent from wetland bottom to upland. Mann Whitney U tests revealed that plots in the 60-
67% class germinated significantly more (p < 0.05) wetland plants than plots in the lowest three
and highest elevation classes.

51
Table 1. The 24 Northern Range study sites.
Wetland Name Wetland Acronym
Elev. (m) UTM E UTM N
n wells
Wetland Class
Big D BD 1875 546592 4974876 4 seasonal
Bighorn Marsh BM 1904 547949 4973587 6 seasonal
Blue-Green BG 1905 545970 4974936 5 seasonal
Brown Pond BP 1765 520612 4985821 3 perched
Bunsen East BE 2218 522447 4973863 5 I.V.
Bunsen West BW 2228 522035 4974291 5 seasonal
Chorus Pond CP 2241 520797 4971697 4 seasonal
Copper Rock CR 1887 550268 4973075 5 seasonal
Dead Willow DW 1776 520432 4985701 7 stable
Double Cub DC 2009 543547 4976370 4 P.R.
Island Pond IP 1890 552001 4974167 5 I.V.
Little Trumpeter LT 1861 549423 4973951 5 S.V.
Mammoth Bowl MB 1824 524980 4978500 4 M.R.
Meadowlark Commons MC 1769 520777 4985721 5 perched
Old Road OR 1791 523300 4983570 5 I.V.
Rainbow Lake RL 1792 520423 4985457 3 stable
Rye Pond RP 1887 524180 4978560 5 P.R.
Sandhill Nest SN 1864 548510 4974510 5 P.R.
Self-Guiding SG 2047 534864 4979149 5 I.V.
Slough View SV 1888 552075 4974492 5 seasonal
Trumpeter Feeder TF 1863 550155 4973559 4 I.V.
Trumpeter Lake TL 1860 549898 4973760 14 S.V.
Upper Slide US 1752 523565 4983271 4 M.R.
The Wallows WA 1884 551342 4973520 6 perched
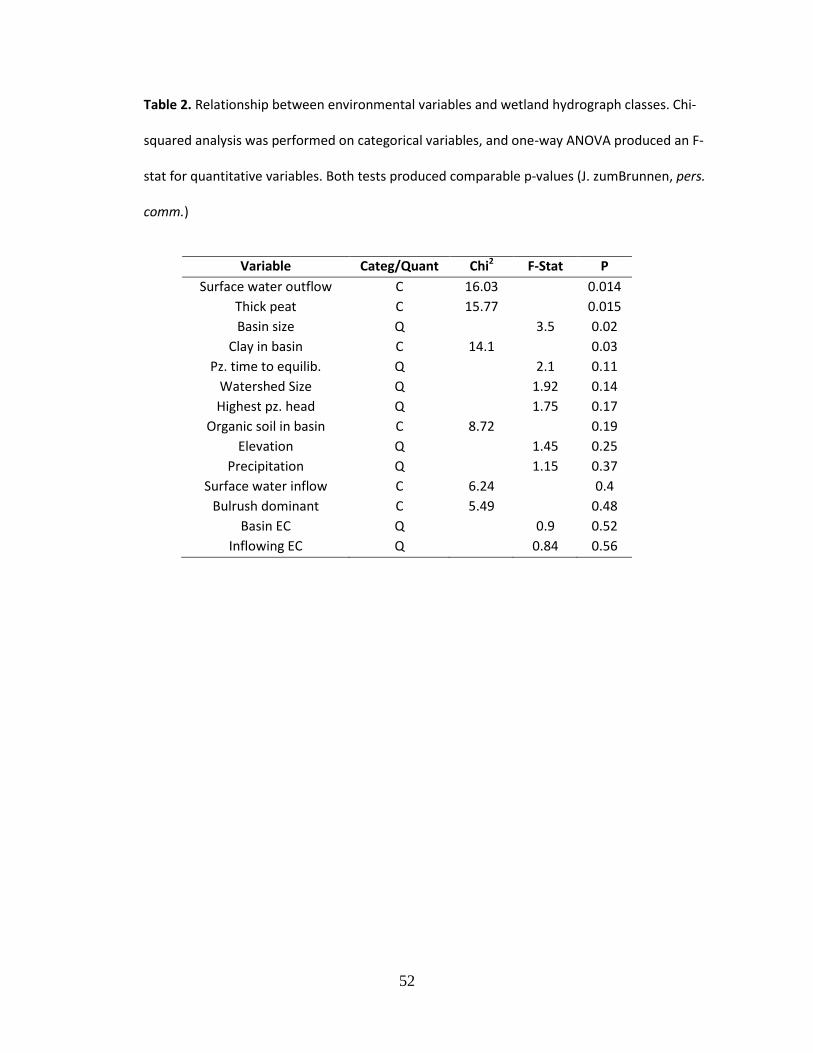
52
Table 2. Relationship between environmental variables and wetland hydrograph classes. Chi-
squared analysis was performed on categorical variables, and one-way ANOVA produced an F-
stat for quantitative variables. Both tests produced comparable p-values (J. zumBrunnen, pers.
comm.)
Variable Categ/Quant Chi2 F-Stat P
Surface water outflow C 16.03 0.014
Thick peat C 15.77 0.015
Basin size Q 3.5 0.02
Clay in basin C 14.1 0.03
Pz. time to equilib. Q 2.1 0.11
Watershed Size Q 1.92 0.14
Highest pz. head Q 1.75 0.17
Organic soil in basin C 8.72 0.19
Elevation Q 1.45 0.25
Precipitation Q 1.15 0.37
Surface water inflow C 6.24 0.4
Bulrush dominant C 5.49 0.48
Basin EC Q 0.9 0.52
Inflowing EC Q 0.84 0.56

53
Table 3. Relationship between wetland area and cumulative precipitation, determined from
aerial photo analysis. Wetland area and precipitation from the 2, 4, and 8 years previous to
photo date were compared via forward-step multiple regression for the eight photo years.
Results for a wetland’s most significant time step are reported if p < 0.10. No wetlands were
most closely related to the last 4 years.
Wetland Time step (yrs) F-value P-value
BD 0-2 8.32 0.028
IP 0-2 6.36 0.045
CR 0-2 3.92 0.095
LT 0-8 19.28 0.005
TL 0-8 58.19 0.0003
BM 0-8 9.17 0.023
CP 0-8 6.73 0.041
BG none - -
BP none - -
BW none - -
WA none - -
OR none - -
DW none - -
RL none - -
Table 4. Relationship between total precipitation and Trumpeter Lake’s area and volume for
time steps of the last 1, 2, … 10 years. Data were derived from lake sizes in nine years.
Ppt. time step Area R2 Vol. R2
1 Yr 0.33 0.47
2 yr 0.57 0.65
3 yr 0.78 0.79
4 yr 0.79 0.77
5 yr 0.86 0.81
6 yr 0.9 0.82
7 yr 0.92 0.87
8 yr 0.95 0.94
9 yr 0.89 0.87
10 yr 0.81 0.77

54
9. APPENDICES
APPENDIX A. Addendum to 2009-2010 Weather Report
Methods
Annual Summaries: Weather data are publicly available since 1931 for two Northern
Range weather stations within the study area, Mammoth and Tower (Fig. 1, NCDC 2011). Water
year 2009 and 2010 values for temperature, total precipitation, and snow were calculated from
summing (total precipitation and snow) or averaging (temperature) monthly values. 2009 and
2010 values were compared to mean values since 1931, the first year in which both Mammoth
and Tower have continuous weather data. To calculate weather values, I used all months with
published monthly data to determine monthly and annual averages. In the two months of 2009
(June and December) where Tower lacked data for both total precipitation and total snowfall, I
used a linear regression record extension technique calculated from Mammoth data to estimate
values.
Field Season Precipitation: I analyzed daily precipitation records for both Mammoth and
Tower for May through August of 2009 and 2010. Additionally, on May 16 2010 I installed a
HOBO tipping bucket rain gauge in the Trumpeter Lake watershed (UTM Zone 12N 549867 E,
4973438 N). This rain gauge was installed to get a better sense of a) rain inputs at our focal
study site, and b) precipitation spatial variability.
Results
Annual Summaries: Both study years were near average temperature, but 2009 was a
wetter year and 2010 a drier year (Table B1). 2009 surpassed the post-1931 average by 0.2°C,
while 2010 was 0.3°C cooler than average. Total precipitation in 2009 was 97% and snowfall was
120% of average, while in 2010 total precipitation was only 83% and snowfall 53% of average.

55
Field Season Precipitation: Precipitation is correlated between the Mammoth and Tower
weather stations (Pearson’s R correlation coefficient = 0.72). The largest rain event recorded
was 24 mm at Mammoth on 6 August 2009. Summer precipitation most frequently falls in the
form of convective summer thunderstorms, which can deliver isolated rain. Between May 13
and Aug 19, 2010 the three Northern Range precipitation gauges recorded between 105 mm
(Mammoth) and 123 mm (Tower). 48% of this precipitation fell between May 28 and June 10. A
water table increase was detected at wetlands after rain events (Fig. 3). The tipping bucket rain
gauge and the Tower weather station each recorded ≥ 1 mm rain event on the same day 19
times over the 96 day recording period. Additionally, the tipping bucket reached ≥ 1 mm 7 times
where Tower did not, and Tower recorded ≥ 1 mm 8 times where the tipping bucket did not.
Table A1. Temperature and precipitation deviation from historic average, 2009 and 2010. Mam
= Mammoth, Tow = Tower, NR = Northern Range value, the mean of Mammoth and Tower.
2009 2010
Mam Temp (°C) +0.2 -0.4 Tow Temp (°C) +0.2 -0.2 NR Temp (°C) +0.2 -0.3 Mam Ppt 97% 81% Tow Ppt 97% 85% NR Ppt 97% 83% Mam Snow 111% 45% Tow Snow 129% 60% NR Snow 120% 53%
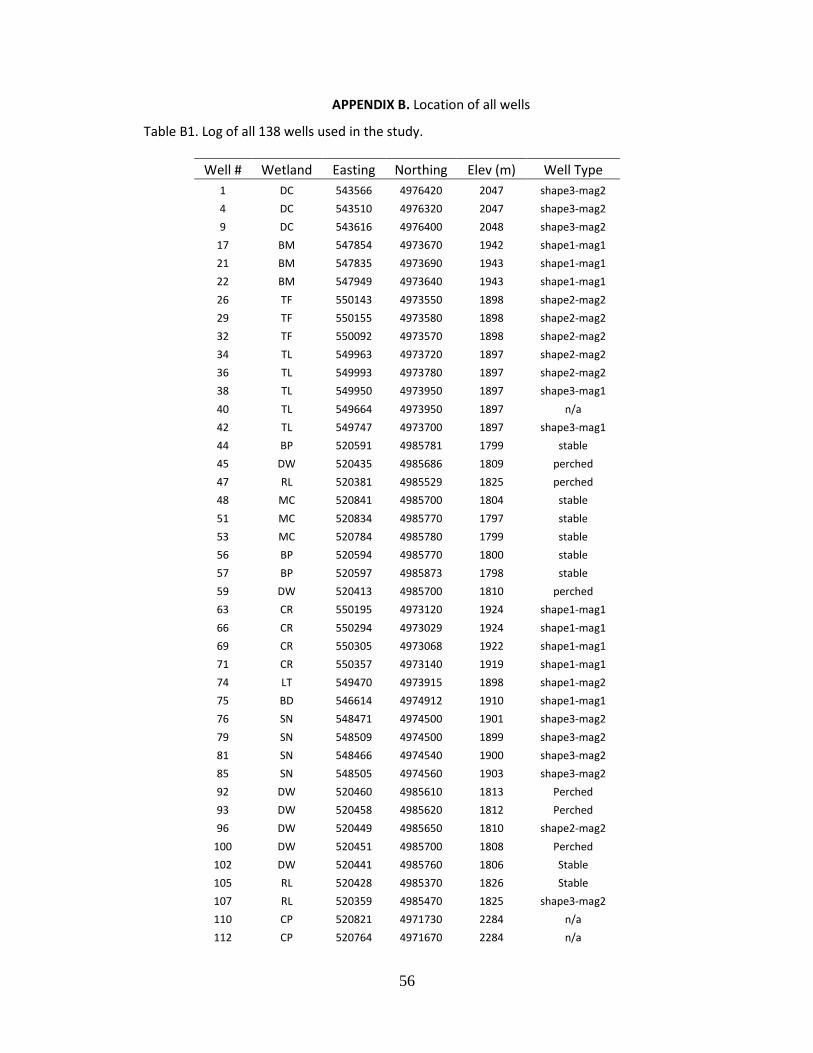
56
APPENDIX B. Location of all wells
Table B1. Log of all 138 wells used in the study.
Well # Wetland Easting Northing Elev (m) Well Type
1 DC 543566 4976420 2047 shape3-mag2
4 DC 543510 4976320 2047 shape3-mag2
9 DC 543616 4976400 2048 shape3-mag2
17 BM 547854 4973670 1942 shape1-mag1
21 BM 547835 4973690 1943 shape1-mag1
22 BM 547949 4973640 1943 shape1-mag1
26 TF 550143 4973550 1898 shape2-mag2
29 TF 550155 4973580 1898 shape2-mag2
32 TF 550092 4973570 1898 shape2-mag2
34 TL 549963 4973720 1897 shape2-mag2
36 TL 549993 4973780 1897 shape2-mag2
38 TL 549950 4973950 1897 shape3-mag1
40 TL 549664 4973950 1897 n/a
42 TL 549747 4973700 1897 shape3-mag1
44 BP 520591 4985781 1799 stable
45 DW 520435 4985686 1809 perched
47 RL 520381 4985529 1825 perched
48 MC 520841 4985700 1804 stable
51 MC 520834 4985770 1797 stable
53 MC 520784 4985780 1799 stable
56 BP 520594 4985770 1800 stable
57 BP 520597 4985873 1798 stable
59 DW 520413 4985700 1810 perched
63 CR 550195 4973120 1924 shape1-mag1
66 CR 550294 4973029 1924 shape1-mag1
69 CR 550305 4973068 1922 shape1-mag1
71 CR 550357 4973140 1919 shape1-mag1
74 LT 549470 4973915 1898 shape1-mag2
75 BD 546614 4974912 1910 shape1-mag1
76 SN 548471 4974500 1901 shape3-mag2
79 SN 548509 4974500 1899 shape3-mag2
81 SN 548466 4974540 1900 shape3-mag2
85 SN 548505 4974560 1903 shape3-mag2
92 DW 520460 4985610 1813 Perched
93 DW 520458 4985620 1812 Perched
96 DW 520449 4985650 1810 shape2-mag2
100 DW 520451 4985700 1808 Perched
102 DW 520441 4985760 1806 Stable
105 RL 520428 4985370 1826 Stable
107 RL 520359 4985470 1825 shape3-mag2
110 CP 520821 4971730 2284 n/a
112 CP 520764 4971670 2284 n/a

57
114 CP 520820 4971712 2284 n/a
115 SV 552100 4974480 1924 shape1-mag1
118 SV 552055 4974550 1923 shape1-mag1
121 SV 552070 4974460 1924 shape1-mag1
123 IP 551940 4974190 1925 shape1-mag2
125 IP 551941 4974190 1925 shape1-mag2
127 IP 551978 4974125 1925 shape2-mag2
128 IP 552033 4974130 1925 shape1-mag2
130 BW 521983 4974430 2270 shape1-mag1
133 BW 521972 4974280 2269 shape1-mag1
136 BW 522072 4974220 2269 n/a
137 BE 522332 4973990 2260 shape2-mag2
140 BE 522574 4973810 2260 shape2-mag2
142 BE 522338 4973860 2260 shape2-mag2
144 BE 522409 4973956 2260 shape2-mag2
148 FF 532455 4978196 2054 n/a
152 RP 524225 4978480 1924 shape3-mag2
155 RP 524176 4978560 1923 shape3-mag2
158 RP 524135 4978540 1925 shape3-mag2
161 BD 546619 4974870 1911 shape1-mag1
164 BD 546578 4974890 1911 shape1-mag1
168 BD 546619 4974920 1910 shape1-mag1
170 BD 546615 4974900 1910 shape1-mag1
172 BM 547937 4973570 1941 n/a
174 SG 534905 4979120 2089 shape1-mag2
177 SG 534765 4979340 2080 n/a
180 SG 534880 4979270 2086 shape2-mag2
182 SG 534835 4979260 2086 shape2-mag2
184 MB 524875 4978880 1861 shape3-mag1
187 MB 524953 4978980 1853 shape3-mag1
189 MB 524943 4978880 1859 shape3-mag1
192 MB 524926 4978910 1858 shape3-mag1
195 WA 551200 4973610 1924 n/a
197 WA 551448 4973590 1921 stable
200 WA 551361 4973420 1921 stable
203 LT 549468 4973860 1899 shape2-mag2
210 LT 549305 4974000 1899 shape3-mag1
213 LT 549480 4974030 1896 shape2-mag2
217 US 523563 4983270 1786 shape3-mag1
220 US 523581 4983270 1785 shape3-mag1
223 US 523595 4983300 1783 shape3-mag1
226 US 523596 4983280 1784 shape3-mag1
229 OR 523265 4983550 1825 shape2-mag2
231 OR 523288 4983600 1826 shape2-mag2
233 OR 523348 4983630 1823 shape2-mag2
236 OR 523331 4983580 1824 shape2-mag2
239 FF 532336 4978330 2054 n/a
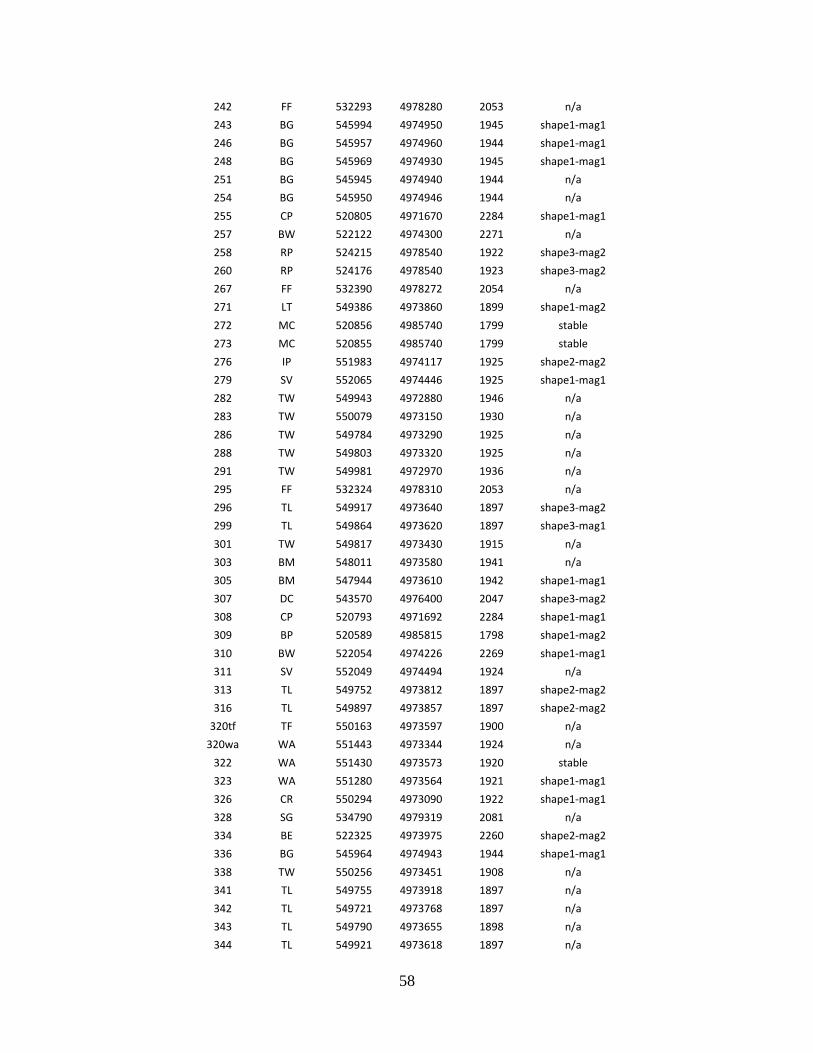
58
242 FF 532293 4978280 2053 n/a
243 BG 545994 4974950 1945 shape1-mag1
246 BG 545957 4974960 1944 shape1-mag1
248 BG 545969 4974930 1945 shape1-mag1
251 BG 545945 4974940 1944 n/a
254 BG 545950 4974946 1944 n/a
255 CP 520805 4971670 2284 shape1-mag1
257 BW 522122 4974300 2271 n/a
258 RP 524215 4978540 1922 shape3-mag2
260 RP 524176 4978540 1923 shape3-mag2
267 FF 532390 4978272 2054 n/a
271 LT 549386 4973860 1899 shape1-mag2
272 MC 520856 4985740 1799 stable
273 MC 520855 4985740 1799 stable
276 IP 551983 4974117 1925 shape2-mag2
279 SV 552065 4974446 1925 shape1-mag1
282 TW 549943 4972880 1946 n/a
283 TW 550079 4973150 1930 n/a
286 TW 549784 4973290 1925 n/a
288 TW 549803 4973320 1925 n/a
291 TW 549981 4972970 1936 n/a
295 FF 532324 4978310 2053 n/a
296 TL 549917 4973640 1897 shape3-mag2
299 TL 549864 4973620 1897 shape3-mag1
301 TW 549817 4973430 1915 n/a
303 BM 548011 4973580 1941 n/a
305 BM 547944 4973610 1942 shape1-mag1
307 DC 543570 4976400 2047 shape3-mag2
308 CP 520793 4971692 2284 shape1-mag1
309 BP 520589 4985815 1798 shape1-mag2
310 BW 522054 4974226 2269 shape1-mag1
311 SV 552049 4974494 1924 n/a
313 TL 549752 4973812 1897 shape2-mag2
316 TL 549897 4973857 1897 shape2-mag2
320tf TF 550163 4973597 1900 n/a
320wa WA 551443 4973344 1924 n/a
322 WA 551430 4973573 1920 stable
323 WA 551280 4973564 1921 shape1-mag1
326 CR 550294 4973090 1922 shape1-mag1
328 SG 534790 4979319 2081 n/a
334 BE 522325 4973975 2260 shape2-mag2
336 BG 545964 4974943 1944 shape1-mag1
338 TW 550256 4973451 1908 n/a
341 TL 549755 4973918 1897 n/a
342 TL 549721 4973768 1897 n/a
343 TL 549790 4973655 1898 n/a
344 TL 549921 4973618 1897 n/a

59
345 TL 549978 4973677 1897 n/a
347 SN 548498 4974538 1900 shape3-mag2
348 TW 550272 4973462 1908 n/a
349 OR 523303 4983572 1824 shape2-mag2
350 IP 552004 4974165 1925 shape2-mag2
351 TL 549888 4973651 1856 shape2-mag2
352 WA 551429 4973574 1920 shape1-mag1
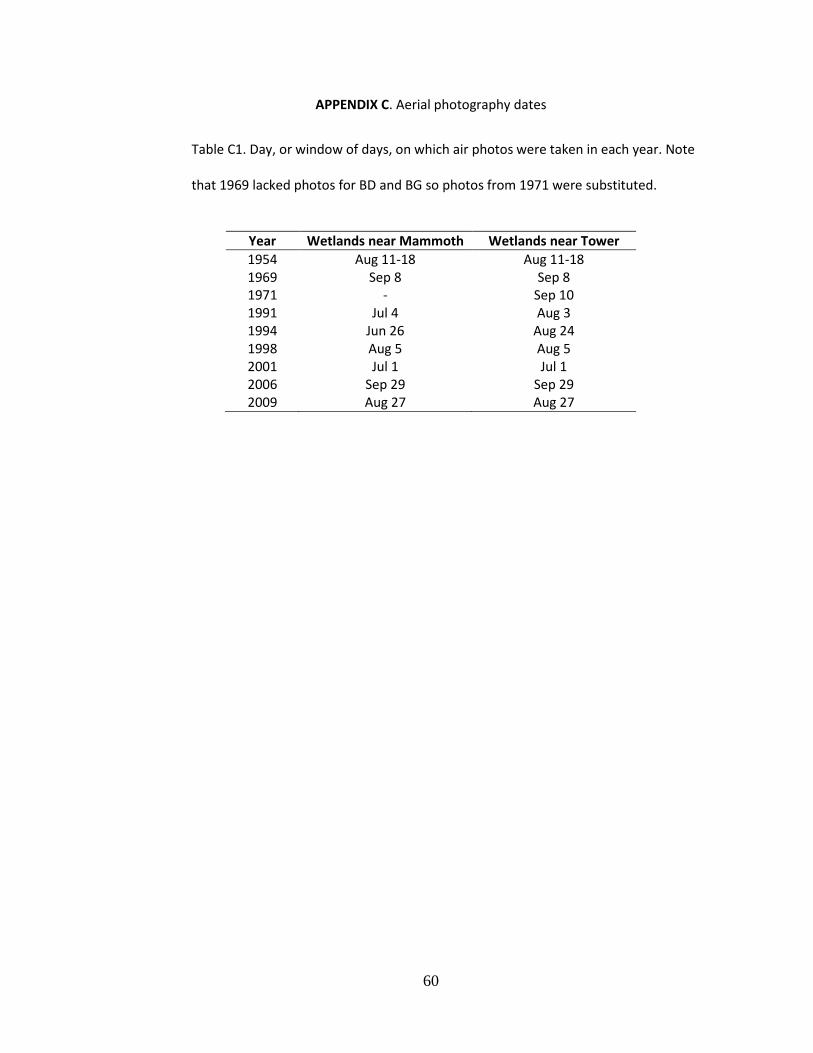
60
APPENDIX C. Aerial photography dates
Table C1. Day, or window of days, on which air photos were taken in each year. Note
that 1969 lacked photos for BD and BG so photos from 1971 were substituted.
Year Wetlands near Mammoth Wetlands near Tower
1954 Aug 11-18 Aug 11-18 1969 Sep 8 Sep 8 1971 - Sep 10 1991 Jul 4 Aug 3 1994 Jun 26 Aug 24 1998 Aug 5 Aug 5 2001 Jul 1 Jul 1 2006 Sep 29 Sep 29 2009 Aug 27 Aug 27
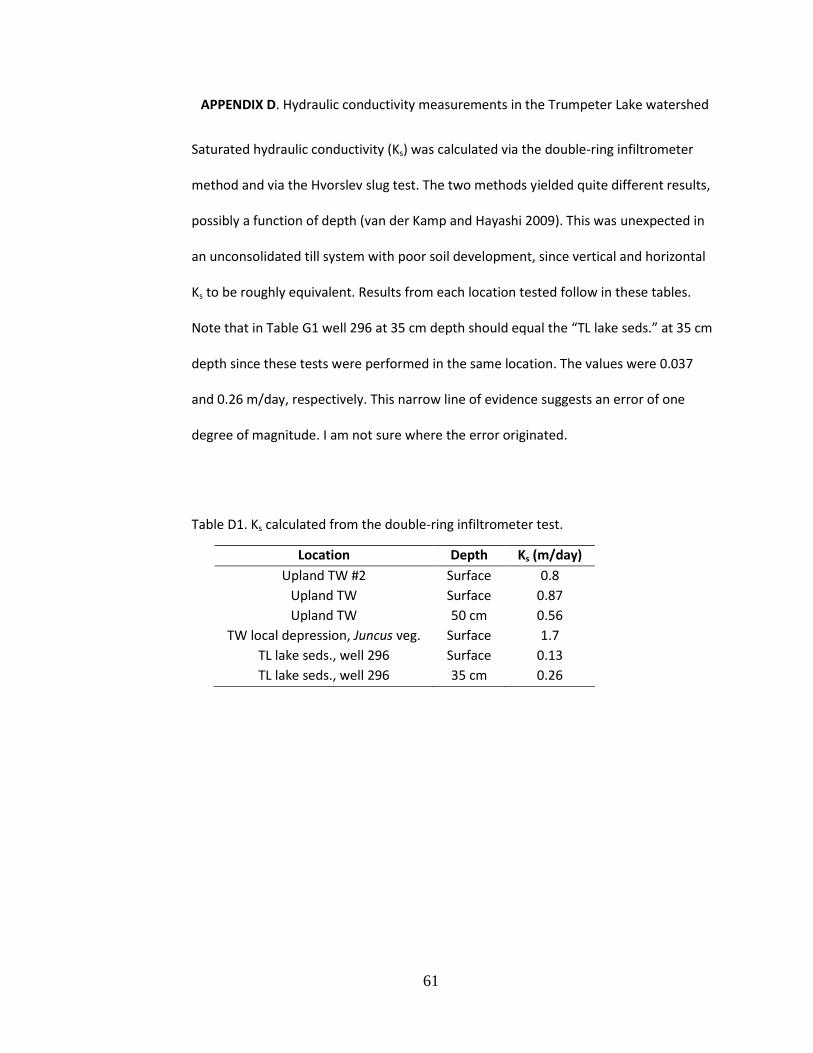
61
APPENDIX D. Hydraulic conductivity measurements in the Trumpeter Lake watershed
Saturated hydraulic conductivity (Ks) was calculated via the double-ring infiltrometer
method and via the Hvorslev slug test. The two methods yielded quite different results,
possibly a function of depth (van der Kamp and Hayashi 2009). This was unexpected in
an unconsolidated till system with poor soil development, since vertical and horizontal
Ks to be roughly equivalent. Results from each location tested follow in these tables.
Note that in Table G1 well 296 at 35 cm depth should equal the “TL lake seds.” at 35 cm
depth since these tests were performed in the same location. The values were 0.037
and 0.26 m/day, respectively. This narrow line of evidence suggests an error of one
degree of magnitude. I am not sure where the error originated.
Table D1. Ks calculated from the double-ring infiltrometer test.
Location Depth Ks (m/day)
Upland TW #2 Surface 0.8
Upland TW Surface 0.87
Upland TW 50 cm 0.56
TW local depression, Juncus veg. Surface 1.7
TL lake seds., well 296 Surface 0.13
TL lake seds., well 296 35 cm 0.26
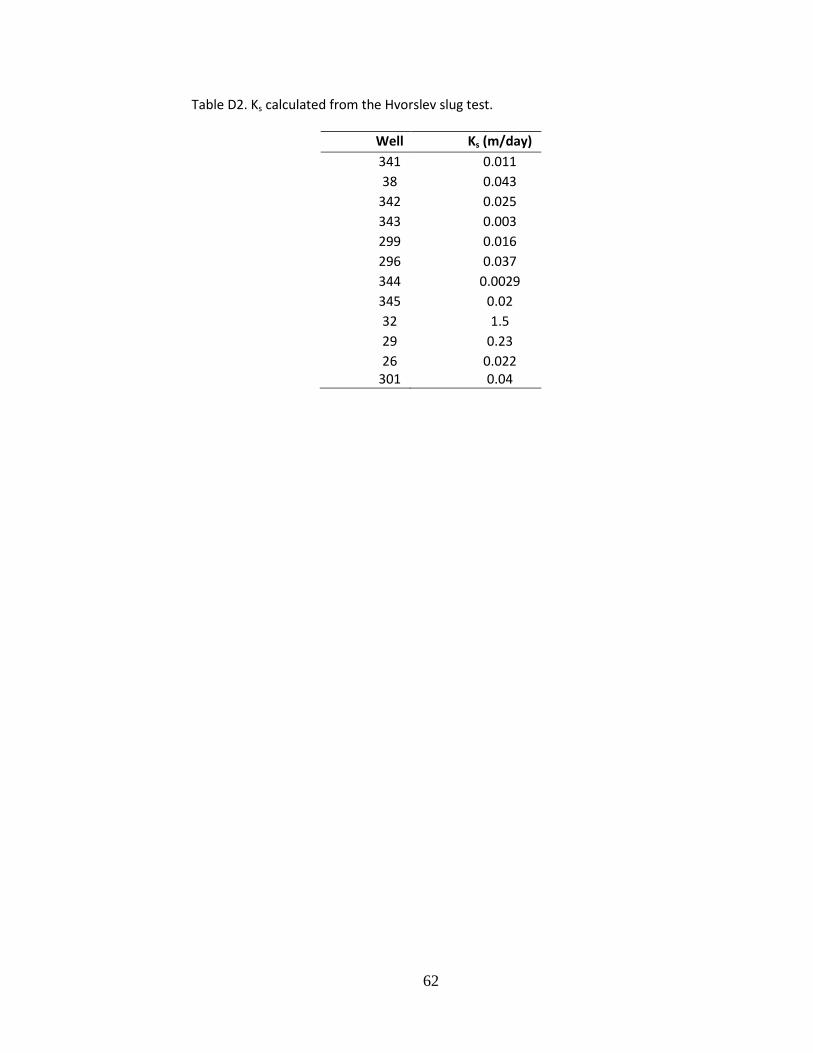
62
Table D2. Ks calculated from the Hvorslev slug test.
Well Ks (m/day)
341 0.011
38 0.043
342 0.025
343 0.003
299 0.016
296 0.037
344 0.0029
345 0.02
32 1.5
29 0.23
26 0.022 301 0.04
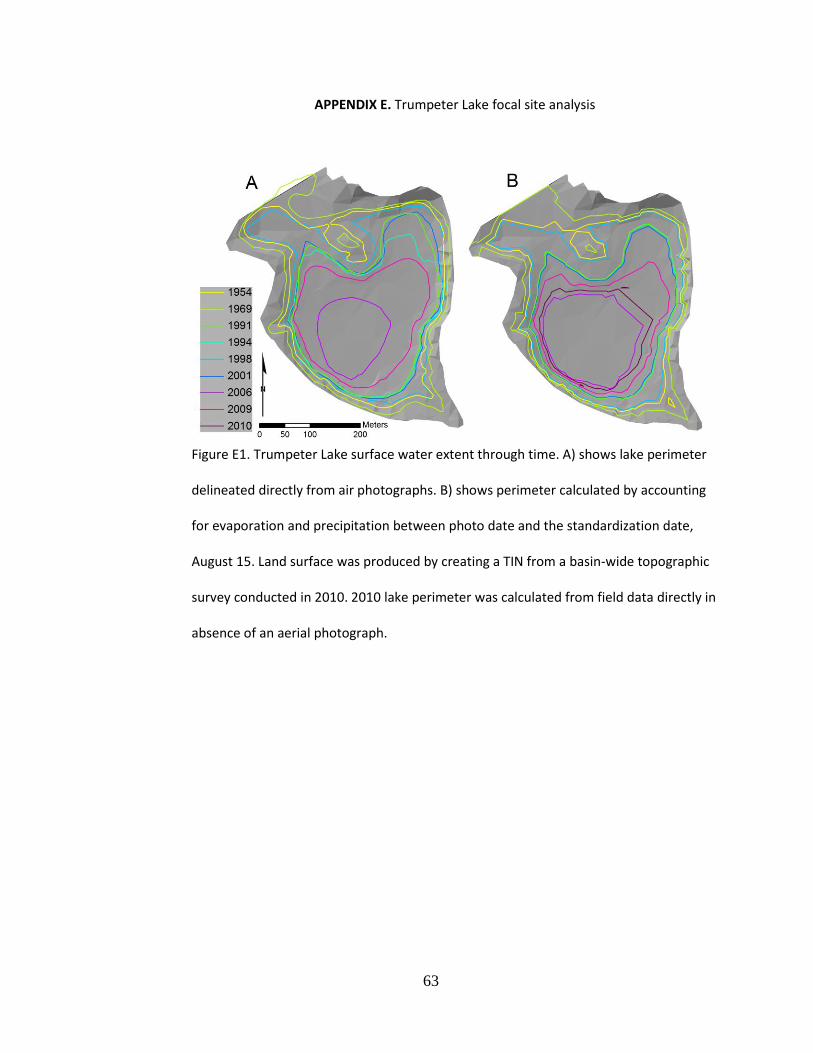
63
APPENDIX E. Trumpeter Lake focal site analysis
Figure E1. Trumpeter Lake surface water extent through time. A) shows lake perimeter
delineated directly from air photographs. B) shows perimeter calculated by accounting
for evaporation and precipitation between photo date and the standardization date,
August 15. Land surface was produced by creating a TIN from a basin-wide topographic
survey conducted in 2010. 2010 lake perimeter was calculated from field data directly in
absence of an aerial photograph.
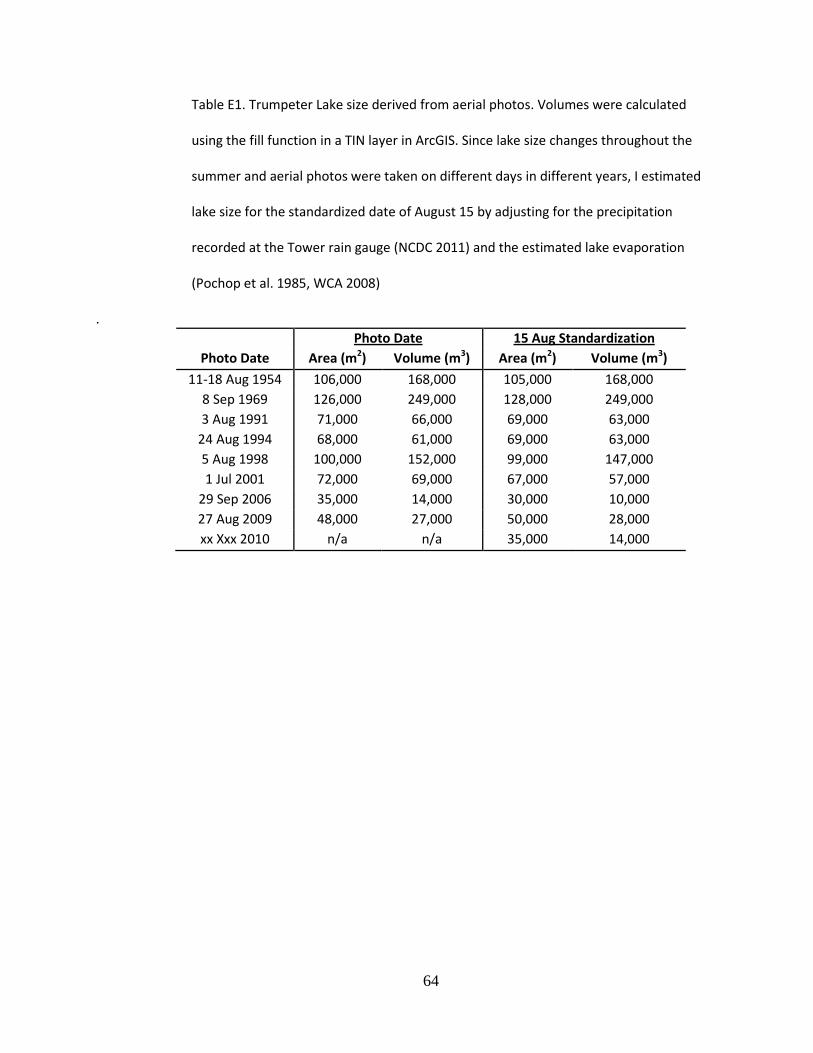
64
Table E1. Trumpeter Lake size derived from aerial photos. Volumes were calculated
using the fill function in a TIN layer in ArcGIS. Since lake size changes throughout the
summer and aerial photos were taken on different days in different years, I estimated
lake size for the standardized date of August 15 by adjusting for the precipitation
recorded at the Tower rain gauge (NCDC 2011) and the estimated lake evaporation
(Pochop et al. 1985, WCA 2008)
.
Photo Date 15 Aug Standardization
Photo Date Area (m2) Volume (m3) Area (m2) Volume (m3)
11-18 Aug 1954 106,000 168,000 105,000 168,000
8 Sep 1969 126,000 249,000 128,000 249,000
3 Aug 1991 71,000 66,000 69,000 63,000
24 Aug 1994 68,000 61,000 69,000 63,000
5 Aug 1998 100,000 152,000 99,000 147,000
1 Jul 2001 72,000 69,000 67,000 57,000
29 Sep 2006 35,000 14,000 30,000 10,000
27 Aug 2009 48,000 27,000 50,000 28,000
xx Xxx 2010 n/a n/a 35,000 14,000

65
APPENDIX F. Soil seed bank study species list
Table F1. Plant species germinating in the soil seed bank study, listed with their wetland
indicator status. n = number of wetlands, out of 12, from whose plots a species germinated.
Nomenclature follows USDA PLANTS (2011).
Species Name Wetland Indicator
Status
n
Achillea millefolium var. lanulosa FACU 1 Agrostis scabra FAC 2 Agrostis stolonifera FAC 3 Alyssum desertorum N/A 4 Androsace septentrionalis FAC- 3 Antennaria microphylla N/A 1 Artemesia frigida N/A 1 Astragalus agrestis FACW- 2 Bromus japonicus UPL 6 Bromus tectorum N/A 1 Camelina microcarpa N/A 1 Cerastium fontanum FACU 1 Ceratocephala testiculata N/A 3 Cirsium arvense FACU+ 2 Collinsia parviflora N/A 2 Collomia linearus FACU 2 Corydalis aurea N/A 1 Cryptantha ambigua N/A 1 Dasiphora fruticosa FAC- 1 Descurainia pinnata var. nelsonii N/A 1 Descurainia sophia N/A 2 Draba nemorosa N/A 11 Epilobium ciliatum FACW- 11 Erysimum inconspicuum N/A 2 Festuca idahoensis FACU* 1 Fragaria virginiana FACU* 3 Gnaphalium palustre FAC+ 3 Juncus arcticus FACW+ 3 Juncus ensifolius FACW 2 Juncus longistylis FACW 1 Juncus nodosus OBL 1 Juncus torreyi FACW 1 Melilotus officinalis FACU 1 Mentha arvensis FACW- 3 Monolepis nuttalliana FAC- 3 Myosurus minimus OBL 2

66
Poa palustris FAC 12 Puccinellia nuttalliana FACW+ 1 Ranunculus macounii OBL 3 Ranunculus sceleratus OBL 7 Rumex maritimus FACW+ 6 Taraxacum officinale FACU 7 Thlaspi arvense N/A 5 Trifolium hybridum FAC 1 Typha latifolia OBL 2 Veronica peregrina OBL 5

67
APPENDIX G. Soil seed bank study plot stratification procedure
I explored multiple ways to analyze soil seed bank data. As explained in the text, I
resolved on a classification stratifying plot classes by their relative elevation from the lowest
plot (0%) up to the surrounding upland elevation (100%). Elevation classes were chosen
according to two criteria, 1) I attempted to lump percentages in close proximity to each other
(e.g. given the percentages 0, 17, 20, and 25 I grouped 0’s together and 17, 20 and 25’s
together), and 2) I attempted to create groups of similar size (20 ≤ n ≤ 24 for six of the seven
classes). Table J1 shows the raw data for number of OBL and FACW species germinating in each
plot, grouped by elevation class. The total number of wetland species germinating per plot was
lower than desired.
An alternative classification that was rejected used each plot’s elevation above the 2009
maximum water level in a particular wetland basin (cm). The advantage of this method was that
it placed all wetlands on the same absolute scale, and elevation classes were described in
centimeters rather than as percentages. This method incorporated the ecological importance of
the seasonal high water level. However, the drawback to this classification was that it tended to
decrease the diversity of wetlands represented in the plot elevation classes (e.g. only 7 of 12
wetlands were represented in the lowest class; Trumpeter Lake provided 8 of the 24 plots in the
highest class). This classification revealed no strong trends in the distribution of germinating
wetland species. In fact, wetland species starkly peaked in the highest elevation class, 140-342
cm above 2009 peak. Plots in this class were dominated by Trumpeter Lake plots, a particularly
productive wetland. Thus, a high percentage of plots from one wetland and no pattern outside
of this elevation class discounted my trust in this analysis.
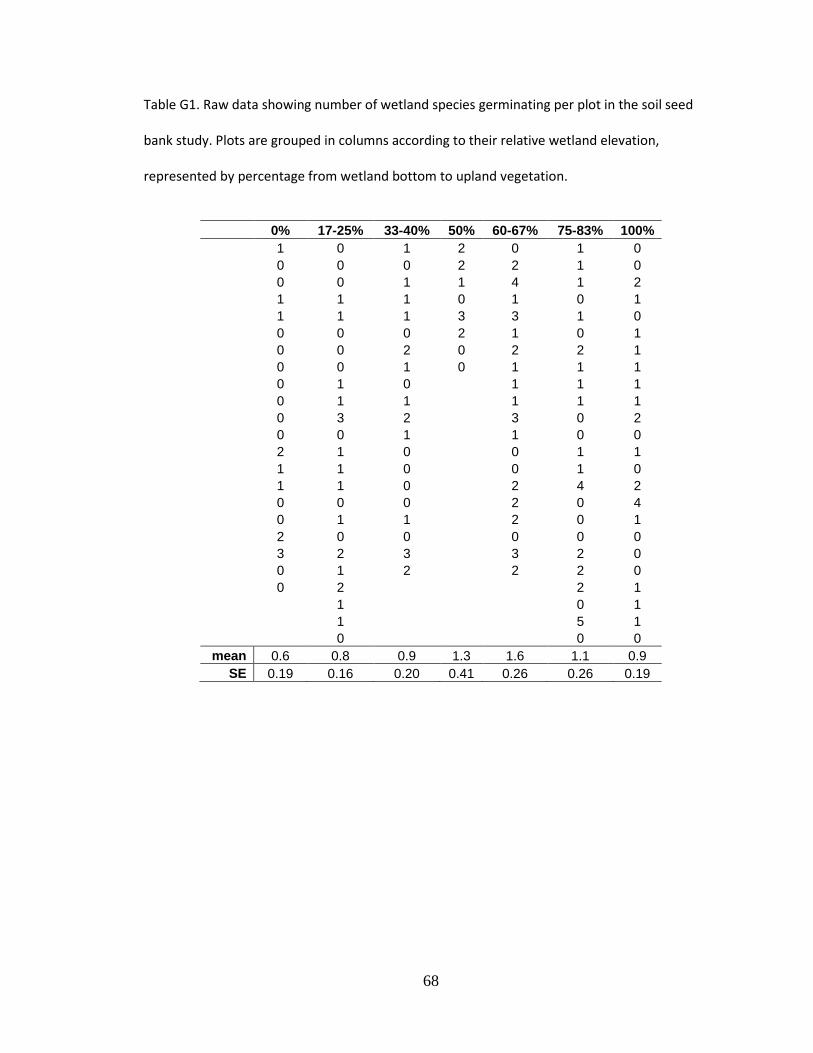
68
Table G1. Raw data showing number of wetland species germinating per plot in the soil seed
bank study. Plots are grouped in columns according to their relative wetland elevation,
represented by percentage from wetland bottom to upland vegetation.
0% 17-25% 33-40% 50% 60-67% 75-83% 100%
1 0 1 2 0 1 0
0 0 0 2 2 1 0
0 0 1 1 4 1 2
1 1 1 0 1 0 1
1 1 1 3 3 1 0
0 0 0 2 1 0 1
0 0 2 0 2 2 1
0 0 1 0 1 1 1
0 1 0
1 1 1
0 1 1
1 1 1
0 3 2
3 0 2
0 0 1
1 0 0
2 1 0
0 1 1
1 1 0
0 1 0
1 1 0
2 4 2
0 0 0
2 0 4
0 1 1
2 0 1
2 0 0
0 0 0
3 2 3
3 2 0
0 1 2
2 2 0
0 2
2 1
1
0 1
1
5 1
0 0 0
mean 0.6 0.8 0.9 1.3 1.6 1.1 0.9
SE 0.19 0.16 0.20 0.41 0.26 0.26 0.19

69
Table G2. Mann Whitney U test statistics from comparing each elevation class to all others. The
top right triangle is the test z-score, while the bottom left triangle shows the associated p-
values. Asterisks highlight significance at p < 0.05. See Fig. 12 for bar graph.
Elev. Class 0% 17-25% 33-40% 50% 60-67% 75-83% 100%
0%
-1.04 1.23 1.51 2.88* -1.57 -1.36
17-25% 0.3
0.33 1.09 2.45* -0.7 -0.38 33-40% 0.23 0.74
0.83 -2* -0.34 0
50% 0.14 0.28 0.41
-0.53 0.57 0.89 60-67% 0.01* 0.02* 0.05* 0.6
1.64 2.13*
75-83% 0.12 0.48 0.74 0.57 0.11
0.35 100% 0.18 0.7 1 0.39 0.04* 0.73

70
APPENDIX H. Example wetland hydrographs from the seven classes
Figure H1. Illustrated are hydrographs of the seven wetland classes
derived from well hydrograph analysis. Each pane is an example
wetland from a given class. Summer hydrographs for all wells at a
wetland are illustrated for both years. A given well is illustrated with
the same color in each year. 2009 hydrographs are solid lines and
2010’s are dashed. Black lines are staff gauges.
-70
-60
-50
-40
-30
-20
-10
0
10
20
13-M
ay
20-M
ay
27-M
ay
3-Ju
n
10-J
un
17-J
un
24-J
un
1-Ju
l
8-Ju
l
15-J
ul
22-J
ul
29-J
ul
5-A
ug
12-A
ug
19-A
ug
Wat
er
tab
le e
lev.
(cm
ab
ove
gro
un
d)
Class Stable: Wetland DW Well Hydrographs '09 & '10
DW59 '09
DW92 '09
DW96 '09
DW100 '09
DW59 '10
DW92 '10
DW96 '10
DW100 '10
-150
-100
-50
0
50
13-M
ay
20-M
ay
27-M
ay
3-Ju
n
10-J
un
17-J
un
24-J
un
1-Ju
l
8-Ju
l
15-J
ul
22-J
ul
29-J
ul
5-A
ug
12-A
ug
19-A
ug
Wat
er
tab
le e
lev.
(cm
ab
ove
gro
un
d)
Class Perched: Wetland BP Well Hydrographs '09 & '10
BP309 '09
BP56 '09
BP57 '09
BP309 '10
BP56 '10
BP57 '10
-90
-70
-50
-30
-10
10
13
-May
20
-May
27
-May
3-J
un
10
-Ju
n
17
-Ju
n
24
-Ju
n
1-J
ul
8-J
ul
15
-Ju
l
22
-Ju
l
29
-Ju
l
5-A
ug
12
-Au
g
19
-Au
g
Wat
er
tab
le e
lev.
(cm
ab
ove
gro
un
d)
Class P.R.: Wetland DC Well Hydrographs '09 & '10
DC1 '09
DC4 '09
DC9 '09
DC307 '09
DC1 '10
DC4 '10
DC9 '10
DC307 '10

71
-200
-150
-100
-50
0
50
13-M
ay
20-M
ay
27-M
ay
3-J
un
10-
Jun
17-
Jun
24-
Jun
1-Ju
l
8-Ju
l
15-J
ul
22-J
ul
29-J
ul
5-A
ug
12
-Au
g
19
-Aug
Wat
er
tab
le e
lev.
(cm
ab
ove
gro
un
d)
Class Seasonal: Wetland BD Well Hydrographs '09 & '10
BD161 '09
BD164 '09
BD168 '09
BD170 '09
BD161 '10
BD164 '10
BD168 '10
BD170 '10
-120
-100
-80
-60
-40
-20
0
20
13
-May
20
-May
27
-May
3-J
un
10
-Ju
n
17
-Ju
n
24
-Ju
n
1-J
ul
8-J
ul
15
-Ju
l
22
-Ju
l
29
-Ju
l
5-A
ug
12
-Au
g
19
-Au
g
Wat
er
tab
le e
lev.
(cm
ab
ove
gro
un
d)
Class I.V.: Wetland SG Well Hydrographs '09 & '10
SG174 '09
SG180 '09
SG182 '09
SG174 '10
SG180 '10
SG182 '10
-180
-160
-140
-120
-100
-80
-60
-40
-20
0
20
13
-May
20
-May
27
-May
3-J
un
10
-Ju
n
17
-Ju
n
24
-Ju
n
1-J
ul
8-J
ul
15
-Ju
l
22
-Ju
l
29
-Ju
l
5-A
ug
12
-Au
g
19
-Au
g
Wat
er
tab
le e
lev.
(cm
ab
ove
gro
un
d)
Class M.R.: Wetland MB Well Hydrographs '09 & '10
MB184 '09
MB187 '09
MB189 '09
MB192 '09
MB184 '10
MB187 '10
MB189 '10
MB192 '10
-120
-100
-80
-60
-40
-20
0
20
40
60
13-M
ay
20-M
ay
27-M
ay
3-Ju
n
10-J
un
17-J
un
24-J
un
1-Ju
l
8-Ju
l
15-J
ul
22-J
ul
29-J
ul
5-A
ug
12-A
ug
19-A
ug
Wat
er
tab
le e
lev.
(cm
ab
ove
gro
un
d)
Class S.V.: Wetland LT Well Hydrographs '09 & '10
LT74 '09
LT203 '09
LT210 '09
LT271 '09
LT74 '10
LT203 '10
LT210 '10
LT271 '10

72
APPENDIX I. Yellowstone River annual discharge
1910 1920 1930 1940 1950 1960 1970 1980 1990 2000 2010
Mean A
nnual Q
(cfs
)
1500
2000
2500
3000
3500
4000
4500
5000
5500
Figure I1. Mean annual discharge (Q) on the Yellowstone River at the Corwin Springs gauging
station. Dots represent annual mean Q’s for 1911-2010, black line represents the 10-year running
average, and gray line is the mean. Data revealed an oscillating pattern of wetter and drier years,
but no comprehensive trajectory over the past century. This figure’s trends were extended back
to the early 18th century by Graumlich et al. (2003). Their data indicated that the wettest period
was circa 1900 and the longest prolonged dry spell was 1780-1870.

73
APPENDIX G. Photographs of one wetland from each class
Figure G1. Stable surface water class, wetland RL.
Figure G2. Perched water table class, wetland BP.

74
Figure G3. Seasonally and yearly variable water table class, wetland BD.
Figure G4. Peat soils with recovering water tables class, wetland DC.

75
Figure G5. Mineral soils with recovering water tables class, wetland MB.
Figure G6. Interannually variable water table persistence, wetland OR.
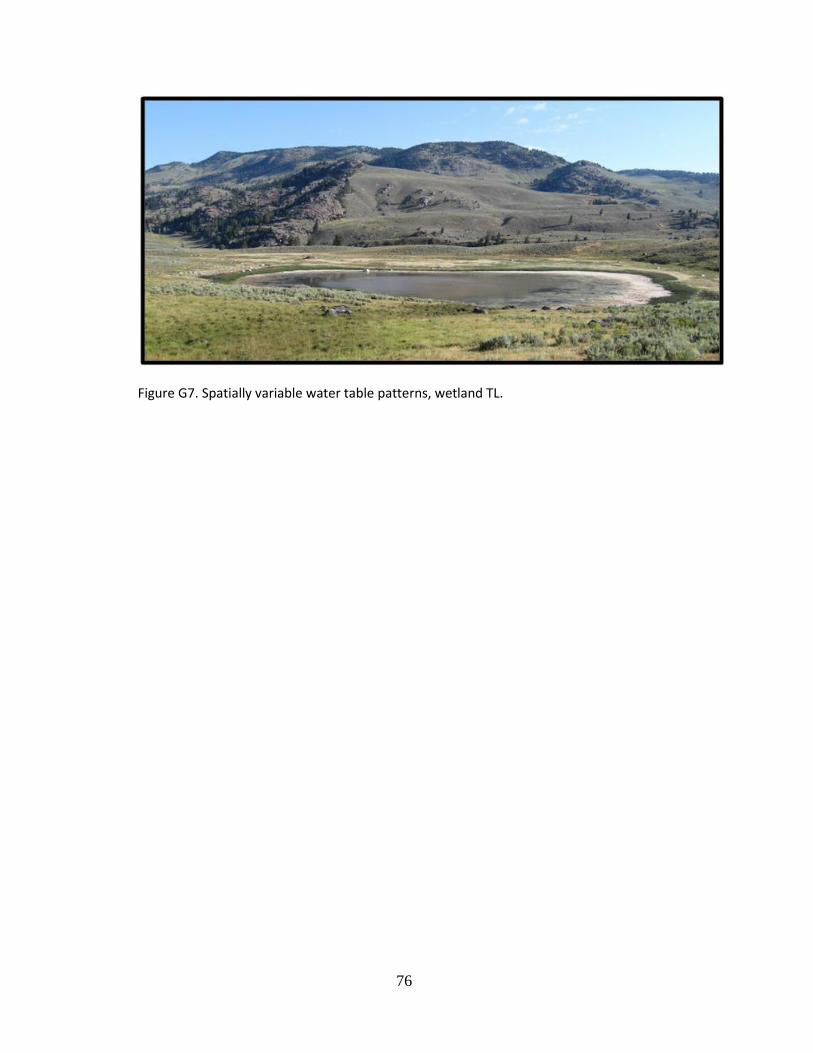
76
Figure G7. Spatially variable water table patterns, wetland TL.