altered hydrologic and geomorphic processes and … · 1 altered hydrologic and geomorphic...
TRANSCRIPT

U.S. Department of the Interior U.S. Geological Survey
Altered Hydrologic and Geomorphic Processes and
Bottomland Hardwood Plant Communities of the
Lower White River Basin
By Sammy L. King, Richard F. Keim, Cliff R. Hupp, Brandon L. Edwards, Whitney A. Kroschel, Erin L. Johnson, and J. Wes Cochran
Open-File Report 2016–1113

U.S. Department of the Interior
SALLY JEWELL, Secretary
U.S. Geological Survey
Suzette M. Kimball, Director
U.S. Geological Survey, Reston, Virginia: 2016
For more information on the USGS—the Federal source for science about the Earth,
its natural and living resources, natural hazards, and the environment—visit
http://www.usgs.gov/ or call 1–888–ASK–USGS (1–888–275–8747).
For an overview of USGS information products, including maps, imagery, and publications,
visit http://store.usgs.gov.
Any use of trade, firm, or product names is for descriptive purposes only and does not imply
endorsement by the U.S. Government.
Although this information product, for the most part, is in the public domain, it also may
contain copyrighted materials as noted in the text. Permission to reproduce copyrighted items
must be secured from the copyright owner.
Suggested citation:
King, S.L., Keim, R.F., Hupp, C.R., Edwards, B.L., Kroschel, W.A., Johnson, E.L., and Cochran, J.W.,
2016, Altered hydrologic and geomorphic processes and bottomland hardwood plant communities of the
lower White River Basin: U.S. Geological Survey Open-File Report 2016–1113, 32 p.,
http://dx.doi.org/10.3133/ofr20161113.
ISSN 2331-1258 (online)

iii
Contents
1. Introduction ............................................................................................................................................................. 1 2. Geomorphic Analyses ............................................................................................................................................. 2
2.1 Historic and Current Rates of Bank Erosion and Channel migration ................................................................. 2 2.1.1 Methods...................................................................................................................................................... 2
2.1.2 Results ........................................................................................................................................................... 6 2.2 Channel Incision ............................................................................................................................................. 10
2.2.1 Methods.................................................................................................................................................... 10 2.2.2 Results ..................................................................................................................................................... 10
2.3 Sedimentation rates ........................................................................................................................................ 12 2.3.1 Methods.................................................................................................................................................... 12 2.3.2 Results ..................................................................................................................................................... 12
2.4 Interpretation of Geomorphic Analyses ........................................................................................................... 14
3. Accuracy of the HEC-GeoRAS model in predicting water depths in the floodplain ............................................... 17 3.1 Methods .......................................................................................................................................................... 17 3.2 Results ............................................................................................................................................................ 17 3.3 Discussion ....................................................................................................................................................... 19
4. Stand establishment patterns of bottomland hardwoods within selected plant communities ................................ 20 4.1 Methods .......................................................................................................................................................... 20
4.1.1 Vegetation Plots ....................................................................................................................................... 20 4.1.2 Stand Development–Tree Ring Analysis .................................................................................................. 21
4.2 Results ............................................................................................................................................................ 21 4.2.1 Stand Diameter Distribution ...................................................................................................................... 21 4.2.2 Stand Development .................................................................................................................................. 22
4.3 Discussion ....................................................................................................................................................... 22
5. Project Summary and Management Recommendations ....................................................................................... 28 6. References ........................................................................................................................................................... 29
Figures
2.1. Location map of sediment pad and bank retreat measurement sites............................................................. 4 2.2. Field crew conducting bank retreat measurement ......................................................................................... 5 2.3. Channel migration rates between DeValls Bluff and the Norrell lock. ............................................................ 7 2.4. Bankfull width from 1930–2010 ..................................................................................................................... 8 2.5. Mean bankfull width for the entire study reach from 1930–2010 ................................................................... 8 2.6. Amount of bank retreat for sites near Clarendon, St. Charles, and Jacks Bay .............................................. 9 2.7. Bank height above water surface on the lower White River on 21–23 August 2014 .................................... 11 2.8. Bed elevation from 2013 thalweg survey ..................................................................................................... 11 2.9. Sediment deposition rates on lower White River ......................................................................................... 13 2.10. Deposition rates integrated over first 500 miles of transects extrapolated to 5-year total deposition
versus along-stream distance and relative local bank height ....................................................................... 16 3.1. Distribution of water monitoring stations by reach ....................................................................................... 18 3.2. Observed floodplain depths compared to modeled floodplain depths at 28 well monitoring stations
by reach ....................................................................................................................................................... 19 4.1. Number of trees per acre in each approximate 2.0 inch-diameter class for common bottomland
hardwood species along three reaches of the White River floodplain.......................................................... 24

iv
4.2. Establishment dates of common bottomland hardwood trees cored within the Clarendon reach ................ 25 4.3. Establishment dates of common bottomland hardwood trees cored within the St. Charles reach ............... 26 4.4. Establishment dates of common bottomland hardwood trees cored within the Jacks Bay reach. ............... 27
Tables
2.1 Data used in historical analysis ..................................................................................................................... 3 2.2. Stream sinuosity by reach ............................................................................................................................. 6 4.1. Total basal area and stem density of most common species within three designated reaches of the
White River floodplain .................................................................................................................................. 22
Conversion Factors
Inch/Pound to International System of Units
Multiply By To obtain
Length
inch (in.) 2.54 centimeter (cm)
foot (ft) 0.3048 meter (m)
mile (mi) 1.609 kilometer (km)
Area
acre 0.4047 hectare (ha)
square foot (ft2) 0.09290 square meter (m2)
square foot per acre (ft2/ac) 0.229568 square meter per hectare (m2/ha)
Volume
cubic foot (ft3) 0.02832 cubic meter (m3)
cubic foot (ft3) 0.02832 cubic meter (m3)
Flow rate
foot per year (ft/yr) 0.3048 meter per year (m/yr)
inch per year (in/yr) 25.4 millimeter per year (mm/yr)
square foot (ft2) 0.09290 square meter (m2)
International System of Units to Inch/Pound
Length
meter (m) 3.281 foot (ft)
Area
hectare (ha) 2.471 acre

v
Datum
Horizontal coordinate information is referenced to the North American Datum of 1983 (NAD 83).
Abbreviations
A area of migration polygon
ac acre
c circa
CAAQ Carya aquatica
CELA Celtis laevigata
Dbh diameter-at-breast height
DEM digital elevation model
DOQQ digital ortho quarter quad
FIA Forest Inventory and Analysis
FRPE Fraxinus pennsylvanica
ft feet
ft/yr feet per year
ft2/ac square feet per acre
GIS geographic information system
ha hectare
LMAV Lower Mississippi Alluvial Valley
m meters
M channel migration rate
mi miles
NHAP National High Altitude Photography
P perimeter of migration polygon
PNV potential natural vegetation
QULY Quercus lyrata
QUTE Quercus texana
RMSE root mean square error
stems/ac stems per acre
ULAM Ulmus americana
USACE U.S. Army Corps of Engineers
USGS U.S. Geological Survey
yr year

1
Altered Hydrologic and Geomorphic Processes and
Bottomland Hardwood Plant Communities of the
Lower White River Basin
By Sammy L. King,1 Richard F. Keim,2 Cliff R. Hupp,3 Brandon L. Edwards,2 Whitney A. Kroschel,2 Erin L. Johnson,2 and J. Wes Cochran2
1. Introduction
The lower White River, Arkansas, is a Ramsar Convention Wetland of International Importance
that supports the second largest tract of bottomland hardwood forests in North America. The vegetation
and hydrology relationships on the White River have generated a lot of scientific interest. In the late
1990s, managers observed substantial headcutting of White River tributaries and the mass wasting of
banks, leading to speculation that the White River was geomorphically unstable and threatening the
ecological integrity of the floodplain forest.
Numerous modifications within the watershed, and within the larger Lower Mississippi Alluvial
Valley (LMAV) have led to changes in the lower White River. Most notably, channel training of the
Mississippi River (Biedenharn and Watson, 1997) has lowered base level for the White River, and a series
of flood control dams upstream have significantly altered flow (Craig and others, 2001). A lowered base
level increases hydraulic gradient, which can result in increases in sinuosity via meandering, channel
incision, or bank widening (Nanson and Huang, 2008), depending on geomorphic constraints (Simon and
Rinaldi, 2006). Flow regulation often results in reduced peak stages, flood frequency, duration of
overbank flooding and sediment load (Williams and Wolman, 1984), and commonly causes subsequent
channel degradation downstream of dams (as in Phillips and others, 2005; Hupp and others, 2009a).
Rivers and their floodplains are process-response systems whose geomorphic state is the result of
geologic setting and hydrologic drivers (Nanson and Croke, 1992; Phillips, 2010). Significant changes to
the gradient, hydrology, or sediment load result in adjustment toward a new quasi-equilibrium condition
(as in Knox, 2006; Hupp and others, 2009a; Hupp and others, 2015). Geomorphic adjustment at the reach
and regional scale can trigger substantial changes to river-floodplain interactions and feedback
mechanisms between geomorphic, hydrologic, and ecological processes (as with Hupp, 1992; Ligon and
others, 1995; Knox, 2006; Hupp and others, 2009b; Osterkamp and Hupp, 2010).
The White River and its floodplain support the second largest floodplain forest in North America,
and changes in the frequency and duration of flooding or groundwater processes have implications for
floodplain ecology. Tree species composition and productivity of these floodplain forests are a function of
surface and subsurface hydrologic regime (Klimas, 2009, Gee and others, 2015; Allen and others, 2016).
1U.S. Geological Survey, Louisiana Cooperative Fish and Wildlife Research Unit, School of Renewable Natural Resources,
Louisiana State University. 2School of Renewable Natural Resources, Louisiana State University. 3U.S. Geological Survey.

2
Bank widening and incision can lower the water table and alter flood frequency and associated nutrient
and sediment flows to the floodplain community (as with Hupp and others, 2009a; Schenck and Hupp,
2009; Hupp and others, 2015). An understanding of the relationships among present and future
(predicted) geomorphic processes, surface and subsurface hydrologic processes, and tree growth and
establishment is critical for evaluating the effects of future development activities within the White River
watershed.
The work explained in this report was conducted to assess geomorphic adjustment of the lower
White River to hydrologic modifications and establish forest age and community structure within selected
communities within the floodplain. Also, the HEC–GeoRAS model was evaluated for predicting flood
depth and duration within the floodplain. Hydrologic modeling using HEC–GeoRAS is a common way to
model flooding in a floodplain. A parameterized model exists for the White River based on observed
flows at gauges, but its ability to reproduce current and future hydrological conditions throughout the
floodplain has not been quantified. The objectives of this work are to—
1. Identify current and historical rates of bank erosion and channel migration.
2. Determine bank heights and channel incision along the river from Norrell lock to DeValls Bluff.
3. Determine sedimentation rates along three sections of the floodplain (as in the Clarendon area,
near St. Charles, and near Jacks Bay).
4. Evaluate the accuracy of the HEC–GeoRAS model in predicting water depths in the floodplain.
5. Determine stand establishment patterns of bottomland hardwoods within selected plant
communities along three sections of the floodplain.
This study provides baseline information on the current geomorphic and hydrologic conditions of the
river and can assist in the interpretation of forest responses to past hydrologic and geomorphic processes.
Understanding the implications for floodplain forests of geomorphic adjustment in the LMAV is key to
managing the region’s valuable resources for a sustainable future.
2. Geomorphic Analyses
2.1 Current and Historical Rates of Bank Erosion and Channel Migration
2.1.1 Methods
To determine current and historical rates of bank erosion and meandering, we analyzed channel
planform using topographic maps and aerial photography to document geomorphic trends from
c. 1929–2010 on the lower White River from DeValls Bluff to Norrell Lock and Dam (fig 2.1, table 2.1).
The exact starting year of the study period is indeterminate; data used to produce U.S. Geological Survey
(USGS) topographic maps published in 1939–1941 are listed as collected from 1929–1941. We chose
1930 as the estimated start date because the majority of data collection dates listed for each map began in
1930. Airphoto mosaics were used for 1950 data, National High Altitude Photography (NHAP) images
were used for 1984 data, and Digital Ortho Quarter Quad (DOQQ) imagery was used for 2001 and 2010
data. Topographic maps and the 1950 and 1984 datasets were georeferenced to 2010 DOQQ before
analysis.

3
Table 2.1 Data used in historical analysis.
Document Type Data Acquisition
Date Publication Date
Scale or Resolution
Source
USGS topographic map
series
1929–1939 1939, 1940 1:62,500 Mississippi River
Commission
Air photo index mosaic 1950 6 meters Dale Bumpers White River
National Wildlife Refuge
USGS topographic map
series
1964, 1965 1967, 1968 1:24,000 US Geological Survey
NHAP 1984 1984 5 meters US Geological Survey
DOQQ 1994 1994 1 meter US Geological Survey
DOQQ 2001 2001 1 meter US Geological Survey
DOQQ 2010 2010 0.5 meters US Geological Survey
For each data year, both bank lines were digitized, and centerlines were created in a geographic
information system (GIS) environment using midpoint distances between bank lines. Resulting
centerlines were filtered to include segments bounded by successive points 300 feet (ft) distant from the
stream centerline to provide a common scale for each data year.

4
Figure 2.1 Location map of sediment pad and bank retreat measurement sites. Sites with
both listed are collocated.

5
Channel migration during the study period was estimated by superimposing the 1930 and 2010
channel centerlines and creating a series of polygons between successive points of intersection. Channel
migration rate (M) was estimated for each polygon as M=A/(0.5×P)/yr, where A is the area of the
polygon, P is the perimeter of the polygon, and yr the number of years between channel centerlines.
Polygons with a total migration below 30 ft for the entire study period were eliminated because of
potential spatial registration error between datasets.
Bankfull width was estimated by measuring the distance between digitized bank lines every
1600 ft along the river for each data year. Stream distance for width measurements was normalized to
2010 along-stream distance. Sinuosity was measured as the ratio of stream length to valley length.
Benchmarks were established between Clarendon and Norrell Lock to assess current rates and
mechanisms of bank retreat (fig 2.1). The distance from the benchmark to the first vertical face of the
bank was measured periodically to determine contemporary bank retreat rates (fig. 2.2).
first vertical face
Figure 2.2. Photograph of field crew conducting bank retreat
measurement. Distance was measured from benchmark to
first vertical face of bank. (Photograph: Brandon Edwards, 2014)

6
2.1.2 Results
Channel migration rates ranged from 0.43 feet per year (ft/yr) to 17.68 ft/yr between DeValls
Bluff and Norrell Lock (fig. 2.3). The greatest migration rates were measured between DeValls Bluff and
Clarendon, where it averaged 4.59 ft/yr and ranged from 0.59 to 17.68 ft/yr. In comparison, channel
position has remained relatively stable between Clarendon and St. Charles. Migration rates between
Clarendon and St. Charles ranged from 0.49 and 4.27 ft/yr and averaged 2.13 ft/yr. Below St. Charles,
migration rates were only slightly higher, with an average of 2.30 ft/yr, but were more variable, ranging
from 0.43 to 9.51 ft/yr.
Overall channel sinuosity remained stable over the entire study reach, increasing slightly from
1.81 to 1.85 between c. 1930–2010 (table 2.2). Channel sinuosity is highest between DeValls Bluff and
Clarendon and decreased from 2.47 to 2.29 as stream length decreased, although there is variability
throughout the study period. Punctuated decreases resulted from cutoff events. Sinuosity between
Clarendon and St. Charles gradually increased from 1.73 to 1.80. Sinuosity below St. Charles also
gradually increased from 1.65 to 1.74.
Channel width increased over most of the study reach throughout the study period (fig. 2.4). The
average bankfull width between 1930 and 2010 ranged from 453 to 558 ft (fig. 2.5). Approximately
1.31 ft/yr of bank widening occurred in the study reach, with the most rapid period of bank width increase
between 1930 and 1950, and the majority of change took place over the upper 40 miles (mi) of the study
reach. Since 1950, the majority of channel width increase occurred over the lower portion of the study
area. The highest rates of change between river mi 25 and 80 occurred between 1984 and 1994 and
between 1968 and 1984, over approximately the last 14 mi of the study reach (fig. 2.4).
Current bank retreat ranged from 0 to 25 ft over the entire study reach (fig. 2.6), and rates ranged
from 0 to 6.2 ft/yr. Field observations suggest that the majority of bank retreat during the study period
was the result of episodic mass wasting events, which likely explains variability in bank retreat amounts
among sites. Bank retreat rates were fairly consistent across the study reach (fig. 2.4), and mean short-
term bank retreat rates were 2.56, 2.66, and 2.03 ft/yr for the Clarendon, St. Charles, and Jacks Bay areas,
respectively. Mean bank retreat was 2.40 ft/yr. These contemporary bank retreat rates are similar to the
mean channel migration rate of 2.95 ft/yr.
Table 2.2. Stream sinuosity by reach.
Year DeValls Bluff to
Clarendon Clarendon to St.
Charles St. Charles to Norrell lock Entire study reach
1930 2.47 1.73 1.65 1.81
1950 2.51 1.75 1.69 1.81
1968 2.28 1.77 1.69 1.81
1984 2.33 1.78 1.70 1.83
1994 2.36 1.79 1.72 1.85
2001 2.38 1.79 1.72 1.86
2010 2.29 1.80 1.74 1.85

7
Figure 2.3 Channel migration rates, given in feet per year (ft/yr), between DeValls Bluff
and the Norrell lock. Also shown is valley line used to to calculate stream sinuosity.

8
350
400
450
500
550
600
650
700
1030507090110
Ban
kfu
ll w
idth
(ft
)
River mile
1930
1950
1965
1984
1994
2010
Clarendon
St. Charles
Jacks Bay
Figure 2.4 Bankfull width from 1930–2010. Shown are moving averages of bankfull width
calculated from width measurments taken approximately every 1600 feet (ft) of stream distance.
400
425
450
475
500
525
550
575
600
1930 1940 1950 1960 1970 1980 1990 2000 2010
Me
an b
ank
wid
th (
ft)
Year
Figure 2.5 Mean bankfull width in feet (ft) for the entire study reach from 1930–2010.

9
0
5
10
15
20
25
30
10/1/09 10/1/10 10/1/11 9/30/12 9/30/13 9/30/14 9/30/15
Ban
k r
etr
eat
(ft)
Date
CE1 CE2 CE3 CE4 CE5
0
5
10
15
20
25
30
10/1/09 10/1/10 10/1/11 9/30/12 9/30/13 9/30/14 9/30/15
Ban
k r
etr
eat
(ft)
Date
SE1 SE2 SE4 SE5 SE7 SE8 SE9
0
5
10
15
20
25
30
10/1/09 10/1/10 10/1/11 9/30/12 9/30/13 9/30/14 9/30/15
Ban
k r
etr
eat
(ft)
Date
JE1 JE2 JE3 JE4 JE7 JE8 JE9 JE10
A
B
C
Figure 2.6 Amount of bank retreat (expressed in feet (ft)) for sites near
A) Clarendon, (B) St. Charles, and (C) Jacks Bay (top, middle, and bottom panel,
respectively). See figure 2.1 for site location reference.

10
2.2 Channel Incision
2.2.1 Methods
A bank-height survey was conducted over a 3-day period from 21–23 August, 2014, to assess the
degree and upstream limit of channel incision on the lower White River. A laser rangefinder was used to
measure the vertical distance from the waterline to top of bank for each successive section of outer bank
from the Norrell Lock to DeValls Bluff (fig. 2.1). Water surface elevation was stable during the survey
period, but small changes did occur. Survey data were corrected for changes in water surface elevation
over the 3-day period using stage collected at the Clarendon gaging station. Bed elevation data were taken
from a 2013 hydrographic survey by the U.S. Army Corps of Engineers (USACE) Memphis District.
Measurements were taken by a boat that was approximately 60 ft from the bank. We conducted a field
trial to estimate measurement error and found mean error was ±0.6 ft for bank height measurements.
2.2.2 Results
Bank-height survey data clearly showed incision over the lower half of the study reach (fig. 2.7),
and incision is apparent in bed-elevation data (fig. 2.8). The incision knickpoint zone is estimated to be
just upstream of St. Charles, approximately 48 mi upstream of Norrell Lock (river mi 10). Bank height
above and below the estimated knickpoint area exhibits significantly different trends. The upward trend in
bank height below the knickpoint identifies the slope of incision, 0.14 ft/mi, in the incised reach. The
upward trend in bank height appears to stop near the end of the study reach, but data are insufficient to
draw a conclusion as to whether this is due to scatter, a local trend, or if it continues past the end of the
study reach.
Above the knickpoint, the mean bank height above water surface was approximately 13.25 ft. A
linear fit of bank height trend below the knickpoint predicts a bank height of 20.18 ft at the end of the
study reach. A moving average fit of bank height predicts a bank height of 18.86 ft at the end of the study
reach. These measurements yield an incision estimate of between 6.92 and 5.61 ft. If this rate of incision
is extrapolated to the confluence of the White and Mississippi Rivers, 10 mi from the lower boundary of
the study reach, an additional 1.38 ft of incision could be expected. However, the White River below the
Arkansas Post Canal is part of the McClellan-Kerr navigation system and is maintained at greater depth
through dredging, so that extrapolation is not robust.

11
5
10
15
20
25
30
1030507090110
Ban
k h
eig
ht
(ft)
River mile
Clarendon St. Charles Jacks Bay
Figure 2.7 Bank height (expressed in feet (ft)) above water surface on the lower White River
on 21–23 August, 2014. The solid red curve is a moving average trend of bank height measurements.
The dashed gray line represents the linear trend in bank height below the knickpoint zone.
80
100
120
140
160
1030507090110
Be
d e
leva
tio
n (
ft a
bo
ve m
sl)
River mile
Clarendon St. Charles Jacks Bay
Figure 2.8 Bed elevation (expressed in feet (ft) above mean sea level (msl)) from 2013 thalweg survey.
Solid blue line is the moving average of the thalweg values. A break in slope is apparent near St. Charles.

12
2.3 Sedimentation Rates
2.3.1 Methods
Contemporary sedimentation rates were measured by placing a 2–3 square foot sediment pad
(1–2 in. thick) made of feldspar clay at the soil surface. Feldspar powder forms a distinct horizon when
exposed to the elements and marks the location of the surface at the time of installation. Deposition was
estimated at each pad by periodically measuring the amount of deposition that occurred above the
sediment pad.
Feldspar sediment pad transects were established in 2010 and 2011 between Clarendon and
Norrell Lock at the Arkansas Post Canal (fig. 2.1). A total of three transects were established south of
Clarendon, and six transects were established (three north and three south) around St. Charles and Jacks
Bay. Transects started at the bank and extended approximately 2,950 ft into the floodplain except where
distance was limited by water features. Spacing was approximately 330 ft between pads. During the
study, deposition was measured after annual overbank to assess sedimentation rates.
2.3.2 Results
Deposition was highest at the bank and decreased landward from the bank, although some control
on deposition is exhibited by local topography (fig. 2.9). These deposition patterns along transects were
consistent over the entire study reach. Total measured top-bank deposition among transects was highly
variable, ranging from negligible to approximately 4.8 in over 4 years. Top-bank deposition rates ranged
from 0 to approximately 1.35 in./yr (fig. 2.9).
Overall deposition rates increased slightly downstream (fig. 2.9). Mean deposition rates for all
sediment pads in each group of transects were 0.20, 0.24, and 0.28 in./yr for the Clarendon, St. Charles,
and Jacks Bay sites, respectively. However, variability in deposition rates among transects from each
group increased downstream. For example, the greatest recorded deposition rates were in the Jacks Bay
area, but three of the six Jacks Bay transects experienced low or negligible deposition (fig. 2.9). Measured
rates in the Clarendon and St. Charles areas were more consistent among individual transects.

13
0
5
10
15
20
25
30
10/1/09 10/1/10 10/1/11 9/30/12 9/30/13 9/30/14 9/30/15
Ban
k r
etr
eat
(ft)
Date
CE1 CE2 CE3 CE4 CE5
0
5
10
15
20
25
30
10/1/09 10/1/10 10/1/11 9/30/12 9/30/13 9/30/14 9/30/15
Ban
k r
etr
eat
(ft)
Date
SE1 SE2 SE4 SE5 SE7 SE8 SE9
0
5
10
15
20
25
30
10/1/09 10/1/10 10/1/11 9/30/12 9/30/13 9/30/14 9/30/15
Ban
k r
etr
eat
(ft)
Date
JE1 JE2 JE3 JE4 JE7 JE8 JE9 JE10
A
B
C
Figure 2.9 Sediment deposition rates for the (A) Clarendon area, (B) St. Charles area, and
(C) Jacks Bay area sites, respectively. Measurements are in feet (ft) and inches per year (in./yr).

14
2.4 Interpretation of Geomorphic Analyses
Results of the bank-height survey and historical analyses indicate that the study area can be
divided into three distinct reaches based on channel bed slope, channel migration rates, sinuosity, and
trends in channel adjustment. The section between DeValls Bluff and Clarendon is characterized by high
sinuosity and high migration rates and low bed slope. Between 1930 and 2010, this reach experienced
decreasing sinuosity due to cutoff events that shortened stream length.
The reach between Clarendon and St. Charles is characterized by a higher bed slope and a
relatively stable channel with low channel migration rates and low sinuosity. The reach between St.
Charles and Norrell Lock is incised. This reach also has higher migration rates, higher bed slope, and
higher sinuosity than between Clarendon and St. Charles. Sinuosity in both increased slightly over the
study period, indicating an increase in stream length.
Rapid channel width increase between 1930 and 1950 in the upper portion of the study area,
followed by a more gradual, consistent increase in bankfull width, indicates a rapid response to dam
construction, similar to that found in studies documenting temporal sequencing of geomorphic response
to dam closure (as with Grams and others, 2007). Bull Shoals dam was not completed until 1951, but
dams on major tributaries—the Norfork and Black Rivers—were completed in 1943 and 1948. Reduction
in sediment load coupled with flow regulation, specifically an increase in low-flow discharge starting
during the early to mid-1940s (Craig and others, 2001), is probably responsible for the increase in average
bankfull width during this period. Bankfull width over the lower half of the study reach changed little
between 1930–1950, suggesting the influence of the dam closure diminished downstream.
The dominant channel adjustment in the lower portion of the study area was channel incision
followed by bank widening. Results of the bank-height survey clearly show an incised reach from
between St. Charles and the end of the study area, with an incision of 6.5 ft at Norrell Lock. Significant
bank widening occurred between 1965 and 1984 over approximately the lowest 15 mi of the study reach,
followed by significant bank widening between river mi 25 and river mi 80 from 1984 to 1994.
Lack of historical bathymetric data makes it difficult to estimate the temporal connection between
incision and bank widening on the lower White River, but results indicate that incision preceded lateral
erosion, which implies that the bed was more erodible until a threshold was reached after 1965, likely due
to the stabilizing presence provided by forested banks. Most likely, incision led to an over-steepening of
the banks, increases in bank height, and bank toe removal (for example, Simon and Hupp, 1992), which
decreased bank stability. Relatively little bank widening after 1984 in the lowest 15 mi of the study reach
suggests that the system may be trending toward a new equilibrium following upstream advancement of
the knickpoint.
Bank widening after 1984 was substantial over the middle portion of the study area, suggesting
upstream migration of incision followed by bank widening in a similar fashion as above, which is
consistent with field observations of headcutting on small tributaries in the area upstream of Jacks Bay
during the 1990s (Dennis Sharp, retired U.S. Fish and Wildlife Service, personal commun.). Bank
widening decreased upstream, which implies an upstream distance decay of response to a lowered base
level, similar to that noted by other researchers (such as Musselman, 2011). The similarity in bank width
between 1994 and 2010 suggests the lower White River may have entered a period of equilibrium relative
to the changes that accompanied the anthropogenic modifications of the early 20th century.
The reach between DeValls Bluff and Clarendon appears to have a fundamentally different
morphology than below Clarendon. Low slope (fig. 2.8) and punctuated decreases in sinuosity via cutoff
events (table 2.2) suggest aggradational conditions and mechanisms to increase slope, in contrast to the
two other reaches. Sinuosity above Clarendon is approximately double the sinuosity below, even for the
first measurement period. The break in the slope of bed elevation and the difference in sinuosity suggests

15
a local base level (Leopold and Bull, 1979) may exist for the river above that point. In a specific gage
analysis, Shaffner (2012) observed significant degradation at DeValls Bluff compared with Clarendon
following dam closure, suggesting little or no substantive change occurred in the channel at Clarendon.
There are several possible explanations for this, including an inerodible bed at Clarendon, effects of
faulting (Schumm and Spitz, 1996), and the influence of the Cache River from its confluence just
upstream of Clarendon. It is possible that increased sediment load from bank widening following dam
closure exacerbated a pre-existing aggradational condition.
The combined geomorphic response of the White River to flow regulation and the lowered base
level suggests a transition between the dominance of headwater-downstream influences and upstream
effects from the Mississippi exists between Clarendon and St. Charles. Little changed in bankfull width
between 1930–1950 over the lower half of the study reach, suggesting that either the effects of dam
closure diminished downstream or were overwhelmed by backwater effects. Conversely, bank width in
the uppermost portion of the study area has been relatively stable when compared with the downstream
since 1950, suggesting the upstream effects have little influence on the lowered base level.
Incision below St. Charles may affect sedimentation patterns in the incised reach. Sediment
deposition variability increases in the downstream direction, particularly in the incised reach (fig. 2.10).
As mean bank height increases through the incised reach and the connectivity of river flow to the
floodplain likely decreases (as is expected to happen with decreased peak flows as well), deposition is
likely focused on areas of locally low bank height. Areas with high bank heights in the incised reach are
likely bereft of deposition, except under extreme conditions, whereas deposition is fairly consistent with
bank height in the unincised reach (fig. 2.10).

16
0
200
400
600
800
1000
1200
1400
1600
1800
2000
1030507090110
5-y
ear
de
po
siti
on
est
imat
e (
ft3 )
River mile
0
200
400
600
800
1000
1200
1400
1600
1800
2000
-2 -1 0 1 2 3
5 y
ear
de
po
siti
on
est
imat
e (
ft3 )
Relative bank height (ft)
St. Charles sites Clarendon sites Jacks Bay sites
A
B
Figure 2.10 Deposition rates (in cubic feet (ft3)) integrated over first 500 miles of transects
extrapolated to 5-year total deposition versus (A) along-stream distance and (B) local bank height
(expressed in feet (ft)) relative to mean trend in bank height.

17
3. Accuracy of the HEC-GeoRAS Model in Predicting Water Depths in the Floodplain
3.1 Methods
The HEC–RAS (Hydrologic Engineering Centers River Analysis System) parameterized model
for the White River by Lin (Final Report: White River Basin Comprehensive Study: Development of
Unsteady-State Model, undated, unpublished report to the U.S. Army Corps of Engineers Memphis
District) consisted of channel cross-sections from a 2009 hydrographic survey performed by the USACE.
The floodplain digital elevation model (DEM) was a composite of the USGS 10 m (~32.8 ft) DEM and
the Arkansas State 5 m (~16.4 ft) DEM. Manning’s n roughness coefficients for the floodplain and
channel were chosen to maximize agreement between observed and modeled channel flows from 1965 to
2009. The model boundary includes the lower White River floodplain with a buffer of terraces or levees
that do not flood (fig. 3.1).
Upper and lower boundary conditions are required parameters that specify the starting and ending
water surface elevation. We used the daily stage from the White River gauge at Clarendon, Ark., (USACE
WR116) for the upstream boundary and interpolated daily stage for the downstream boundary at the
confluence of the White River and Mississippi River (fig. 3.1). We installed 28 water-level monitoring
stations in three reaches (fig. 3.1) and distributed them among the three Potential Natural Vegetation
(PNV) classes that occupied the majority of the floodplain. Water monitoring stations were also designed
to measure shallow water table depths, so they were constructed as vented wells using 3-ft long, slotted
PVC pipe and installed to at least 1.5 ft below the ground’s surface. At each station, water depth was
monitored using pressure transducers, and the data range is from September 2011 to December 2014. The
recorded water level data created a history of observed flooding depths for each station for comparison to
modeled depths.
3.2 Results
The model’s accuracy varied in its ability to model flood depths by reach. The range of error for
all monitoring sites in modeled flooding depths was ±8 ft. Removing the outlier sites—CC2 and J12—
reduced the range of error to ±5 ft. The average root mean square error (RMSE) was 3.64 ft with a range
of 11.18 ft. The model replicated flood depths in the St. Charles reach (with outlier CC2 excluded) and
showed the least difference when compared with observed flood depth. Replicated flood depths in the
Jacks Bay reach showed the greatest difference when compared with observed flood depth (fig. 3.2).
Differences between the actual and modeled flood depths in the Clarendon reach were intermediate to the
Jacks Bay reach and the St. Charles reach (fig. 3.2). Despite the range of errors in modeled flood depths,
the parameterization of HEC–RAS was successful in replicating observed water surface slopes as
indicated by the 1:1 line. However, the model estimated more gradual slopes than the 1:1 line for most
monitoring stations in the St. Charles reach, so the model is less useful in that instance.

18
A
B
C
D
Figure 3.1 Distribution of water monitoring stations by reach: (A) overall distribution; (B) Clarendon area; (C) St. Charles area; and (D) Jacks Bay area. Source:
10 m USGS digital elevation map (http://nationalmap.gov/elevation.html).
19
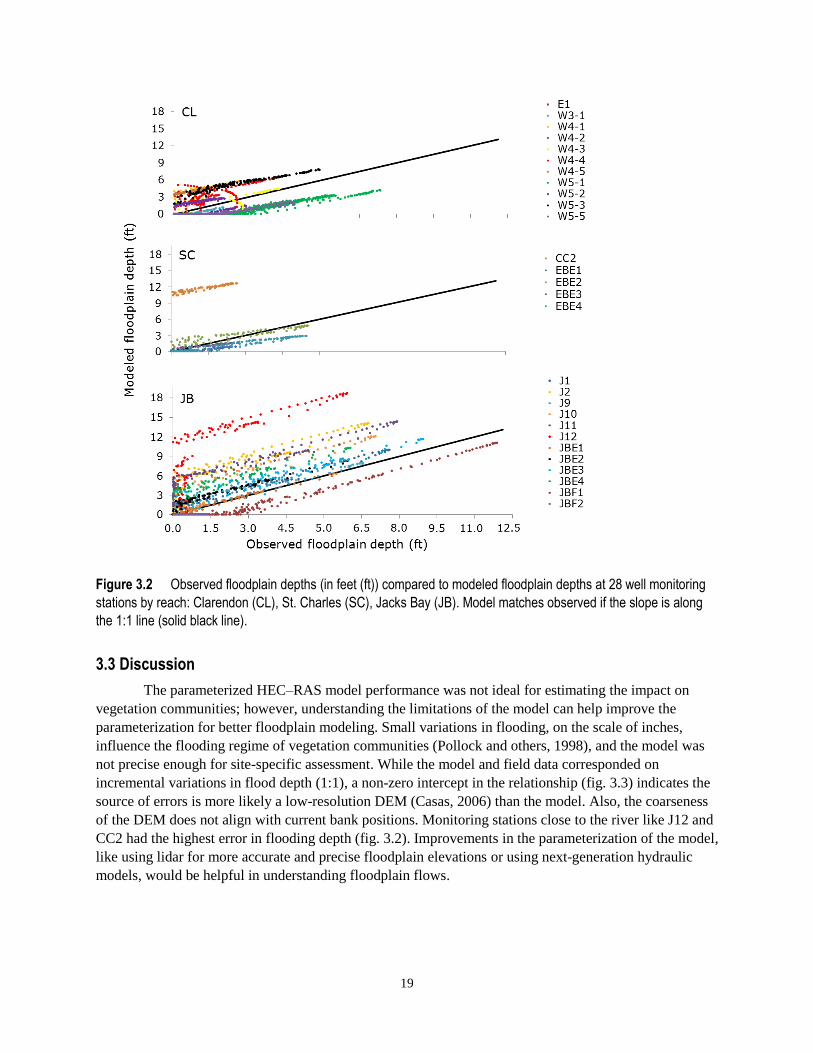
Figure 3.2 Observed floodplain depths (in feet (ft)) compared to modeled floodplain depths at 28 well monitoring
stations by reach: Clarendon (CL), St. Charles (SC), Jacks Bay (JB). Model matches observed if the slope is along
the 1:1 line (solid black line).
3.3 Discussion
The parameterized HEC–RAS model performance was not ideal for estimating the impact on
vegetation communities; however, understanding the limitations of the model can help improve the
parameterization for better floodplain modeling. Small variations in flooding, on the scale of inches,
influence the flooding regime of vegetation communities (Pollock and others, 1998), and the model was
not precise enough for site-specific assessment. While the model and field data corresponded on
incremental variations in flood depth (1:1), a non-zero intercept in the relationship (fig. 3.3) indicates the
source of errors is more likely a low-resolution DEM (Casas, 2006) than the model. Also, the coarseness
of the DEM does not align with current bank positions. Monitoring stations close to the river like J12 and
CC2 had the highest error in flooding depth (fig. 3.2). Improvements in the parameterization of the model,
like using lidar for more accurate and precise floodplain elevations or using next-generation hydraulic
models, would be helpful in understanding floodplain flows.

20
4. Stand Establishment Patterns of Bottomland Hardwoods Within Selected Plant Communities
Before completion of the geomorphic analysis of the river reaches, we established proportional
vegetation plots within the three PNV classes of the lower White River floodplain, as originally classified
by Klimas and others (2009) and later modified by Heitmeyer and Foti (2014). These classes were
Riverine Backwater–Lower Zone, Riverine Overbank–Natural Levee, and Hardwood Flat. The combined
area of these three classes represents over 80 percent of the total acreage within the study area. In addition
to being the three most common PNV classes within the study area, these classes represent three of the
most common geomorphic settings and tree community types discussed in bottomland hardwood
literature: backswamp, levee, and precipitation-driven oak flats.
The Riverine Backwater–Lower Zone PNV class is the part of the floodplain that is generally
lowest in elevation and receives overbank flooding from the river more often than every other year. This
part is sometimes referred to as backswamp but can comprise a significant acreage of ridge and swale
habitat. The tree species described as dominant within The Riverine Backwater–Lower Zone PNV class
by Klimas and others (2009) include overcup oak (Quercus lyrata) with Nuttall oak (Q. texana) or pin
oak (Q. palustris) as associates and baldcypress (Taxodium distichum) and water tupelo (Nyssa aquatica)
in swales and along internal drainages.
The Riverine Overbank–Natural Levee PNV class is the part of the floodplain that is relatively
high in elevation, adjacent to the active river channel, and receives overbank flooding from the river more
often than every 5 years. However, the relative elevation of this natural levee habitat type is often highly
variable due to historical fluvial activity; therefore, the hydrologic and accompanying vegetation
community types may also vary greatly within this PNV class. Trees described by Klimas and others
(2009) as dominant within the Riverine Overbank–Natural Levee PNV class include sycamore (Platanus
occidentalis), eastern cottonwood (Populus deltoides), and black willow (Salix nigra) on the riverfront,
and pecan (Carya illinoensis), cedar elm (Ulmus crassifolia), box elder (Acer negundo), sugarberry
(Celtis laevigata), Nuttall oak, and willow and water oak (Q. nigra) off channel.
The Hardwood Flat PNV class is the part of the floodplain outside the 5-year flood zone that has
a hydrologic regime closely tied to precipitation. These are high elevation oak stands scattered sparsely
throughout both the Riverine Backwater–Lower Zone and Riverine Overbank–Natural Levee PNV
classes; most are Holocene point bar and backswamp deposits. Trees described by Klimas and others
(2009) as dominant within the Hardwood Flat PNV class include delta post oak (Quercus similis), water
oak, swamp chestnut oak (Q. michauxii), and mockernut hickory (C. alba), with willow oak, Nuttall oak,
and green ash in vernal pools.
4.1 Methods
4.1.1 Vegetation Plots
Each PNV class was sampled proportional to its relative percent cover (table 4.1). To capture the
full range of hydrologic conditions found throughout the White River floodplain, plots were further
stratified by river reach (Clarendon, Saint Charles, and Jacks Bay) and distance to the river channel (near
vs. far). Plots near Clarendon are near the northern extent of the study area, approximately 90 river mi
from the confluence of the White and Mississippi rivers. This part of the White River floodplain receives
little backwater effect from the Mississippi River. Plots near St. Charles are approximately 50 river mi
from the mouth of the White River and these plots receive semi-annual backwater flooding from the
Mississippi River. The plots near Jacks Bay are approximately 15 river mi from the confluence of the

21
White and Mississippi Rivers and receive annual backwater flooding from the Mississippi River. Plots
were evenly distributed close to and distant from the river channel.
In the summer of 2011 and 2012 (summer 2014 for tree ring plots), standard biometric techniques
were used to assess stem density, basal area, and tree species importance values at each of the
81 vegetation sampling plots. At each of the 81 sites, a 0.1 acre (ac) (0.04 hectare (ha)) plot was
established using the Forest Inventory and Analysis (FIA) plot design (U.S. Forest Service, 2011). At
each vegetation sampling plot, the diameter at breast height (dbh) of each tree (dbh > 3 in.) was recorded,
and each tree was identified to species. From these data, stem densities and basal areas for each tree
species were calculated. Because geomorphic findings indicated differences among reaches, plots were
reclassified based on reach, and all analyses was conducted based on reach. Species composition, basal
area, stem density, and diameter distributions of major species within each reach were summarized for
comparative purposes.
4.1.2 Stand Development-Tree Ring Analysis
So stand development could be evaluated, a minimum of four plots were established within each
reach of the river (Clarendon, St. Charles, and Jacks Bay) and located in areas representative of locally
dominant PNV classes. In Clarendon, four plots were established in 2014 and two in 2015; in St. Charles,
four plots were established in 2015; and in Jacks Bay, five plots were established in 2014 and two plots in
2015. Therefore, the number of plots for each reach were six in Clarendon, four in St. Charles, and seven
in Jacks Bay. Abnormally high flood conditions during the 2015 growing season precluded establishment
of additional plots. The center of each plot was randomly selected and the plot diameter extended to
include the 20 nearest, living trees with dbh ≥ 3.1 in. We collected two increment cores from each of the
20 trees at a height of 1.6– 3.3 ft depending on basal flaring or evidence of rot.
In total, we cored 340 trees. Cores were returned to the laboratory where they were oven dried at
104 °F for a minimum of 48 hours. Cores were then mounted and sanded with progressively finer grit
sandpaper until individual tree rings were clearly visible under a microscope (Stokes and Smiley, 1996;
Orvis and Grissino-Mayer, 2002). Trees were aged by counting annual rings, and cross-dating among
trees was aided by identifying signature calendar years (Yamaguchi, 1991). For age structure, we
estimated the date of the first year of growth (pith) for increment cores that did not contain the pith ring
using a concentric circle pith estimator (Applequist, 1958). The error associated with the age-to-core
height was assumed to be within the resolution of the age-class bins (10 years) and was not estimated
(Margolis and Balmat, 2009).
4.2 Results
4.2.1 Stand Diameter Distribution
A total of 103 vegetation plots were sampled: 36 plots (3.5-ac sampling area) in the Clarendon
reach, 18 plots (1.8-ac sampling area) in the St. Charles reach, and 49 plots (4.8-ac sampling area) in the
Jacks Bay reach. Total basal area and stem density by reach varied from 138.8 square feet per acre (ft2/ac)
to 121.9 ft2/ac in the south reach. Stem densities varied from 229.5 stems per acre (stems/ac) in the
Clarendon reach to 163.9 stems/ac in the St. Charles reach.
At a species level, regardless of reach, overcup oak and sugarberry had the greatest basal areas
(table 4.1). In the Clarendon reach, overcup oak (23.0 ft2/ac) and sugarberry (22.9 ft2/ac) had nearly
identical basal areas, although sugarberry had 50.8 stems/ac; overcup oak only had 16.4 stems/ac. In the
St. Charles reach, overcup oak had a greater basal area (24.8 ft2/ac) and lower stem density

22
(18.5 stems/ac) than did sugarberry (basal area 18.2 ft2/ac; stem density 42.3 stems/ac). In the Jacks Bay
reach, basal area was more skewed to overcup oak (36.7 ft2/ac) compared to sugarberry (23.1 ft2/ac), but
sugarberry still had higher stem densities (55.5 stems/ac) than overcup (38.2 stems/ac).
Table 4.1. Total basal area (BA) and stems per acre of most common species within three designated reaches of
the White River floodplain. Tree species are as follows: FRPE= Fraxinus pennsylvanica; ULAM = Ulmus americana;
QUTE = Quercus texana; CELA = Celtis laevigata; and QULY = Q. lyrata.
FRPE ULAM QUTE CELA QULY Total
Clarendon area BA (ft2/acre) 14.211 6.488 9.114 22.923 22.954 121.900
Stems/acre 12.916 18.656 5.166 50.801 16.360 229.461
St. Charles area BA (ft2/acre) 13.908 13.143 6.834 18.224 24.883 138.755
Stems/acre 8.140 46.669 5.969 42.328 18.450 163.883
Jacks Bay area BA (ft2/acre) 9.307 2.353 14.703 23.105 36.667 121.999
Stems/acre 14.811 10.847 8.344 55.488 38.174 216.694
Diameter distribution charts (fig. 4.1) should be interpreted with caution because size does not
necessarily indicate age; however, if we assume that smaller size classes are younger stems, then the
diameter distributions suggest that overcup oak recently regenerated based on the number of stems in the
lower two size classes. The Jacks Bay reach, however, supported far more overcup oak stems in the
smaller size classes than any other reach. In the Clarendon and St. Charles reaches, sugarberry and
American elm had the largest number of stems in the smallest size classes, but in the Jacks Bay reach,
sugarberry, water hickory, and overcup oak all had high stem numbers in the small size classes. In those
reaches, overcup oak regeneration was not as prevalent.
4.2.2 Stand Development
Tree ring analyses indicated that in general sugarberry and American elm were younger than
overcup oak and the majority of regeneration occurred following the 1940s (fig. 4.2). Even so, overcup
oak regenerated continuously on the Jacks Bay reach, with about 46 stems/ac established between 1925
and 1955. The tree ring analyses show that overcup oak is not regenerating in the St. Charles and
Clarendon reaches, but this may be an artifact of sampling, as few overcup oak trees were cored in these
sections. Diameter distribution data indicated that there were <8 stems/ac in the smallest size classes on
both reaches. Although most sugarberry stems established since 1940, there were six sugarberry trees that
established before 1900 with the oldest stem established in 1830.
4.3 Discussion
Basal area and diameter distributions of the species are not surprising. The shade-tolerant
sugarberry, and to some extent American elm, often have high basal areas in bottomland hardwood
forests supported by a large number of trees in the smaller size classes. In contrast, overcup oak tended to
have fewer stems in the smaller size classes than sugarberry, but overcup oak had a greater number of
stems in the larger size classes. Overcup oak did appear to regenerate successfully in all reaches in the
recent past, but the Jack’s Bay reach supported the most stems in the smaller size classes. Stem densities
and basal area on all reaches are greater than recommended for priority wildlife in the region (Lower
Mississippi Valley Joint Venture Forest Resource Conservation Working Group, 2007).

23
No evidence indicates that the forest is responding to hydrologic and geomorphic changes, but
overcup oak regeneration is more common in the Jacks Bay than in the St. Charles and Clarendon
reaches. The scarcity of regeneration in those reaches could reduce dominance by overcup oak in the
future. Other vegetation changes cannot be ruled out, but there was no obvious signal in the data.
Floodplains are highly diverse environments, even within a reach, and factors such as the degree of
connectivity to the river, geomorphic surface, and stand disturbance history (as with timber harvesting)
create substantial variability. Although we sampled a large number of vegetation plots and cored many
trees (relative to similar studies), the sampling effort is probably too small to detect subtle vegetation
changes. Furthermore, legacy effects often follow hydrologic and geomorphic changes so that dominant
vegetation reflects previous hydrologic and geomorphic conditions rather than current conditions (see
Hamilton, 2014). Continued monitoring of vegetation plots, as with current efforts at the White River
National Wildlife Refuge, can help identify future vegetation changes.

24
0
5
10
15
20
0 2 4 6 8 10 12 14 16 18 20 22 24 26 28 30 32 34
Ste
ms/
acre
Diameter (in.)
Clarendon
QULY
FRPE
CELA
ULAM
0
5
10
15
20
0 2 4 6 8 10 12 14 16 18 20 22 24 26 28 30 32 34
Ste
ms/
acre
Diameter (in.)
St. Charles
QULY
FRPE
CELA
ULAM
0
5
10
15
20
0 2 4 6 8 10 12 14 16 18 20 22 24 26 28 30 32 34
Ste
ms/
ac
Diameter (in.)
Jacks Bay
QULY
FRPE
CELA
ULAM
CAAQ
A
B
C
Figure 4.1 Number of trees per acre in each approximate 2.0 inch (in.) diameter class for the
most common bottomland hardwood species along the (A) Clarendon, (B) St. Charles, and
(C) Jacks Bay reaches of the White River floodplain. Carya aquatica was found in low abundance
except on the lower reach.

25
0
2
4
6
8
10
12
14
16
18
20
22
24
18
10
18
15
18
20
18
25
18
30
18
35
18
40
18
45
18
50
18
55
18
60
18
65
18
70
18
75
18
80
18
85
18
90
18
95
19
00
19
05
19
10
19
15
19
20
19
25
19
30
19
35
19
40
19
45
19
50
19
55
19
60
19
65
19
70
19
75
19
80
19
85
19
90
Ind
ivid
ual
s/ac
re
Year
Clarendon
sugarberry
American elm
green ash
overcup oak
Nuttall oak
Figure 4.2 Establishment dates of common bottomland hardwood trees cored within the Clarendon reach.

26
0
2
4
6
8
10
12
14
16
18
20
22
24
18
10
18
15
18
20
18
25
18
30
18
35
18
40
18
45
18
50
18
55
18
60
18
65
18
70
18
75
18
80
18
85
18
90
18
95
19
00
19
05
19
10
19
15
19
20
19
25
19
30
19
35
19
40
19
45
19
50
19
55
19
60
19
65
19
70
19
75
19
80
19
85
19
90
Ind
ivid
ual
s/ac
re
Year
St. Charles
sugarberry
American elm
green ash
overcup oak
Nuttall oak
willow oak
Figure 4.3 Establishment dates of common bottomland hardwood trees cored within the St. Charles reach.

27
0
2
4
6
8
10
12
14
16
18
20
22
24
18
10
18
15
18
20
18
25
18
30
18
35
18
40
18
45
18
50
18
55
18
60
18
65
18
70
18
75
18
80
18
85
18
90
18
95
19
00
19
05
19
10
19
15
19
20
19
25
19
30
19
35
19
40
19
45
19
50
19
55
19
60
19
65
19
70
19
75
19
80
19
85
19
90
Ind
ivid
ual
s/ac
re
Year
Jacks Bay
sugarberry
American elm
green ash
overcup oak
Nuttall oak
willow oak
Figure 4.4 Establishment dates of common bottomland hardwood trees cored within the Jacks Bay reach.

28
5. Project Summary and Management Recommendations
The study area of the White River consists of three geomorphically distinct reaches defined by
bed slope and other channel adjustments to anthropogenic-induced change. The dominant geomorphic
effect on the river below St. Charles has been incision in response to the incision of the Mississippi River.
The dominant geomorphic effect on the river between Clarendon and DeValls Bluff has been channel
widening, likely caused by upstream dams. The reach between St. Charles and Clarendon has been least
affected by geomorphic change.
Despite the range of errors in modeled flood depths, the parameterization of HEC–RAS was
successful in replicating observed water surface slopes but with deviation near St. Charles. The
parameterized HEC–RAS model performance was not ideal for estimating impacts on vegetation
communities because errors in modeled flood depth were excessive. The origin of these errors is the low
resolution DEM available for flood modeling, which failed to reflect the subtle topographic changes that
influence spatial variations in flooding and species distribution. The next generation of topographic data
and flood modeling are expected to improve resolution substantially.
No conclusive evidence indicates that the forest is responding to hydrologic and geomorphic
changes, but overcup oak regeneration is far more common in the Jacks Bay reaches than in the St.
Charles and Clarendon reaches. Hydrologic alterations (reduced spring flooding (Gee, 2012)) in those
reaches could reduce dominance by overcup oak in the future. Seed germination of overcup oak is
enhanced by flooding (Pierce and King, 2007), and lack of flooding leads to increased stem densities
(Hanberry and others, 2012), which can further reduce light availability and the regeneration of overcup
oak. Other vegetation changes cannot be ruled out, but there was no obvious signal in the data. Some
evidence shows that abundant oak regeneration is occurring on the lower White floodplain, which
contrasts with other sites in the region that have greater hydrological alterations (for example, Gee and
others, 2014).
Although the lowermost reach is incised, Montgomery Point lock and dam could be ameliorating
some effects of the incision because it mimics the base level before incision of the Mississippi River.
Lacking the artificially high water levels caused by the dam, effective bank heights would be higher and
the river level would be farther below the floodplain. Dredging the study area is likely to increase incision
and contribute to channel instability. Dredging constitutes artificial base level lowering and sediment
deprivation, and these two processes are dominant in existing instability. Altered flows from upstream
dams have likely affected the channel banks, and shifts toward more naturally distributed flows would
probably improve this problem. Specifically, increased low flows that occurred in the post-dam era
contribute to bank collapse, but there are other possible contributors to instability (such as land use or the
conditions of tributaries).
Subsurface hydrology in the floodplain remains a significant unknown, especially in the root zone
of forests in the incised reach. Hydrologic conditions in the incised reach are linked to river hydrology
and were at least locally affected by channel changes (especially incision). Changes in the subsurface
hydrology of the floodplain affect productivity and forest species composition. Establishing groundwater
monitoring stations could provide useful data for adaptive management of this resource.
Monitoring forest conditions is necessary to identify compositional changes because of time lags
and legacy effects in how forests respond to hydrologic and geomorphic changes (Katz and others, 2005;
Dufour and Piégay, 2008; Greene and Knox, 2014). Long-lived floodplain tree species can persist for
long periods in conditions unsuitable for the regeneration of those species and in conditions that decrease
growth. The hydrologic effects of altered flooding and root-zone hydrology might not be apparent until a
disruptive event, such as logging or a tornado, affects the forest.

29
Monitoring the knickpoint location with bathymetric surveys and bank-height surveys would be
key in monitoring geomorphic change. The knickpoint delimits the upper extent of the effect of incision,
which is the largest geomorphic change occurring on the river.
The far-ranging impact of backwater flooding on the White River floodplain complicates
planning for river management: the White-Arkansas-Mississippi confluence zone is a highly integrated,
multi-river system that precludes the isolated management of a single river. Incision rendered the White
River unable, except in rare events, to flood this lower floodplain by means of headwater flooding, so the
backwater effect is more important for site hydrology and ecology than in the past. Altering sediment or
flow regimes in the Arkansas River is likely to result in extreme changes to this forest.
6. References
Allen, S.T., Krauss, K., Cochran, J.W., King, S.L., and Keim, R.F., 2016, Wetland tree transpiration
modified by river‐floodplain connectivity: Journal of Geophysical Research Biogeosciences v. 121,
accessed March 20, 2016, at http://dx.doi.org/10.1002/2015JG003208.
Applequist, M.B., 1958, A simple pith locator for use with off-center increment cores: Journal of
Forestry, v. 56, no. 2, p. 141. [Also available at
http://www.ingentaconnect.com/content/saf/jof/1958/00000056/00000002/art00013#expand/collapse.]
Biedenharn, D.S., and Watson, C.C., 1997, Stage adjustment in the lower Mississippi River, USA:
Regulated Rivers—Research and Management v. 13, no. 6, p. 517–536, accessed June 16, 2014, at
http://dx.doi.org/10.1002/(sici)1099-1646(199711/12)13:6%3C517::aid-rrr482%3E3.0.co;2-2.
Casas, A., Benito, G., Thorndycraft, V.R., and Rico, M., 2006, The topographic data source of digital
terrain models as a key element in the accuracy of hydraulic flood modelling: Earth Surface Processes
and Landforms v. 31, no. 4, p. 444–456, accessed September 4, 2015, at
http://dx.doi.org/10.1002/esp.1278.
Craig, M.A., Kitchens, W.E., and Wise, W.R., 2001, Analysis of Hydrologic Data for the White River
Basin [Final report, research work order no. 203]: Gainesville, University of Florida, 10 p. [Also
available at http://aquaticcommons.org/1001/1/Craig,__M.A._2001.pdf.]
Dufour, S., and Piégay, H., 2008, Geomorphological controls of Fraxinus excelsior growth and
regeneration in floodplain forests: Ecology v. 89, no. 1, p. 205–215, accessed May 5, 2015, at
http://dx.doi.org/10.1890/06-1768.1.
Gee, Hugo, 2012, The effects of hydrologic modifications on floodplain forest tree recruitment and
growth in the Mississippi River Alluvial Valley, USA: Baton Rouge, Louisiana State University, Ph.D.
dissertation, 140 p. [Also available at http://etd.lsu.edu/docs/available/etd-04172012-
145151/unrestricted/geediss.pdf.]
Gee, H.K.W., King, S.L., and Keim, R.F., 2014, Tree growth and recruitment in a leveed floodplain
forest in the Mississippi River Alluvial Valley, USA: Forest Ecology and Management, v. 334,
p. 85–95. [Also available at http://dx.doi.org/10.1016/j.foreco.2014.08.024.]
Gee, H.K.W., King, S.L., and Keim, R.F., 2015, Influence of hydrologic modifications on Fraxinus
pennsylvanica in the Mississippi River Alluvial Valley, USA: Canadian Journal of Forest Research,
v. 45, no. 10, p. 1397–1406. [Also available at http://dx.doi.org/10.1139/cjfr-2015-0138.]

30
Grams P.E., Schmidt, J.C., and Topping, D.J., 2007, The rate and pattern of bed incision and bank
adjustment on the Colorado River in Glen Canyon downstream from Glen Canyon Dam, 1956–2000:
Geological Society of America Bulletin v. 119, nos. 5–6, p. 556–575, accessed October 3, 2015, at
http://dx.doi.org/10.1130/b25969.1.
Greene, S.L., and Knox, J.C., 2014, Coupling legacy geomorphic surface facies to riparian vegetation—
Assessing red cedar invasion along the Missouri River downstream of Gavins Point dam, South
Dakota: Geomorphology, v. 204, p. 277–286, accessed July 1, 2015, at
http://dx.doi.org/10.1016/j.geomorph.2013.08.012.
Hamilton, S.G., 2014, Effect of hydrologic, geomorphic, and vegetative conditions on avian communities
in the Middle Rio Grande of New Mexico: Baton Rouge, Louisiana State University, M.S. Thesis.
[Also available at http://etd.lsu.edu/docs/available/etd-07112014-
214309/restricted/S_Hamilton_Thesis.pdf.]
Hanberry, B.B., Kabrick, J.M., He, H.S., and Palik, B.J., 2012, Historical trajectories and restoration
strategies for the Mississippi River Alluvial Valley: Forest Ecology and Management, v. 280,
p. 103–111, accessed January 27, 2015, at http://dx.doi.org/10.1016/j.foreco.2012.05.033.
Heitmeyer, M.E., and Foti T.L., 2014, Hydrogeomorphic evaluation of ecosystem restoration and
management options for Dale Bumpers White River National Wildlife Refuge: Advance, Mo.,
Greenbrier Wetland Services, Report no. 14–06 (prepared for the U.S. Fish and Wildlife Service
Region 4), 80 p. [Also available at https://catalog.data.gov/dataset/hydrogeomorphic-evaluation-of-
ecosystem-restoration-and-management-options-for-dale-bumper.]
Hupp C.R., 1992. Riparian vegetation recovery patterns following stream channelization: a geomorphic
perspective: Ecology v. 73, no. 4, p. 1209–1226, accessed September 2, 2014, at
http://dx.doi.org/10.2307/1940670.
Hupp, C.R., and Bornette, Gudrun, 2003. Vegetation, fluvial processes and landforms in temperate areas,
chap. 10 in Piegay, Hervé, and Kondolf, G.M., eds., Tools in Geomorphology, Chichester, United
Kingdom, Wiley, p. 269–288. [Also available at http://dx.doi.org/10.1002/0470868333.ch10.]
Hupp, C.R., Pierce, A.R., and Noe, G.B., 2009a, Floodplain geomorphic processes and environmental
impacts of human alteration along coastal plain rivers, USA: Wetlands v. 292, no. 2, p. 413–429,
accessed June 12, 2015, at http://dx.doi.org/10.1672/08-169.1.
Hupp, C.R., Schenk, E.R., Richter, J.M., Peet, R.K., and Townsend, P.A., 2009b, Bank erosion along the
dam-regulated lower Roanoke River, North Carolina Geological Society of America, Special Papers,
v. 451, p. 97–108, accessed June 12, 2015, at http://dx.doi.org/10.1130/2009.2451(06).
Hupp, C.R., Schenk, E.R., Kroes, D.E., Willard, D.A., Townsend, P.A., and Peet R.K., 2015, Patterns of
floodplain sediment deposition along the regulated lower Roanoke River, North Carolina: Annual,
decadal, centennial scales: Geomorphology, v. 228, p. 666–680, accessed November 28, 2015, at
http://dx.doi.org/10.1016/j.geomorph.2014.10.023.
Katz, G.L., Friedman, J.M., and Beatty, S.W., 2005, Delayed effects of flood control on a flood-
dependent riparian forest: Ecological Applications, v. 15, no. 3, 1019–1035, accessed
February 22, 2015, at http://dx.doi.org/10.1890/04-0076.
Knox, J.C. 2006. Floodplain sedimentation in the Upper Mississippi Valley—Natural versus
human accelerated: Geomorphology, v. 79, nos. 3–4, p. 286–310, accessed July 10, 2015, at
http://dx.doi.org/10.1016/j.geomorph.2006.06.031.

31
Klimas, Charles, Murray, Elizabeth, Foti, Thomas, Pagan, Jody, Williamson, Malcolm, and Langston,
Henry, 2009, An ecosystem restoration model for the Mississippi Alluvial Valley based on
geomorphology, soils, and hydrology: Wetlands, v. 29, no. 2, p. 430–450, accessed June 25, 2013, at
http://dx.doi.org/10.1672/08-99.1.
Leopold, L.B., and Bull, W.B., 1979, Base level, aggradation, and grade: Proceedings of the American
Philosophical Society, v. 123, no. 3, p 168–202. [Also available at http://www.jstor.org/stable/986220.]
Ligon, F.K., Dietrich, W.E., and Trush W.J., 1995, Downstream ecological effects of dams: BioScience,
v. 45, no. 3, p. 183–192, accessed May 26, 2013, at http://dx.doi.org/10.2307/1312557.
Lower Mississippi Valley Joint Venture Forest Resource Conservation Working Group (LMVJV), 2007,
Final Report—Restoration, management, and monitoring of forest resources in the Mississippi Alluvial
Valley—Recommendations for enhancing wildlife habitat (version 5.2)(Wilson, Randy; Ribbeck,
Kenny; King, Sammy; and Twedt, Dan, eds.): Jackson, Miss., Lower Mississippi River Valley Joint
Venture, 137 p.
Margolis, E.Q., and Balmat, Jeff, 2009, Fire history and fire-climate relationships along a fire regime
gradient in the Santa Fe municipal watershed, NM, USA: Forest Ecology and Management, v. 258,
no. 11, p. 2416–2430, accessed March 27, 2015, at http://dx.doi.org/10.1016/j.foreco.2009.08.019.
Musselman, Z.A., 2011, The localized role of base level lowering on channel adjustment of tributary
streams in the Trinity River basin downstream of Livingston Dam, Texas, USA: Geomorphology,
v. 128, nos. 1–2, p. 42–56, accessed December 12, 2015, at
http://dx.doi.org/10.1016/j.geomorph.2010.12.021.
Nanson, G.C., and Croke, J.C., 1992, A Genetic Classification of Floodplains: Geomorphology, v. 4,
no. 6, p. 459–486, accessed January 12, 2015, at http://dx.doi.org/10.1016/0169-555x(92)90039-q.
Nanson, G.C., and Huang, H.Q., 2008, Least action principle, equilibrium states, iterative adjustment and
the stability of alluvial channels: Earth Surface Processes and Landforms, v. 33, no. 6, p. 923–942.
Orvis, K.H., and Grissino-Mayer, H.D., 2002, Standardizing the reporting of abrasive papers used to
surface tree-ring samples: Tree-Ring Research v. 58, nos. 1–2, p. 47–50. [Also available at
http://hdl.handle.net/10150/262564.]
Osterkamp, W.R., and Hupp, C.R., 2010, Fluvial processes and vegetation—Glimpses of the past,
the present, and perhaps the future: Geomorphology, v. 116, nos. 3–4, p. 274–285, accessed
March 17, 2014, at http://dx.doi.org/10.1016/j.geomorph.2009.11.018.
Phillips, J.D., 2010, The job of the river: Earth Surface Processes and Landforms, v. 35, no. 3,
p. 305–313, accessed November 10, 2014, at http://dx.doi.org/10.1002/esp.1915.
Phillips, J.D., Slattery, M.C., and Musselman, Z.A., 2005, Channel adjustments on the lower Trinity
River, Texas, downstream of Livingston Dam: Earth Surface Processes and Landforms, v. 30, no. 11,
p.1419–1439, accessed January 2, 2015, at http://dx.doi.org/10.1002/esp.1203.
Pierce, A.R., and King, S.L., 2007, The effects of flooding and sedimentation on seed germination of two
bottomland hardwood tree species: Wetlands, v. 27, no. 3, p. 588–594. [Also available at
http://dx.doi.org/10.1672/0277-5212(2007)27[588:teofas]2.0.co;2.]
Pollock, M.M., Naiman, R.J., and Hanley T.A., 1998, Plant species richness in riparian wetlands–
A test of biodiversity theory: Ecology, v. 79, no. 1, p. 94–105, accessed March 3, 2014, at
http://dx.doi.org/10.2307/176867.

32
Schenk, E.R., and Hupp, C.R., 2009, Legacy Effects of Colonial Millponds on Floodplain Sedimentation,
Bank Erosion, and Channel Morphology, Mid-Atlantic, USA: JAWRA Journal of the American Water
Resources Association, v. 45, no. 3, p. 597–606, accessed March 4, 2015, at
http://dx.doi.org/10.1111/j.1752-1688.2009.00308.x.
Schumm, S.A., and Spitz, W.J., 1996, Geological influences on the Lower Mississippi River and its
alluvial valley: Engineering Geology, v. 45, nos. 1–4, p. 245–261, accessed February 22, 2014, at
http://dx.doi.org/10.1016/s0013-7952(96)00016-6.
Shaffner, A.L., 2012, Specific gage analysis on the lower White River, Arkansas: Southern Illinois
University Carbondale, Illinois, M. S. Thesis. [Also available at
http://opensiuc.lib.siu.edu/cgi/viewcontent.cgi?article=2017&context=theses.]
Simon, Andrew, and Hupp, C.R., 1992, Geomorphic and vegetative recovery processes along modified
stream channels of West Tennessee: U.S. Geological Survey Open-File Report 91–502; 142 p.,
accessed January 12, 2015, at https://pubs.er.usgs.gov/publication/ofr91502.
Simon, Andrew, and Rinaldi, Massimo, 2006, Disturbance, stream incision, and channel evolution—
The roles of excess transport capacity and boundary materials in controlling channel response:
Geomorphology, v. 79, nos. 3–4, p. 361–383, accessed December 2, 2014, at
http://dx.doi.org/10.1016/j.geomorph.2006.06.037.
Stokes, M.A., and Smiley, T.L., 1996, An introduction to tree-ring dating: Tucson, AZ, University of
Arizona Press, 73 p.
United States Forest Service, 2011, Forest Inventory and Analysis National Core Field Guide Volume I:
Field Data Collection Procedures for Phase 2 Plots Version 5.1
U.S. Army Corps of Engineers, 1939, 15-minute series maps [Arkansas and Mississippi]: Vicksburg,
Miss., Mississippi River Commission, accessed May 27, 2016,
at https://www.sciencebase.gov/catalog/folder/4f4fede8e4b0bac7385da2ea.
U.S. Department of Agriculture, 1937–1954, Indexes to aerial photography of Prairie County, Arkansas:
Washington, D.C., National Archives at College Park—Cartographic (RDSC), scale 1:20,000. [Media
data accessible at https://research.archives.gov/id/1137013.]
U.S. Department of Agriculture, 1937–1954, Indexes to aerial photography of Monroe County, Arkansas:
Washington, D.C., National Archives at College Park—Cartographic (RDSC), scale 1:20,000. [Media
data accessible at https://research.archives.gov/id/1137213.]
U.S. Department of Agriculture, 1937–1954, Indexes to aerial photography of Phillips County, Arkansas:
Washington, D.C., National Archives at College Park—Cartographic (RDSC), scale 1:20,000. [Media
data accessible at https://research.archives.gov/id/1137228.]
U.S. Department of Agriculture, 1937–1954, Indexes to aerial photography of Prairie County, Arkansas:
Washington, D.C., National Archives at College Park—Cartographic (RDSC), scale 1:20,000. [Media
data accessible at https://research.archives.gov/id/1137360.]
U.S. Geological Survey, 2012, Map locator & downloader, The USGS Store: U.S. Geological Survey
Web page, accessed June 02, 2016, at http://store.usgs.gov/b2c_usgs/usgs/maplocator.do.
U.S. Geological Survey, 2015a, Digital orthophoto quadrangles, Long term archive products [Arkansas
and Mississippi]: U.S. Geological Survey Long Term Archive, accessed May 27, 2016, at
https://lta.cr.usgs.gov/products_overview/.

33
U.S. Geological Survey, 2015b, Long term archive products [Arkansas and Mississippi]: U.S. Geological
Survey Long Term Archive, accessed May 27, 2016, at https://lta.cr.usgs.gov/products_overview/.
U.S. Geological Survey, 2015c, National Agriculture Imagery Program [Arkansas and Mississippi], Long
term archive products: U.S. Geological Survey Long Term Archive, accessed May 27, 2016, at
https://lta.cr.usgs.gov/products_overview/.
U.S. Geological Survey, 2016, Historical topographic map collection [Arkansas and Mississippi]:
U.S. Geological Survey TopoView Collection, accessed June 02, 2016,
at http://ngmdb.usgs.gov/maps/TopoView/.
Williams GP, MG Wolman, 1984, Downstream effects of dams on alluvial rivers. U.S. Geological Survey
Professional Paper 1286, 83 p., accessed December 1, 2014, at
https://pubs.er.usgs.gov/publication/pp1286.
Yamaguchi, D.K., 1991, A simple method for cross-dating increment cores from living trees: Canadian
Journal of Forest Research, v. 21, no. 3, p. 414–416, accessed November 12, 2014, at
http://dx.doi.org/10.1139/x91-053.
