theroy of low transitions in co discharge lasers · theory of low transitions in co discharge...
TRANSCRIPT

a z c
F
F 00 00
THEORY OF LOW TRANSITIONS IN CO DISCHARGE LASERS
Burry D. Sidney, Roy M . McInville, Neill S. Smith, und H. A . Hussun
Lungley Reseurch Center Humpton, Vu. 23665
N A T I O N A L AERONAUTICS A N D SPACE A D M I N I S T R A T I O N W A S H I N G T O N , D. C. M A Y 1976
https://ntrs.nasa.gov/search.jsp?R=19760016470 2018-08-18T00:52:33+00:00Z
TECH LIBRARY KAFB, NM
- . . ~ - .
19. Security Classif. (of this report) 20. Security Classif. (of this page) 1 21. NO. ;!Pages
Unclassified I .- Unclassified
I llllll I Ill1 Ulll lllll lllll11111 Ill1 1111
22. Price'
$4.25
~~
2. Government Accession No. I - ..
1. Report No.
NASA TN D-8181 4. Title and Subtitle
THEORY O F LOW TRANSITIONS IN CO DISCHARGE LASERS
7. Authorls)
Barry D. Sidney, Roy M. McInville, Neill S. Smith, and H. A. Hassan
NASA Langley Research Center Hampton, Va. 23665
9. Performing Organization Name and Address
3. Recipient 0133844
5. Report Date May 1976
6. Performing Organization Code
8. Performing Organization Report No.
L - 10589 - 10. Work Unit No.
506 -25-43-01 1 1 . Contract or Grant No.
13. Type of Report and Period Covered
Technical Note ~~~~
14. Sponsoring Agency Code
12. Sponsoring Agency Name and Address
National Aeronautics and Space Administration Washington, D.C. 20546
15. Supplementary Notes
Barry D. Sidney: Langley Research Center. Roy M. McInville, Neill S. Smith, and H. A. Hassan: North Carolina State University
. - a t Raleigh. - -- .~
16. Abstract
A self -consistent theoretical model which couples the electron and heavy particle finite-rate kinetics with the optical and fluid dynamic processes has been employed to identify the various pa rame te r s and explain the mechanism responsible for producing low- lying transitions in slow-flowing CO lasers. can be achieved at low tempera tures fo r low p res su res (or low-flow ra t e s ) together with high par t ia l p re s su res of He and N2. responsible for reducing the electron temperature to a range where the t ransfer of e lec- t r i ca l power to the lower vibrational modes of CO is optimum.
It is found that lasing on low-lying t ransi t ions
The ro le of N2 has been identified as an additive
17. Key Words (Suggested by Author(s) )
CO laser Chemical kinetics
18. Distribution Statement
Unclassified - Unlimited
Subject Category 36
For sale by the Nat ional Technical In fo rmat ion Service, Springfield. Virginia 221 61

THEORY OF LOW TRANSITIONS IN CO DISCHARGE LASERS
Barry D. Sidney, Roy M. McInville, * Neil1 S. Smith, * and H. A. Hassan*
Langley Research Center
SUMMARY
A self -consistent theoretical model which couples the electron and heavy particle finite -rate kinetics with the optical and fluid dynamic processes has been employed to identify the various parameters and explain the mechanism responsible for producing low-lying transitions in slow-flowing CO lasers. transitions can be achieved at low temperatures for low pressures (or low-flow rates) together with high partial pressures of He and N2. an additive responsible for reducing the electron temperature to a range where the t rans- fer of electrical power to the lower vibrational modes of CO is optimum.
It is found that lasing on low-lying
The role of N2 has been identified as
INTRODUCTION
Molecular gas lasers have received considerable attention in recent years because of their high efficiencies and high power capabilities in the infrared region. is of particular interest because of its high quantum efficiency and i ts ability to oscillate on a number of vibrational -rotational bands. bands are strongly attenuated by atmospheric water vapor; however, low-lying transitions with wavelengths below 5 ym propagate in the atmosphere with relatively high transmit- tivity. (See ref. 1.) Moreover, the 1 - 0 transition can be used for detecting CO in long-path absorption measurements. lying vibrational bands in the 5-pm region makes it an indispensable tool in atmospheric transmission land probing experiments.
The CO laser
Transitions involving higher vibrational
Thus, the ability of the CO laser to operate on low-
The objective of this study is to identify the various parameters and explain the mechanism responsible for producing low-lying vibrational transitions in CO laser systems. centration in a CO-N2-He electric discharge system are two factors influencing the appearance of low-lying vibrational transitions. the recent analysis of the high-flow laser systems by Smith and Hassan.
Experiments (refs. 2 to 4) have shown that low temperature and low CO con-
Both of these effects were evident in (See ref. 5.)
* North Carolina State University at Raleigh.

IIIIIIII I1 I Ill l1ll111l1111l
For the study reported in this paper, a self-consistent model was formulated and was used to evaluate the manner in which the operating conditions, that is, pressure, flow rate, mixture ratios and power, affect the low-lying transitions. The need for a self- consistent model became evident because earlier analyses of slow-flow CO lasers (refs. 2 and 6 to 8) assumed certain flow properties which could be determined as part of the solution. Thus, the theories of references 2, 6, and 7 assume the electron distribu- tion function to be Maxwellian at some given electron temperature; moreover, these theories assume the electron number density and the gas temperature. The effect of such assumptions is that important phenomena resulting from the coupling of the kinetics and fluid dynamic processes of the electrons and heavy particles are ignored. Center and Caledonia (ref. 8) have also presented calculations for slow-flow CO lasers in which the distribution function was obtained from a solution of an appropriate Boltzmann equa- tion; however, they had to assume a value for the gas temperature. In contrast to these theories, the present model couples the kinetics of the electrons and heavy particles with the optical and fluid dynamic processes in the laser system. It treats molecules in dif- ferent quantum states as different species and employs the electron Boltzmann equation and the conservation of species, mass, momentum, and energy equations to describe the system. For a given geometry, voltage, current, gas composition, pressure, mass flow rate, and reflectivities, the theory can predict the number densities of the electrons and the excited states of the heavy particles, the electron and gas temperatures, the intensi- ties of the lasing transitions, and efficiency.
These theoretical results are compared with gain and intensity measurements obtained with a slow-flow CO electric discharge laser of conventional design. (See ref. 9 and fig. 1.) In general, the comparisons show good agreement and indicate the validity of the model developed here.
The work carried out at North Carolina State University at Raleigh w a s supported in par t by NASA Grant NSG-1013.
SYMBOLS
cross-sectional area of laser tube
empirical constant in equation (A20)
quantity defined by equations (B7)
spontaneous emission coefficients of vibration level v of CO

a
e
F
FV
f C
radius of laser tube
Bohr radius
rotational constant for ground state of species s
quantity defined by equations (B7)
backward vibration-translation rate coefficient defined by equation (A17)
rotational constant of vibrational level v of CO defined by equation (C8)
quantity defined in equations (A3)
quantity defined in equations (B7)
velocity of light
quantity defined in equations (B7)
quantity defined in equation (C9)
collision diameter of Lennard-Jones potential for species s and t
collision diameter defined in equation (A8)
electric field strength
electric field strength vector
energy of vibrational level v of species s and t
electronic charge of electron
adiabaticity factor defined by equations (A4) and (A5)
quantity defined by equation (C7)
collision frequency defined in equations (C4)
3

GS
H
HO
h
hS
hs,v
I
IS, 4
%,J
KD
KsD
KSQ
electron energy distribution function
anharmonic vibrational energy function defined by equations (16)
function defined by equation (B11)
specific enthalpy of gas mixture defined by equation (15)
specific enthalpy of gas mixture at tube entrance
Planck's constant
specific enthalpy of species s
specific enthalpy of vibrational level v of species s
a r c current
ionizational potential of species s and t
intensity
rotation quantum number
current density
current density vector
quantity defined in equations (B8)
quantity defined in equations (B8)
quantity defined in equations (B3)
quantity defined in equations (B5)
empirical constant in equation (A2)
empirical constant in equation (A21)
4

. . . ..
k
L
Lopt
st Lv,vl
Qst
M
me
mt
m
N
Ne
NS
Ns, J
P V
p:, J
Boltzmann's constant
length of laser tube
length of optical axis
long-range vibration-vibration rate coefficient defined by equation (A20)
empirical constant in equations (A3)
average mass defined in equations (B8)
electron mass
mass of species s
quantity defined by equations (A3)
total mass flow rate
mass flow rate of species s
total number density
density of electron
number density of species s
number density of species s with rotational quantum number J
number density of species s in vibrational level v
rotational branch of a given vibrational transition
power from vibrational level v
rate for electron impact excitation from vibrational level J
5

I I I 11111 IIll1l11l1lllI
PS v,v'
P
PTSt
QS
QsJ
Qs*J
Qsm
Qsv
QT
QW
Q1, Q2 - q
RS, Rc
Rs, v
electron impact vibrational excitation rate for species s defined by equations (B20) and (B21)
static pressure
relaxation t ime of species s by species t
energy loss due to lasing
energy loss by spontaneous emission
electron inelastic c ross section with energy loss uSJ for species s
electron inelastic c ross section with energy gain us J for species s
momentum transfer c ross section for electrons in species s
electron inelastic c ross section with energy loss usv for species s
total heat loss
heat loss by wall transfer
c ross sections defined in equations (B8)
heat flux vector
particle rate of production of species s and t
particle ra te of production of vibrational level v of species s
vibrational matrix element of species s
ionizational energy of ground state of Bohr atom
distance in radial direction
mirror reflectivities
line shape factor defined by equation (C3)

SSt v,v'
T
st
Te
T S , V
T W
U
4
U
Um
U
usJ
UT
V
VTtt
V
* vS
V T
short -range vibration-vibration rate coefficient defined by equation (A21)
species
temperature
critical temperature used in equation (A10)
electron temperature
characteristic temperature defined in equations (A3)
vibrational temperature of species s defined by equation (8)
wall temperature of laser tube
flow velocity
vector flow velocity
mean flow velocity
electron energy in electron volts
electron energy loss or gain in Jth inelastic collision process with species
gas temperature in electron volts defined in equations (B8)
arc voltage
vibration-translation rate coefficient defined by equations (A2) and (A10)
vibration-vibration rate coefficient defined by equation (A19)
vibration quantum number
vibration distribution truncation level of species s
number of lasing transitions
s
7

Wst
W
XS
X
YS
ys , v
Y
st YV
YV,V'
Z s t
st
r
yv, J
AE
%t
8
empirical constant used in equation (A20)
electron drift velocity defined by equation (B15)
mole fraction of species s
quantity defined in equations (C4)
mass fraction of species s, - "S
mass fraction of species s in vibration level v
variable used in equations (A4) and (A5)
quantity defined in equations (A3)
quantity defined in equation (A22)
collision frequency defined by equation (A7)
threshold gain for transition v
mole fraction defined in equations (B8)
gamma function
gain coefficient defined by equation (CP)
energy loss found in equations (Al) and (A18)
Lorentz half -width defined in equations (C4)
Doppler half -width defined in equations (C4)
quantity defined in equations (A3)
potential well depth of Lennard-Jones potential of species s o r t
potential well depth defined in equation (A6)
PNS

. . . . . .. . ._.
variable used in equation (A23)
electric dipole moment of species s
electric quadrupole moment of species s
characteristic temperature defined in equations (A3)
temperature defined in equation (A22)
quantity defined in equations (B8)
mean thermal conductivity of mixture defined by equation (18)
thermal conductivity of species s
electron mobility defined by equation (B16)
reduced mass defined in equations (A3)
frequency defined by equation (C2)
frequency defined by equation (C6)
density
optical cross section
quantity defined in equations (B3)
quantity defined in equations (B5)
quantity defined by equation (A9)
1 vibrational constants in equations (16)
An arrow over a symbol denotes a vector quantity. An asterisk denotes the largest possible value. A prime denotes a variation of any term. The subscript max denotes a maximum value.
9

I I I I I I I I I I I I l11l111111111111ll11l1 I I I I
ANALYTICAL FORMULATION
The laser system modeled in this analysis is based on the experimental work of Sidney e t al. (ref. 9) and is shown schematically in figure 1. The discharge tube is made of pyrex and is 2.54 cm in diameter and 92 cm long. Annular stainless-steel electrodes, 2.54 cm in diameter and 8 cm long, are fitted to the tube ends and calcium fluoride Brewster angle windows a r e placed on the electrode ends. The tube, exclu- sive of the electrodes, is immersed in a liquid nitrogen bath in a bakelite container. Compartments at either end of the container were designed with adjustable liquid nitro- gen leaks to control the temperature of the electrodes. The constituent gases are pre- mixed in an upstream reservoir and a r e introduced at the cathode and exhausted near the anode. The pressure drop in the tube was negligibly small for the operating con- ditions of the experiment.
In analyzing the experiment, molecules in different vibrational quantum states are treated as separate species. tions a r e the electron Boltzmann equation, the conservation of species equations, the overall continuity, momentum, and energy equations, and the equation of state.
For such a multicomponent mixture, the governing equa-
The electron Boltzmann equation is
E2 d U
S
+ 2 S [$ &(U2NsQsm '1 S N~{l J +usJ) f(u +usJ) QsJ(U +usJi
This equation is considered in detail in appendix B. The electron tem.perature and the electron number density a r e determined from the current density and the electron dis- tribution function as
10

00
Te = 3 Jo u3’2 f(u) du
and
where
By use of the steady-state approximation, the conservation of species equation for a given species s reduces to
R s = O , (4)
* The species considered are the vibrational levels of CO f rom v = 0 to v = vco, and the vibrational levels of N2 from v = 0 to v = v where vco and v were chosen to be 50.
* * * N2’ N2
The kinetic processes assumed to be of importance in developing expressions for the production rates Rs are
(1) Electron impact excitation of vibrational levels 1 to 8 of both CO and N2
(2) Single quantum vibration-vibration (V-V) exchange collisions (CO-CO, CO-Nz, N2-N2)
(3) Single quantum vibration-translation (V-T) exchange collisions (CO-CO, CO-He, CO-N2, Na-CO, Na-Nz, N2-He)
(4) Spontaneous emission of CO (Av = 1 and Av = 2)
(5) Stimulated emission and absorption of CO.
11

The cross sections for electron excitation of vibrational levels 9 and 10 for both CO and N2 were measured by Boness and Schulz. (See ref. 10 .) However , because of their small magnitudes, they were not included in this analysis.
For the vth vibrational level of COY
R ~ ~ , v = Ne [ f @COY Jp$) - N C O , ~ J = O
CO-N v+l
J= 0 S
V
N2-CO
S ("2, J+lvVJ+l7v + "2, Jvvv, J
J = O
*
A(2) + yV+i, J$+I, J yv, JIV, J +Nco,v+2 v+2 hvv+l, J hvv,J
12

I
and for the vth vibrational level of N2 *
RN2,V = Ne[ J= f 0 ("2,JP2$ - "2 ,~ J = O f ('?:I + N N 2 , v + 1 r 7 J = O
- * ' N2 -N2
VN2 1 kN2, J+lWJ+l,v J = O
CO-Nz VCO N N +"2,J v,J 2- ') + 2 (NCO,J+l W J+l,v
J = O
vvN2-co) +NCO,J v,J
* 1
These expressions contain t e rms which involve NCO,V* and NN v* If these
te rms are simply set to zero, then false inversions can occur on the upper levels. To eliminate this problem, the number densities for the vzo + 1 and the v* are estimated by assuming that the population distribution in the last few levels can be approximated by a Boltzmann distribution; that is,
co+1 2 7 N2+1'
+ 1 levels N2
Ns,v;+1 s,vs
where
This method was first used by Lordi et al. (See ref. 11.)
13

I1 Il l I I I I I I m11l11 l11111lIII
The various V-T and V-V rate coefficients used in equations (5) and (6) are dis- cussed in appendix A. The electron vibrational excitation ra tes P& a r e defined in appendix B. The only excitation c ross sections which have been measured experimen- tally for CO and N2 are those for excitation.from the ground state (ref. 10). Chen (ref. 12) has calculated theoretical cross sections for vibrational excitation from levels v = 1, 2, 3, and 4 for N2. By using his results, Abraham and Fisher (ref. 13) have dem- onstrated that if electron vibrational excitation processes have the same Av, then they have approximately the same rate as the excitation process from v = 0. Thus, it is assumed that
(v = 1 to 7) (9 1
The spontaneous emission coefficients for CO were generated from the matrix ele- ments of Young and Eachus (ref. 14). However, they calculated the matrix. elements only up to v = 24. The elements for the higher levels were generated by extending the calcu- lations of reference 14 to v = 50. The dipole moment vibrational elements and the spontaneous emission coefficients are given in table I.
The overall continuity equation is written as
pUA = &I
whereas the overall momentum equation reduces to
V P = O
The overall energy equation has the form
For the steady-state approximation employed here, this equation can be integrated to give
m(H - Ho) = IV - QT (13)
The total heat loss QT is expressed as the sum of losses due to conduction to the wall, spontaneous emission, and lasing. Thus, equation (13) becomes
14

TABLE I. - DIPOLE MATRIX ELEMENTS AND SPONTANEOUS
V
1 2 3 4 5 6 7 8 9
10 11 12 13 14 15 16 17 18 19 20 21 22 23 24 25
1.000 1.995 2.985 3.968 4.945 5.913 6.867 7.8 16 8.7 39 9.660
10.560 11.436 12.285 13.104 13.898 14.656 15.368 16.038 16,644 17.220 17.735 X8.227 18.676 19.056 19.375
EMISSION COEFFICIENTS O F CO
33.4 64.2 92.5
118.4 141.9 163.3 182.3 199.4 2 14.2 227.4 238.7 248.0 255.5 26 1.3 265.5 268.2 269.2 268.8 266.8 263.8 259.6 254.8 249.1 242.4 235.0
----- 0.9 2.7 5.3 8.8
13.0 18.0 23.7 30.2 37.2 45.0 53.4 62.3 71.6 81.4 91.6
102.3 113.0 124.1 135.3 146.6 157.8 169.1 180.2 190.8
V
26 27 28 29 30 31 32 33 34 35 36 37 38 39 40 41 42 43 44 45 46 47 48 49 50
19.698 19.987 20.24 1 20.460 20.644 20.79 3 20.908 20.988 21.033 21.044 21.020 20.961 20.867 20.738 20.575 20.377 20.144 19.877 19.575 19.238 18.866 18.459 18.017 17.540 17.028
227.6 220.0 211.9 203.7 195.4 186.9 178.4 169.8 16 1.3 152.9 144.5 136.3 128.2 120.4 112.7 105.2 98.0 91.0 84.2 77.8 71.6 65.6 60.0 54.7 49.6
201.8 212.2 222.2 231.9 241.1 249.9 258.2 265.9 273.0 279.6 285.5 290.7 295.3 299.2 302.4 304.9 306.8 -307.9 308.3 308.0 307.1 305.5 303.2 300.4 296.9
15
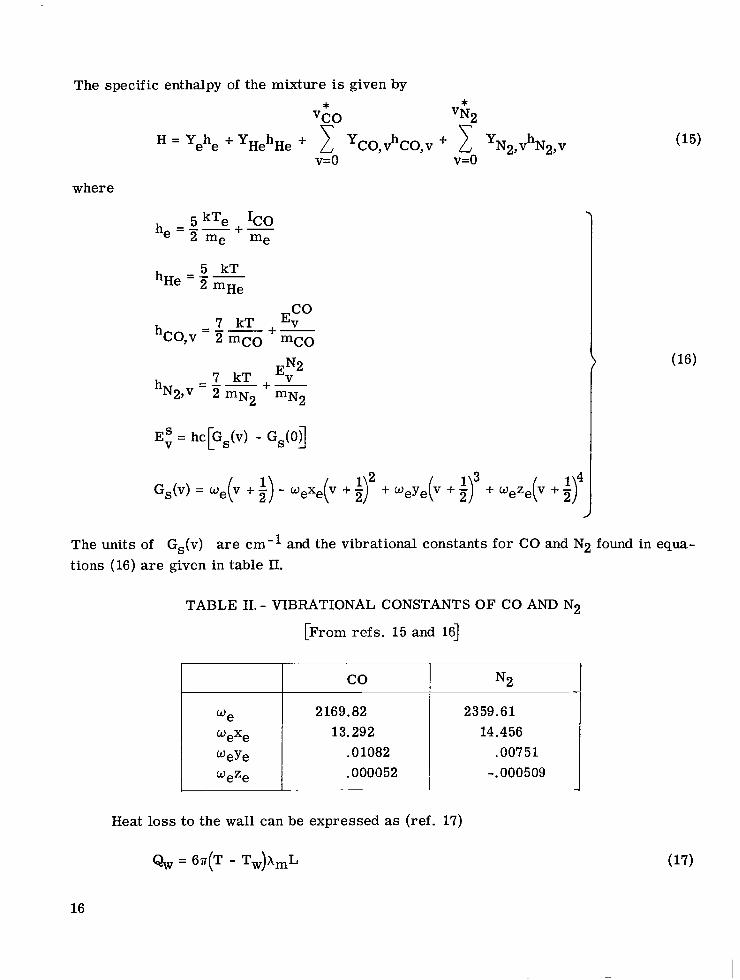
The specific enthalpy of the mixture is given by
WeXe W e Y e *eZe
vco * 4 2
= Yehe + YHehHe 2 yCO,vhCO,v + 1 y N 2 , ~ h N 2 , ~ v=o v=o
13.292 14.456 . 0 1082 .00751 .000052 , -.000509
where
5 kT -- hHe = 2 mHe
co 7 kT
h ~ ~ , v - ~ ~ m c o +- -
E: = hc[Gs(v) - Gs(OI
The units of Gs(v) are cm-' and the vibrational constants for CO and N2 found in equa- tions (16) are given in table 11.
TABLE 11.- VIBRATIONAL CONSTANTS OF CO AND N2
[From refs. 15 and 161
co I *e I 2169.82
I N2
I 2359.61
Heat loss to the wall can be expressed as (ref. 17)
% = 67i(T - Tw)hmL
16

where
Equation (17) is developed in reference 17 on the assumption that the average or bulk temperature of a fully developed flow in a tube of radius a is defined as
T = T(r) d r
But the usual definition of the average gas temperature (ref. 18) is
Thus, the assumption of a constant U(r), which is implied in reference 17, would seem to indicate that this expression for Qw is incorrect. However, for fully developed pipe flow (ref. 18),
Using equation (21) in equation (20) leads to the expression for Qw in equation (17). The thermal conductivities used in equation (17) were obtained from reference 19.
Spontaneous emission losses are given by * 1
and the laser power output is
Finally, the equation of state for the system can be written as
p = kNeTe + kNT
I
(24)
17

I I l l I I I Ill11 Ill 111l11111ll I1
When operating in the lasing mode, the intensities of each transition L, assume ,J values such that the gain coefficient y condition (ref. 20)
for each transition satisfies the threshold v, J
This condition is a statement of the fact that the intensity gain on a line just equals the intensity loss on that line for a round t r ip through the discharge region. If the losses are of a magnitude such that the gain coefficient for a given transition is l e s s than the threshold value, no lasing can occur on that line.
An expression for the gain coefficient including the effects of both Doppler and pressure broadening is given in appendix C. The development of this expression includes the assumption of the equilibrium of the rotational states at the gas temperature. Thus, it is not possible to predict transitions on more than one rotational line in a given vibra- tional band. Therefore, it is assumed that for a given vibrational band, lasing occurs only on the P(J) branch corresponding to the maximum small signal gain coefficient.
Equations (l), (4), (lo), (ll), (14), and (24) together with the expressions for the electron temperature and the electron number density given by equations (2) and (3) form the basic system to be solved. When the system operates in an oscillator mode, this system of equations is supplemented by threshold conditions given by equation (25) equal in number to the lasing transitions.
METHOD OF SOLUTION
The governing system of equations consists of the electron Boltzmann equation, * * which is a difference differential equation, and 3 + vco +*vN2 + vT nonlinear algebraic equations corresponding to the number densities of the vco vibrational levels of CO
plus the ground state, the number densities of the VN vibrational levels of N2 plus 2 the ground state, the gas temperature, and the VT lasing intensities. For small signal gain calculations, the intensities a r e set equal to zero and thus the last VT equations a r e not needed. The electron Boltzmann equation is integrated numerically by using a constant-step-size, fourth-order, Adams-Moulton predictor-corrector method. tem of nonlinear algebraic equations is solved numerically by using a Newton-Raphson technique .
*
The sys-
The procedure used in obtaining a complete solution for a given set of operating conditions is summarized as follows:
(1) For the given composition, the electron Boltzmann equation is solved for a range of E/N values to obtain the electron distribution function. This solution is then
18

used to calculate the electron vibrational excitation rates which are needed in the rate equations. The electron temperature and mobility are also calculated. This information is stored for later use.
(2) Next, a calculation of the small signal gain coefficients i s carried out. With the given operating conditions, that is, composition, pressure, flow rates, a r c voltage and current, and tube dimensions, an initial value for the temperature and an initial vibra- tional distribution for the CO and 1'32 molecules are assumed. The corresponding electron temperature is determined by interpolation from the table generated in step (1). A simi- lar procedure is employed to determine the vibrational excitation ra tes and mobility. The electron number density can then be found from equation (3). The V-V and V-T ra tes for the various collisions a r e computed at the assumed temperature. information, the initial values of the rate equations and the energy equation together with all their partial derivatives which are needed for the Newton-Raphson iteration scheme are calculated. After each iteration, the procedure of determining an electron tempera- ture and all parameters associated with it and a set of V-V and V-T ra tes for the new temperature is repeated. to a relative e r r o r of
By using this
The iteration is continued until convergence on all variables is achieved.
For the small signal gain calculations, all intensities a r e set to zero and thus the equations for the threshold condition a r e omitted. densities and temperature a r e used to calculate small signal gain coefficients for the vibrational-rotational transitions of interest. calculated for a number of P(J) transitions and the value of the maximum gain on each band together with the J number of the rotational transition on which it occurs are retained for use in step (3).
The converged values of number
For each vibrational band, the gains are
(3) Finally, an intensity calculation is carried out. In this case, it is necessary to introduce the threshold condition given by equation (25) for each intensity to be calculated. Thus, vT additional unknowns and vT additional equations are added to the system.
The lines for which small signal gain coefficients a r e maximum for a given band may oscillate if their gain coefficients a r e greater than or equal to the threshold value. Such lines are determined by comparing the maximum gain values for each band calcu- lated in step (2) to the threshold gain value.
The resulting system of equations is solved again by a Newton-Raphson technique. If a negative intensity appears in the converged solution, it is dropped, together with its associated threshold condition, and the solution procedure is repeated. When a con- verged set of all positive intensities is obtained, the power from each line is calculated from the expression
19

1111111111111 Ill1 I Ill
Pv = ALaVIV, J (26)
The power from all lines is summed to obtain the total laser power.
An important point to remember when calculating intensities is that the J num- ber which specifies the P(J) transition with the maximum small signal gain coefficient on a given vibrational band is not necessarily the same as for the case when lasing is not present. the J numbers associated with each lasing transition a r e adjusted accordingly. A typi- cal example of this shift can be seen in table 111 corresponding to the conditions for case 1.
Thus, after each iteration, a small signal gain calculation is performed and
(See table IV in "Results and Discussion.")
TABLE 1II.- COMPARISON OF J VALUES FOR SMALL
SIGNAL GAIN CALCULATIONS AND INTENSITY
CALCULATIONS FOR CASE 1
_- - . - - -
Vibrational band
4 - 3 5 - 4 6 - 5
7 - 6 8 - 7 9 - 8
10 - 9 11 - 10 12 - 11
13 - 12 14 - 13
. _ _
-
As was indicated earlier, 50 vibrational levels were carried for both CO and N2 in all calculations. However, typically, it w a s not necessary to calculate more than 14 corresponding to vibrational transitions from the 3 - 2 up to the 16 - 15.
Provision was made for calculating a maximum of 25 lasing intensities.
RESULTS AND DISCUSSION
The primary processes of pumping energy into the CO vibrational levels are through electron excitation of the lower levels and V-V pumping of the higher levels. Radiative decay and V-T collisions a r e the primary processes for deactivating the vibrational
20
-.~ . . . , .

states, and these processes are dominant for the higher levels. Thus, to promote lower level transitions, one needs to increase the efficiency of the lower level excitations and V-T collisions and reduce the efficiency of V-V pumping. V-V pumping, one needs to reduce the pressure (or flow rate) and partial pressure of CO in the system. The presence of a large fraction of He increases the efficiency of the V-T collisions and helps maintain a low gas temperature. Nitrogen was found to be bene- ficial in promoting low level transitions in the experiments of Djeu (refs. 3 and 4); he attributed its role to the fact that v - v - 1 transitions in CO are in resonance with the v + 6 v + 5 transitions in N2.
To reduce the efficiency of
All calculations performed in this analysis are based on a wall temperature of 77 K and mirror reflectivities of 1.0 and 0.84. The other parameters employed in the calcu- lations, which correspond to the range of operating conditions employed in the experi- ment (ref. 9), a r e listed in table IV.
TABLE IV. - OPERATING CONDITIONS FOR THE CASES CONSIDERED
Case number
1 2 3 4 5 6 7 8 9
10 11
12 13 14 15 16 17 18 19
20 21 22 23 24
m;,,, 10- g/sec
1.96 5.85 9.77 1.92 5.76 9.60 1.68 5.04 8.39 1.68 5.04 8.39 3.32 9.96
16.60 6.54
19.60 32.70 12.60 37.90 63.20 23.80 71.20
119.00
"2, g/sec
0.00 .oo .oo
3.81 11.42 19.04 26.78 80.36
133.90 26.80 80.40
134.00 26.60 79.60
133.00 26.20 78.80
131.00 25.30 75.80
126.00 23.80 71.20
119.00
mHe9 g/sec
3.91 11.73 19.55
3.83 11.50 19.16
3.38 10.15 16.92 3.88
10.20 16.90 3.35
10.00 16.80
3.31 9.93
16.50 3.19 9.57
16.00 3.00 8.98
15.00
Arc current ,
mA
7.3 6.6 6.0 2.0 6.4 5.7 6.3 5.3 4.4 6.6 5.4 4.2 6.5 5.2 3.9 6.4 5.1 3.8 6.4 5.1 3.7 6.1 4.9 3.2
Arc voltage,
kV
3.4 4.8 6.0 4.0 5.2 6.6 5.4 7.4 9.2 4.8 7.2 9.6 5.0 7.6
10.2 5.2 7.8
10.4 5.2 7.8
10.6 5.8 8.2
11.6
Tube pressure,
torr
.3.5 6.3 8.2 3.5 6.3 8.2 3.5 6.3 8.2 3.8 6.8 9.0 3.8 6.8 9.0 3.8 6.8 9.0 3.8 6.8 9.0 3.8 6.8 9.0
21
I
I l.1111l1llllllIIlIl
The effect of N2 fraction on the maximum small signal gain coefficient is seen in figure 2. The numbers associated with the various points indicate the P-branch transi- tion at which the gain coefficient is maximum. As is seen from figure 2, N2 has the over- all effect of increasing the efficiency of all vibrational excitations. The primary reason for this behavior is attributed to the decrease in the electron temperature from 28 000 K in the absence of N2 to 13 600 K in the presence of N2 as is seen in figure 21. This decrease in the electron temperature results in more electrical power being transferred to the lower vibrational levels of both CO and N2. (See ref. 21.) In addition, as the num- ber of N2 molecules is increased, the calculations indicate that the percentage of excited N2 molecules for v > 3 increases; this increase helps pump the lower CO levels because v + 6 - v + 5 transitions in N2 are in resonance with v - v - 1 transitions in CO. This mechanism, however, is secondary to the effect of the electron temperature.
As is seen in figure 2, increasing the N2 fraction favors the appearance of transi- tions at low-lying bands and low rotational numbers. of the relative intensity indicated in figure 3 which shows low-lying transitions are favored with increasing N2 concentration.
This condition explains the behavior
The effect of CO on low-lying transitions is discussed next. Increased CO fraction is accompanied by an increase in the V-V pumping or energy transfer from lower to upper levels. This increase dominates all other mechanisms responsible for pumping the lower levels and is the reason for the decrease in the maximum gain coefficients of the low-lying bands with increase in CO concentration shown in figure 4 and the disap- pearance of the low-lying transitions in figure 5.
Figures 6 and 7 show the effect of pressure (or, equivalently, the flow rate) on the maximum small signal gain coefficients and the relative intensities. An increase in the pressure for a given mixture results in an increase in the number of CO molecules in the system and thus improves the efficiency of the CO V-V pumping mechanism. The calcu- lations also indicate that at higher pressures, more electrical power is being transferred to the lower levels of CO while at the same time the percentage of excited N2 molecules decreases. Thus, N2-CO V-V pumping is reduced. for the decrease in the maximum small signal coefficient and the relative intensities of the low-lying levels as the pressure increases.
These considerations are responsible
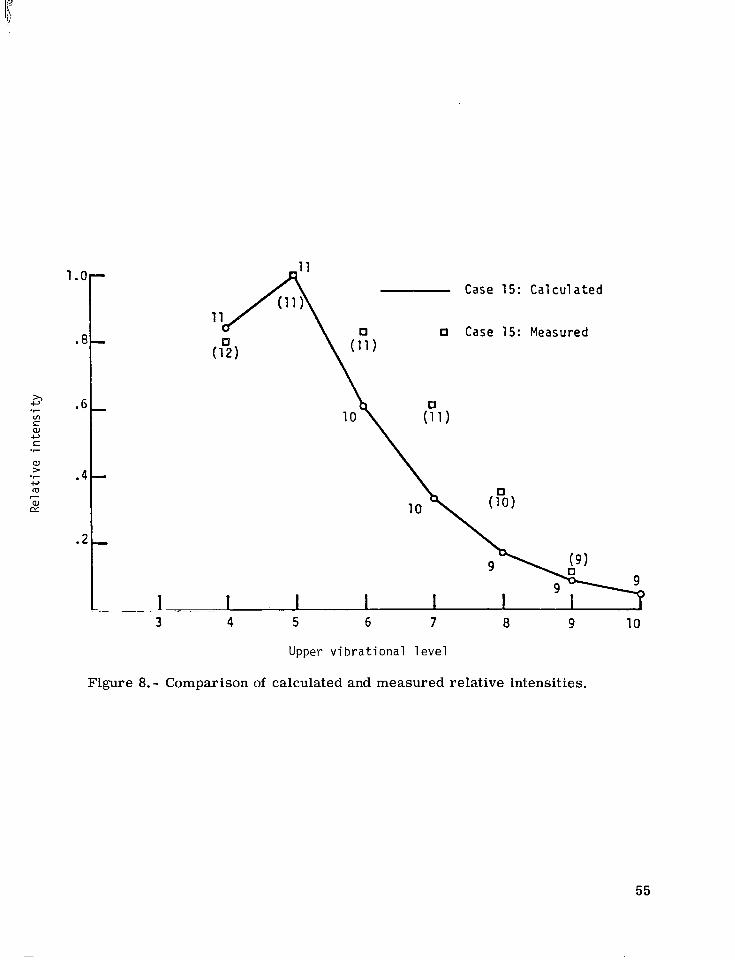
In figures 8 and 9 a comparison of theory with experiment is presented. Figure 8 shows a typical plot of the relative intensity as a function of the upper vibrational levels; the numbers associated with the various points indicate the P-branch at which the inten- sity is maximum. In general, the predictions of the levels at which the peak intensity occurs, the relative magnitudes of the intensities, and the rotational numbers a t which the intensity is maximum in a given band a r e in good agreement with experiment.
22
I

However, comparison of measured and calculated gain coefficients for the low-lying line 5-4(9) indicated in figure 9 shows that the theory overpredicts the measurements by a factor of two. CO lasers was discussed by Greene and Harris. calculations of the small signal gain coefficient for low temperature e-beam sustained continuous wave CO-Ar lasers, using the expression given in reference 7, agree with experiment if they discard hard sphere models for the optical broadening cross sections and employ instead c ross sections which have the dependence on the rotational number J and the gas temperature suggested by Varanasi.
The discrepancy between calculated and measured gain coefficients in (See ref . 22 .) They showed that their
(See ref. 23.)
In this work the cross sections given in reference 24 are employed. These c ross sections allow for the dependence on J but not on temperature. Allowing for the tem- perature dependence suggested in reference 23 reduces the calculated gain coefficient by 25 percent. coefficient or the proper c ross section.
Thus, the discrepancy does not result from failing to use the proper gain
The discrepancy can be attributed to a number of factors, the most important of which is that the theory assumed a rather clean experiment in which impurities such as H20, C02, and the nitrogen oxides were nonexistent. This, of course, is not a realistic assumption. Another reason for the discrepancy is that 0 2 was treated as an inert gas in the theory; 0 2 was added in the experiment to prevent the dissociation of CO and the formation of carbon. electric field and current, the effect of 0 2 on performance cannot be attributed to a change in the electron distribution function resulting from changes in E/” which accompany the addition of 0 2 . (See ref. 25.) It is believed that the presence of 0 2 results in the formation of NO and this can deactivate the excited levels of CO.
Because the calculations employed the experimentally determined
In addition to these effects, recent analysis of gain measurements has indicated that measured values of gain coefficient can be substantially below the t rue value; this condi- tion takes place in the presence of internal gain saturation and during the employment of large collector apertures. fact that for low CO concentrations, the laser operation was not very stable. This insta- bility could be a result of an ionization instability.
(See ref. 26.) The situation was further compounded by the
(See refs. 27 and 28.)
CONCLUDING REMARKS
The theory presented here suggests that low transitions in CO laser systems can be achieved at low flow ra tes (or pressures) for rather low CO partial pressures relative to those of He and N2. The primary role of N2 appears to be the reduction of the electron temperature to a level where the transfer of electric power to the lower vibrational states
23

is optimum. ever, further analysis is needed to assess the role of impurities that inherently exist in any given' experiment.
The trends predicted by the theory are substantiated by experiment. How-
Langley Research Center National Aeronautics and Space Administration Hampton, Va. 23665 March 5, 1976
24
APPENDIX A
VIBRATIONAL RATE COEFFICIENTS
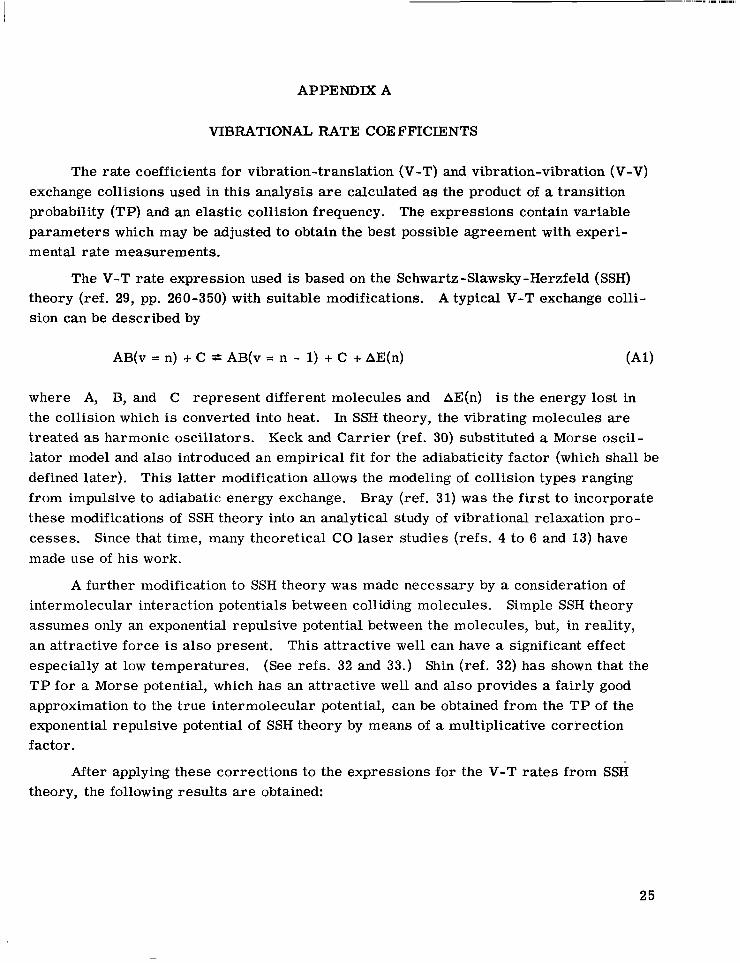
The rate coefficients for vibration-translation (V-T) and. vibration-vibration (V-V) exchange collisions used in this analysis are calculated as the product of a transition probability (TP) and an elastic collision frequency. The expressions contain variable parameters which may be adjusted to obtain the best possible agreement with experi- mental rate measurements.
The V-T rate expression used is based on the Schwartz-Slawsky-Herzfeld (SSH) theory (ref. 29, pp. 260-350) with suitable modifications. A typical V-T exchange colli- sion can be described by
AB(v = n) + C AB(v = n - 1) + C + AE(n) (A1)
where A, B, and C represent different molecules and AE(n) is the energy lost in the collision which is converted into heat. In SSH theory, the vibrating molecules a re treated as harmonic oscillators. lator model and also introduced an empirical f i t for the adiabaticity factor (which shall be defined later). from impulsive to adiabatic energy exchange. Bray (ref. 31) was the first to incorporate these modifications of SSH theory into an analytical study of vibrational relaxation pro- cesses. made use of his work.
Keck and Carr ier (ref. 30) substituted a Morse oscil-
This latter modification allows the modeling of collision types ranging
Since that time, many theoretical CO laser studies (refs. 4 to 6 and 13) have
A further modification to SSH theory w a s made necessary by a consideration of intermolecular interaction potentials between colliding molecules. Simple SSH theory assumes only an exponential repulsive potential between the molecules, but, in reality, an attractive force is also present. especially at low temperatures. T P for a Morse potential, which has an attractive well and also provides a fair ly good approximation to the true intermolecular potential, can be obtained from the TP of the exponential repulsive potential of SSH theory by means of a multiplicative correction factor.
This attractive well can have a significant effect (See refs. 32 and 33.) Shin (ref. 32) has shown that the
After applying these corrections to the expressions for the V-T ra tes from SSH theory, the following results are obtained:
25

APPENDIX A
where
The adiabaticity factor F(y;') can be expressed as
for 0 Z y 521.622 and as
for y > 21.622. tion (A5) comes from original SSH theory. The exponential t e rm involving T:t is Shin's (ref. 32) correction factor. The well depth Est can be expressed as
Equation (A4) is Keck and Carr ie r ' s (ref. 30) empirical f i t and equa-
26

I
APPENDIX A
The collision frequency of the colliding molecules (ref. 34)
Zst is calculated from the Lennard-Jones potential parameters
where
dst = \Idsdc The combining rates found in equation (A6) a r e from Good and Hope (refs. 35 and 36). The te rm d2y2)(T) is given by an empirical curve f i t (ref. 37)
a(2,2)(T) = __I__ 145 + 0.52487 exp( -0.7732T) + 2.16 178 exp( -2.43787T) TO. 14874
- 6.435 X sin (i8*0323 0.7683 - 7.27371)
The parameters appearing in equations (A6) and (A8) a r e given in table V.
TABLE V. - LENNARD-JONES POTENTIAL PARAMETERS
co N2 He
[From refs.
dS, cm
3.590 X
3.617 2.576
34 and 383
K
110.0 97.0 10.22
IS, eV
14.013 15.576 24.586
In SSH theory, the energy-dependent TP's a r e obtained from a quantum mechanical distorted wave approximation (refs. 29 and 33). obtained by averaging the energy-dependent TP 's over a thermal Boltzmann distribution. At the cryogenic'temperatures at which most lasers operate, the energy-dependent TP's are valid. However, the thermal averaging for the temperature-dependent TP 's assumes that the energy lost by the oscillating molecules is much less than the kinetic energy of the colliding molecules. At low temperatures, this assumption is not valid and the ther- mal averaging should be done over the Boltzmann distribution with numerical integration techniques. (See refs. 33 and 39.) However, this procedure is too costly to be used in C O laser studies.
The temperature-dependent TP ' s are
27

APPENDIX A
Experimental measurements of the V-T rate coefficient for CO deactivation by He and H2 indicate that when these coefficients a r e expressed in the proper units
equation (A2) is used to plot theoretical V-T rate coefficients against temperature (after converting to the proper units1), the resulting curve decreases smoothly with decreasing temperature until a certain critical temperature Tcrit st is reached and then begins to increase with decreasing temperature. Therefore, equation (A2) is used to compute the rate coefficients above the critical temperature. Below that temperature, the ra tes a r e calculated from
(sec-’-torr- 1 ), they are constant below a certain temperature (ref. 40). However, if
c r i t
st It has been found that for a given set of constants KVT and P the critical tempera- ture decreases slightly as the vibrational level quantum number increases. In this analysis, only the Tcrit st value for v = 1 is used; this procedure has the effect of slightly overestimating the V-T rates for the higher levels at temperatures below
st
st,
st TCrit.
The constants KVT and -Qst and the TELit values are presented in table VI. They were obtained by fitting equations (A2) and (A10) to the available experimental rate data. (See refs. 40 to 47.)
TABLE VI. - EMPIRICAL CONSTANTS FOR V-T RATE COEFFICIENTS
I_- - co-co CO-He
KVT -
4.4516 X l om5 7.1544 2.8557
15.476 -. -
Qst’ A
0.203341 .29728 .20328 .3165
st
K
135 152 134 14 5
Figures 10 to 13 show the theoretical ra tes for CO deactivated by CO and He and for N2 deactivated by N2 and He together with the data points used in the curve-fitting
.
lEquation (A2) has units of cm3/sec and can be converted to sec- l - tor r - l by
VT:t (cm /se c)
1.0355 X 1O-l ’ T VT:t(sec-l-torr-l) =
28

APPENDIX A
process. The solid circle points in figures 10 to 12 do not represent actual data points but were generated from the following empirical curve fits:
(atm-sec) = 10 (69.3T-ll3-9.64) P T c 0 - c o
fo r 1372 K d T 6 2915 K (ref. 41),
p ~ ~ ~ - ~ ~ ( a t m - s e c ) = e ~ p ( 8 7 T - l / ~ - 19.1)
for 580 K 5 T 5 1500 K (ref. 42), and
PTN 2- 2 (atm-sec) = 10 (1 0 2 T - - 1 1.24)
for tion time pTSt which is the standard form for giving experimentally measured results. This relaxation time can be expressed in t e rms of the deactivation rate of the first level of a diatomic molecule (in cm3/sec) as
1900 K 5 T 5 5600 K (ref. 43). These rate expressions are in the form of a relaxa-
st 1.36236 X T VT1 =
P5t[l - exP(-$]
The curve fits given by equations (All) , (A12), and (A13) are given in references 41 to 43 instead of tabulated experimental results.
No experimental measurements of the ra tes of CO deactivated by N2 and N2 deacti- vated by CO are available. Since CO and N2 have the same molecular weight, SSH theory (ref. 29, pp. 260-350) predicts that the parametric constants appearing in the rate expres- sions for these reactions will be the same as those for CO deactivated by CO and N2 deac- tivated by N2. Thus, it is assumed that
and
All backward V-T rate coefficients were obtained f rom the principle of detailed balancing which gives
29

APPENDIX A
The rate coefficients for vibration-vibration exchange collisions a r e based on the work of Jeffers and Kelley (ref. 48). They proposed that V-V TP's could be expressed as the sum of two contributions, one a long-range multipole interaction and the other a short- range repulsive force.
Single quantum V-V exchange collisions can be described by
AB(v = n) + CD(v = m) = AB(v = n - 1) + CD(v = m + 1) t- AE(n,m) ( A W
Energy from the vibrational mode of one diatomic molecule is transferred to the vibra- tional mode of another diatomic molecule. sitions of the two molecules are equal, the energy transfer process is exactly resonant and AE(n,m) is zero, that is, no energy is lost as heat. The quantity AE(n,m) is known as the resonance defect. It is the energy transferred to the translational mode of the gas when the energy spacings of the transitions in the two molecules a re not equal. The V-V T P for exactly resonant collisions is high but decreases as the resonance defect increases. V-V transitions with small resonance defects are dominated by the long-range multipole interactions of the colliding molecules (dipole -dipole, dipole -quadrupole, etc.). (See refs. 48 and 49.) The short-range repulsive portion of the intermolecular potential dominates transitions far from resonance. Thus, Jeffers and Kelley (ref. 48) suggested that the V-V TP 's could be expressed as the sum of these two contributions, an idea that was independently developed by Caledonia and Center (ref. 50). They utilized the Sharma- Brau theory (ref. 49) to calculate the long-range dipole-dipole contribution to the CO-CO V-V TP 's and determined the short -range repulsive force contribution by numerically averaging the energy-dependent Rapp-Englander-Golden transition probabilities (ref. 51) over a thermal Boltzmann distribution. When this theory w a s applied to CO-CO V-V transitions, good agreement with experimental data (ref. 52) was obtained for tempera- tures around 300 K. (refs. 53 and 54), but a simplified version of it is widely used because it agrees very well with available experimental data.
If the energy spacings of the vibrational t ran-
The validity of the basic premise of this model has been questioned
The V-V rate model used in this analysis is a simplified version of that developed by Jeffers and Kelley. It was first used by Rockwood et al. (ref. 55) who showed that the extremely complicated rate expressions of Sharma and Brau can be approximated very well .by a simple Gaussian function of the resonance defect. ized by two parameters - its magnitude at exact resonance and i ts half-width. et al. (ref. 55) originally assumed constant values for these two parameters, and hence
This function is character- Rockwood
30

APPENDIX A
their expression was valid only at a single temperature. ture dependence (ref. 49) of both the magnitude and half-width of the Gaussian function (ref. 56) is easily introduced. repulsive force contribution using a simple expression from modified SSH theory for V-V transitions (refs. 30 and 31).
However, the proper tempera-
Rockwood et al. (ref. 55) also calculated the short-range
The V-V rate coefficient expressions, as used in this analysis, are
st - st st T , v ' - Lv7v' + sv,v'
where
and
I
may be obtained from equations (A3) to (A5). The vibrational matrix. element of the dominant electric multipole moment of molecule
is ~ R ~ 7 v - l / R ~ 7 0 ~ 2 . The dipole moment is dominant for CO and the appropriate dipole matrix elements may be found in table I. The electric quadrupole moment is dominant for N2 and its appropriate matrix elements can be calculated from
s
31
I .!

APPENDIX A
where 7 = 6-1 lator (ref. 57) and it agrees very well with the resul ts of Truhlar (ref. 58).
This expression is for a linear quadrupole moment with a Morse oscil- N2'
st The variable parameters Ast, Wst, and Kvv were determined by curve-fitting equation (A19) to experimentally measured rate data for CO-CO and CO-N2 V-V transi- tions. (See refs. 46, 52, and 59 to 66.) The values for these constants and for Pst are given in table VII.
TABLE VII. - EMPIRICAL CONSTANTS FOR V-V RATE COEFFICIENTS
t-- co-co
..
Ast
1.16681 1.42188 -------
Wst
64.155 47.6964 -------
3.06156 X
6.954 x 3.06156 X
A 1 I
0.203341 .20331 .20328
No experimental data were available for N2-N2 V-V transitions, but since CO and N2 have the same molecular weight and very nearly equal vibrational energy level spacings, SSH theory (ref. 29) predicts that
However, when this assumption was used, false inversions in the number densities for N2 were obtained on the upper vibrational levels even when relatively large numbers of vibra- tional levels were carried in the calculations.
are taken from the V-T rate expres- factor of 10. The values of Q c ~ - ~ ~ and P sions and
Thus, this constant was decreased by a
N2 -N2
This expression is based on the combining rule for Lennard-Jones potentials given in equation (A8) and simple SSH theory (ref. 29). The long-range quadrupole-quadrupole contribution to the N2-N2 V-V TP's was found to be negligible and was not used.
32

APPENDIX A
The V-V rate coefficients given by equation (A19) automatically satisfy detailed balancing, that is,
and st
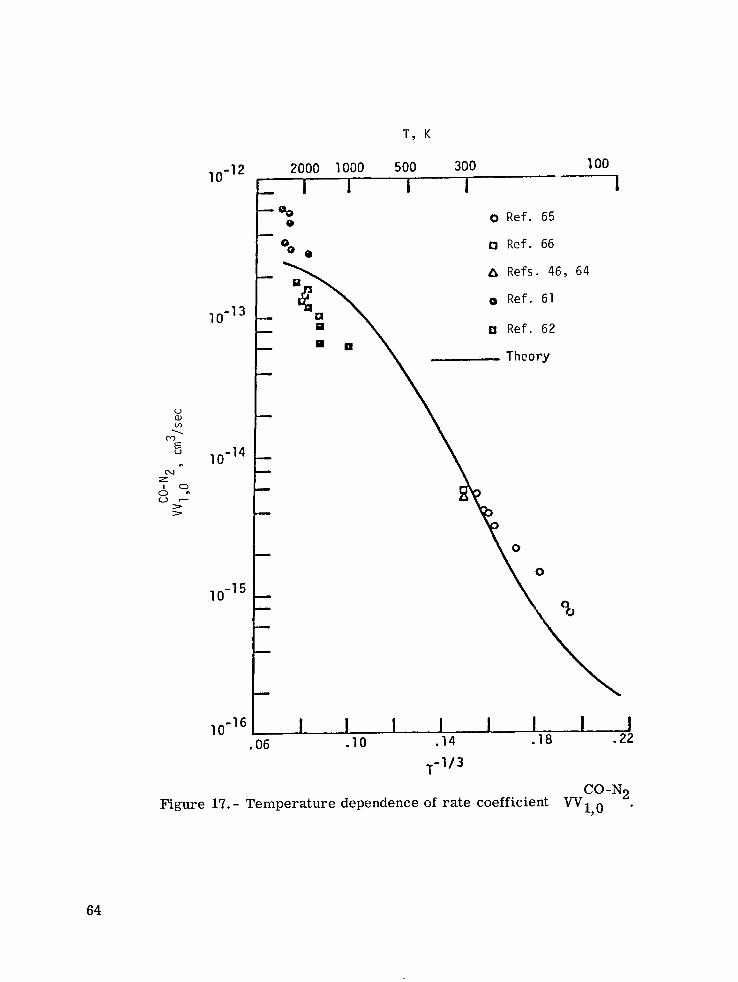
VVV'+l,v-l= st W V , V ' st exp (- *;v') Figures 14 to 18 show the theoretical W rates for CO-CO, CO-N2, and N z - N ~ tran-
sitions together with the experimental data points used in obtaining the curve fits. In figure 14 the data of Wittig and Smith (ref. 59) was not used in the curve fitting because their experimental techniques have been questioned (ref. 60). In figure 17 the data from Sat0 et al. (ref. 61) and von Rosenberg et al. (ref. 62) w e r e not used because of the large scatter in their results.
33
APPENDIX B
ELECTRON DISTRIBUTION FUNCTION AND EXCITATION RATES
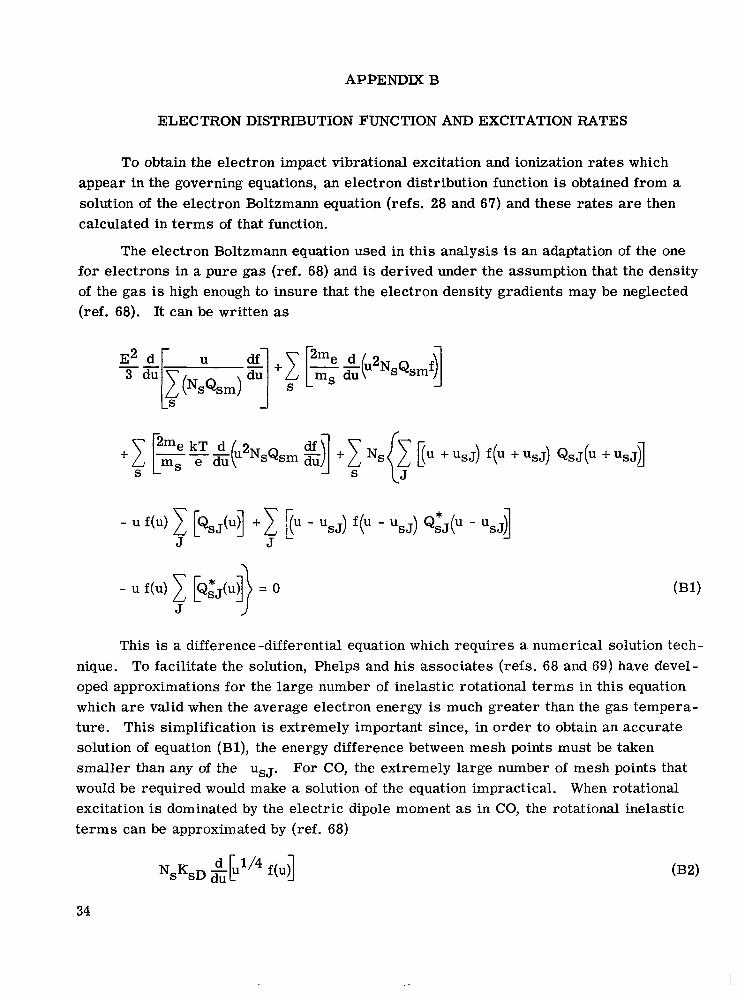
To obtain the electron impact vibrational excitation and ionization rates which appear in the governing equations, an electron distribution function is obtained from a solution of the electron Boltzmann equation (refs. 28 and 67) and these rates are then calculated in t e rms of that function.
The electron Boltzmann equation used in this analysis is an adaptation of the one for electrons in a pure gas (ref. 68) and is derived under the assumption that the density of the gas is high enough to insure that the electron density gradients may be neglected (ref. 68). It can be written as
+,$ [q- 2 m e k T ~ ( u d 2 NsQsm +I %{I [(u +USJ) f(u +USJ) QSJ(U +USJ]
S J
This is a difference -differential equation which requires a numerical solution tech- nique. To facilitate the solution, Phelps and his associates (refs. 68 and 69) have devel- oped approximations for the large number of inelastic rotational te rms in this equation which a r e valid when the average electron energy is much greater than the gas tempera- ture. This simplification is extremely important since, in order to obtain an accurate solution of equation (Bl), the energy difference between mesh points must be taken smaller than any of the U ~ J . For CO, the extremely large number of mesh points that would be required would make a solution of the equation impractical. excitation is dominated by the electric dipole moment as in CO, the rotational inelastic t e rms can be approximated by (ref. 68)
When rotational
34

APPENDIX B
where
1 For N2, where these processes are dominated by the electric quadrupole moment, the rotational inelastic t e rms are approximated by
where
7 KsQ = 4BsO’TsQ
In addition, it is assumed that the populations of excited states are much smaller than that of the ground state. Thus, the last two t e rms of equation (Bl) can be neglected. With all these approximations, equation (Bl) becomes
%F(u)% df + B(u) fl - C(u) f + D(u) = 0 d
where
A(u) = A(E)2 + X U ~ Q ~ U 2 3&1
B(U) = X Q ~ U 2 + K D U ~ ’ ~ + KQu
S J
S J J
35
APPENDIX B
and
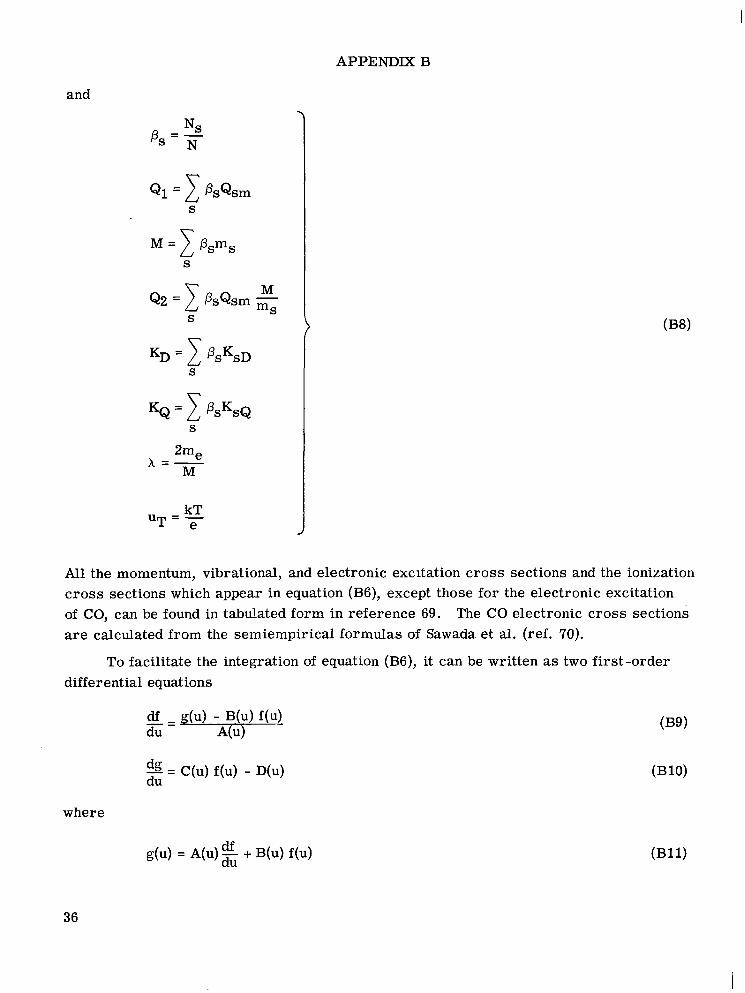
NS Ps = - N
M -
All the momentum, vibrational, and electronic excitation c ross sections and the ionization c ross sections which appear in equation (B6), except those for the electronic excitation of CO, can be found in tabulated form in reference 69. are calculated from the semiempirical formulas of Sawada et al. (ref. 70).
The CO electronic c ross sections
To facilitate the integration of equation (B6), it can be written as two first-order differ entia1 equations
where
(B11) df g(u) = A(u)- + B(u) f(u) du
36

APPENDIX B
The initial conditions on f and g are
I f(umax) = f() > 0
g(umax) = O
where fo is a very small constant The value of umax is chosen large enough to insure that f(u) can be assumed to be essentially equal to zero for u > umax. Equations (B9) and (B10) are integrated backward from u = umax to u = 0 by using a constant -step-size, fourth-order Adams-Moulton predictor -corrector method. The step- size value is dependent on the E/N value. The solution for f(u) is normalized so that
lom u112 f(u) du = 1
As a check on the accuracy of the solution for f(u), the electron energy equation is
calculated as well. This equation is obtained by multiplying equation (B6) by ($-r'2u du
and integrating it over all energies (ref. 68) and it is a statement of the fact that the power input to the electrons from the electric field must be exactly balanced by the power losses of the electrons from elastic and inelastic collisions. It can be written
+ E KD lom u1'4 f(u) du + Q lom u f(u) du
where
E w = (pN)- N
and
37

APPENDIX B
If the left and right sides of equation (B14) differ by more than 1 percent, the integration for f(u) is repeated with a smaller step size. The electron temperature is given by
03
Te = E Jo U3’2 f(u) du
Thus, for a given E/N and a given composition, an electron temperature can be deter- mined from the distribution function solution. values for a given composition, a table of electron temperatures for various E/N values can be constructed. value for the conditions in the laser cavity.
By obtaining solutions for several E /N
Interpolation in this table gives the proper electron temperature
The current density can be related to the electron drift velocity by
or
j = eNepN - E 0319) N
Equation (B19) can be used to calculate the electron number density for the given set of conditions under consideration.
The rate fo r electron impact excitation from the vibrational ground state can be written as
The rate for electron impact deexcitation from vibrational state v to the ground state is
* where the principle of microscopic reversibility is used to obtain Qsv from
, Results of distribution function calculations for two gas mixtures a re presented in figures 19 to 21. Figure 19 shows the variation of P:: (for v = 1, 4, and 8) with E/N for the case
38

APPENDIX B
mco = 1.96 X g/sec
mHe = 3.91 X g/sec
and figure 20 shows the same results for the case
mco = 1.92 X g/sec
m~~ = 3.81 X g/sec
GHe = 3.83 X 10 -4 g/sec
Figure 21 shows the variation of electron temperature with The constants which appear in equations (B2) to (B5) are
E/N for the same two cases.
= 2.4 x eV BCO,O
4.6 X l oq2 eao 'CO,D =
BN 0 = 2.5 X eV 29
a. = 5.29 X lo-' cm
R- = 13.6 eV
0325)

APPENDIX C
GAIN COEFFICIENT
co (1) 2
- 3 A1 'v,J
81rvlkT 170
yv,J -
i : The expression used in this analysis for the gain coefficient for a given P(J) branch transition where the rotational quantum number changes from J - 1 to J as the vibra- tional quantum number changes from v t o v - 1 is due to Lacina (ref. 7). It is given
by 2
B e x p [ - g B ~ J ( J - 13 (NCs. v
-NCO,V-l B v-1 exp 1;; --B v-1 J(J + 14) where
The expression for GCO(v) is given by equations (16) and the values of Ai1) and I co / are given in table I. IRv,v-l R1,O
The derivation of equation (Cl) assumes that the rotational levels a r e in equilibrium at the given gas temperature. The effects of both Doppler and pressure broadening (ref. 7) are included in the expression for the line shape factor
sv = - exp(x2) erfc(x) f i A Q
where
f C AvC = - 21r
and (ref. 68)
S
40

APPENDIX C
The optical c ross sections are taken from Williams et al. (ref. 24)
These c ross sections decrease with increasing rotational quantum number J. tions (C5) give values corresponding to J = 11.
Equa-
The frequency for a given P(J) transition is given by
where
and
B, = 1.93141 - 0.01752 (C8) + 2.96 X (V +f)2 Dv = 6.18 x - 1.76 x lo-' (v + f ) (C9)
The units of Fv7 taken from Patel.
B,, and Dv are cm-l. The constants in equations (C8) and (C9) are (See ref. 15.)
4 1

REFERENCES
1. McClatchey, R. A.: Atmospheric Attenuation of CO Laser Radiation. AFCRL-71-0370 (Available from DDC as (Environ. Res. Paper No. 359), US. Air Force, July 1971.
AD 729 447.)
2. Bhaumik, Mani L.; Lacina, W. B.; and Mann, Michael M.: Characteristics of a CO Laser. IEEE J. Quant. Electr., vol. QE-8, no. 2, Feb. 1972, pp. 150-160.
3. Djeu, N.: Energy Exchange Processes in a Low Temperature N2-CO Transfer Laser. Chem. Phys. Lett., vol. 15, no. 3, Aug. 1972, pp. 392-395.
4. Djeu, N.: CW Single-Line CO Laser on the v = 1 - v = 0 Band. Appl. Phys. Lett., vol. 23, no. 6, Sept. 1973, pp. 309-310.
5. Smith, Neil1 S.; and Hassan, H. A.: Power Calculations for High-Flow CO Electric Discharge Laser Systems. AIAA Paper No. 75-35, Jan. 1975.
6. Rich, Joseph W.: Kinetic Modeling of the High-Power Carbon Monoxide Laser. J. Appl. Phys., vol. 42, no. 7, June 1971, pp. 2719-2730.
7. Lacina, W. B.: Kinetic Model and Theoretical Calculations for Steady State Analysis of Electrically Excited CO Laser Amplifier System Final Report: Part 11. NCL 71-32R (Contract N00014-71-C-0037), U.S. Navy, Aug. 1971. (Available from DDC as AD 729 235.)
8. Center, R. E.; and Caledonia, G. E.: Theoretical Description of the Electrical CO Laser. Appl. Phys. Lett., vol. 19, no. 7, Oct. 1971, pp. 211-213.
9. Sidney, B.; McInville, Roy M.; and Hassan, H. A.: Theory and Experiment of Low Transitions in CO Discharge Lasers. AIAA Paper No. 75-850, June 1975.
10. Boness, M. J. W.; and Schulz, G. J.: Excitation of High Vibrational States of N2 and CO via Shape Resonances. Phys. Rev., vol. 8, no. 6, Dec. 1973, pp. 2883-2886.
11. Lordi, J. A.; Falk, T. J.; and Rich, J. W.: Analytical Studies of the Kinetics of Elec- trically Excited, Continuously Operating CO Flow Lasers. AIAA Paper No. 74-563, June 1974.
12. Chen, Joseph C. Y.: Theory of Subexcitation Electron Scattering by Molecules. 11. Excitation and De -Excitation of Molecular Vibration. vol. 40, no. 12, June 15, 1964, pp. 3513-3520.
J. Chem. Phys.,
13. Abraham, George; and Fisher, Edward R.: Modeling of a Pulsed CO/N2 Molecular Laser System. J. Appl. Phys., vol. 43, no. 11, Nov. 1972, pp. 4621-4631.
14. Young, Lee A.; and Eachus, W. James: Dipole Moment Function and Vibration- Rotation Matrix Elements for CO. Chem. Phys., vol. 44, no. 11, June 1, 1966, pp. 4195-4206.
42

15. Patel, C. K. N.: CW Laser on Vibrational-Rotational Transitions of CO. Appl. Phys. Lett., vol. 7, no. 9, Nov. 1965, pp. 246-247.
16. Herzberg, Gerhard: Molecular Spectra and Molecular Structure. I. Spectra of Diatomic Molecules. Second ed., D. Van Nostrand Co., Inc., c.1950.
17. Vasil'ev, S. S.; and Sergeenkova, E. D.: Energetic Calculation and Spectroscopic Deter- mination of Molecular Temperatures at Moderate Pressures in the Electric Dis- charge Zone. Russian J. Phys. Chem., vol. 40, no. 10, Oct. 1966, pp. 1277-1299.
Second ed., 18. Eckert, E. R. G.; and Drake, Robert M., Jr.: Heat and Mass Transfer. McGraw-Hill Book Co., Inc., 1959.
19. Touloukian, Y. S.; Liley, P. E.; and Saxena, S. C.: Thermal Conductivity - Non- metallic Liquids and Gases. Thermophysical Properties of Matter, Vol. 3, Y. S. Touloukian and C. Y. Ho, eds., IN Plenum, c.1970.
20. Cool, Terr i l l A.: Power and Gain Characteristics of High Speed Flow Lasers. J . Appl. Phys., vol. 40, no. 9, Aug. 1969, pp. 3563-3573.
21. Nighan, William L.: Electron Kinetic Processes in CO Lasers. Appl. Phys. Lett., vol. 20, no. 2 , Jan. 1972, pp. 96-99.
22. Greene, A. E.; and Harr is , R. A.: Temperature Dependence for Carbon Monoxide J. Appl. Phys., vol. 46, no. 11, Nov. 1975, Optical Broadening Cross Sections.
p. 5039.
23. Varanasi, Prasad: Measurement of Line Widths of CO of Planetary Interest at Low Temperatures. J. Quant. Spectrosc. Radiat. Transfer, vol. 15, no. 2 , Feb. 197 5, pp. 191-196.
24. Williams, Dudley; Wenstrand, David C.; Brockman, Robert J.; and Curnutte, Basil: Collisional Broadening of Infra-Red Absorption Lines. no. 5, May 1971, pp. 769-785.
Molecular Phys., vol. 20,
25. Keren, H.; Avivi, P.; and Dothan, F.: The Influence of Oxygen on CO-Laser Perfor- mance. IEEE J. Quant. Electr., vol. QE-11, no. 8, Aug. 1975, pp. 590-594.
26. Cross , Peter S.; and Oldham, William G.: Theory of Optical-Gain Measurements. IEEE J. Quant. Electr., vol. QE-11, no. 5, May 1975, pp. 190-197.
27. Nighan, William L.; and Wiegand, W. J.: Influence of Negative-Ion Processes on Steady-State Properties and Striations in Molecular Gas Discharges. vol. 10, no. 3, Sept. 1974, pp. 922-945.
Phys. Rev.,
28. Nighan, William L.: Stability of High Power Molecular Laser Discharges. UTR75-19, United Technol. Res. Center, May 1975.
43
I

29. Herzfeld, Karl F.; and Litovitz, Theodore A.: Absorption and Dispersion of TJltra- sonic Waves. Academic Press, Inc., 1959.
30. Keck, James; and Carr ie r , George: Diffusion Theory of Nonequilibrium Dissociation andRecombination. J. Chem. Phys., vol. 43, no. 7 , Oct. 1, 1965, pp. 2284-2298,
31. Bray, K. N. C.: Vibrational Relaxation of Anharmonic Oscillator Molecules: Relaxa- tion Under Isothermal Conditions. J. Phys. B (Proc. Phys. SOC.), ser. 2, vol. 1, no. 4 , July 1968, pp. 705-717.
32. Shin, Hyung Kyu: Dependence of the Probabilities of Vibrational De-Excitation on Interaction Potentials. J. Chem. Phys., vol. 42, no. 1, Jan. 1, 1965, pp. 59-62.
33. Thompson, Samuel L.: Vibration-Translational Energy Transfer According to the Morse Potential. J. Chem. Phys., vol. 49, no. 8, Oct. 15, 1968, pp. 3400-3410.
34. Hirschfelder, Joseph 0.; Curtiss, Charles F.; and Bird, R. Byron: Molecular Theory of Gases and Liquids. John Wiley & Sons, Inc., 1964.
35. Good, Robert J.; and Hope, Christopher J.: New Combining Rule for Intermolecular Distances in Intermolecular Potential Function. J. Chem. Phys., vol. 53, no. 2 , July 15, 1970, pp. 540-543.
36. Good, Robert J.; and Hope, Christopher J.: Test of Combining Rules for Intermolec- ular Distances. Potential Function Constants From Second Virial Coefficients. J. Chem. Phys., vol. 55, no. 1, July 1, 1971, pp. 111-116.
37. Neufeld, Philip D.; Janzen, A. R.; and Aziz, R. A.: Empirical Equations To Calculate 16 of the Transport Collision Integrals s2(Z,s)* for the Lennard-Jones (12-6) Poten- tial.
38. Kieffer, L. J.: A Compilation of Electron Collision Cross Section Data for Modeling
J. Chem. Phys., vol. 57, no. 3, Aug. 1, 1972, pp. 1100-1102.
Gas Discharge Lasers. JILA-IC-13, Joint Inst. Lab. Astrophys., Sept. 1973.
39. Shin, Hyung Kyu: Vibrational Relaxation in CO + He at Low Temperatures. J. Chem. Phys., vol. 55, no. 11, Dec. 1, 1971, pp. 5233-5234.
40. Miller, Donald J.; and Millikan, Roger C.: Vibrational Relaxation of Carbon Monoxide by Hydrogen and Helium Down to looo K. J. Chem. Phys., vol. 53, no. 8, Oct. 15, 1970, pp. 3384-3385.
41. Hooker, William J.; and Millikan, Roger C.: Shock-Tube Study of Vibrational Relaxa- tion in Carbon Monoxide for the Fundamental and First Overtone. J. Chem. Phys., vol. 38, no. 1, Jan. 1, 1963, pp. 214-220.
42. Millikan, Roger C.: Carbon Monoxide Vibrational Relaxation in Mixtures With Helium, Neon, andKrypton. J. Chem. Phys., vol. 40, no. 9, May 1, 1964, pp. 2594-2596.
44

43. Millikan, Roger C.; and White, Donald R.: Vibrational Energy Exchange Between N2 and CO. The Vibrational Relaxation of Nitrogen. J. Chem. Phys., vol. 39, no. 1, July 1, 1963, pp. 98-101.
44. Kovacs, M. A.: VT Relaxation in N2 and CO. E E E J. Quant. Electr., vol. QE-9, no. 1, Jan. 1973, p. 189.
45. Millikan, Roger C.: Vibrational Fluorescence of Carbon Monoxide. J. Chem. Phys., vol. 38, no. 12, June 15, 1963, pp. 2855-2860.
46. Green, W. H.; and Hancock, J. K.: Measurement of CO (v = 1) Vibrational Energy Transfer Rates Using a Frequency-Doubled C e Laser. J. Chem. Phys., vol. 59, no. 8, Oct. 15, 1973, pp. 4326-4335.
47. White, Donald R.: Vibrational Relaxation of Shocked Nz-He, Nz-CHq, and N2-CzH2 Mixtures. J. Chem. Phys., vol. 48, no. 1, Jan. 1, 1968, pp. 525-526.
48. Jeffers, W. Q.; and Kelley, J. Daniel: Calculations of V-V Transfer Probabilities in CO-CO Collisions. J. Chem. Phys., vol. 55, no. 9, Nov. 1, 1971, pp. 4433-4437.
49. Sharma, R. D.; and Brau, C. A.: Energy Transfer in Near-Resonant Molecular Colli- sions Due to Long-Range Forces With Application to Transfer of Vibrational Energy From v3 Mode of Co;! to N2. J. Chem. Phys., vol. 50, no. 2 , Jan. 15, 1969, pp. 924-929.
50. Caledonia, G. E.; and Center, R. E.: Vibrational Distribution Functions in Anharmonic Oscillators. J. Chem. Phys., vol. 55, no. 2, July 15, 1971, pp. 552-561.
51. Rapp, Donald; and Englander-Golden, P.: Resonant and Near-Resonant Vibrational- Vibrational Energy Transfer Between Molecules in Collisions. J. Chem. Phys., vol. 40, no. 2, Jan. 15, 1964, pp. 573-575.
52. Hancock, G.; and Smith, I. W. M.: Quenching of Infrared Chemiluminescence. 1: The Rates of De-Excitation of CO (4 5 v 5 13) by He, CO, NO, N2, 02, OCS, N20, and C%. Appl. Optics, vol. 10, no. 8, Aug. 1971, pp. 1827-1842.
53. Dillon, T. A.; and Stephenson, J. C.: Multiquantum Vibrational-Energy Exchange. Phys. Rev., vol. 6, no. 4, Oct. 1972, pp. 1460-1468.
54. Dillon, T. A.; and Stephenson, J. C . : Effect of the Straight Path Approximation and Exchange Forces on Vibrational Energy Transfer. J. Chem. Phys., vol. 58, no. 9, May 1, 1973, pp. 3849-38541
55. Rockwood, Stephen D.; Brau, James E.; Proctor, William A.; and Canavan, Gregory H.: TA9- Time-Dependent Calculations of Carbon Monoxide Laser Kinetics. Quant. Electr., vol. QE-9, no. 1, Jan. 1973, pp. 120-129.
IEEE J.
45

56. Plummer, Michael J.; and Glowacki, Walter J.: Theoretical Investigation of the CO Supersonic Electric Discharge Laser. AIAA Paper No. 73-623, July 1973.
57. Heaps, H. S.; and Herzberg, G.: Intensity Distribution in the Rotation-Vibration Spectrum of the OH Molecule. Zeitschr. Er Phys., Bd. 133, Heft 1, Sept. 1952, pp. 48-64.
58. Truhlar, Donald G.: Vibrational Matrix Elements of the Quadrupole Moment F’unc- tions of H2, N2 and CO. Internat. J. Quant. Chem., vol. VI, no. 5, Sept. 1972, pp. 975-988.
59. Wittig, Curt; and Smith, Ian W. M.: Vibrational Relaxation of Carbon Monoxide (4 5 v 5 10) at T = looo K. Chem. Phys. Lett., vol. 16, no. 2, Oct. 1972, pp. 292-295.
60. Jeffers, William Q.; and Powell, Howard T.: Carbon Monosulfide and CO Probe Laser Research - Final Report. MDC Q0498 (Contract N00014-72-C-0458), U.S. Navy, July 31, 1973. (Available from DDC as AD 777 960.)
61. Sato, Yukinori; Tsuchiya, Soji; and Kuratani, Kenji: Shock-Wave Study of Vibrational Energy Exchange Between Diatomic Molecules. J. Chem. Phys., vol. 50, no. 5, Mar. 1, 1969, pp. 1911-1919.
62. Von Rosenberg, C. W., Jr.; Bray, K. N. C.; and Pratt, N. H.: Shock Tube Vibrational Relaxation Measurements: N2 Relaxation by H20 and the CO-N2 V-V Rate. J. Chem. Phys., vol. 56, no. 7, Apr. 1, 1972, pp. 3230-3237.
63. Powell, H. T.: Vibrational Relaxation of Carbon Monoxide Using a Pulsed Discharge. J. Chem. Phys., vol. 59, no. 9, Nov. 1, 1973, pp. 4937-4941.
64. Stephenson, John C.: Vibrational Excitation and Relaxation of the CO (v = 1) and CO (v = 2) States. Appl. Phys. Lett., vol. 22, no. 11, June 1973, pp. 576-578.
65. Stephenson, John C.; and Mosburg, Ear l R., Jr.: Vibrational Energy Transfer in CO From 100 to 300’ K. J. Chem. Phys., vol. 60, no. 9, May 1, 1974, pp. 3562-3566.
66. Zittel, Paul F.; and Moore, C. Bradley: Vibration-to-Vibration Energy Transfer in N2-CO. Appl. Phys. Lett., vol. 21, no. 3, Aug. 1972, pp. 81-83.
67. Nighan, William L.: Electron Energy Distributions and Collision Rates i n Electri- cally Excited N2, CO, and C02. Phys. Rev., vol. 2 , no. 5, Nov. 1970, pp. 1989-2000.
68. Frost, L. S.; and Phelps, A. V.: Rotational Excitation and Momentum Transfer Cross Sections for Electrons in H2 and N2 From Transport Coefficients. vol. 127, no. 5, Sept. 1962, pp. 1621-1633.
Phys. Rev.,
46

69. Hake, R. D., Jr.; and Phelps, A. V.: Momentum-Transfer and Inelastic-Collision Cross Sections for Electrons in e, CO, C02. June 1967, pp. 70-84.
Phys. Rev., vol. 158, no. 1,
70. Sawada, T.; Sellin, D. L.; and Green, A. E. S . : Electron Impact Excitation Cross Sections and Energy Degradation in CO. J. Geophys. Res., vol. 77, no. 25, Sept. 1972, pp. 4819-4828.
47

Mirror 1
1 Mirror 2
Figure 1. - Schematic of slow-flow electric discharge laser.

lo-*
5 ?, .. > +
1 o - ~
1 o-6
8 8 8 7 , ; u
+---o----o 8 8 7 7
Case 7: mN = 26.78 x 2
Case 4: mN = 3.81 x g l s e c
g l s e c
--- 18 I I 2
I I
d I l6
. I I I I I I I I - - I . I ! - 1 - 1 - I I I 1
1 2 3 4 5 6 7 8 9 1 0 1 1
Upper vi b r a t i onal 1 eve1
Figure 2.- Influence of N2 fraction on maximum small signal gain coefficient.
49

1 .o
0.8
0.6
0.4
0.2
3 4 5 6 7 8 9 10 Upper v ibra t iona l 1 eve1
Figure 3. - Influence of N2 fraction on relative lasing intensities.
50

lo-*
1 o - ~
7
I
5 5 > >
I I I I I 1
7’ I
Case 10: mCo = 1.68 x
--- Case 22: fico = 23.8 x
g/sec
g/sec
I I I I I I I I
I ~ ~~ I I I I I I I 3 4 5 6 7 8 9 1 0 1 1 ,
Upper v ibra t iona l level
Figure 4.- Influence of CO fraction on maximum small signal gain coefficient.
51


lo-'
1 0 - ~
1 o - ~
1 f6
Case 10: p = 3 . 8 t o r r
--- Case 12: p = 9.0 t o r r
l 7 I - I
I I 4 19
- I I
' I I I !A- I . . - I . - 1 . . I I I I I I
1 2 3 4 5 6 7 8 9 10 11
Upper v i b r a t i o n a l l e v e l
Figure 6.- Effect of pressure on maximum small signal gain coefficient.
I
53

Case 10: p = 3.8 t o r r --- Case 12: p = 9.0 t o r r
3 4 5 6 7 8 9 10
Upper v ibra t iona l 1 eve1
Figure 7.- Effect of pressure on relative lasing intensities.
54
1 .o
.- 3 .6
al - >
o r . 4
. 2
- I- 3
Case 15: Calcu la ted
E] Case 15: Measured
4 5 6 7 a 9 10
Upper v i b r a t i o n a l l e v e l
Figure 8. - Comparison of calculated and measured relative intensities.
55

C ..
.( -
I E V
N I 0 r
. C
3
z -
r
.2
.1
. r - Cal cul a t e d , N2 : CO
P Measured, N2:C0 - --- Calculated, N2:C0
= 2:l
2: 1 = 16:l 16: 1
i i I I I 3 I
Volume flow rate , 140 cm3/min
Figure 9. - Comparison of calculated and measured gain coefficients for 5-4(9) line.
56

2 l o
10
10
7
I L L 0 c,
I
V
- I
: 10-1 n
0 V I 0 V ? k >
1 o-2
1 o - ~ .06 .10 - 1 4 . i a . 2 2
+ / 3
Figure 10.- V-T rate coefficient for deactivation of CO (v = 1) by CO.
100 . -
2000 1000 500 300 1 1 1 -- %’ I
57

1 o2
7 10' I L L 0 c,
I
V a, v)
7
I
n n a, 10" 5 0 V-
I- >
1 0-1
1 o-2
T, K
2000 1000 500 300 100
1 1 1 1 I 0 Ref. 40
0 Ref. 42
n Ref. 45
0 Ref. 46
Theory
I I 1 I I I I 16 .10 .14
+ I 3
Figure 11.- V-T rate coefficient for deactivation of CO (v = 1) by He.
58

7
I L L 0 c,
I 7
I u a, VI
N z cu
z 7 F >
1 o3
1 o2
1 O1
1 O0
lo-’
1 o - ~
1 o - ~
1 o - ~
2000 1000 500 300 200 150
I i I 1 1 i 0
0 Ref. 44
Ref. 43
0 Ref. 44
Ref. 43
I I I . 1 7 .21
I ~~ I I 1 I .13 > .09
Figure 12.- V-T rate coefficient for deactivation of N2 (v = 1) by N2.
59

T, K
2000 1000 500 300 1 o4 100
10'
10'
- I L L 0 w I
a, I I N z +- 5
1 oc
10-1
1 0-2
o Ref. 47
Theory
I I I I I I I
+ / 3
Figure 13.- V-T rate coefficient for deactivation of N2 (v = 1) by He.
60

10-1
1 0-1
V
% 10-1 \
E V
m
n
0 V
v > > >
A?
1 0-1
10-1
300 K 6 Ref. 63
0 Ref. 52
100 K 0 Ref. 60
A Ref. 59
Theory
\- O\
A
\. I I I I I\
1 3 5 7 9 11 13 15
v
Figure 14. - CO-CO V-V ra te coefficients.
61

10-l'
u (II m \ M E u e
0 W
UN > >
lo-l;
0 Ref. 60
Ref. 63
0 Ref. 64
0 Ref. 65
Theory
100 200 300 4 00 500 0 T, K
co-co Figure 15.- Temperature dependence of ra te coefficient W2,0 .
62

lo-’ 96 Y, o Ref. 65
100 K A Ref. 65
295 K o Ref. 66
298 K A Refs. 46, 64
o Ref. 52
A 0 -
0
0
0 2 4 6 8 10 1 2 V
Figure 16. - CO-N2 V-V rate coefficients.
63
V a, ul \
m 5
-% o Ref. 65
o Ref. 66
0 4
OO 0
.. N
1 0 - l ~
1 0 - l ~ z
u - > >
IO-I
1 0-1
T - 1 ~ 3
CO-NZ Figure 17.- Temperature dependence of rate coefficient W1,o .
64

10-l2
lo-l:
u aJ v) \
m lo-ll
n cu z
z > 'cu 0, > >
lo-l!
1 3 5 7 9 11 13 15
V
Figure 18. - N2-N2 V-V rate coefficients.
65
I

10-8
1 o-! V W vr \
E u m
n >
0 ” 0 0 n
10’” I I I J 5 10 15 20 25
2 E/N, 1 0 - l ~ volt-cm
Figure 19. - CO electron vibrational excitation rate coefficients as function of E/N for CO-He mixture of case 1.
66
I

1 O-E
V aJ v) \
V E lo-lc m
> 0 " U O n
1 0-1
o-l i
0 I I I I I 5 10 15 20 25
E/N, 1 0 - l ~ volt-cm 2
Figure 20. - C O electron vibrational excitation rate coefficients as function of E/N for CO-NZ-H~ mixture of case 4.
67

68
5.0
4.0
3.0
2.0
1 .o
0 I L. 1 1
E / N , 1 0 - l ~ vol t -cm 2
5 10 15 20 25 30
Figure 21. - Electron temperature as function of E/N for CO-He mixture of case 1 and CO-N2-He mixture of case 4.
L - 10589 NASA- Langley, 1976
I

I ‘
WASHINGTON, ~ D.C. 20546 POSTAGE A N D FEES P A I D [S) N A T I O N A L AERONAUTICS A N D SPACE ADMINISTRATION
N A T I O N A L AERONAUTICS A N D SPACE A D M I N I S T R A T I O N
451 O F F I C I A L BUSINESS i
PENALTY FOR PRIVATE USE $300 S P E C I A L FOURTH-CLASS R A T E U S M A I L
I BOOK
470 001 C l U D 760416 S00903DS DEPT OF THE A I R FORCE AF WEAPONS L A B O R A T O R Y A T T N : T E C H N I C A L L I B R A R Y (SUL) K I R T L A N D A F B NM 8 7 1 1 7
NASA
POSTMAST~R : If Undeliverable (Section 158 Postal Mnniinl) Do Not Return
“The aeronautical and space activities of the United States shall be conducted so as t o contribute . . . t o the expansion of human knowl- edge of phenomena in the atmosphere and space. T h e Administration shall provide for the widest. practkcable and appropriate dissemiwtioqz of information conce%ilzg its activi$es. and the results thereof.”
-NATIONAL AEkQ,NA,UTICS i&D .SPACE ACT OF 1958 .A .
. . . -. . ,:._.
SCIENTIFIC AND TECHNICAL PUBLICATIONS TECHNICAL REPORTS: Scientific and technical information considered important, complete, and a lasting contribution to existing knowledge.
TECHNICAL TRANSLATIONS: Iiiformation published in a foreign language considered to merit NASA distribution in English.
- SPECIAL PUBLICATIONS: Information derived from or of value to NASA activities. Publications include final reports of major projects, monographs, data compilations, handbooks, sourcebooks, and special bibliographies.
TECHNICAL NOTES: Information less broad in scope but nevertheless of importance as a contribution to existing knowledge.
TECHNICAL MEMORANDUMS : Information receiving limited distribution because of preliminary data, security classifica-
TECHNOLOGY UTILIZATION PUBLICATIONS: Information an technology used by NASA that may be of particular interest in commercial and other- non-aerospace applications. Publications include Tech Briefs, Technology Utilization Reports and Technology Surveys.
tion, or other reasons. Also includes conference proceedings with either limited or unlimited distribution.
CONTRACTOR REPORTS: Scientific and technical information generated under a NASA contract or grant and considered an important contribution to existing knowledge.
Defails on the availability of these publications may be obtained from:
SCIENTIFIC AND TECHNICAL INFORMATION OFFICE
N A T I O N A L A E R O N A U T I C S A N D SPACE A D M I N I S T R A T I O N Washington, D.C. 20546