thermoregulatory responses of runners following a warm
TRANSCRIPT
University of ConnecticutOpenCommons@UConn
University Scholar Projects University Scholar Program
Spring 5-2-2014
Thermoregulatory Responses of Runners followinga Warm-Weather Road RaceLuke N. BelvalUniversity of Connecticut - Storrs, [email protected]
Follow this and additional works at: https://opencommons.uconn.edu/usp_projects
Part of the Sports Sciences Commons
Recommended CitationBelval, Luke N., "Thermoregulatory Responses of Runners following a Warm-Weather Road Race" (2014). University Scholar Projects.7.https://opencommons.uconn.edu/usp_projects/7
Thermoregulatory Responses of Runners following a Warm-Weather Road Race
Thesis by
Luke Norman Belval
In partial fulfillment of the requirements for the University Scholars Program and the Degree of
Bachelor’s of Science with Honors in Athletic Training
Department of Kinesiology
University of Connecticut
Storrs, CT
2014
Belval 2
TABLE OF CONTENTS
Review of the Literature…………………………………………………………………………3
Exertional Heat Illness Detection 4
The Falmouth Road Race 5
Thermoregulation during uncompensable heat stress 6
Intrinsic Factors 7
Extrinsic Factors 8
Skin Temperature Responses 9
Thermal Imaging 12
Introduction……………………………………………………………………………………..15
Methods………………………………………………………………………………………….17
Study Overview 17
Participants 17
Preliminary Testing 18
Race Day Testing 19
Thermal Imaging Analysis 20
Data Analysis 21
Results…………………………………………………………………………………………...22
Discussion……………………………………………………………………………………….28
Limitations 30
Future Research 30
Conclusions 31
References………………………………………………………………………………………33
Belval 3
REVIEW OF THE LITERATURE
Exercise in the heat presents a significant challenge to the body’s systems, especially
when that exercise is in a competitive context. When environmental stress and exercise intensity
overcome the body’s dissipation methods, an unsafe increase in body temperature can lead to
exertional heat illnesses (EHI). This broad category of outcomes can range from the mild, heat
syncope, to the potentially fatal, exertional heat stroke (EHS). 1 The manifestation and severity
of EHI is affected by both intrinsic and extrinsic factors within and beyond the athlete’s control.2
Survival from EHS is dependent on accurate detection and rapid treatment. The diagnosis
of EHS is based on two criteria 1) a body temperature greater than 40° C (40.5°C is alternatively
used in some recent publications) and 2) central nervous system dysfunction.1 Therefore, a
clinician’s decision to use a proven method of body temperature assessment is the first step in
ensuring a patient’s survival. Subsequently rapidly cooling the EHS patient, through a proven
modality such as cold-water immersion, is the primary deciding factor of the event’s outcome.
Together these two steps have ensured a 100% survival rate in documented cases. 3
However, myriad misconceptions currently confound a clinician’s treatment decisions that
otherwise would lead to survival without sequelae. Many clinicians choose inappropriate
methods of temperature evaluation when assessing potential EHS, either due to an anxiety of
rectal temperature measurement or misunderstanding of the validity of other devices.4 Ensuring
that clinicians have knowledge of and access to appropriate methods of body temperature
assessment can help ensure suitable treatment decisions, and ultimately protect individuals
exercising in the heat.
Belval 4
Detection
When detected early and treated properly, survival from EHS is highly likely.2,3
Currently, rectal, oesophageal or gastrointestinal thermometry are the only valid measures of
body temperature during exercise in the heat.2 However, the invasive nature of these methods,
and a misunderstanding of how exercise affects the validity of other thermometers, deters some
clinicians from correctly assessing body temperature of a potential EHS patient.5,6
The
development of non-invasive technologies and techniques for the detection of EHI, such as
thermal imaging, could help alleviate some of these clinicians’ inhibitions and allow for proper
diagnosis and treatment.
In a series of two experiments, one indoor and one outdoor, researchers at the University
of Connecticut showed that oral, temporal, axillary, aural and forehead temperature devices do
not accurately reflect body temperature, when compared to rectal measurements. These
commonly used methods of temperature assessment in resting individuals are misconceived to be
valid during exercise. Not only did these methods not fall with in a limit of agreement of 0.5°F,
the responses of these locations did not reflect concurrent changes in body temperature, therefore
eliminating the ability for a correction to be applied.7,8
Meta-analyses by Huggins et al. and
Mazerolle et al. have corroborated the findings that aural and oral temperatures do not reflect
body temperature during exercise in hyperthermic individuals.5,9
This leads to the conclusion that
use of one of these aforementioned locations for body temperature assessment may lead to
inaccurate diagnostic criteria that can ultimately lead to incorrect treatment.
The only measurement from the University of Connecticut studies that demonstrated
agreement with rectal thermometry during exercise in the heat was that of an ingestible
thermistor. 7,8
Byrne and Lim reported similar findings in a review and found that ingestible
Belval 5
telemetry fell within Bland and Altman’s limits of agreement with oesophageal and rectal
temperatures during exercise.10
While this is an acceptable measurement for experimental
studies, the need to ingest the pill 6-8 hours before exercise limits it applicability in acute care of
EHS.
The Falmouth Road Race
Since its inception in 1973, the Falmouth Road Race has represented a race where heat
stress is a particular challenge to participants. In an eighteen-year study, the race has averaged
2.13 cases of EHS per 1000 runners.11
This high incidence is likely due to combined metabolic
and environmental heat stresses. A 7-mile road race is an ideal duration for the occurrence of
EHI. First, the race is short enough to allow athletes to run at a high intensity, but it is also long
enough to allow this high intensity exercise to create endogenous heat production that can
overwhelm the body’s methods of heat dissipation. In addition, due to the high ambient
temperatures and relative humidity during the August race, the body’s principal method of
dissipation, evaporative cooling through sweating, is likely less efficient.12
A percentage of the cases requiring medical attention each year at Falmouth are
exertional heat stroke. In addition the majority of athletes requiring care finish over a relatively
short period of time, approximately an hour. These two factors have created a need for a
streamlined triage system that allows for rapid diagnosis and treatment.13
The current National
Athletic Trainer’s Association’s guidelines for EHS treatment are reflective of this model
developed and employed by the Falmouth Road Race.14
While the appropriate medical coverage
of the Falmouth Road Race has led to a 100% survival rate for EHS, 15
many sporting situations
exist where appropriate knowledge and staffing are not available to prevent fatalities. The high
Belval 6
incidence and appropriate medical management of the Falmouth Road Race allow for the safe
study of EHI in a competitive context.
Thermoregulation during uncompensable heat stress
The fundamentals of thermoregulation during uncompensable heat stress can be
expressed through the heat balance equation, which describes the determinants of heat
production and dissipation.
S = (M –W) ± C ± K ± R – E
S = body heat storage, M = metabolic heat production, W = external work, C = convection, K =
conduction, R = radiation and E = evaporation12,16
Body heat storage can be either a positive or negative value, which in turn represents heat
gain, in the case of uncompensable heat stress, or heat loss respectively. The determinants of
whether S is positive or negative can be divided into two groups: heat storage and heat
dissipation. During rest in a thermoneutral environment, metabolic heat production represents the
sole source of heat acquisition while convection (12-15%), conduction (minimal in all
conditions), radiation (60%) and evaporation (25%) are all methods of dissipation.16
This results
in a situation wherein the body can easily dissipate any metabolic heat production.
The circumstances of thermoregulation change significantly with exercise in the heat.
When ambient temperature increases beyond that of the body’s surface the ability to dissipate
through radiation and convection decreases and dependence on evaporation of sweat
predominates.12
Radiation is controlled by a thermal gradient between the skin and the
electromagnetic environment. In fact, exposure to direct sunlight can lead to a significant heat
gain through radiation.16
This explains the need to monitor globe temperature when evaluating
risk of exertional heat stress. Convection is largely dependent upon wind speed around the
Belval 7
individual; for example, convective cooling plays a larger role in cycling versus running.
However, when a positive thermal gradient between the skin surface and the external
environment does not exist, as in the case of hot environments with limited wind, convection can
contribute to heat acquisition.16
Finally, while evaporation is capable of dissipation at all ambient
temperatures, high humidity limits its efficacy due to a diminished water vapor pressure gradient.
This causes sweating to only contribute to dehydration, which can further increase exercise heat
stress due to increased cardiovascular demands.17
As all of these methods rely on the thermal
interface of the skin with the environment, highlighting the potential importance of skin
temperature in understanding thermoregulation.
The factors described in the heat balance equation represent fluctuating values that differ
between individuals and conditions. What determines an individual’s response to exertional heat
stress and risk for EHI can be further grouped into intrinsic and extrinsic factors. Intrinsic factors
represent the internal physiological, psychological and physical contributors that influence
responses. Meanwhile, extrinsic factors describe the external effects of the environment and
exercise structure.
Intrinsic Factors
Intensity is the largest determinant of endogenous heat production and risk for EHI. With
muscular metabolism being only approximately 20% efficient, the remaining amount of energy
is released as heat during exercise, which can create unsafe rises in core temperature.1 Even
moderate sustained exercise in the heat can lead to unsafe endogenous heat production. Cases of
EHS have reported in as low as 14°C following sustained military marching with equipment.18
The rate of rise in body temperature is related to the relative workload of an individual
(percentage of VO2max).19
This means that regardless of absolute workload (e.g. pace), an
Belval 8
individual’s responses to exercise in the heat are personalized based on their abilities. A fitter
individual (higher VO2max) is hypothesized to tolerate heat stress more effectively due to
decreased metabolic heat production at a given intensity and training adaptations that promote
more efficient thermoregulation in the heat.
The endogenous heat produced during exercise relies on internal mechanisms in order to
be transferred to the skin surface for dissipation, principally the circulatory system. During
exercise in the heat three entities rely on a large amount of blood flow 1) exercising muscle for
the delivery of oxygen and nutrients, 2) skin surface to allow for the evaporation of sweat and 3)
circulatory system to maintain central blood pressure and venous return.12,20
However, when
plasma volume decreases wherein adequate blood flow for all three systems cannot be
maintained, blood flow is preferentially shunted away from the skin of the extremities in order to
preserve the demands of the exercising muscle and maintain blood pressure.20
This in turn,
compromises thermoregulatory ability and can lead to unsafe rises in core body temperature due
to an ability to dissipate heat.
For this reason, hydration status has been proposed to affect exertional heat stress. Failure
to replace fluid lost through sweat and respiratory losses decreases plasma volume and
compromises the blood’s ability to carry heat to the skin surface.17
Numerous studies have
demonstrated that dehydration gradually impairs aerobic performance and affects core body
temperature.17,21,22
This drop in plasma volume also leads to increased heart rate to maintain
cardiovascular output, termed cardiovascular drift.12
Extrinsic Factors
Environmental conditions affect an individual’s responses to exercise in the heat
primarily by decreasing the efficacy of the body’s methods of dissipation as described
Belval 9
previously. High ambient temperatures diminish the ability of radiation and convection to
dissipate heat, while high humidity decreases the efficiency of evaporation. Data from the
Falmouth Road Race and Twin City Marathon have shown a correlation between ambient
conditions and incidence of EHI. 11,23
Skin Temperature Responses
With its predominant role in the dissipation of endogenous heat, the skin surface plays a
key role in the understanding of how the body reacts to exertional heat stress. Skin temperature
may decrease during compensable heat stress, allowing for exercising muscle to receive
sufficient blood flow.24,25
However, during uncompensable heat stress, skin temperature
gradually increases as cutaneous blood flow increases to allow for heat dissipation.20
Through
the action of cutaneous thermal afferents, vasodilators are activated which effectively increases
the thermal conductance of the skin.20
When endogenous heat is brought to the skin surface these
thermal afferents continue to activate vasodilation until the heat can either be dissipated or the
heat stress is removed. This process of heat dissipation is limited by sufficient plasma volume to
allow for the skin circulation to be perfused for dissipation of heat. However as shown
previously, during prolonged exercise or cases of hypohydration blood can be shunted away
from the skin surface to maintain blood flow to the heart and exercising muscles. Therefore, skin
temperature has been suggested to affect both performance and safety during exercise in the heat.
It has also been shown that skin temperature might be modulated differently in fit and unfit
individuals, wherein less fit individuals have higher skin temperatures during exercise due to less
optimized thermoregulatory abilities.26,27
The temperature of the skin can be concluded to
represent both the afferent thermoregulatory input for the CNS and to a lesser degree the thermal
load of the body’s principal dissipation vehicle.
Belval 10
Skin temperature responses do not directly reflect body temperature, however, they may
play a role in an individual’s thermal sensation and auto-regulation of exercise intensity.28
Sawka
et al. have proposed that high skin temperatures lead to aerobic performance decrements rather
than a high core temperature.22
This is likely due to input from cutaneous thermal sensors that
participate in regulatory feedback via the hypothalamus.28
The input from these cutaneous
temperature sensors could be affected by aerobic training and heat acclimatization, thereby
allowing individuals to tolerate higher levels of heat stress. In other words, individuals who are
more aerobically fit and heat acclimatized may be able to tolerate higher skin temperatures
without performance decrements due to regulatory and physiological adaptations.
While skin temperature has been shown to not correlate with core temperature, thereby
limiting its ability as a diagnostic tool for EHI, analysis of skin temperature can provide insight
on the physiological responses to exercise in the heat. Pandolf et al. first suggested that
convergence of skin temperature and core temperature predicts the limits of heat tolerance.29
As
the thermal gradient between the core and skin diminishes, the amount of heat that can be
dissipated decreases proportionally. The point at which core temperature is equivalent to skin
temperature would represent the point where endogenous heat can no longer be dissipated
effectively and thermoregulatory failure is eminent. This limit has been suggested to exist in
uncompensable heat stress conditions, particularly high ambient temperatures with subjects
wearing clothing or equipment that would limit heat dissipation.29
Cheuvront et al. resurfaced
this idea in 2010 adding that skin temperature can be affected by environmental conditions,
helping explain the mechanisms for increased risk of EHI in hot environments.17
Skin temperature plays a key role in thermoregulatory responses during exercise in the
heat. In order to apply this concept into clinical and experimental practice researchers have taken
Belval 11
several different approaches to quantify skin temperatures. The calculation of mean skin
temperature, based on several measurement points across the body surface, has been the most
commonly used method since it was described by Ramanathan in 1964.30
While improvements in the formula have been made since this method’s introduction,
fundamental problems still exist. Even with calculations that account for 7 or 14 sites, the
assumption that each of these points is representative of the temperature an entire area is over
simplified. Temperature over an area of skin surface is not uniformly controlled, nor does
dissipation of the heat in the area occur uniformly. For example only one measurement in the
method described by Ramanathan accounts for the arm.30
However, skin temperature is very
likely to be different between the surface of the upper arm and the axilla. Livingstone et al. has
demonstrated these differences in regional skin temperature through point measurements and
thermographic mapping of the chest. Their finding that point measurement of chest skin
temperature can differ from mean chest skin temperature by as much as 3°C calls for a closer
examination of the accuracy of this method.31
Skin temperature, like all physiological measurements, represents a fluctuating
expression that is controlled by several different inputs and feedback mechanisms.20
For this
reason the use of a uniform formula despite changes in external environments and internal
physiological events likely diminishes its validity. In addition to the previous issues noted with
mean skin temperature calculations, Livingstone et al. found that body fat percentage and
environmental conditions have effects on the measurements obtained from mean skin
temperature calculations.31
Belval 12
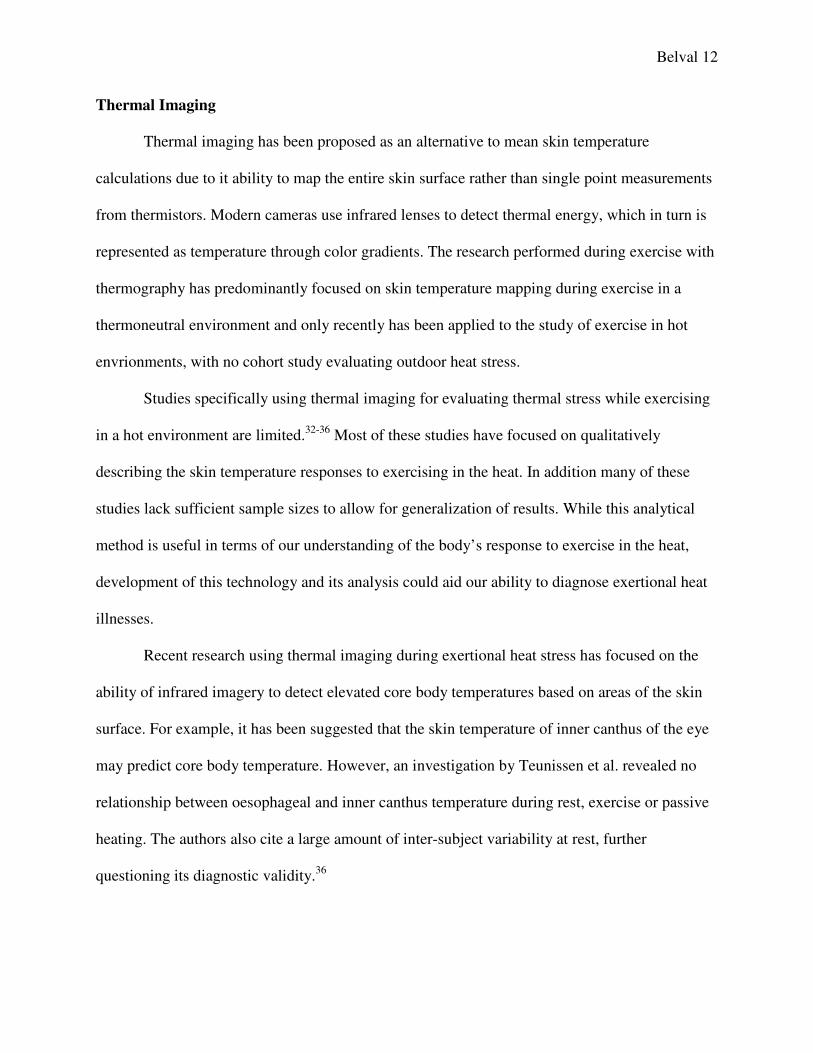
Thermal Imaging
Thermal imaging has been proposed as an alternative to mean skin temperature
calculations due to it ability to map the entire skin surface rather than single point measurements
from thermistors. Modern cameras use infrared lenses to detect thermal energy, which in turn is
represented as temperature through color gradients. The research performed during exercise with
thermography has predominantly focused on skin temperature mapping during exercise in a
thermoneutral environment and only recently has been applied to the study of exercise in hot
envrionments, with no cohort study evaluating outdoor heat stress.
Studies specifically using thermal imaging for evaluating thermal stress while exercising
in a hot environment are limited.32-36
Most of these studies have focused on qualitatively
describing the skin temperature responses to exercising in the heat. In addition many of these
studies lack sufficient sample sizes to allow for generalization of results. While this analytical
method is useful in terms of our understanding of the body’s response to exercise in the heat,
development of this technology and its analysis could aid our ability to diagnose exertional heat
illnesses.
Recent research using thermal imaging during exertional heat stress has focused on the
ability of infrared imagery to detect elevated core body temperatures based on areas of the skin
surface. For example, it has been suggested that the skin temperature of inner canthus of the eye
may predict core body temperature. However, an investigation by Teunissen et al. revealed no
relationship between oesophageal and inner canthus temperature during rest, exercise or passive
heating. The authors also cite a large amount of inter-subject variability at rest, further
questioning its diagnostic validity.36
Belval 13
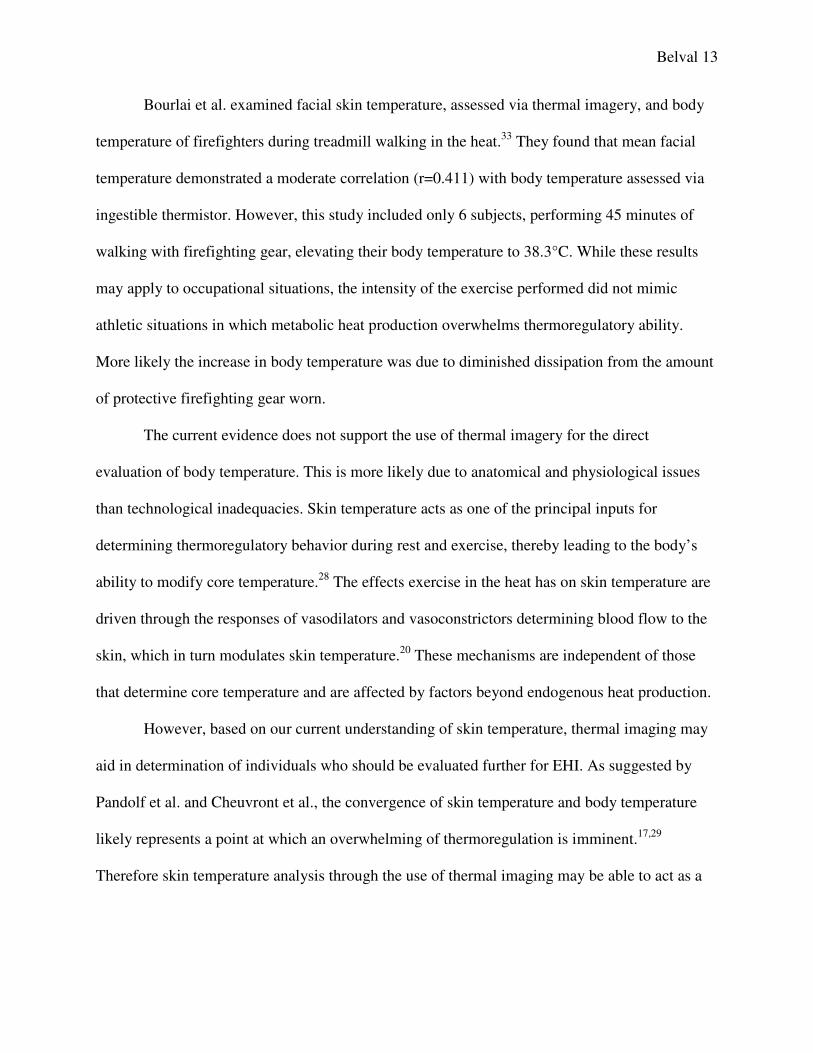
Bourlai et al. examined facial skin temperature, assessed via thermal imagery, and body
temperature of firefighters during treadmill walking in the heat.33
They found that mean facial
temperature demonstrated a moderate correlation (r=0.411) with body temperature assessed via
ingestible thermistor. However, this study included only 6 subjects, performing 45 minutes of
walking with firefighting gear, elevating their body temperature to 38.3°C. While these results
may apply to occupational situations, the intensity of the exercise performed did not mimic
athletic situations in which metabolic heat production overwhelms thermoregulatory ability.
More likely the increase in body temperature was due to diminished dissipation from the amount
of protective firefighting gear worn.
The current evidence does not support the use of thermal imagery for the direct
evaluation of body temperature. This is more likely due to anatomical and physiological issues
than technological inadequacies. Skin temperature acts as one of the principal inputs for
determining thermoregulatory behavior during rest and exercise, thereby leading to the body’s
ability to modify core temperature.28
The effects exercise in the heat has on skin temperature are
driven through the responses of vasodilators and vasoconstrictors determining blood flow to the
skin, which in turn modulates skin temperature.20
These mechanisms are independent of those
that determine core temperature and are affected by factors beyond endogenous heat production.
However, based on our current understanding of skin temperature, thermal imaging may
aid in determination of individuals who should be evaluated further for EHI. As suggested by
Pandolf et al. and Cheuvront et al., the convergence of skin temperature and body temperature
likely represents a point at which an overwhelming of thermoregulation is imminent.17,29
Therefore skin temperature analysis through the use of thermal imaging may be able to act as a

Belval 14
screening process for the determination of EHI risk, wherein individuals with skin temperatures
at or near deep body temperatures need further evaluation.
Belval 15
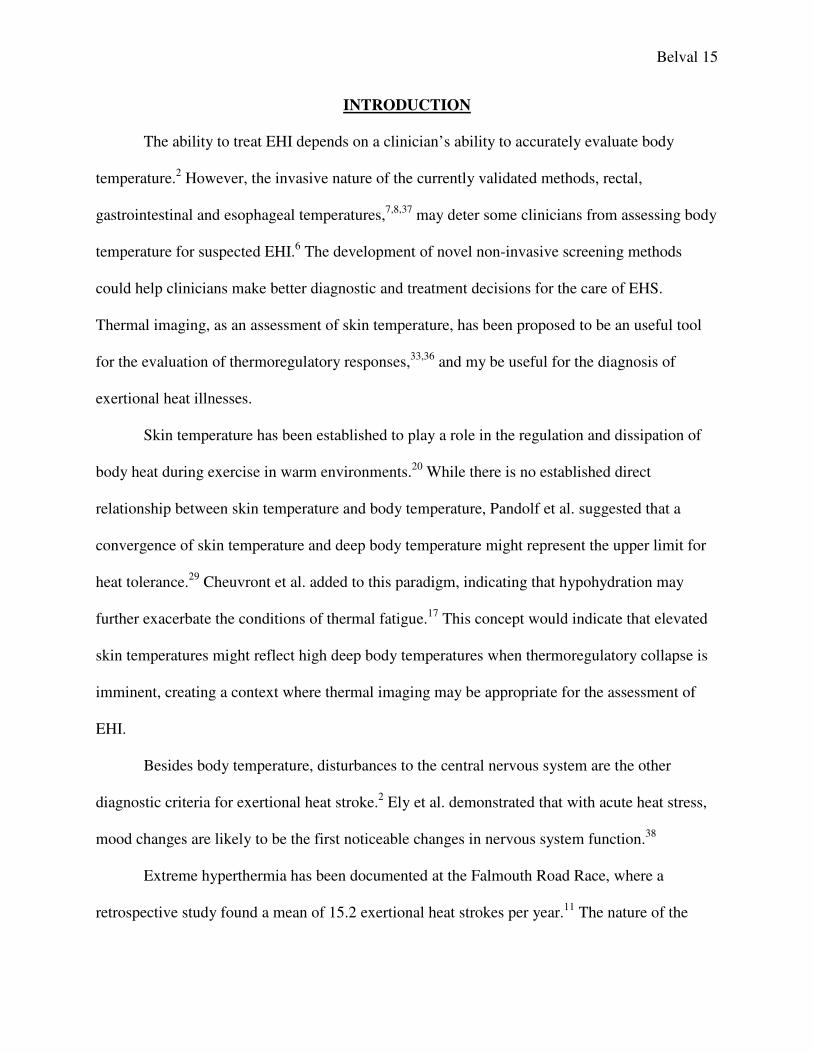
INTRODUCTION
The ability to treat EHI depends on a clinician’s ability to accurately evaluate body
temperature.2 However, the invasive nature of the currently validated methods, rectal,
gastrointestinal and esophageal temperatures,7,8,37
may deter some clinicians from assessing body
temperature for suspected EHI.6 The development of novel non-invasive screening methods
could help clinicians make better diagnostic and treatment decisions for the care of EHS.
Thermal imaging, as an assessment of skin temperature, has been proposed to be an useful tool
for the evaluation of thermoregulatory responses,33,36
and my be useful for the diagnosis of
exertional heat illnesses.
Skin temperature has been established to play a role in the regulation and dissipation of
body heat during exercise in warm environments.20
While there is no established direct
relationship between skin temperature and body temperature, Pandolf et al. suggested that a
convergence of skin temperature and deep body temperature might represent the upper limit for
heat tolerance.29
Cheuvront et al. added to this paradigm, indicating that hypohydration may
further exacerbate the conditions of thermal fatigue.17
This concept would indicate that elevated
skin temperatures might reflect high deep body temperatures when thermoregulatory collapse is
imminent, creating a context where thermal imaging may be appropriate for the assessment of
EHI.
Besides body temperature, disturbances to the central nervous system are the other
diagnostic criteria for exertional heat stroke.2 Ely et al. demonstrated that with acute heat stress,
mood changes are likely to be the first noticeable changes in nervous system function.38
Extreme hyperthermia has been documented at the Falmouth Road Race, where a
retrospective study found a mean of 15.2 exertional heat strokes per year.11
The nature of the
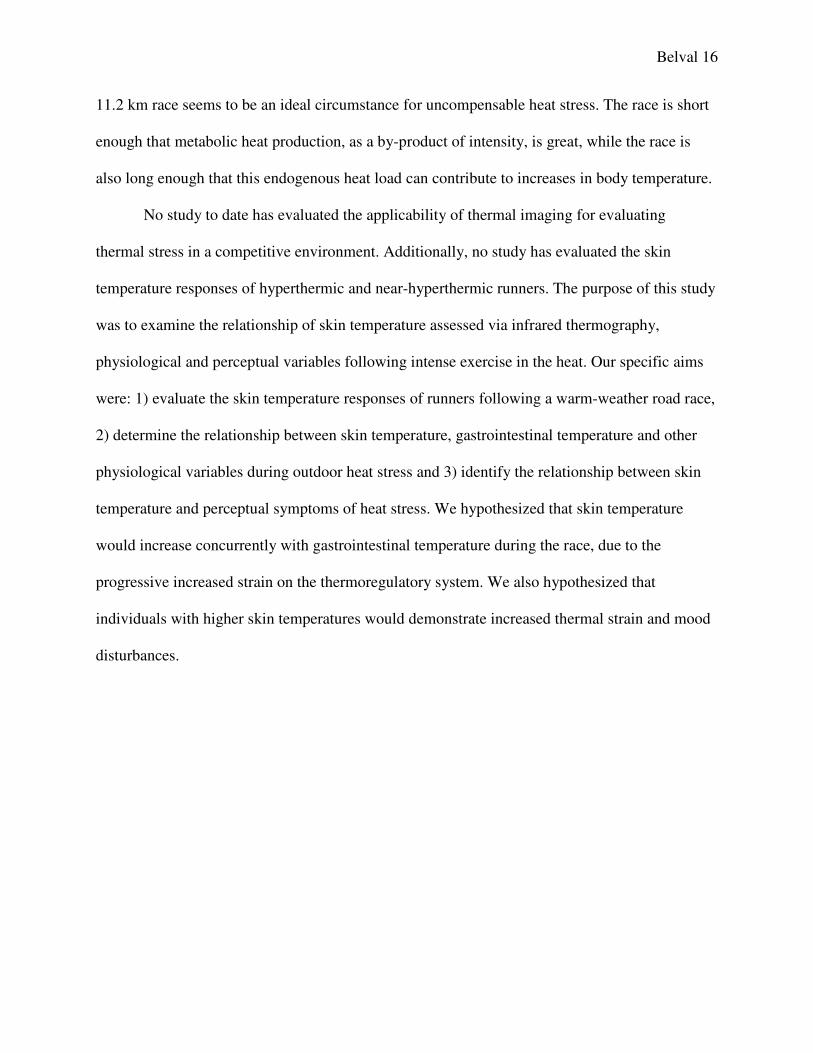
Belval 16
11.2 km race seems to be an ideal circumstance for uncompensable heat stress. The race is short
enough that metabolic heat production, as a by-product of intensity, is great, while the race is
also long enough that this endogenous heat load can contribute to increases in body temperature.
No study to date has evaluated the applicability of thermal imaging for evaluating
thermal stress in a competitive environment. Additionally, no study has evaluated the skin
temperature responses of hyperthermic and near-hyperthermic runners. The purpose of this study
was to examine the relationship of skin temperature assessed via infrared thermography,
physiological and perceptual variables following intense exercise in the heat. Our specific aims
were: 1) evaluate the skin temperature responses of runners following a warm-weather road race,
2) determine the relationship between skin temperature, gastrointestinal temperature and other
physiological variables during outdoor heat stress and 3) identify the relationship between skin
temperature and perceptual symptoms of heat stress. We hypothesized that skin temperature
would increase concurrently with gastrointestinal temperature during the race, due to the
progressive increased strain on the thermoregulatory system. We also hypothesized that
individuals with higher skin temperatures would demonstrate increased thermal strain and mood
disturbances.
Belval 17
METHODS
Study Overview
Race data collection occurred at the Falmouth Road Race held in Falmouth, MA on
August 11th
, 2013. The Falmouth Road Race is an 11.2 km point-to-point race, held at 10 AM
annually. Subjects presented for data collection at two time points, pre-race (PRE) and post-race
(POST). An additional subset of subjects completed preliminary fitness testing at the UConn
Human Performance Laboratory. The University of Connecticut Institutional Review Board
approved this study.
Participants
Subjects were recruited via e-mail recruitment materials and on-site recruitment prior to
the race. Subjects were limited to individuals already registered for the race, between the ages of
18 and 60, and those who planned on finishing the 7-mile race in less than 55 minutes.
Additionally subjects were excluded if they had a history of the following conditions: chronic
health problems, a history of cardiovascular, metabolic or respiratory disease, a fever or other
illness at the time of the race, an exertional heatstroke within 3 years, or any of the
contraindications to the use of an ingestible thermistor, including but not limited to obstructive
bowel disease and gastrointestinal mobility disorders.
A total of 20 male subjects were included in the study. One female was excluded from
the data analysis due to the innate differences in thermal imaging analysis for clothed males and
females. Subject demographics are presented in table 1.
Belval 18
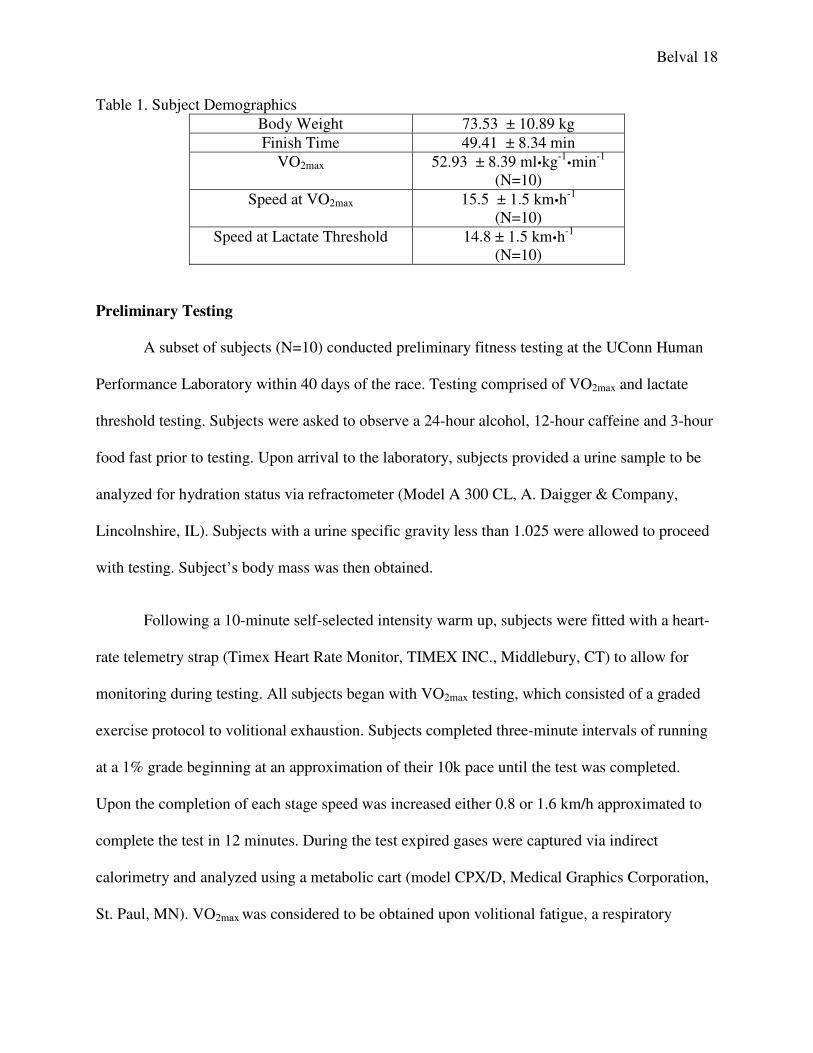
Table 1. Subject Demographics
Body Weight 73.53 ± 10.89 kg
Finish Time 49.41 ± 8.34 min
VO2max 52.93 ± 8.39 ml�kg-1�min
-1
(N=10)
Speed at VO2max 15.5 ± 1.5 km�h-1
(N=10)
Speed at Lactate Threshold 14.8 ± 1.5 km�h-1
(N=10)
Preliminary Testing
A subset of subjects (N=10) conducted preliminary fitness testing at the UConn Human
Performance Laboratory within 40 days of the race. Testing comprised of VO2max and lactate
threshold testing. Subjects were asked to observe a 24-hour alcohol, 12-hour caffeine and 3-hour
food fast prior to testing. Upon arrival to the laboratory, subjects provided a urine sample to be
analyzed for hydration status via refractometer (Model A 300 CL, A. Daigger & Company,
Lincolnshire, IL). Subjects with a urine specific gravity less than 1.025 were allowed to proceed
with testing. Subject’s body mass was then obtained.
Following a 10-minute self-selected intensity warm up, subjects were fitted with a heart-
rate telemetry strap (Timex Heart Rate Monitor, TIMEX INC., Middlebury, CT) to allow for
monitoring during testing. All subjects began with VO2max testing, which consisted of a graded
exercise protocol to volitional exhaustion. Subjects completed three-minute intervals of running
at a 1% grade beginning at an approximation of their 10k pace until the test was completed.
Upon the completion of each stage speed was increased either 0.8 or 1.6 km/h approximated to
complete the test in 12 minutes. During the test expired gases were captured via indirect
calorimetry and analyzed using a metabolic cart (model CPX/D, Medical Graphics Corporation,
St. Paul, MN). VO2max was considered to be obtained upon volitional fatigue, a respiratory
Belval 19
exchange ratio greater than 1.10, a heart rate greater than 90% a subject’s age predicted
maximum (220-age), or a plateau in VO2 or heart rate despite an increase in intensity.
Following a 30-minute break subjects completed a five-minute self-selected intensity
warm up to prepare for lactate threshold testing. An initial finger-prick lactate measurement was
obtained and analyzed using a handheld lactate meter (Lactate Plus, nova biomedical, Waltham,
MA). Subjects then began a graded exercise protocol, wherein intensity increased by 0.8 km/h
each stage. Stages consisted of three minutes running at a given intensity at a 1% treadmill grade.
Following each stage subjects straddled the treadmill for 1 minute to allow for collection of a
finger-prick blood sample to measure lactate. Lactate threshold was considered to have been
achieved if a non-linear increase in lactate measurement occurred between 2 stages.
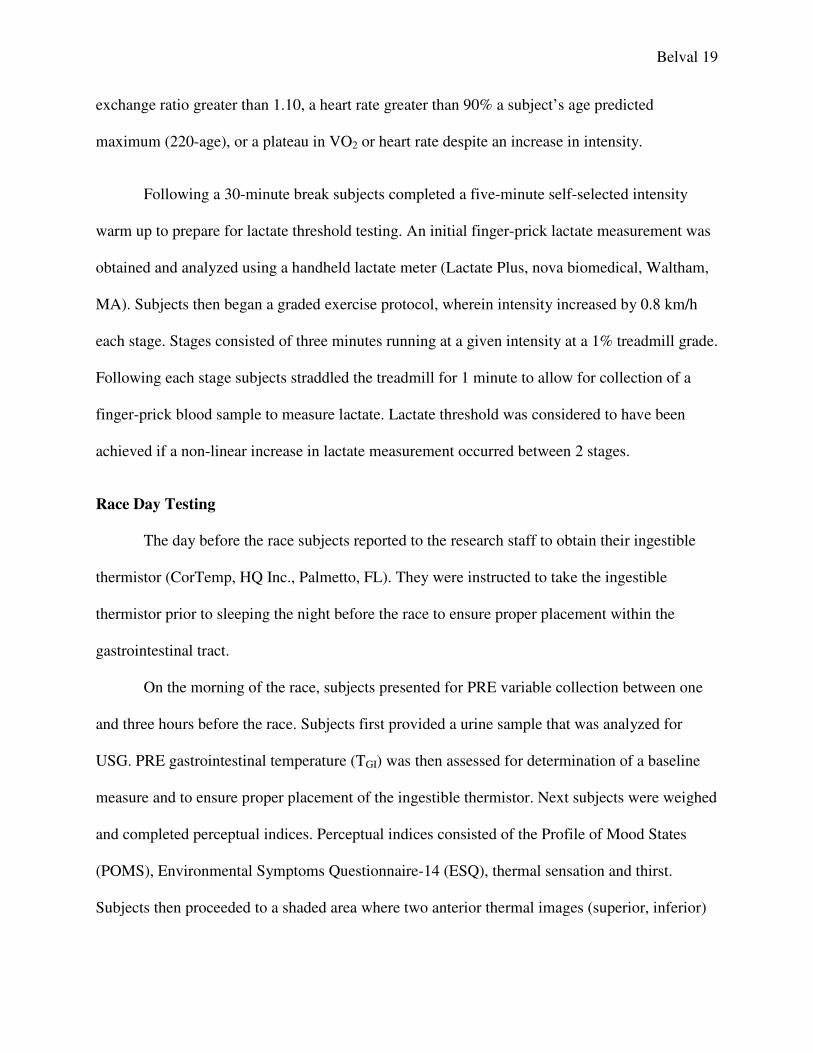
Race Day Testing
The day before the race subjects reported to the research staff to obtain their ingestible
thermistor (CorTemp, HQ Inc., Palmetto, FL). They were instructed to take the ingestible
thermistor prior to sleeping the night before the race to ensure proper placement within the
gastrointestinal tract.
On the morning of the race, subjects presented for PRE variable collection between one
and three hours before the race. Subjects first provided a urine sample that was analyzed for
USG. PRE gastrointestinal temperature (TGI) was then assessed for determination of a baseline
measure and to ensure proper placement of the ingestible thermistor. Next subjects were weighed
and completed perceptual indices. Perceptual indices consisted of the Profile of Mood States
(POMS), Environmental Symptoms Questionnaire-14 (ESQ), thermal sensation and thirst.
Subjects then proceeded to a shaded area where two anterior thermal images (superior, inferior)
Belval 20
were obtained. Thermal images were obtained using an infrared camera (ICI 7320P, Infrared
Cameras Inc., Beaumont, TX) at a standardized distance, against a white background.
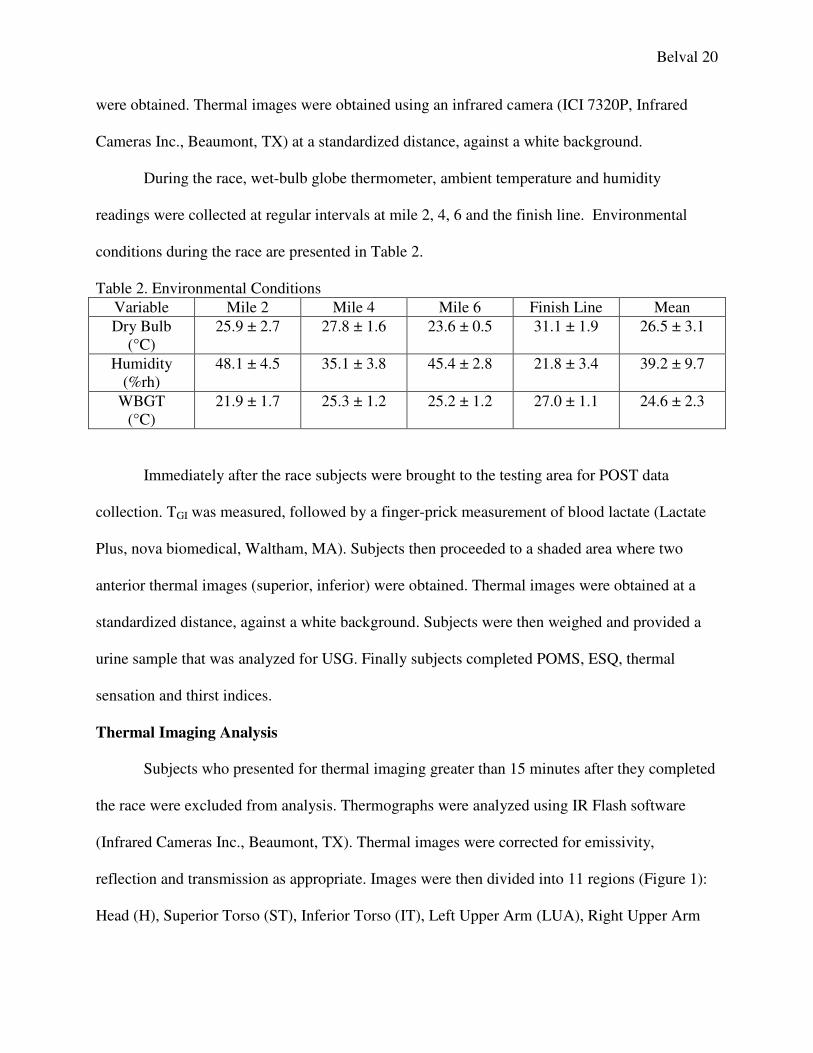
During the race, wet-bulb globe thermometer, ambient temperature and humidity
readings were collected at regular intervals at mile 2, 4, 6 and the finish line. Environmental
conditions during the race are presented in Table 2.
Table 2. Environmental Conditions
Variable Mile 2 Mile 4 Mile 6 Finish Line Mean
Dry Bulb
(°C)
25.9 ± 2.7 27.8 ± 1.6 23.6 ± 0.5 31.1 ± 1.9 26.5 ± 3.1
Humidity
(%rh)
48.1 ± 4.5 35.1 ± 3.8 45.4 ± 2.8 21.8 ± 3.4 39.2 ± 9.7
WBGT
(°C)
21.9 ± 1.7 25.3 ± 1.2 25.2 ± 1.2 27.0 ± 1.1 24.6 ± 2.3
Immediately after the race subjects were brought to the testing area for POST data
collection. TGI was measured, followed by a finger-prick measurement of blood lactate (Lactate
Plus, nova biomedical, Waltham, MA). Subjects then proceeded to a shaded area where two
anterior thermal images (superior, inferior) were obtained. Thermal images were obtained at a
standardized distance, against a white background. Subjects were then weighed and provided a
urine sample that was analyzed for USG. Finally subjects completed POMS, ESQ, thermal
sensation and thirst indices.
Thermal Imaging Analysis
Subjects who presented for thermal imaging greater than 15 minutes after they completed
the race were excluded from analysis. Thermographs were analyzed using IR Flash software
(Infrared Cameras Inc., Beaumont, TX). Thermal images were corrected for emissivity,
reflection and transmission as appropriate. Images were then divided into 11 regions (Figure 1):
Head (H), Superior Torso (ST), Inferior Torso (IT), Left Upper Arm (LUA), Right Upper Arm
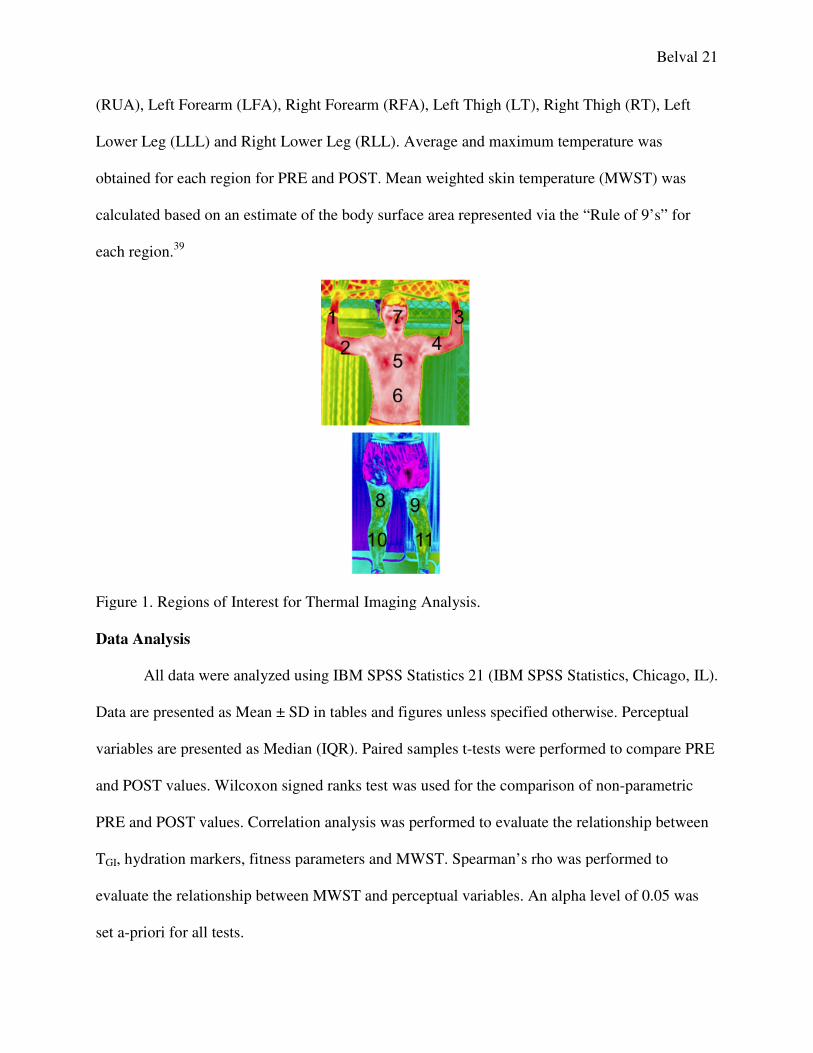
(RUA), Left Forearm (LFA), Right Forearm (RFA), Left Thig
Lower Leg (LLL) and Right Lower Leg (RLL). Average and maximum temperature was
obtained for each region for PRE and POST. Mean weighted skin temperature
calculated based on an estimate of the
each region.39
Figure 1. Regions of Interest for Thermal Imaging Analysis.
Data Analysis
All data were analyzed using IBM SPSS Statistics 21 (IBM SPSS Statistics, Chicago, IL).
Data are presented as Mean ± SD
variables are presented as Median (IQR).
and POST values. Wilcoxon signed ranks test was used for the comparison of non
PRE and POST values. Correlation analysis was performed to evaluate the relationship between
TGI, hydration markers, fitness parameters
evaluate the relationship between MWST and perceptual variables.
set a-priori for all tests.
(RUA), Left Forearm (LFA), Right Forearm (RFA), Left Thigh (LT), Right Thigh (RT), Left
Lower Leg (LLL) and Right Lower Leg (RLL). Average and maximum temperature was
obtained for each region for PRE and POST. Mean weighted skin temperature (MWST)
calculated based on an estimate of the body surface area represented via the “Rule of 9’s” for
Figure 1. Regions of Interest for Thermal Imaging Analysis.
All data were analyzed using IBM SPSS Statistics 21 (IBM SPSS Statistics, Chicago, IL).
a are presented as Mean ± SD in tables and figures unless specified otherwise
variables are presented as Median (IQR). Paired samples t-tests were performed to compare
Wilcoxon signed ranks test was used for the comparison of non
Correlation analysis was performed to evaluate the relationship between
, hydration markers, fitness parameters and MWST. Spearman’s rho was performed to
evaluate the relationship between MWST and perceptual variables. An alpha level of 0.05 was
Belval 21
h (LT), Right Thigh (RT), Left
Lower Leg (LLL) and Right Lower Leg (RLL). Average and maximum temperature was
(MWST) was
esented via the “Rule of 9’s” for
All data were analyzed using IBM SPSS Statistics 21 (IBM SPSS Statistics, Chicago, IL).
in tables and figures unless specified otherwise. Perceptual
ere performed to compare PRE
Wilcoxon signed ranks test was used for the comparison of non-parametric
Correlation analysis was performed to evaluate the relationship between
Spearman’s rho was performed to
An alpha level of 0.05 was
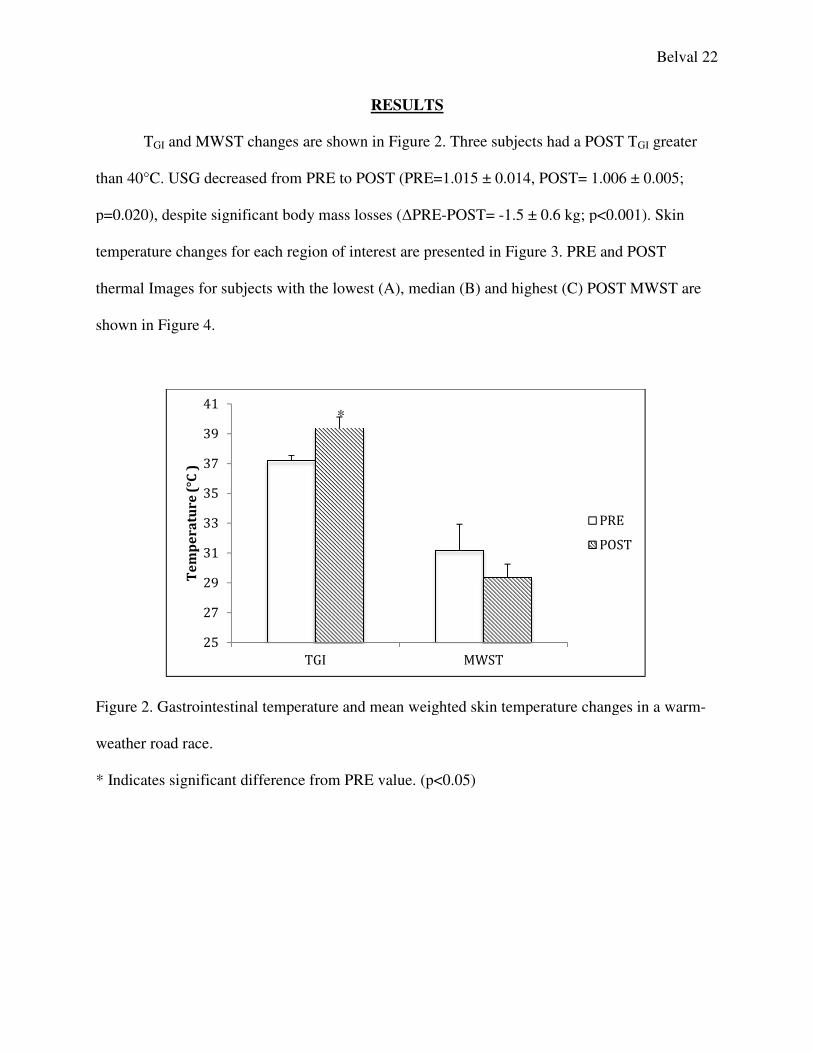
TGI and MWST changes are shown in Figure 2.
than 40°C. USG decreased from PRE to POST (PRE=1.015 ± 0.014, POST= 1.006 ± 0.005;
p=0.020), despite significant body mass losses (
temperature changes for each region of in
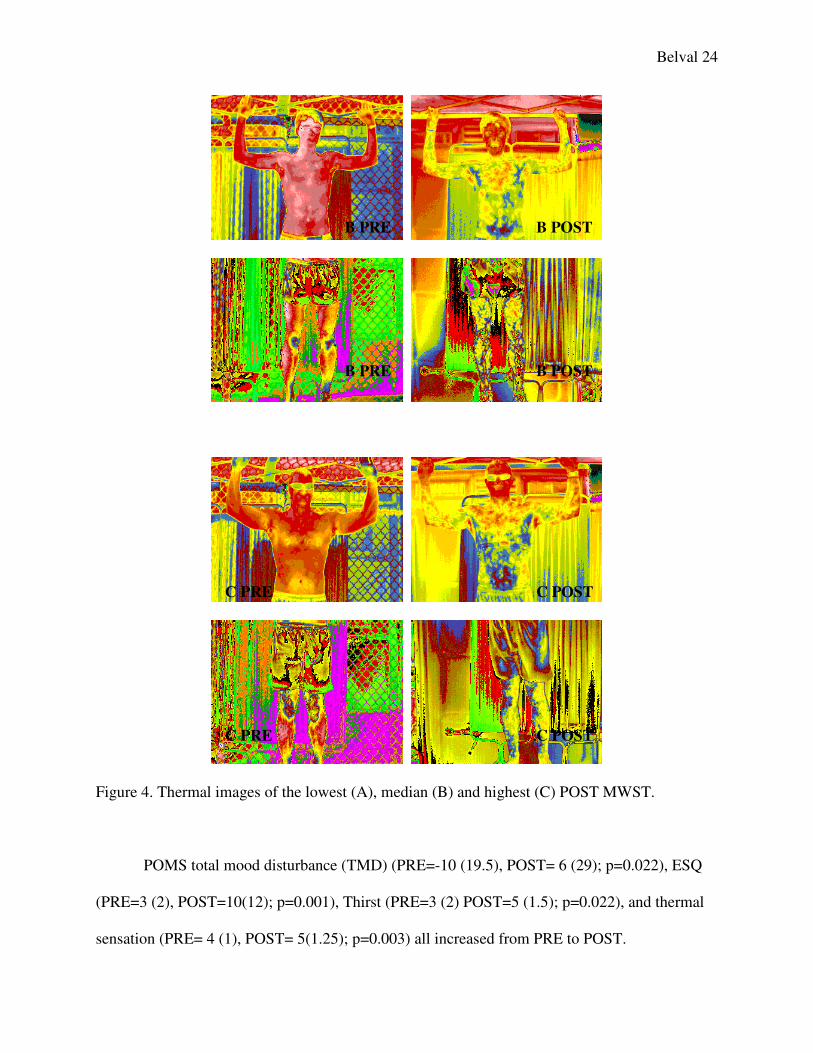
thermal Images for subjects with the lowest (A), median (B) and highest (C)
shown in Figure 4.
Figure 2. Gastrointestinal temperature and mean weighted skin temperature c
weather road race.
* Indicates significant difference from PRE value. (p<0.05)
25
27
29
31
33
35
37
39
41
Te
mp
er
atu
re
(°C
)
RESULTS
and MWST changes are shown in Figure 2. Three subjects had a POST T
USG decreased from PRE to POST (PRE=1.015 ± 0.014, POST= 1.006 ± 0.005;
p=0.020), despite significant body mass losses (∆PRE-POST= -1.5 ± 0.6 kg; p<0.001).
for each region of interest are presented in Figure 3. PRE and POST
thermal Images for subjects with the lowest (A), median (B) and highest (C) POST MWST are
2. Gastrointestinal temperature and mean weighted skin temperature changes
dicates significant difference from PRE value. (p<0.05)
TGI MWST
PRE
POST
*
Belval 22
Three subjects had a POST TGI greater
USG decreased from PRE to POST (PRE=1.015 ± 0.014, POST= 1.006 ± 0.005;
1.5 ± 0.6 kg; p<0.001). Skin
PRE and POST
POST MWST are
hanges in a warm-
PRE
POST
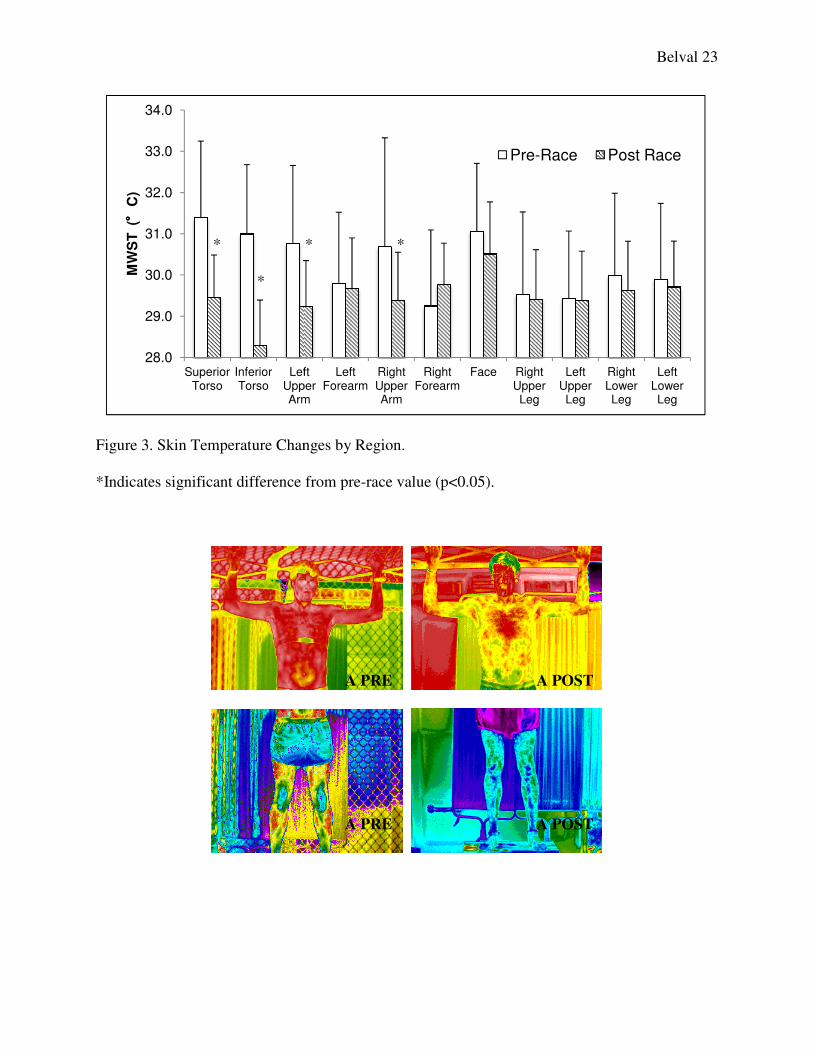
Figure 3. Skin Temperature Changes by Region.
*Indicates significant difference from pre
28.0
29.0
30.0
31.0
32.0
33.0
34.0
Superior Torso
Inferior Torso
Left Upper Arm
MW
ST
( °° °°
C)
* * *
*
. Skin Temperature Changes by Region.
Indicates significant difference from pre-race value (p<0.05).
Left Upper Arm
Left Forearm
Right Upper Arm
Right Forearm
Face Right Upper Leg
Left Upper Leg
Right Lower
Pre-Race Post Race
* * *
A PRE
A PRE
A POST
A POST
Belval 23
Right Lower Leg
Left Lower Leg
Post Race
Belval 24
Figure 4. Thermal images of the lowest (A), median (B) and highest (C) POST MWST.
POMS total mood disturbance (TMD) (PRE=-10 (19.5), POST= 6 (29); p=0.022), ESQ
(PRE=3 (2), POST=10(12); p=0.001), Thirst (PRE=3 (2) POST=5 (1.5); p=0.022), and thermal
sensation (PRE= 4 (1), POST= 5(1.25); p=0.003) all increased from PRE to POST.
B PRE
B PRE
C PRE
C PRE
B POST
B POST
C POST
C POST
Belval 25
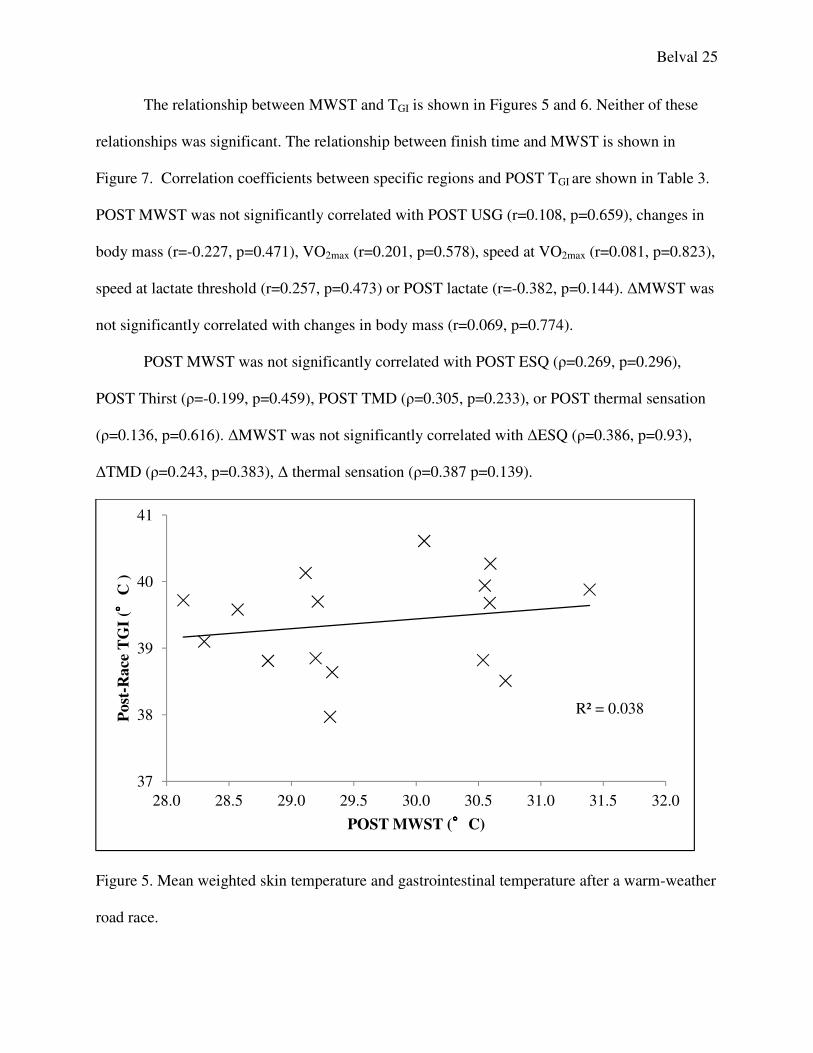
The relationship between MWST and TGI is shown in Figures 5 and 6. Neither of these
relationships was significant. The relationship between finish time and MWST is shown in
Figure 7. Correlation coefficients between specific regions and POST TGI are shown in Table 3.
POST MWST was not significantly correlated with POST USG (r=0.108, p=0.659), changes in
body mass (r=-0.227, p=0.471), VO2max (r=0.201, p=0.578), speed at VO2max (r=0.081, p=0.823),
speed at lactate threshold (r=0.257, p=0.473) or POST lactate (r=-0.382, p=0.144). ∆MWST was
not significantly correlated with changes in body mass (r=0.069, p=0.774).
POST MWST was not significantly correlated with POST ESQ (ρ=0.269, p=0.296),
POST Thirst (ρ=-0.199, p=0.459), POST TMD (ρ=0.305, p=0.233), or POST thermal sensation
(ρ=0.136, p=0.616). ∆MWST was not significantly correlated with ∆ESQ (ρ=0.386, p=0.93),
∆TMD (ρ=0.243, p=0.383), ∆ thermal sensation (ρ=0.387 p=0.139).
Figure 5. Mean weighted skin temperature and gastrointestinal temperature after a warm-weather
road race.
R² = 0.038
37
38
39
40
41
28.0 28.5 29.0 29.5 30.0 30.5 31.0 31.5 32.0
Post
-Race
TG
I ( °° °°
C )
POST MWST (°°°°C)
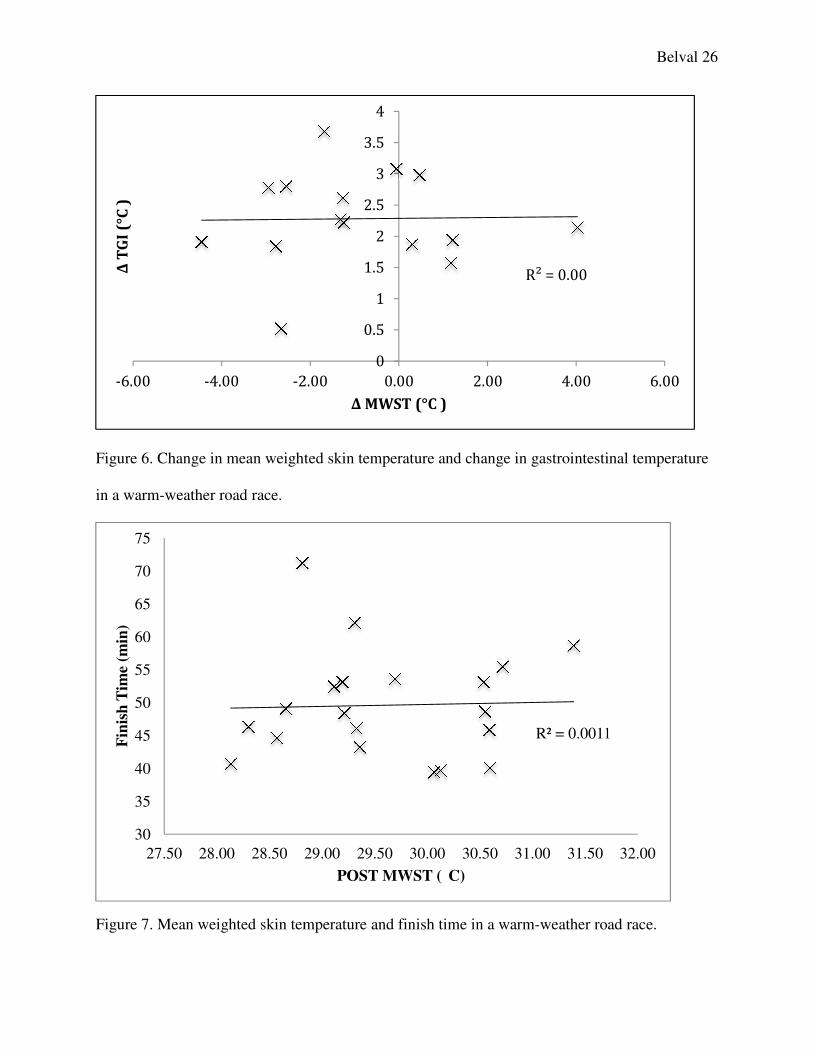
Figure 6. Change in mean weighted skin temperature and change in gastrointestinal temperature
in a warm-weather road race.
Figure 7. Mean weighted skin temperature and finish time in a warm
-6.00 -4.00 -2.00
Δ T
GI
(°C
)
30
35
40
45
50
55
60
65
70
75
27.50 28.00 28.50 29.00
Fin
ish
Tim
e (m
in)
Change in mean weighted skin temperature and change in gastrointestinal temperature
Mean weighted skin temperature and finish time in a warm-weather road race.
R² = 0.00
0
0.5
1
1.5
2
2.5
3
3.5
4
2.00 0.00 2.00 4.00
Δ MWST (°C )
R² = 0.0011
29.00 29.50 30.00 30.50 31.00 31.50
POST MWST ( C)
Belval 26
Change in mean weighted skin temperature and change in gastrointestinal temperature
weather road race.
6.00
R² = 0.0011
32.00

Belval 27
Table 3. Correlations of Regions of Interest with POST TGI. Region H ST IT RUA RFA LUA LFA RT RLL LT LLL
TGI
(r)
0.154 0.258 0.357 0.130 0.190 0.052 0.196 -0.005 -0.059 0.073 0.009
* Indicates significant correlation. (p<0.05)
Belval 28
DISCUSSION
Thermal imaging has been proposed to be useful in the detection of EHI during exercise
in the heat. However, due to numerous anatomical and physiological factors, skin temperature
would likely only converge with deep body temperature when thermoregulatory failure is
imminent. It is for that reason that we evaluated the thermal images of runners in a warm-
weather road race where exertional heat stroke is frequently documented. In this field setting we
sought to relate thermal images to both the physiological and perceptual signs of exertional heat
illnesses to evaluate the diagnostic potential of this modality.
The primary finding of this study was that despite moderate levels of hyperthermia, skin
temperature assessed via thermal imaging was not associated with TGI. POST MWST was not
related to either POST TGI or ∆TGI. Additionally, both MWST and skin temperature for each
region of interest decreased significantly from PRE to POST. POST MWST was not
significantly correlated with any of the perceptual indices (POMS, ESQ or thermal sensation).
These findings contrast our hypotheses that increased MWST would be associated with higher
TGI and increased perceptual heat stress.
Our results corroborate Teunissen et al. wherein we found that no single point
approached TGI at either time point 36
Additionally, we found that POST regional skin
temperatures analyzed separately did not correlate with TGI. These findings contrast those of
Bourlai et al. who found that facial skin temperature assessed with thermal imaging was
correlated with core temperature.33
The discrepancy between these studies might be partially
accounted for the fact that Bourlai et al. utilized a heat stress that was compounded by the
wearing of a firefighting uniform, whereas both our study and Teunissen et al. relied on exercise
heat stress in sport clothes. This can be supported by Armstrong et al. who found that football
Belval 29
uniforms had an effect on differences in post-exercise skin temperature of the forearm and
neck.40
Based on our findings, it can be surmised that the elevation of body temperature in our
subjects likely was not due to a convergence of skin temperature and deep body temperature
diminishing heat dissipation, as suggested by Pandolf et al.29
Rather, the observed rise in TGI is
likely attributed to the intensity of the 11.2 km race creating a significant metabolic demand.
When considering the exertional heat stress paradigm of competitive blood flow, both
endogenous heat production and increased muscular perfusion resultant of the high intensity can
contribute to a hyperthermic TGI increase with slight changes in skin temperature. As noted by
Cheuvront et al. a model of the upper limits of heat tolerance wherein the convergence of skin
temperature and deep body temperature represent thermoregulatory failure would be exacerbated
by body fluid losses secondary to hypohydration.17
In our study USG decreased non-significantly
from PRE to POST indicating that the additional physiological stress of hypohydration did not
play a role in body temperature rises.
Within the context of uncompensable exertional heat stress two divergent paradigms for
body temperature rise would explain our finding that TGI increased without concurrent changes in
skin temperature. In the case of our study, large amounts of endogenous heat production and
high muscular blood flow demands that supersede cutaneous blood flow created a relatively
rapid rise in body temperature. On the contrary, a uniformed or equipment laden exertional heat
stress, with a diminished ability to dissipate heat could also create similar levels of hyperthermia
at lower intensities or longer durations. This is shown by Armstrong et al. who found that time-to
exhaustion was less and rate of rise of rectal temperature was greater in individuals wearing a
full football uniform compared to individuals in shorts and a t-shirt.40
In this second case the
Belval 30
microenvironment of a uniform minimizes the interaction of the skin and the environment to
creating a thermal load. In this situation, cutaneous blood flow demands can be met and skin
temperature would rise until a point of thermoregulatory failure is met.
When put within the context of these heat stress concepts the disparities between the
findings of Bourlai et al., Teunissen et al. and our study can be reconciled. Due to the fact that
Bourlai et al. used uniformed firefighters the rises in deep body temperature could fall into the
second situation described above. This impaired heat dissipation model may represent a situation
where elevated skin temperature can be associated with elevated deep body temperature.
Interestingly, skin temperature was found to decrease from PRE to POST for all regions
of interest. This is likely due to a normal decrease that occurs in compensable heat stress.25
These
changes were significant for the torso and upper arms. These were the regions that not only had
the primary muscles of locomotion active during the race but also were likely covered by
clothing, minimizing their interface with the environment. Since the thermal gradient between
the skin surface and the environment is a method of heat dissipation, the drop in skin temperature
for these regions would indicate that they maintained a potential for heat exchange greater than
both the exercising muscles of the leg and the face and forearms that were exposed to the
environment. This adds support to the recommendations to cover as little skin surface as possible
during exercise in the heat.41
Skin temperature is also known to be a primary effector input regarding perception of
heat.20
However, we found that POMS, ESQ and thermal sensation were not correlated with
MWST. This is likely attributed to the variability in MWST. Additionally, since the variables
were measured after the race, in a field setting, establishing a connection between the effects of
thermal stress and those of the race day environment are difficult.
Belval 31
Limitations
One of the chief limitations of this study is that we only evaluated anterior thermal
images. It is well understood that the interface of the anterior surface of the body and the
posterior surface have different interactions with the environment during outside running due to
convective air flow. Therefore it is likely that skin temperature between these two surfaces
would also differ.
Additionally, we were limited due the fact that not all images were taken immediately
after runners had completed the race. Images that were taken greater than 15 minutes after a
subject finished the race were excluded from analysis. However, even in these 15 minutes post-
exercise drops in skin temperature could occur, confounding measurement. Thermal imaging
remains a new technology for the assessment of skin temperature and standardized methods of
analysis have not been established.
Due to the nature of this field study, subjects’ actions during the race could not be
controlled. We were limited to taking PRE measures 1-hour before the start with some subjects
having measurements 3 hours prior to the race. Theses results are limited to our specific study
population, and would be difficult to apply to females or different duration races.
Future Research
A key area for future research in examining thermal imaging measurement of skin
temperature is in an alternative paradigm for hyperthermia, wherein rises in body temperature are
due to diminished heat dissipation, such as exercise in uniform or with equipment. These studies
may find a greater connection between body temperature and skin temperature increases because
of the compromised heat dissipation. Future studies should also examine females in comparison
with males to understand differences in physiological responses to exercise in the heat. Finally,
Belval 32
further studies should be done to evaluate the relationship between skin temperature and deep
body temperature at differing levels of hydration.
Conclusions
The purpose of this study was to evaluate the relationship between skin temperature
assessed via thermal imaging, physiological and perceptual responses following a warm-weather
road race. In the context of this 11.2 km road race, skin temperature assessed via thermal
imaging was not related to TGI or any perceptual indices. This indicates that in this setting
thermal imaging may not be appropriate for the detection of exertional heat illnesses.
Belval 33
REFERENCES
1. Armstrong LE. Exertional Heat Illnesses. Human Kinetics; 2003.
2. Casa DJ, Armstrong LE, Kenny GP, O'Connor FG, Huggins RA. Exertional heat stroke: new concepts regarding cause and care. Curr Sports Med Rep. 2012;11(3):115–123.
3. Casa DJ, Armstrong LE, Ganio MS, Yeargin SW. Exertional heat stroke in competitive athletes. Curr Sports Med Rep. 2005;4(6):309.
4. Casa DJ, McDermott BP, Lee EC, Yeargin SW, Armstrong LE, Maresh CM. Cold water immersion: the gold standard for exertional heatstroke treatment. Exerc Sport Sci Rev. 2007;35(3):141–149.
5. Huggins R, Glaviano N, Negishi N, Casa DJ, Hertel J. Comparison of Rectal and Aural Core Body Temperature Thermometry in Hyperthermic, Exercising Individuals: A Meta-Analysis. J Athl Train. 2012;47(3):329–338.
6. Mazerolle SM, Scruggs IC, Casa DJ, et al. Current Knowledge, Attitudes, and Practices of Certified Athletic Trainers Regarding Recognition and Treatment of Exertional Heat Stroke. J Athl Train. 2010;45(2):170–180.
7. Ganio MS, Brown CM, Casa DJ, et al. Validity and reliability of devices that assess body temperature during indoor exercise in the heat. J Athl Train. 2009;44(2):124–135.
8. Casa DJ, Becker SM, Ganio MS, et al. Validity of devices that assess body temperature during outdoor exercise in the heat. J Athl Train. 2007;42(3):333.
9. Mazerolle SM, Ganio MS, Casa DJ, Vingren J, Klau JF. Is oral temperature an accurate measurement of deep body temperature? A systematic review. J Athl Train. 2011;46(5):566–573.
10. Byrne C, Lim CL. The ingestible telemetric body core temperature sensor: a review of validity and exercise applications. British Journal of Sports Medicine. 2007;41(3):126–133.
11. Demartini JK, Casa DJ, Belval LN, Stearns RL, Davis RJ, Jardine JJ. Relationship of the Incidence of Exertional Heatstroke and Environmental Conditions at the Falmouth Road Race. (unpublished Data).
12. Casa DJ. Exercise in the heat. I. Fundamentals of thermal physiology, performance implications, and dehydration. J Athl Train. 1999;34(3):246.
13. Brodeur VB, Dennett SR, Griffin LS. Exertional hyperthermia, ice baths, and emergency care at the Falmouth Road Race. J Emerg Nurs. 1989;15(4):304–312.
14. Casa DJ, Guskiewicz KM, Anderson SA, et al. National Athletic Trainers' Association Position Statement: Preventing Sudden Death in Sports. J Athl Train. 2012;47(1):96–118.
Belval 34
15. Casa DJ, Belval LN, Stearns RL, Demartini JK, Davis RJ, Jardine JJ. Survival and Cooling Rates following Exertional Heat Stroke at the Falmouth Road Race. (unpublished Data).
16. Stitt J. Central Regulation of Body Temperature. In: Perspectives in Exercise Science and Sports Medicine: Exercise, Heat and Thermoregulation.Vol 6. Cooper Publishing Group; 2001:1–39.
17. Cheuvront SN, Kenefick RW, Montain SJ, Sawka MN. Mechanisms of aerobic performance impairment with heat stress and dehydration. Journal of Applied Physiology. 2010;109(6):1989–1995.
18. Makranz C, Heled Y, Moran DS. Hypothermia following exertional heat stroke treatment. Eur J Appl Physiol. 2011;111(9):2359–2362.
19. Mora-Rodríguez R. Influence of aerobic fitness on thermoregulation during exercise in the heat. Exerc Sport Sci Rev. 2012;40(2):79.
20. Johnson JM. Exercise in a hot environment: the skin circulation. Scandinavian Journal of Medicine & Science in Sports. 2010;20:29–39.
21. Casa DJ. Exercise in the heat. II. Critical concepts in rehydration, exertional heat illnesses, and maximizing athletic performance. J Athl Train. 1999;34(3):253.
22. Sawka MN, Cheuvront SN, Kenefick RW. High skin temperature and hypohydration impairs aerobic performance. Experimental Physiology. 2012;97(3):327–332.
23. Roberts WO. A 12-yr profile of medical injury and illness for the Twin Cities Marathon. Medicine & Science in Sports & Exercise. 2000;32(9):1549–1555.
24. Merla A, Mattei PA, Donato L, Romani GL. Thermal Imaging of Cutaneous Temperature Modifications in Runners During Graded Exercise. Ann Biomed Eng. 2009;38(1):158–163.
25. Veghte JH, Adams WC, Bernauer EM. Temperature changes during exercise measured by thermography. Aviation, Space, and Environmental Medicine. 1979;50(7):708–713.
26. Clark RP, Mullan BJ, Pugh LG. Skin temperature during running--a study using infra-red colour thermography. The Journal of Physiology. 1977;267(1):53–62.
27. Cena K, Clark JA. Proceedings: Thermographic observations of skin temperatures of trained and untrained runners. The Journal of Physiology. 1976;257(1):8P–9P.
28. Schlader ZJ, Stannard SR, Mundel T. Human thermoregulatory behavior during rest and exercise — A prospective review. Physiology & Behavior. 2010;99(3):269–275.
29. Pandolf KB, Goldman RF. Convergence of skin and rectal temperatures as a criterion for heat tolerance. Aviation, Space, and Environmental Medicine. 1978;49:1095–1101.
Belval 35
30. Ramanathan NL. A new weighting system for mean surface temperature of the human body. Journal of Applied Physiology. 1964;19(3):531–533.
31. Livingstone SD, Nolan RW, Frim J, Reed LD, Limmer RE. A thermographic study of the effect of body composition and ambient temperature on the accuracy of mean skin temperature calculations. Eur J Appl Physiol Occup Physiol. 1987;56(1):120–125.
32. Goss FL, Herbert WG, Kelso TB, Duke J. Use of infrared thermography for evaluation of skin temperature during cycling exercise. Research Quarterly. 1988.
33. Bourlai T, Pryor RR, Suyama J, Reis SE, Hostler D. Use of Thermal Imagery for Estimation of Core Body Temperature During Precooling, Exertion, and Recovery in Wildland Firefighter Protective Clothing. Prehosp Emerg Care. 2012;16(3):390–399.
34. Torii M, Yamasaki M, Sasaki T, Nakayama H. Fall in skin temperature of exercising man. British Journal of Sports Medicine. 1992;26(1):29–32.
35. Nakayama T, Ohnuki Y, Kanosue K. Fall in skin temperature during exercise observed by thermography. The Japanese Journal of Physiology. 1981;31(5):757.
36. Teunissen LPJ, Daanen HAM. Infrared thermal imaging of the inner canthus of the eye as an estimator of body core temperature. J Med Eng Technol. 2011;35(3-4):134–138.
37. Teunissen LPJ, de Haan A, de Koning JJ, Daanen HAM. Telemetry pill versus rectal and esophageal temperature during extreme rates of exercise-induced core temperature change. Physiol Meas. 2012;33(6):915–924. d
38. Ely BR, Sollanek KJ, Cheuvront SN, Lieberman HR, Kenefick RW. Hypohydration and acute thermal stress affect mood state but not cognition or dynamic postural balance. Eur
J Appl Physiol. 2013;113(4):1027–1034.
39. Knaysi GA, Criklear GF. The rule of nines: its history and accuracy. Plastic and
Reconstructive Surgery. 1968.
40. Armstrong LE, Johnson EC, Casa DJ, et al. The American football uniform: uncompensable heat stress and hyperthermic exhaustion. J Athl Train. 2010;45(2):117–127.
41. Pascoe DD, Shanley LA, Smith EW. Clothing and exercise. I: Biophysics of heat transfer between the individual, clothing and environment. Sports Med. 1994;18(1):38.