human thermoregulatory responses to cold water immersion...
TRANSCRIPT
HUMAN THERMOREGULATORY RESPONSES TO COLD WATER
IMMERSION DURLNG COMPRESSED AIR AND NITROUS OXIDE NARCOSIS
Sanja Aleksandra Savii
B. Sc.E.E. University of Ljubljana, Slovenia, 1986
M. Sc.E.E. Biomed. Eng. University of Ljubljana, Slovenia, 1990
THESIS SUBMITTED IN PARTIAL FULFILLMENT OF THE REQUIREMENTS
FOR THE DEGREE OF DOCTOR OF PHILOSOPHY
In the School
of
Kinesiology
O Sanja Aleksandra Savic 1996
SIMON FRASER UNIVERSITY
August 1996
All rights reserved. Ttus work may not be reproduced in whole or in part, by photocopy
or other means, without permission of the author.
APPROVAL
NAME: Sanja A. Savic
DEGREE: Doctor of Philosophy
TITLE OF THESIS: Human Thennoregulatory Responses to Cold Water Immersion During Compressed Air and Nitrous Oxide Narcosis
EXAMINING COMMITTEE:
Chair: Dr. John Dickinson
Dr. James Morrison Co-senior Supervisor
Professor, School of Kinesiology
Dr. Ted Milner Co-senior Supervisor
Associate ~rofessor,~chool of Kinesiology
Dr. Tom Richardson Associate Professor, School of Kinesiology
Dr. Eric Banister Internal Examiner
Professor, School of Kinesiology
Dr. J. Hayward External Examiner
Professor Emeritus, University of Victoria
Date Approved: &?OW ' & G o E ~ C / Y %
PARTIAL COPYRIGHT LICENSE
I hereby grant to Simon Fraser Universi the right to lend my thesis, pro'ect or extended essay (the title o which is shown below)
f' 7'
to users o the Simon Fraser University Library, and to make partial or single copies only for such users or in response to a request from the library of any other university, or other educational institution, on its own behalf or for one of its users. 1 further agree that permission for multiple copying of this work for scholarly purposes may be granted by me or the Dean of Graduate Studies. it is understood that copying or publication of this work for financial gain shall not be allowed without my written permission.
Title of Thesis/Project/Extended Essay
HolfA/v ~ Z ~ & R N O L ? K G U ~ A ~ P Y k'ESP3d ZZ f 727
Author:- (signature)
ABSTRACT
The thermoregulatory response to cold water immersion was studied in humans
exposed to compressed air, and nitrous oxide. A total of 49 healthy subjects of both
genders participated in 79 immersions in 4 different studies.
Results demonstrate that a compressed air environment of 6 atmospheres absolute
pressure (ata), corresponding to 50.4 meters of sea water, significantly increased the rate of
cooling of the body core in subjects immersed in 15•‹C water. Despite the increased rate of
cooling, subjects perceived immersion in a hyperbaric environment as thermally more
comfortable than at 1 ata. This suggests, that not only the autonomic response to cold but
also perception of thermal comfort is affected in a hyperbaric environment. It was also
shown that 100% oxygen breathing did not significantly alter the thermoregulatory response
in subjects immersed in 20•‹C water at 1 ata. Since oxygenper se did not affect the
thermoregulatory response, the increased cooling rate and improved thermal comfort at 6 ata
were attributed to the nitrogen narcosis associated with compressed air breathing.
When subjects inspired air at 1, 3, 5 ata and 30% nitrous oxide (N20) at 1 ata
while immersed in 15•‹C water, the core temperature precipitating the onset of shivering
and the perception of thermal comfort were both related to the degree of narcosis. With
an increase in narcotic potency of the breathing gas (measured as the partial pressure of
N2 and N20), a decrease in shivering threshold and an improved perception of thermal
comfort was observed. There was no change in metabolic gain, A V O ~ I A T ~ ~ , (where
A ~0~ and ATes represent the change in oxygen consumption and the change in
esophageal temperature respectively) in 3 and 5 ata air, but the gain was depressed in the
30% N20 condition.
A linear regression model based on body physique, water temperature and the
narcotic potency of the breathing gas was developed for predicting cooling rates during
diving. To identifjl the anthropometric measures which would give the best prediction of
the core cooling rate, 43 raw and derived anthropometric measures fiom 49 subjects were
subjected to regression analysis. The 4 anthropometric measures which together gave the
best prediction were: medial calf skinfold thickness, medial calf girth, acromial height and
tibia1 height. The linear regression model derived in this way was compared with a non
linear model developed using an artificial neural network (ANN) having the same input
variables. The non linear model did not perform better than the linear regression model.
Using the experimental data a regression model was also developed to predict the survival
time of nude humans during head out immersion in cold water, based on body physique
and water temperature.
DEDICATION
To my parents Milica and Dragutin SaviC,
for their love and support,
for believing in me,
and for letting me go after all my dreams.
ACKNOWLEDGEMENTS
This thesis could not have been completed without the contribution of many people in
one way or another. I want to express my sincere gratitude to all of them, but especially
to:
Drs. Jim Morrison and Ted Milner for their academic support and investing of their time
towards improvement of the quality and completion of this work; Dr. Tom Richardson
for constructive criticism and medical supervision of experiments; Gavril Morrariu and
Vic Stobbs for friendship, encouragement and help with the dives; Jon Chaney, Helen
Woo and Greg Taylor for help during the data collection; Dr. Richard Ward for doing all
kinanthropometry and helping in many other ways; Me1 Frank for endless amounts of
good music and technical support; Rob Taylor for technical support; Dr. Mike Walsh for
constructive support during hyperoxia experiments and reading the manuscript; Dr. Silia
Chadan Milner for help with pharmacology; Dr. Greg Anderson for usefbl comments and
providing me with some kinathropometry data; my other lab-mates Thanasis Passias,
Stephen Cheung, Rita Ciarnrnaichella and Jordan Nicol who have unselfishly shared their
expertise and friendship; Dr. Glen Tibbits and Shona McLean for their wisdom and
guidance, through some rough waters of graduate studies; Ministry of Science and
Technology (Slovenia) and Simon Fraser University for fhding; St. Paul Hospital for
providing me with essential experimental equipment for hyperoxia experiments.
My warmest thanks go to Klaus Kallesoe my loving companion and the best
friend; knowledgeable, joyful and always by my side; my family and close friends for
encouragement and inspiration throughout the course of my studies and especially to all
subjects who have generously given their time and energy and made this work possible.
TABLE OF CONTENTS
Approval Abstract Dedication Ackt~owledgertletlts Table of cotltettts List of tables List of figures Preface Abbreviations
INTRODUCTION
SCIENTIFIC BACKGROUND I. Thermal problems during cold water immersion
11. Thermal problems in a hyperbaric environment
Narcotic effect of a hyperbaric environment Nitrogen effect Oxygen effect Carbon &oxide effect Mechanisms and site of action of inert gas narcosis
Effect of anesthetic agents on autonomic thermoregulation
111. Models of the human thermoregulatory system Neuronal model Mathematical models
Modeling the cooling rate
IV. Summary
AIMS OF THE PRESENT STUDIES
MATERIALS AND METHODS Subjects Protocol Hyperbaric chamber Compression and decompression Personnel Rewarming procedures Core temperature measuring sites Immersions Anthropometric measurements Perception of thermal comfort Prediction of core cooling using a ionl linear artificial neural network (ANN)
1 1
i i i v
vi vii xi
xiii xix xix
vii
STUDY 1
BREATHING AIR AT 6 ATA INCREASES THE RATE OF CORE COOLING AND SUPRESSES THE PERCEPTION OF THERMAL DISCOMFORT
ABSTRACT
INTRODUCTION METHODS Protocol It~trwnentation Lbta arzalysis
RESULTS Skin tettpeerature Esopkagealtert~perahue Thertnal Comfort Vote O.ryge11 cot~sutnption
DISCUSSION
REFERENCES
TABLES AND FIGURES
APPENDIX 1 OXYGEN CONSUMPTION MEASUREMENTS IN HYPERBARIC CONDITIONS
INSTRUMENTATION Ventilation meter Meteorological balloons Oxygen aud carbon dioxide analyzers Data acquisition system
EXPERIMENTAL TEST OF METHODOLOGY Protocol Experimental setup Results
CONCLUSIONS
STUDY 11
THE THERMOREGULATORY RESPONSE OF HUMANS TO COLD WATER IMMERSION DURING HYPEROXIA
ABSTRACT
INTRODUCTION METHODS Subjects Protocol Inrtrumentation Dataacquisition Data analysis
RESULTS Skin temperature Esophagealter~lperature Inspired ventilation. carbon dioxide production and oxygen consurnption Heartrate Therrnal perception and sensation of cornfort
DISCUSSION
REFERENCES
TABLES AND FIGURES
STUDY III
THERMOREGULATORY RESPONSES TO COLD WATER IMMERSION DURING COMPRESSED AIR BREATHING AND INHALATION OF 30% NITROUS OXIDE 85
ABSTRACT 8 6
INTRODUCTION 8 7
METHODS 89 Data analysis 91
Graphical presentation of the data 92
RESULTS 93 Resting data 93 Immersion data 93
DISCUSSION 95
REFERENCES 9 9
TABLES AND FIGURES 103
APPENDIX 2 119
STUDY IV
THE PREDICTION OF BODY CORE COOLING RATE AND SURVIVAL TIME OF HUMANS IMMERSED IN COLD WATER
ABSTRACT
INTRODUCTION METHODS
Anthropometric measurements Narcotic potency Prdction of cooling rate Predxtion of survival time
Cross correlation Regression analysis Artificial neural networks
RESULTS Effect of gender and body composition on cooling rate
Correlation matrix Modeling the cooling rate based on water temperature, body composition and narcosis level
Linear regression model Results of the non-linear model with FFNN
Modeling survival time in head out immersion at 1 ata Gender differences in tolerance limits to cold water exposure
DISCUSSION
REFERENCES
TABLES AND FIGURES
GENERAL DISCUSSION
SUMMARY
CONCLUSIONS
REFERENCES
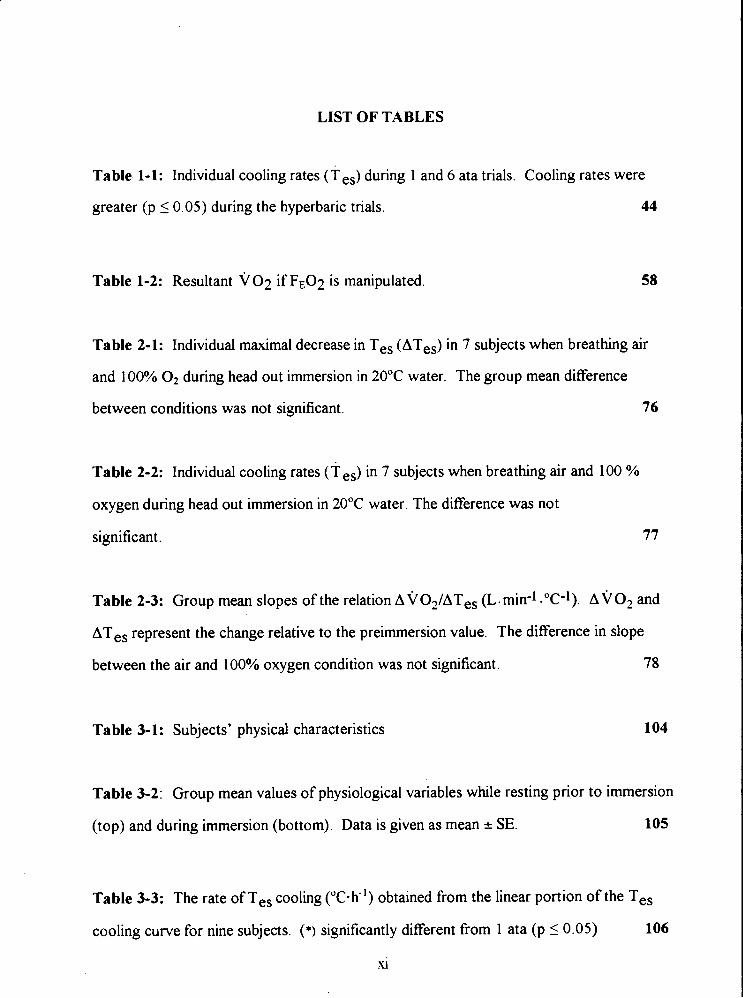
LIST OF TABLES
Table 1-1: Individual cooling rates (T es) during 1 and 6 ata trials. Cooling rates were
greater (p 10.05) during the hyperbaric trials. 44
Table 1-2: Resultant vo2 if FE02 is manipulated. 58
Table 2-1: Individual maximal decrease in Tes (ATes) in 7 subjects when breathing air
and 100% O2 during head out immersion in 20•‹C water. The group mean difference
between conditions was not significant. 76
Table 2-2: Individual cooling rates (T es) in 7 subjects when breathing air and 100 %
oxygen during head out immersion in 20•‹C water. The difference was not
significant. 77
Table 2-3: Group mean slopes of the relation A VO-JAT~, (L.min-1 ."C-1). AVO* and
ATes represent the change relative to the preimmersion value. The difference in slope
between the air and 100% oxygen condition was not significant. 78
Table 3-1: Subjects' physical characteristics 104
Table 3-2: Group mean values of physiological variables while resting prior to immersion
(top) and during immersion (bottom). Data is given as mean z SE. 105
Table 3-3: The rate of Tes cooling ("C-k') obtained from the linear portion of the Tes
cooling curve for nine subjects. (*) significantly different from 1 ata (p 5 0.05) 106
xi
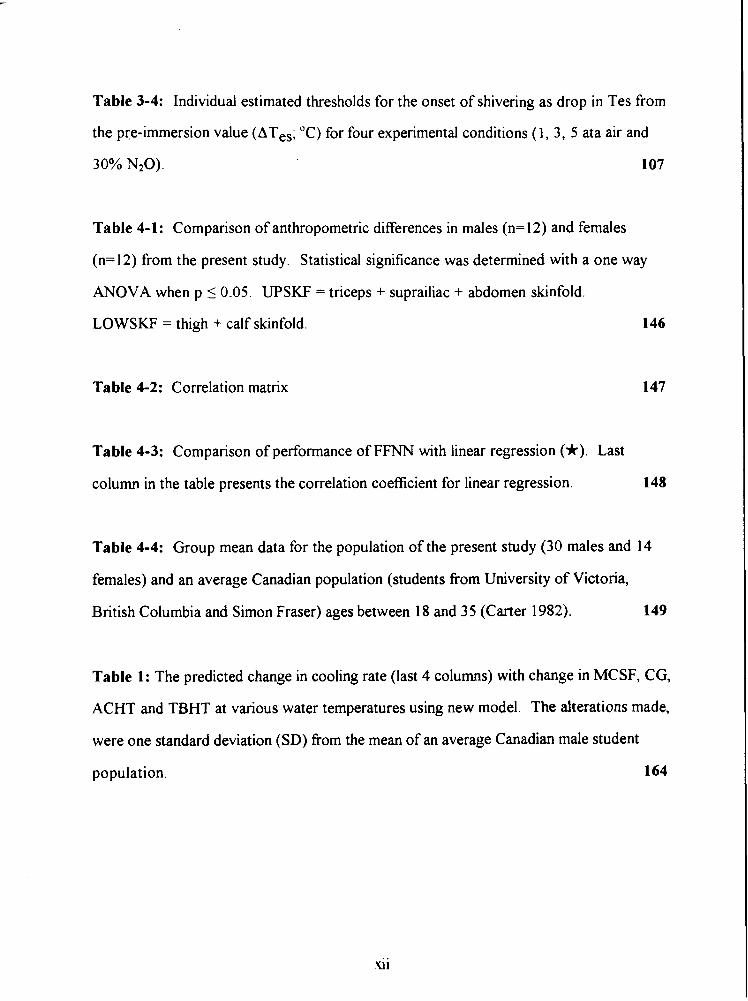
Table 3-4: Individual estimated thresholds for the onset of shivering as drop in Tes from
the pre-immersion value (ATes; "C) for four experimental conditions (1, 3, 5 ata air and
30% NzO). 107
Table 4- 1: Comparison of anthropometric differences in males (n= 12) and females
(n=12) from the present study. Statistical significance was determined with a one way
ANOVA when p L 0.05. UPSKF = triceps + suprailiac + abdomen skinfold.
LOWSKF = thigh + calf skinfold. 146
Table 4-2: Correlation matrix 147
Table 4-3: Comparison of performance of FFNN with linear regression (*). Last
column in the table presents the correlation coefficient for linear regression. 148
Table 4-4: Group mean data for the population of the present study (30 males and 14
females) and an average Canadian population (students from University of Victoria,
British Columbia and Simon Fraser) ages between 18 and 35 (Carter 1982). 149
Table 1: The predicted change in cooling rate (last 4 columns) with change in MCSF, CG,
ACHT and TBHT at various water temperatures using new model. The alterations made,
were one standard deviation (SD) from the mean of an average Canadian male student
population. 164
LIST OF FIGURES
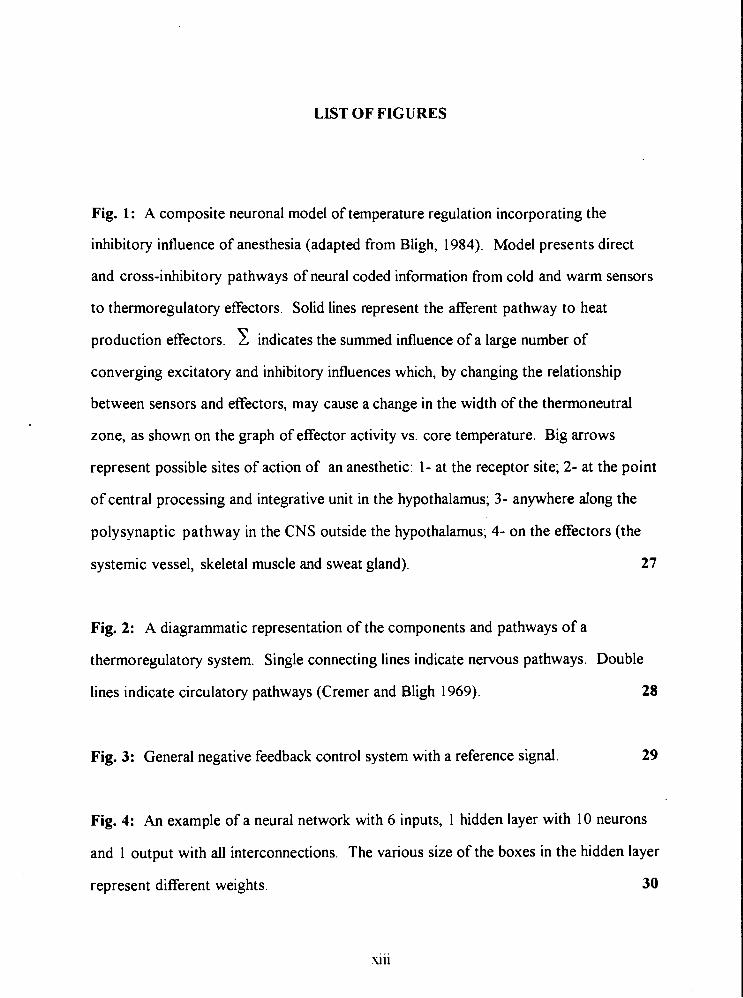
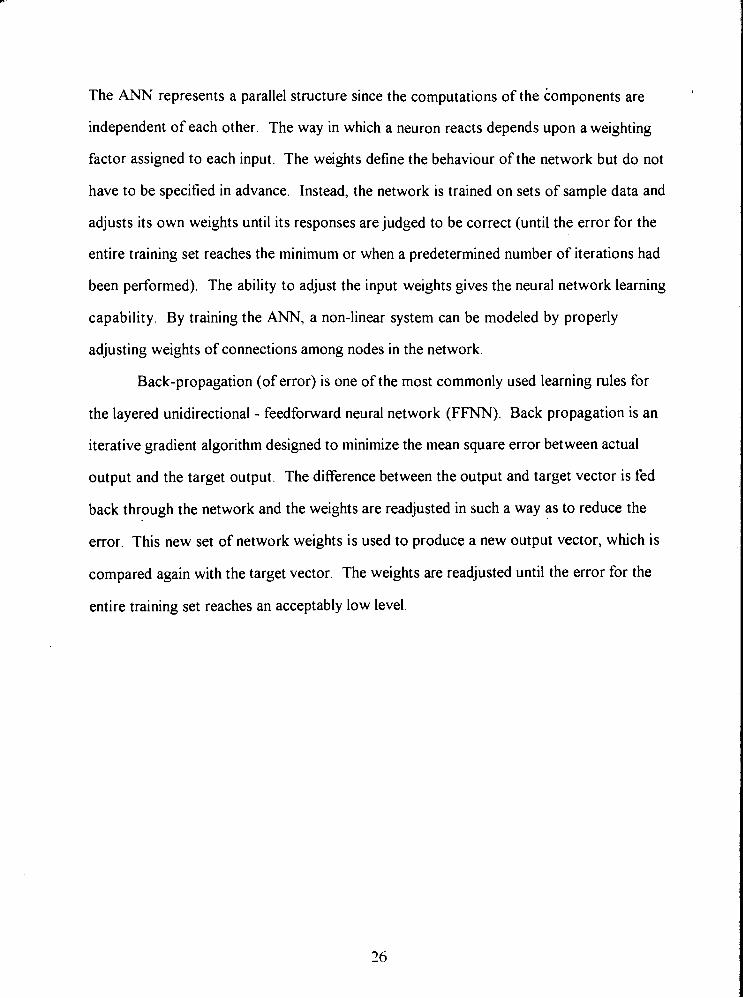
Fig. 1: A composite neuronal model of temperature regulation incorporating the
inhibitory influence of anesthesia (adapted from Bligh, 1984). Model presents direct
and cross-inhibitory pathways of neural coded information from cold and warm sensors
to thermoregulatory effectors. Solid lines represent the afferent pathway to heat
production effectors. indicates the summed influence of a large number of
converging excitatory and inhibitory influences which, by changing the relationship
between sensors and effectors, may cause a change in the width of the thennoneutral
zone, as shown on the graph of effector activity vs. core temperature. Big arrows
represent possible sites of action of an anesthetic: 1- at the receptor site; 2- at the point
of central processing and integrative unit in the hypothalamus; 3- anywhere along the
polysynaptic pathway in the CNS outside the hypothalamus; 4- on the effectors (the
systemic vessel, skeletal muscle and sweat gland). 27
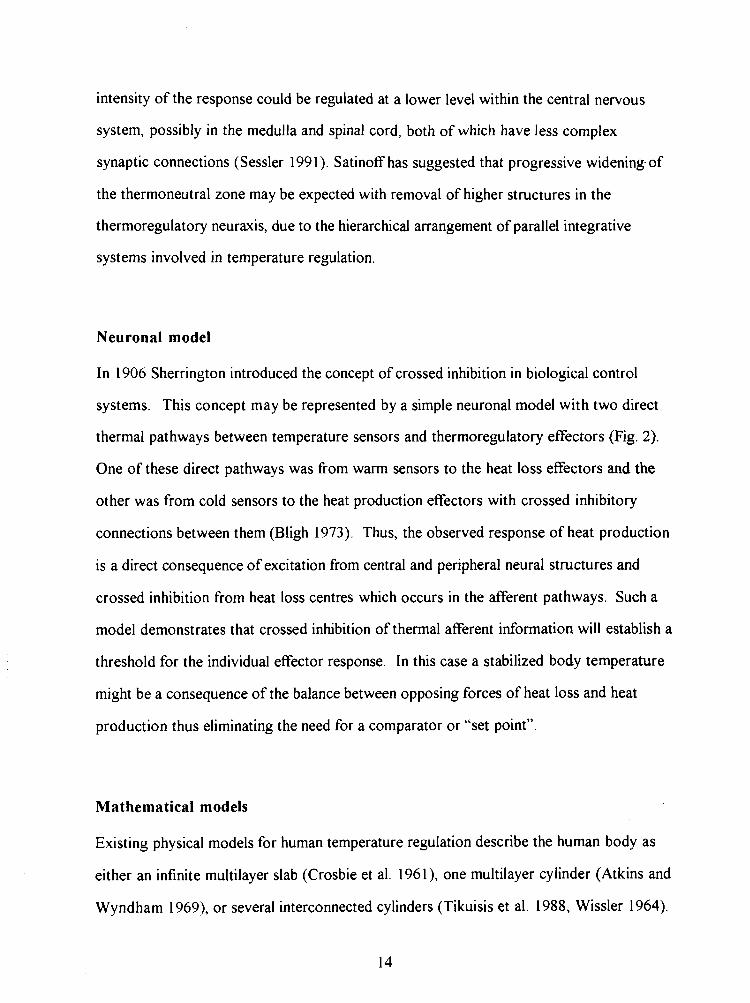
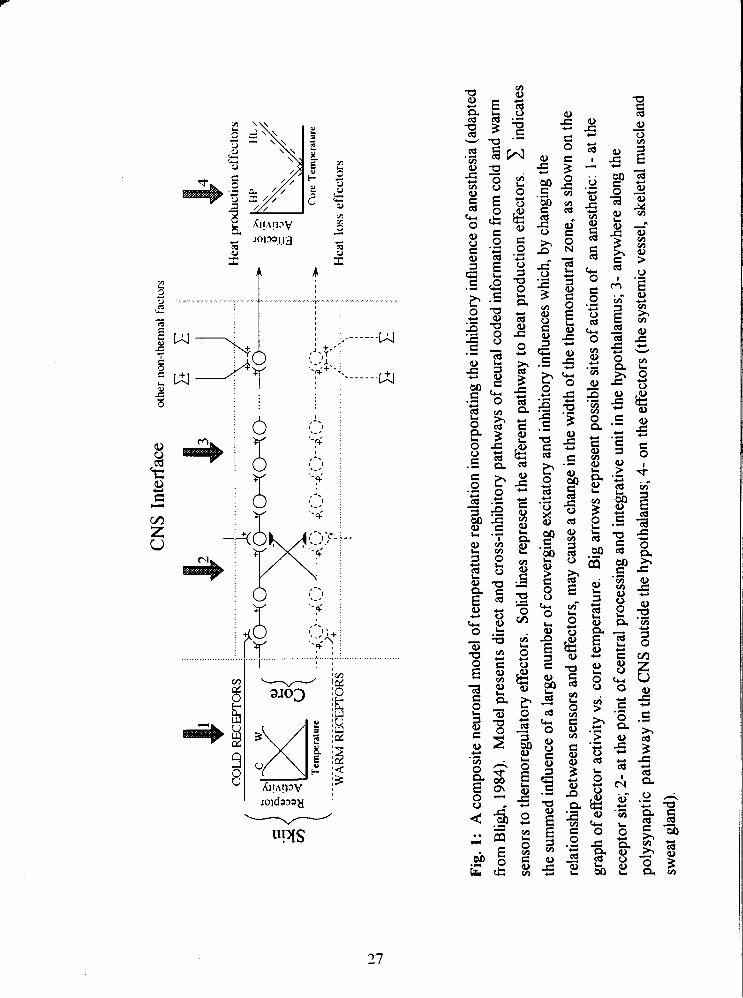
Fig. 2: A diagrammatic representation of the components and pathways of a
thermoregulatory system. Single connecting lines indicate nervous pathways. Double
lines indicate circulatory pathways (Cremer and Bligh 1969). 28
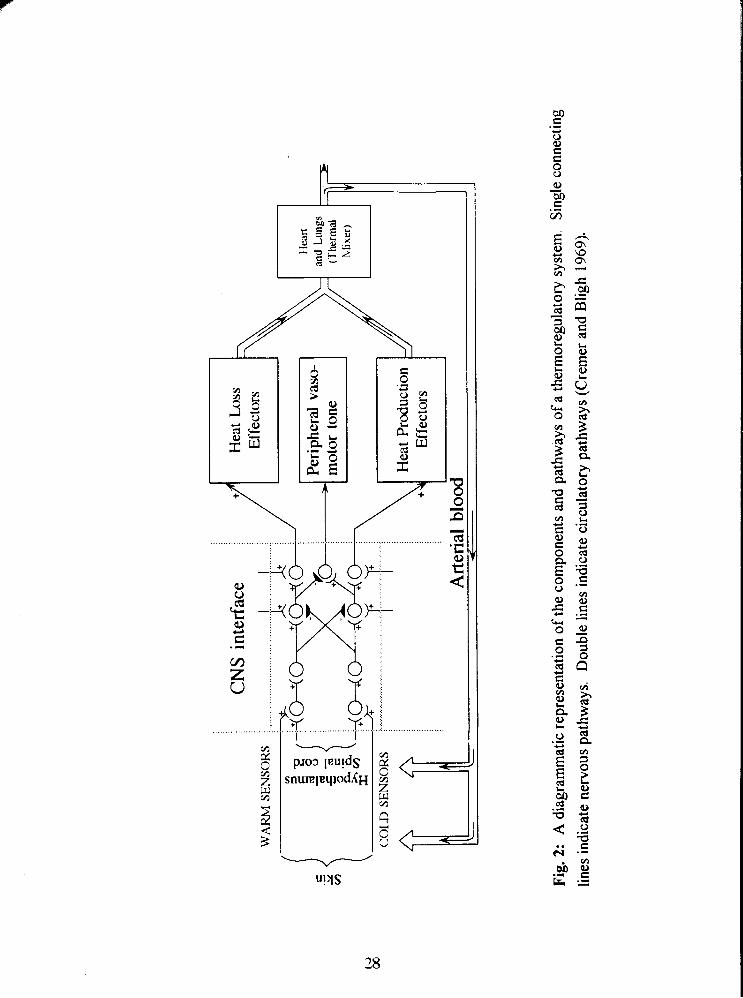
Fig. 3: General negative feedback control system with a reference signal. 29
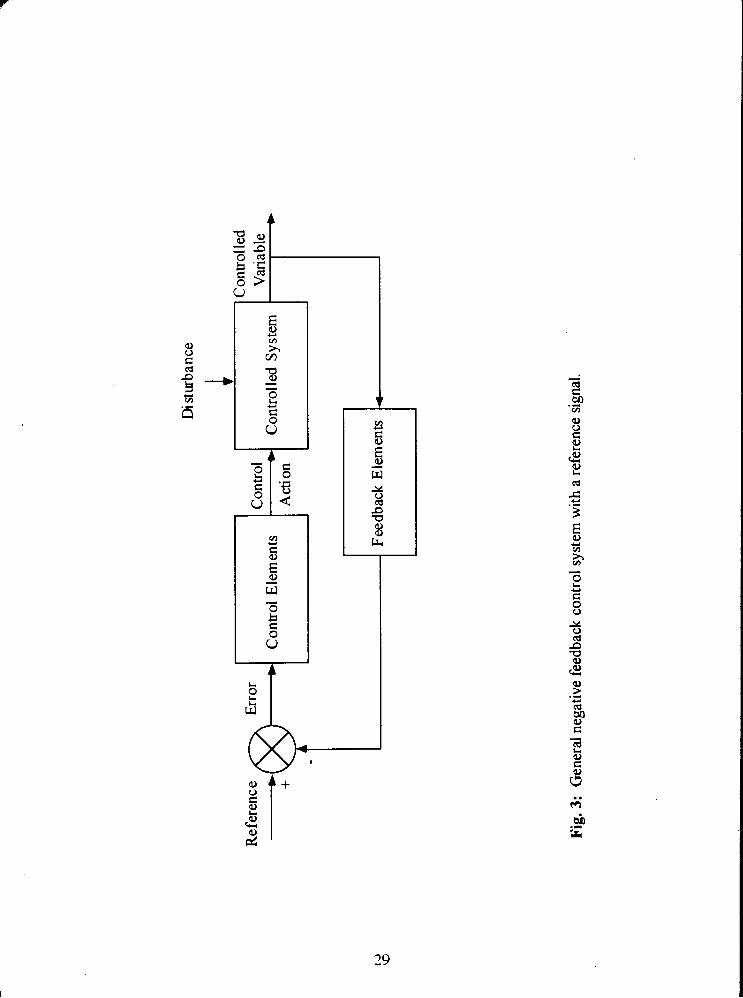
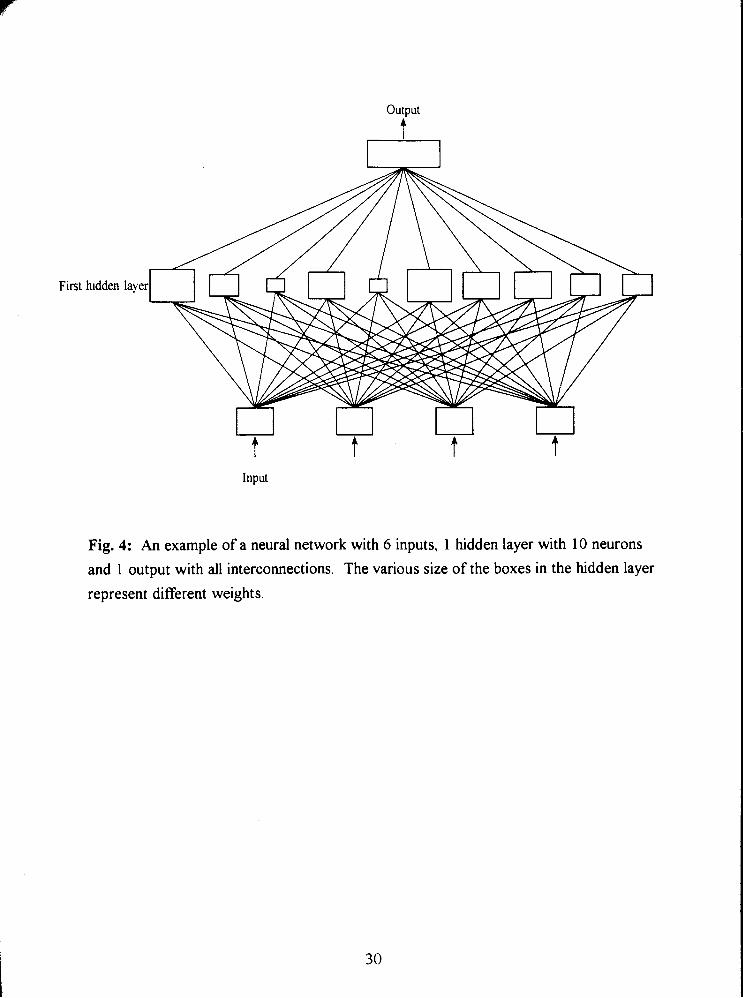
Fig. 4: An example of a neural network with 6 inputs, 1 hidden layer with 10 neurons
and 1 output with all interconnections. The various size of the boxes in the hidden layer
represent different weights. 30
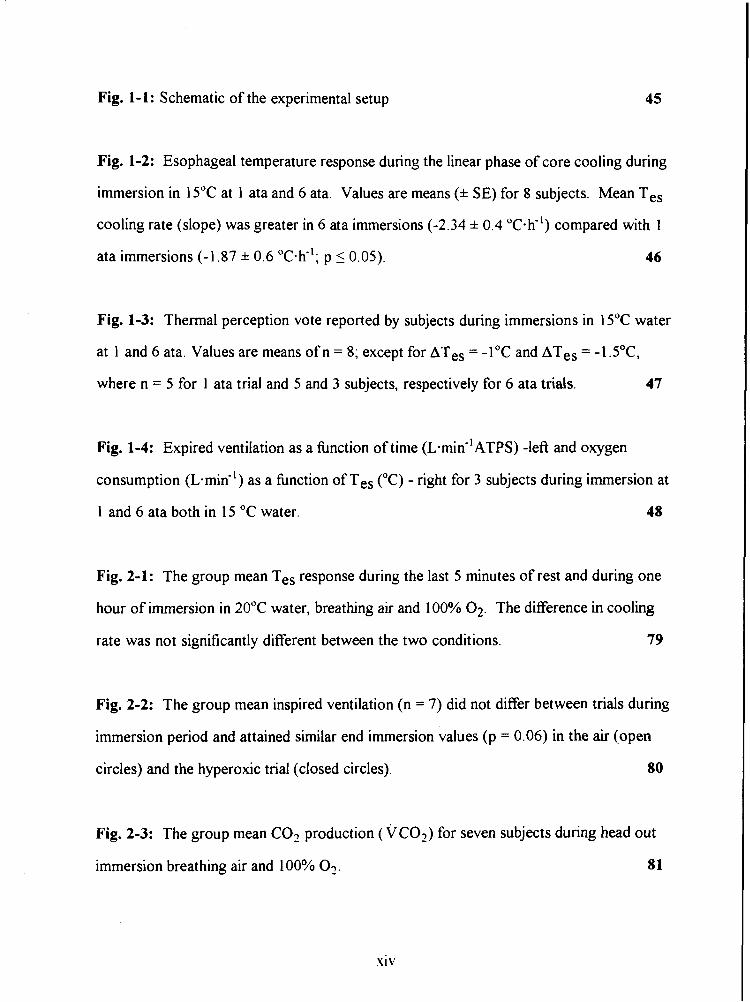
Fig. 1-1: Schematic of the experimental setup 45
Fig. 1-2: Esophageal temperature response during the linear phase of core cooling during
immersion in 15•‹C at 1 ata and 6 ata. Values are means (* SE) for 8 subjects. Mean Tes
cooling rate (slope) was greater in 6 ata immersions (-2.34 * 0.4 OC.~") compared with 1
ata immersions (-1.87 * 0.6 "c-h-'; p 5 0.05). 46
Fig. 1-3: Thermal perception vote reported by subjects during immersions in 15•‹C water
at 1 and 6 ata. Values are means of n = 8; except for ATes = -1•‹C and ATes = -lS•‹C,
where n = 5 for 1 ata trial and 5 and 3 subjects, respectively for 6 ata trials. 47
Fig. 1-4: Expired ventilation as a fbnction of time ( L . ~ ~ ~ - ' A T P S ) -left and oxygen
consumption (L-mid') as a fbnction of Tes ("C) - right for 3 subjects during immersion at
1 and 6 ata both in 15 "C water. 48
Fig. 2-1: The group mean Tes response during the last 5 minutes of rest and during one
hour of immersion in 20•‹C water, breathing air and 100% 02. The difference in cooling
rate was not significantly different between the two conditions. 79
Fig. 2-2: The group mean inspired ventilation (n = 7) did not differ between trials during
immersion period and attained similar end immersion values (p = 0.06) in the air (open
circles) and the hyperoxic trial (closed circles). 80
Fig. 2-3: The group mean C02 production (VCO?) for seven subjects during head out
immersion breathing air and 100% 03. 81
s iv
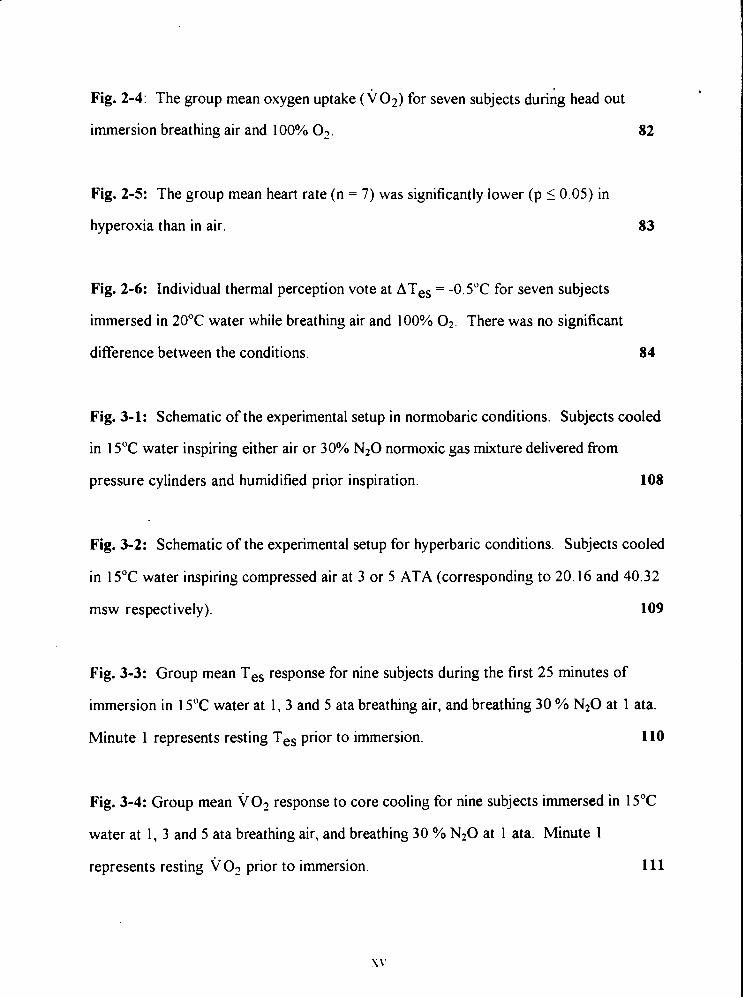
Fig. 2-4: The group mean oxygen uptake ( ~ 0 ~ ) for seven subjects during head out
immersion breathing air and 100% 02. 82
Fig. 2-5: The group mean heart rate ( n = 7) was significantly lower (p I 0.05) in
hyperoxia than in air.
Fig. 2-6: Individual thermal perception vote at ATes = -0.5"C for seven subjects
immersed in 20•‹C water while breathing air and 100% 0 2 . There was no significant
difference between the conditions. 84
Fig. 3-1: Schematic of the experimental setup in normobaric conditions. Subjects cooled
in 15•‹C water inspiring either air or 30% N20 normoxic gas mixture delivered from
pressure cylinders and humidified prior inspiration. 108
Fig. 3-2: Schematic of the experimental setup for hyperbaric conditions. Subjects cooled
in 15•‹C water inspiring compressed air at 3 or 5 ATA (corresponding to 20.16 and 40.32
msw respectively). 109
Fig. 3-3: Group mean Tes response for nine subjects during the first 25 minutes of
immersion in 15•‹C water at 1, 3 and 5 ata breathing air, and breathing 30 % N20 at 1 ata.
Minute 1 represents resting Tes prior to immersion. 110
Fig. 3-4: Group mean VO? response to core cooling for nine subjects immersed in 15•‹C
water at 1, 3 and 5 ata breathing air, and breathing 30 % N20 at 1 ata. Minute 1
represents resting v O2 prior to immersion.
Fig. 3-5: Relative change in the oxygen uptake (AVO?) from the pre-immersion value as
a hnction of relative change in Tes (ATes) from the pre-immersion value for all nine
subjects during immersion in 15•‹C water at 1, 3, 5 ata air and 0.3 atm PN20 . 112
Fig. 3-6: Relative change in the oxygen uptake (A v 0 2 ) from the pre-immersion value as
a hnction of relative change in Tes (ATes) from the pre-immersion value for five subjects
with the highest cooling during immersion in 15•‹C water at 1, 3, 5 ata air and 0.3 atrn
PN20. 113
Fig. 3-7: Mean thermal perception vote reported by subjects during immersions in 15•‹C
water at 1, 3, 5 ata air and 0.3 atrn PN20. Values are the mean of n = 9 at ATes = O•‹C,
n = 8 at -0.5"C, n = 6 at -l•‹C, n = 4 at -1.5"C and n = 3 at -2•‹C. The N20 trial was
significantly different compared with 1 ata (*), and 3 ata (9). 114
Fig. 3-8: Threshold for the onset of shivering thermogenesis (ATes; "C) vs. atmospheric
pressure. Calculated narcotic potency of 30% N20 breathing mixture (PN20 = 0.3 atm,
PN2 = 0.5 atm) is equivalent to N2 in compressed air at 9.6 ata (PN2 = 7.7 atrn). Graph
presents the mean 2 SE for 9 subject. 115
Fig. 3-9: Group mean thermal comfort vote as a hnction of atmospheric pressure.
Calculated narcotic potency of 30% N20 breathing mixture (PN20 = 0.3 atm, PN2 = 0.5
atm) is equivalent to N2 in compressed air at 9.6 ata (PN2 = 7.7 atrn). Graph presents the
mean * SE for 9 subject. 116
Fig 3-10: Linear regression applied to the relationships of threshold for shivering
(top, n = 9) and thermal comfort vote (bottom, n = 8) as a hnction of the narcotic potency
of N2 at increased atmospheric pressure. 117
Fig. 3-11: ~0~ and ATes results from Cheung (1993) with permission. 118
Fig. 3-12: Mean (+ SE) Tes response of 9 subject during first 25 min of immersion in 4
experimental conditions. 120
Fig. 3-13: Mean ( 2 SE) ~0~ response of 9 subject during first 25 min of immersion in 4
experimental conditions. 121
Fig. 3-14: Determination of cooling rate (linear portion of cooling curve, T es) and
shivering threshold (ATes) for subject 5 during immersion at 1 ata (left) and 3 ata (right).
122
Fig. 3-15: Determination of cooling rate (linear portion of cooling curve, T ,,) and
shivering threshold (ATes) for subject 5 during immersion at 5 ata (left) and at 1 ata
breathing 30% N 2 0 (right). 123
Fig 4-1: Observed cooling rate in 44 subjects (open circles) at 3 water temperatures
11.2"C, 15•‹C and 20•‹C compared with predicted (closed circles). The mean square error
(MSE) was 1.2, 0.9 and 0.7 for 11.2"C, 15•‹C and 20•‹C water temperature respectively.
For easier comparison a horizontal shift has been applied to the predicted values in order
that the data points are not superimposed. 150
xvii
Fig 4-2: The configuration of the best performing FFNN with 6 input layer neurons, 10
hidden layer neurons and one output. The size of the squares (neurons) in the hidden
layer represents the individual weights. i5l
Fig 4-3: Prediction with FFNN (open circles) and linear regression analysis (closed
circles) compared to observed cooling rates in 10 subjects. 152
Fig. 4-4: Prediction of cooling rate of inactive, lightly clothed subjects - open circles
(Hayward et a]. 1975) and for nude, inactive subjects - closed circles (Savic). Data
represent group mean values of each study. 153
Fig. 4-5: Prediction of mean survival time for inactive, lightly clothed subject according
to Hayward et al. (1975) - open circles, and for nude subjects using a new model including
anthropometric data (closed circles). The anthropometric measures used represent the
mean values of male subjects used in this study. 154
Fig. 4-6: Gender differences in tolerance limits to cold exposure. Prediction is based on
average physique determined from Canadian population of university students. 155
Fig. 5: Schematic representation of the effect of lower and higher levels of narcosis on the
thermoregulatory shivering response. With low narcotic potency ("low NP") there is no
change in the gain of shivering response, but the parallel shift to the lower threshold for
the onset of shivering is observed (PN2 up to 4 ATM; Study 111 and 10% N20; Cheung
1993). 30% N20 ("high NP") causes also a suppression of the gain of shivering
response.
PREFACE
This thesis examines the effect of compressed air, and nitrous oxide breathing on the
thermoregulatory response, and on the perception of thermal comfort of humans
immersed in cold water.
This thesis is based on the following studies, which are referred to in the text by their
Roman numeral (I-IV):
I:
II:
111:
lv:
Breathing air at 6 ata increases the rate of core cooling and suppresses the
perception of thermal discomfort in humans immersed in cold water
The thermoregulatory response of humans to cold water immersion during
hyperoxia
The thermoregulatory response of humans to cold water immersion during
compressed air breathing and inhalation of 30% nitrous oxide
The prediction of body core cooling rate and survival time of humans immersed in
cold water
ABBREVIATIONS
SSR
MSE
atm
ata
N2O ANN
CG
MCSF
ACHT
TBHT msw
sum of square residuals
mean square error
atmospheres of pressure (not a standard SI unit) 1 atm = 101.325 kPa atmospheres of absolute pressure
nitrous oxide, laughing gas
artificial neural network
medial calf girth
medial calf skinfold thickness
acromial height
tibia1 height meters of sea water (1 0.08 msw = 1 atm)
INTRODUCTION
Hypothermia during diving is usually attributed to a convective/conductive heat loss from
the body surface (Bridgman 1990, Webb 1982, 1970) and the respiratory tract (Piantadosi
et al. 1981). In divers, mild hypothermia will produce fatigue and impaired cognition and,
if it progresses into severe hypothermia, may ultimately result in death (Keatinge et al.
1980). In a high heat loss environment, such as a hyperbaric environment, an appropriate
behavioral response, which relies on a subject's perception of thermal comfort (Fanger
1970), is essential for maintaining thermal balance. Padbury et al. (1987) observed that a
diver conducting a simulated wet dive in a hyperbaric chamber was unaware of his falling
body temperature and thus did not elevate the temperature of his breathing gas or exhibit
any thermogenic response. Though this "silent" hypothermia has been suggested to be a
consequence of the slow nature of core cooling and the inability of the core sensors to
detect the slow cooling of the core (White et al. 1980, Hayward and Keatinge 1979), there
is a paucity of data regarding the possible inhibition of the autonomic nervous system
response, normally activated to maintain thermal stability of the core region.
Clinical studies indicate that volatile anesthetics produce a thermoregulatory
inhibition in humans by decreasing the core temperature threshold for vasoconstriction
and for shivering and thus affect a subject's ability to initiate an effective countermeasure
which would prevent a progression to hypothermia (Giesbrecht 1994, Lopez et al. 1994,
Vassilieff et al. 1994, Kurz et ai. 1993, Sessler 1991, Hammel 1988). A similar
observation of shivering suppression produced by a sub-anesthetic level of nitrous oxide
in cold, immersed subjects has been made by other investigators (Cheung 1993, Mekjavic
and Sundberg 1992, Passias et al. 1992).
In view of the above evidence, it is hypothesized that hypothermia among
compressed air divers involves more rapid core cooling rates, attenuated heat production

and altered perception of thermal comfort due to inhibition by elevated partial pressure of
nitrogen.
SCIENTIFIC BACKGROUND
I. Thermal problems during'cold water immersion
Clinical hypothermia is defined as a body core temperature, measured rectally, below
3 5•‹C. An individual with a core temperature of 32•‹C to 3 5•‹C may be considered mildly
hypothermic, with a core temperature of 28•‹C - 32•‹C moderately hypothermic and with a
core temperature less than 28•‹C severely hypothermic (Ferguson et al. 1983). However,
the chilling of the body depends on many circumstances: initial body thermal state, body
shape, wet or dry conditions and whether the individual is protected or unprotected.
Therefore any drop of temperature below the temperature which is considered normal for
the particular situation and body state should be taken seriously.
There are four distinct modes of heat transmission which are recognized in the
study of heat transfer in human physiology: conduction, convection, radiation and
evaporation. Heat loss by convection from the body surface is a major pathway in
normal air environments, and respiratory heat loss is usually no more than about 10% of
metabolic heat production, even in very cold air. During head out water immersion, heat
loss through the skin represents the major heat drain, enhanced by water movement,
whereas radiant and evaporative heat loses are negligible.
Cold water exposure immediately increases the rate of heat loss from the skin,
which causes a decrease in skin temperature. The physiological response to this is
vasoconstriction of the cutaneous blood vessels, which causes the skin temperature to fall
even faster, because it is no longer being warmed from within (Webb 1993). Peripheral
vasoconstriction is not uniform and has been reported to be more pronounced in the
extremities, than in the trunk and head region (Schvartz 1970, Numeley et al. 1971).
Besides vasoconstriction, which is mediated by sympathetic nerves releasing
norepinephrine, there is also a direct effect of cold on the superficial blood vessels. The
result is conservation of heat as the result of smaller temperature gradient between the
skin and water, reducing the heat flow (Ozaki et al. 1994, Sessler et al. 1990a). This is an
important physiological response to cold exposure, presumably, because preserving heat
is more efficient than generating it. Concomitantly, heat from the deep body tissues
continues to pass by direct conduction towards the surface, aided by circulation from the
deeper structures. In resting humans, the cooled shell becomes larger and larger and the
relatively warm and stable core becomes smaller and smaller. A further response is an
increase in metabolic heat production and an increase in muscle tension, which is soon
detected as visible shivering. Shivering is believed to occur when maximal
vasoconstriction and behavioral actions are insufficient to maintain thermal balance. If
heat conservation through vasoconstriction and increased heat production from shivering
are not sufficient to produce a thermal balance, the end result is a drop in core
temperature, leading to hypotherrnia (Webb 1982, Bligh 1973, Hemingway 1963).
The initial hyperventilation at the onset of immersion is accompanied by a two- to
three-fold increase in metabolic rate which declines to the resting value after one to three
minutes (Martin and Cooper 1981, Cooper et al. 1976). This response is more marked at
a lower water temperature (Cooper et al. 1976) and is attributed to the cold peripheral
stimulus only, since no change in the core temperature is simultaneously observed. After
this initial response, metabolic rate increases again, as core temperature begins to fall.
Shivering is controlled by the sympathetic nervous system, as the descending tract of the
shivering pathway originating from the posterior hypothalamus becomes activated.
When peripheral cooling is caused by cold water immersion, peripheral
vasoconstriction is accompanied by an elevation in heart rate, together with elevation in
arterial and venous blood pressure. The initial increase in the heart rate is followed by a
decrease to a level slightly above the resting value. With the onset of shivering and
increased need of oxygen by the muscles, the heart rate increases again. There is also a
shift in blood volume from the periphery to the thorax, due to hydrostatic forces, causing
4
an increase of hyperosmolar fluid in the intravascular space (Khosla and DuBois 198 1,
1979). This shift of blood from peripheral to central circulation is detected by low
pressure receptors which initiate a reflex that suppresses vasomotor tone in the
extremities and kidneys. Therefore, a hydrostatic expansion of the central blood volume
tends to counteract the increased vascular resistance caused by the release of
norepinephrine in response to stimulation of cutaneous cold receptors.
11. Thermal problems in a hyperbaric environment
During diving, the inspired gas becomes denser as pressure increases resulting in higher
heat capacity and higher thermal conductivity, due to humidification and warming of the
dry compressed gas obtained from a cylinder, which eventually becomes similar in
temperature to the surrounding cold water (Webb 1970, Raymond et al. 1968).
Respiratory heat loss increases many times during deep diving, where a helium-rich gas is
breathed because of its high thermal coefficient (Piantadosi et al. 198 1). However, during
diving with compressed air the major heat loss is convective/conductive heat loss from the
body's surface to the cold water (Webb 1982).
Narcotic effect of a hyperbaric environment
Breathing air at greatly increased ambient pressure results in signs and symptoms of
narcosis such as euphoria, conhsion, neuromuscular incoordination, and impaired
performance (Adolfson 1965, Behnke et al. 1935). The extent of the narcosis at a given
pressure is dependent on the relationship between the alveolar PC02, PO2 and PN2. In
particular any increase in C02 level will potentiate narcosis (Hesser et al. 1978), as will
increase in the PO2 of the breathing mixture. Thus, at constant PN2 an increase in PO2
will produce greater narcosis and more impaired performance (Frankenhaiuser et al. 1963).
Most of the studies have focused on the effect of narcosis on complex behavior such as
cognitive processes, reaction time and dexterity and they were often performed at higher
pressures than those used in compressed air diving (Abraini and Joulia 1992, Fowler et al.
1985).
Opinions differ regarding the causes and mechanisms of this narcosis. It has been
suggested that the narcosis may be the result of pressure per se (Shilling 1937), the raised
partial pressure of oxygen (Damant 1930, Bennett and Ackles 1969) or a raised C02
tension in the tissues due to hypoventilation and impaired C02 elimination (Bean 1950).
However, most investigators consider the raised partial pressure of nitrogen and its
affinity for lipid to be the principal cause (Bennett and Blenkarn 1974, Case and Haldane
194 1, Behnke et al. 193 5) on the basis of the Meyer-Overton hypothesis (Meyer 1899).
Nitrogen effect
In 1935, Behnke and coworkers attributed compressed air narcosis to the raised partial
pressure of nitrogen. They characterized the narcosis as "euphoria, retardment of the
higher mental processes and impaired neuromuscular coordination". Signs and symptoms
begin to be noticed at about 30 meters of sea water (msw) and become increasingly more
severe the greater the depth (Bennett 1993). Currently, the following are recognized as
symptoms of nitrogen narcosis and are similar to those induced in anesthesia and hypoxia
in aviators: slowing of mental activity, delay in auditory and olfactory stimuli, impairment
of memory, change in sense of time, impaired ability to carry out fine movements, and at
depths greater than 300 feet, possible loss of consciousness (Bennett 1993). The
contribution of N2 to the observed narcosis is demonstrated by the elimination of the
signs and symptoms of narcosis, when nitrogen is substituted with helium (Behnke and
Yarbourgh 1939) or hydrogen (Brauer et al. 1966).
6
Oxygen effect
Any compressed air environments is hyperoxic, such that breathing air at 5 ata (40.32
msw) is similar to breathing 100% 0 2 at 1 ata (0 msw). The effects of hyperbaric oxygen
at increased pressures have been recognized primarily as toxic rather than narcotic and
may lead to convulsions or pulmonary damage. Indications of its narcotic properties have
been based mainly on studies of isolated tissue or small animals (Perot and Stein 1959),
which report an effect of PO2 on transmission and a reversible block of action potential
conduction at a high oxygen pressure (13 atm). Study of auditory responses in the brain
of humans breathing hyperbaric oxygen in Heliox (He - 02) mixtures at pressures not
sufficient to produce convulsions, showed depression of auditory responses without
affecting mental performance (Bennett and Ackles 1969). Since helium does not have
narcotic properties, this decrement was attributed to oxygen. It was also demonstrated
that oxygen and nitrogen have a synergistic interaction at elevated pressures, evidenced by
deterioration of psychomotor performance (Hesser 1978, Bennett and Ackles 1969,
Bennett 1965, Frankenhauser 1963, Damant 1930).
Carbon dioxide effect
One theory infers that due to the increased density of the breathing gas, there is
respiratory insufficiency leading to carbon dioxide retention, and this increased carbon
dioxide tension is the cause of narcosis (Bennett 1965, Diji 1959, Bean 1950). Other
researchers, however, suggest that the combined effects of high partial pressures of C02
and N2 are additive and much more severe than those of either alone (Hesser et al. 1971,
Case and Haldane 1941). Hesser et al. ( 197 1 ) have shown that carbon dioxide is not the
cause of compressed air narcosis at alveolar C02 tensions below 40 mmHg. Lun (1992)
has also demonstrated that an isolated increase in PC02 in the breathing mixture under
normobaric conditions has no demonstrable effect on the shivering response or cooling
rate in cold immersed subjects. .
Mechanisms and site of action of inert gas narcosis
Inert gases are defined as gases which exert their biological effect without undergoing any
change in their own chemical structure or chemically modifjing the biological system they
are acting upon. Such gases are nitrous oxide, ethylene and cyclopropane as well as
nitrogen, helium, neon, argon, krypton and xenon (Featherstone and Muehlbaecher 1963).
Although several of those gases are anesthetic at less than 1 ata, all except helium and
neon have been shown to produce "narcosis" at elevated pressure. Definition of the terms
"narcosis" and "anesthesia" is not easy and as cited in (Featherstone and Muehlbaecher
1963) ".. . vagueness and multiplicity of meanings are so firmly established in the usage of
'narcotic' and 'anesthetic' as to render htile any insistence on rigid definitions, even for
technical purposes." It would seem that such insistence belongs to the sphere of
semantics. In this thesis, the terms narcosis and anesthesia are both used and, in most
cases, the term used is that preferred by the author whose paper is reviewed.
The anesthetics used in clinical practice such as nitrous oxide, ethylene and
cyclopropane are considered inert (Featherstone and Muehlbaecher 1963), and seem
unlikely to have a different mechanism of action from N2 (Carpenter 1954). However, the
concentration of those anesthetics, used clinically, far exceeds the narcotic potency
produced by the partial pressures of gases experienced in compressed air diving.
The site and mode of action of narcosis with N20 may be quite distinct from that
of hyperbaric N2 and thus, studies examining the effect of anesthesia on autonomic
hnction in humans may not be applicable to compressed air diving. Nevertheless,
comparative behavioral studies using nitrous oxide and hyperbaric air have shown that
30% N20 in a normoxic air mixture induces psycho-motor impairment similar to
compressed air at 6.7 ata (Biersner 1987, Biersner et al. 1977). Also Fowler et al. (1980)
and Biersner (1972) have demonstrated that N20 and hyperbaric N2 exert an identical '
narcotic effect on memory, auditory perception and other fhctions involved in skilled
performance.
Due to the unreactivity of inert gases, biophysical, rather than biochemical
mechanisms of inert gas narcosis have been studied. According to the Meyer-Overton
hypothesis (Meyer 1899) the narcotic potency of nitrogen is related to its affinity for
lipid or fat. It was suggested that narcosis is most probably due to the penetration of the
cell membrane by the anesthetic substance. This led to the more recent theories of the
'critical volume hypothesis' (Miller et al. 1973) and the 'multisite expansion hypothesis'
(Halsey et al. 1978) proposing that anesthesia is due to the expansion of a hydrophobic
region beyond a certain critical volume, as a result of the absorption of the anesthetic
substance. This theory also provides an explanation for the pressure reversal theory,
which states that an increased pressure can reverse the signs and symptoms of narcosis.
Thus, Lever et al. (1 97 1) hypothesized that 0.4 % expansion of a neuronal membrane
could cause narcosis and conversely a 0.4 % contraction of the membrane due to pressure
alone could result in the effects described as HPNS (high pressure nervous syndrome).
Others suggest that general anesthetics work by binding directly to a protein (which may
or may not be membrane bound) and inhibit its normal fbnction, by interfering with its
catalytic or transport hnction or by competing for the binding with a neurotransmitter
(Franks and Lieb 1982). Bennett et al. ( 1 967) suggested an increased membrane
permeability to cations (Na' and K') as the primary cause of anesthesia.
Carpenter (1954) has shown that N20 at 12-13 ata caused decreased excitability,
blocked conduction and produced a significant depolarization of isolated rat peripheral
nerve. In contrast to Carpenter's findings, Jong and Nace (1967) have suggested that
inhalation of an anesthetic has no significant effect on peripheral nerve conduction or the
9
generation of impulses in cutaneous receptors when an anesthetic is used in clinical
concentrations much lower than the concentrations used in Carpenter's study.
These results suggest that anesthetics, similar to the inert gases inhaled at high
pressures, most likely act at the synaptic junction, affecting the synaptic transmission
within the nervous system. A sensory nerve impulse reaches the cortex either by a direct
quick pathway (medial lemniscus, anterolateral system) or by a more central
polysynaptic route via the reticular formation. The possibility of N 2 0 acting centrally is
supported by Davis et al. (1957) who showed that by stimulating the nerve of an adult
anesthetized cat, the evoked response, produced through the polysynaptic reticular
system, was depressed to a greater degree by an anesthetic than a response transmitted
through the medial lemniscal pathway. Thus, the more synapses involved in a particular
pathway, the greater will be the distortion of the information and consequently the
elicited response (Eger 1974, pages 48 - 50).
Effect of anesthetic agents on autonomic thermoregulation
It has been shown that anesthetic agents in general, and N 2 0 in particular, inhibit the
t hermoregulatory response in animals (Hammel 1988) and humans (Giesbrecht 1994,
Lopez et al. 1994, Vassilieff et al. 1994, Kurz et al. 1993, Cheung 1993, Mekjavic and
Sundberg 1992, Passias et al. 1992, Sessler 199, Sessler et al. 1988 a, b). Passias et al.
(1992) and Mekjavic and Sundberg (1992) immersed subjects in 15•‹C and 28•‹C cold
water respectively, breathing air and a 30% N 2 0 gas mixture. The attenuation of
shivering thermogenesis was indicated by depression of oxygen uptake by 40% and a shift
in the threshold for the onset of shivering towards a lower core temperature.
N 2 0 may increase the sympathetic outflow from the brain and inhibit removal of
norepinephrine by the lung. In intact humans and animals this sympathetic stimulation,
coupled with a mild capacity to produce direct depression, results in comparatively little
cardiovascular depression at both analgesic and anesthetic (1- 1.5 atm) partial pressures.
The absence of a marked depression of myocardial contractility and blood pressure
distinguishes nitrous oxide from other more potent inhaled anesthetics.
Adding N2O to a more potent anesthetic may reduce circulation, perhaps because
narcotics block the sympathomimetic effects of nitrous oxide. Nitrous oxide may depress
the heart directly while indirectly stimulating the heart by central activation of the brain
nuclei that control beta - adrenergic activity (Fukunaga and Epstein 1973). Sympathetic
stimulation also may result because N20 inhibits the uptake of norepinephrine by the
lung (Naito and Gillis 1973). Therefore, more of the norepinephrine released into the
venous circulation will be available to act on the systemic circulation, causing
vasoconstriction.
Although the evidence for and the importance of non shivering thermogenesis in
adults remains scarce and inconclusive, the findings of Jessen et al. (1980) seem to
support its existence in humans. An increase in oxygen uptake in curarized subjects
exposed to cold observed by Jessen et al. (1980) was attributed to non shivering
thermogenesis. Stjernstrom et al. 1985 showed that the catecholamines concentration in
blood, which is correlated with shivering thermogenesis Jessen et al. (1980), was increased
post operatively compared with the concentration during anesthesia, for the same core
temperature. The increase of the catecholamine concentration during the post operative
stage was concomitant with a 40% rise in oxygen uptake which probably reflected the
thermogenic effect of the catecholamines. Since the authors did not comment on shivering
during the post operative stage, a conclusion regarding the effect of anesthetics on
catecholamine secretion and on the non shivering thermogenesis can not be drawn.
Attenuation of nonshivering thermogenesis in humans during anesthesia have been also
observed by Hynson et al. (1993) and Ohlson et al. (1994).
The fact that an anesthetic agent acts primarily on the synaptic connection
suggests that higher centres would be impaired first due to their polysynaptic pathways
11
(Eger 1974) and the regulation of body temperature would be assumed by lower centres,
which do not have the capability for fine, narrow band regulation because of their simpler
neural arrangement (Satinoff 1978).
The effects of N2 narcosis during compressed air breathing or inhalation of N20,
could be mediated by the thermoreceptors, by the thermoregulatory centres in the CNS,
by lower extrahypothalamic centres, by the polysynaptic pathway from the
thermosensors to the thermoregulatory effectors or by the effectors itself, and could be
expressed as an overall depression of neuronal conduction and synaptic activity (Fig. 1).
Besides the imposed cold thermal stress, there are other 'non thermal' factors that
can affect the heat production pathway. Anesthesia has been discussed in detail. Other
factors which are known to suppress shivering include: drugs (such as anti-pyretics),
alcohol (Fowler et al. 1987), hypoglycemia (Passias 1993, Gale et al. 198 1 ), isometric
muscular contractions (Martin and Cooper 198 l), increasing the intensity of exercise
during shivering (Hong and Nadel 1979) and repeated exposure to cold (Rochelle and
Horvath 1978).
111. Models of the human thermoregulatory system
Humans regulate temperature by comparing the afferent thermal input from the periphery
i.e. skin surface, deep abdominal and thoracic tissues, and from regions of the central
nervous system, i.e. the hypothalamus and spinal cord, with threshold values (analogous
to a "set point" in an engineering control system). When an integrated thermal input
exceeds the warm response threshold sweating and active capillary vasodilation are
initiated in an effort to prevent firther hyperthermia. Similarly, a body temperature
lower than the cold response threshold triggers vasoconstriction, non shivering
thermogenesis, and shivering, which act together to minimize hrther hypothermia. The
rate at which the intensity of response increases as body temperature deviates
progressively from the triggering threshold is the thermosensitivity (analogous to the
"gain" in an engineering system). At some point each response reaches its maximum and
firther deviation from the threshold temperature produces no increase in response
intensity. The difference between the lowest warm and the highest cold threshold
temperatures is the itlter threshold range, typically 0.4"C (Sessler 1991). A
thermoregulatory response does not occur within this range, although humans can detect a
temperature change as small as 0.03"C.
Two approaches to modeling are possible. One consists of writing theoretical
equations for the physiological processes of temperature regulation. The other approach
is the empirical one, deriving a cause-effect relationship from experimental data, because
the actual phenomena are not well understood. Alternatively a combination of these two
approaches may be attempted. Neural phenomena are generally modeled by the empirical
approach, but often there is not enough satisfactory experimental data for such modeling.
For example, some data are available about the transfer characteristics of sensory neural
receptors, but a model cannot yet be developed with the confidence that it will explain an
observed phenomenon. Detailed knowledge and data about afferent pathways to CNS
nuclei are even scarcer, and in general CNS integrative sites are represented by a "black
box" in cybernetic systems. More experimental data are available about efferent signals
from the CNS to sites such as muscles and glands, but there is still insufficient
biophysical knowledge for a priori modeling.
Whereas most thermal models incorporate a single integrator, Satinoff (1978)
proposed a hierarchical organization of thermoregulatory control, with multiple inputs
and outputs, which developed a progressively more effective, complex and finer control
during the course of evolution with the highest centre located in the hypothalamus. The
hypothalamus is mainly described as responsible for regulating the threshold for the
initiation of the thermoregulatory response, while thermosensitivity and maximal
13
intensity of the response could be regulated at a lower level within the central nervous
system, possibly in the medulla and spinal cord, both of which have less complex
synaptic connections (Sessler 1991). Satinoff has suggested that progressive widening of
the thermoneutral zone may be expected with removal of higher structures in the
thermoregulatory neuraxis, due to the hierarchical arrangement of parallel integrative
systems involved in temperature regulation.
Neuronal model
In 1906 Sherrington introduced the concept of crossed inhibition in biological control
systems. This concept may be represented by a simple neuronal model with two direct
thermal pathways between temperature sensors and thermoregulatory effectors (Fig. 2).
One of these direct pathways was from warm sensors to the heat loss effectors and the
other was from cold sensors to the heat production effectors with crossed inhibitory
connections between them (Bligh 1973). Thus, the observed response of heat production
is a direct consequence of excitation from central and peripheral neural structures and
crossed inhibition from heat loss centres which occurs in the afferent pathways. Such a
model demonstrates that crossed inhibition of thermal afferent information will establish a
threshold for the individual effector response. In this case a stabilized body temperature
might be a consequence of the balance between opposing forces of heat loss and heat
production thus eliminating the need for a comparator or "set point".
Mathematical models
Existing physical models for human temperature regulation describe the human body as
either an infinite multilayer slab (Crosbie et al. 1961), one multilayer cylinder (Atkins and
Wyndham 19691, or several interconnected cylinders (Tikuisis et al. 1988, Wissler 1964).
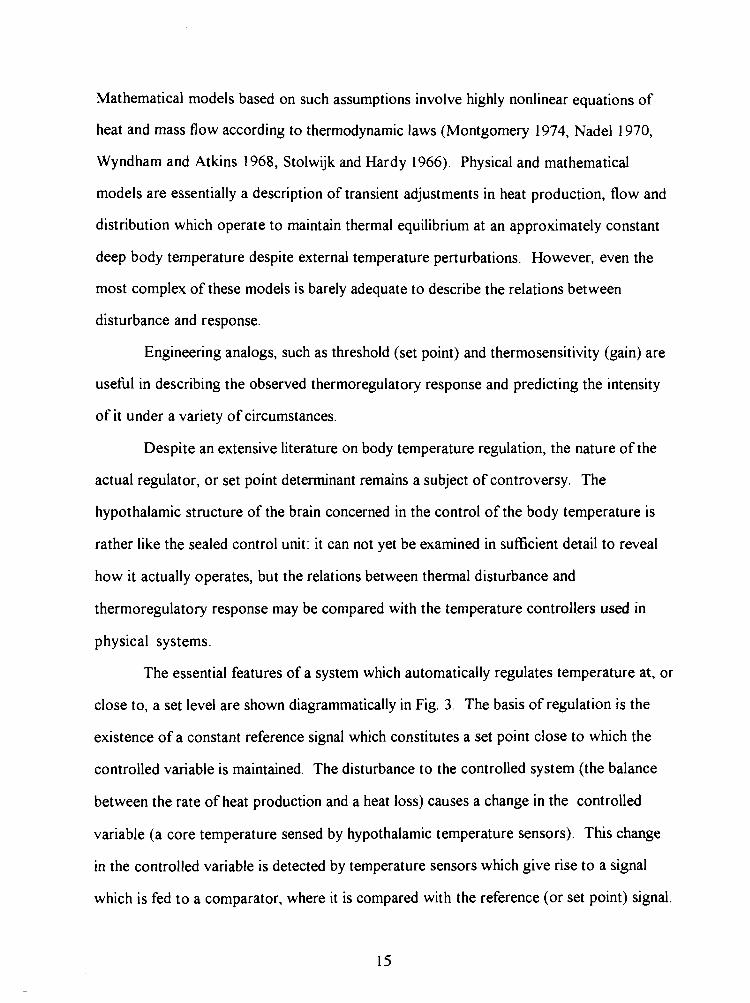
Mathematical models based on such assumptions involve highly nonlinear equations of
heat and mass flow according to thermodynamic laws (Montgomery 1974, Nadel 1970,
Wyndham and Atkins 1968, Stolwijk and Hardy 1966). Physical and mathematical
models are essentially a description of transient adjustments in heat production, flow and
distribution which operate to maintain thermal equilibrium at an approximately constant
deep body temperature despite external temperature perturbations. However, even the
most complex of these models is barely adequate to describe the relations between
disturbance and response.
Engineering analogs, such as threshold (set point) and thermosensitivity (gain) are
usefbl in describing the observed thermoregulatory response and predicting the intensity
of it under a variety of circumstances.
Despite an extensive literature on body temperature regulation, the nature of the
actual regulator, or set point determinant remains a subject of controversy. The
hypothalamic structure of the brain concerned in the control of the body temperature is
rather like the sealed control unit: it can not yet be examined in sufficient detail to reveal
how it actually operates, but the relations between thermal disturbance and
thermoregulatory response may be compared with the temperature controllers used in
physical systems.
The essential features of a system which automatically regulates temperature at, or
close to, a set level are shown diagrammatically in Fig. 3. The basis of regulation is the
existence of a constant reference signal which constitutes a set point close to which the
controlled variable is maintained. The disturbance to the controlled system (the balance
between the rate of heat production and a heat loss) causes a change in the controlled
variable (a core temperature sensed by hypothalamic temperature sensors). This change
in the controlled variable is detected by temperature sensors which give rise to a signal
which is fed to a comparator, where it is compared with the reference (or set point) signal.
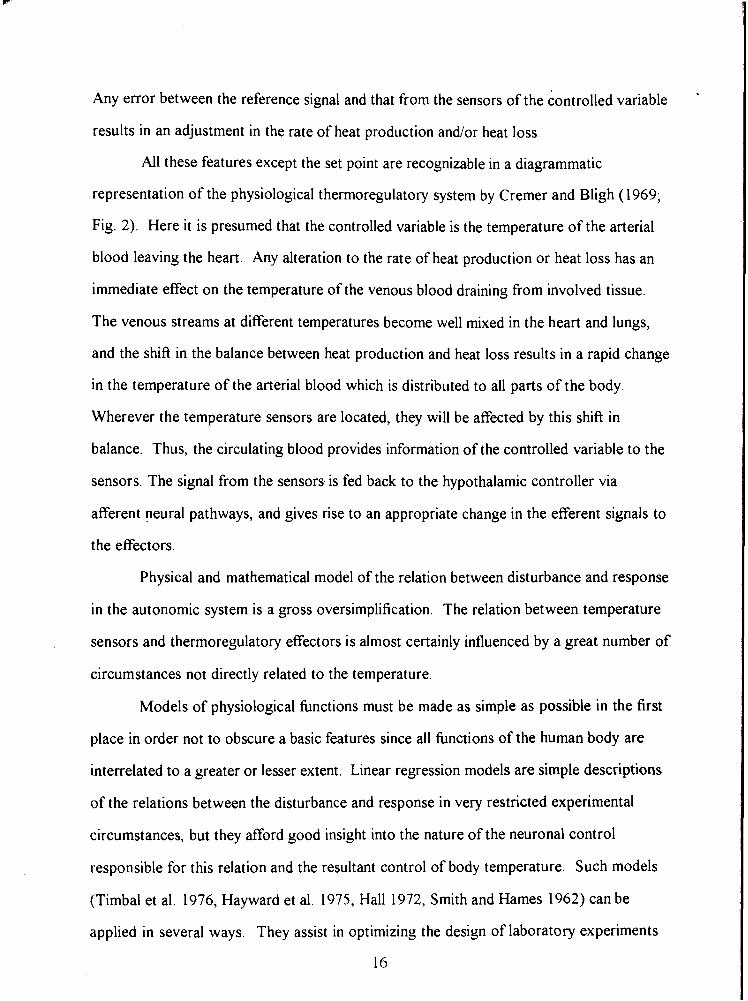
Any error between the reference signal and that from the sensors of the controlled variable
results in an adjustment in the rate of heat production and/or heat loss
All these features except the set point are recognizable in a diagrammatic
representation of the physiological thermoregulatory system by Cremer and Bligh (1969;
Fig. 2). Here it is presumed that the controlled variable is the temperature of the arterial
blood leaving the heart. Any alteration to the rate of heat production or heat loss has an
immediate effect on the temperature of the venous blood draining from involved tissue.
The venous streams at different temperatures become well mixed in the heart and lungs,
and the shift in the balance between heat production and heat loss results in a rapid change
in the temperature of the arterial blood which is distributed to all parts of the body.
Wherever the temperature sensors are located, they will be affected by this shift in
balance. Thus, the circulating blood provides information of the controlled variable to the
sensors. The signal from the sensors is fed back to the hypothalamic controller via
afferent neural pathways, and gives rise to an appropriate change in the efferent signals to
the effectors.
Physical and mathematical model of the relation between disturbance and response
in the autonomic system is a gross oversimplification. The relation between temperature
sensors and thermoregulatory effectors is almost certainly influenced by a great number of
circumstances not directly related to the temperature.
Models of physiological functions must be made as simple as possible in the first
place in order not to obscure a basic features since all functions of the human body are
interrelated to a greater or lesser extent. Linear regression models are simple descriptions
of the relations between the disturbance and response in very restricted experimental
circumstances, but they afford good insight into the nature of the neuronal control
responsible for this relation and the resultant control of body temperature. Such models
(Timbal et al. 1976, Hayward et al. 1975, Hall 1972, Smith and Hames 1962) can be
applied in several ways. They assist in optimizing the design of laboratory experiments
16
and field studies and may be used in real time to help make a rational decision about
termination of a hazardous search and rescue effort.
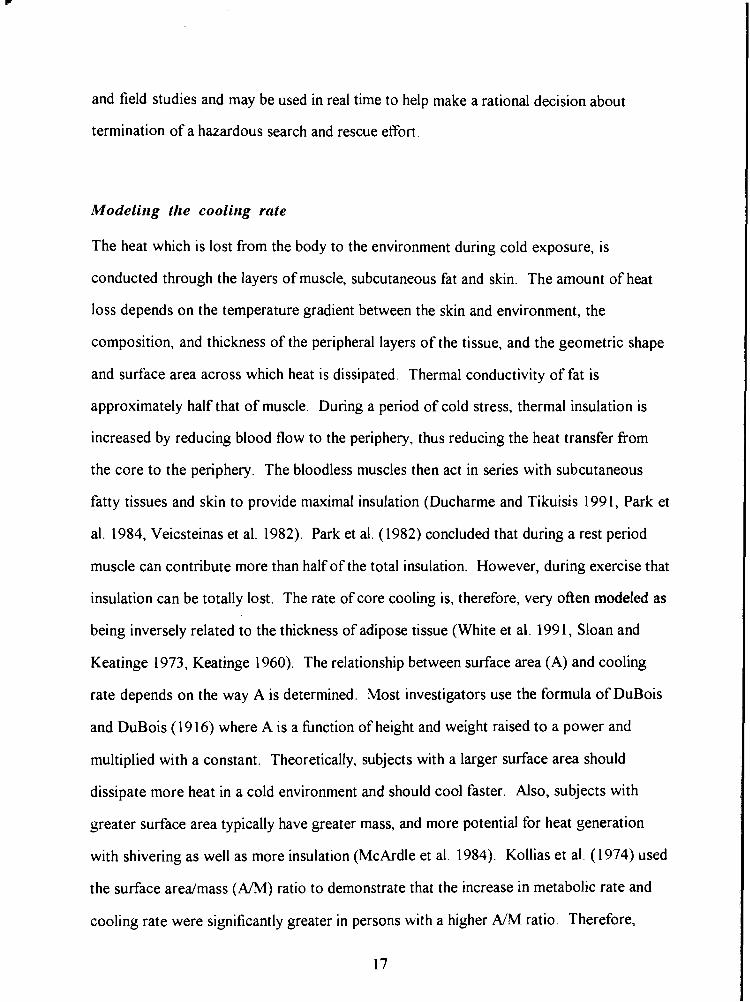
Modelirrg the coolirrg rate
The heat which is lost from the body to the environment during cold exposure, is
conducted through the layers of muscle, subcutaneous fat and skin. The amount of heat
loss depends on the temperature gradient between the skin and environment, the
composition, and thickness of the peripheral layers of the tissue, and the geometric shape
and surface area across which heat is dissipated. Thermal conductivity of fat is
approximately half that of muscle. During a period of cold stress, thermal insulation is
increased by reducing blood flow to the periphery, thus reducing the heat transfer from
the core to the periphery. The bloodless muscles then act in series with subcutaneous
fatty tissues and skin to provide maximal insulation (Ducharme and Tikuisis 1991, Park et
al. 1984, Veicsteinas et al. 1982). Park et al. (1982) concluded that during a rest period
muscle can contribute more than half of the total insulation. However, during exercise that
insulation can be totally lost. The rate of core cooling is, therefore, very often modeled as
being inversely related to the thickness of adipose tissue (White et al. 1991, Sloan and
Keatinge 1973, Keatinge 1960). The relationship between surface area (A) and cooling
rate depends on the way A is determined. Most investigators use the formula of DuBois
and DuBois (1916) where A is a hnction of height and weight raised to a power and
multiplied with a constant. Theoretically, subjects with a larger surface area should
dissipate more heat in a cold environment and should cool faster. Also, subjects with
greater surface area typically have greater mass, and more potential for heat generation
with shivering as well as more insulation (McArdle et al. 1984). Kollias et al. (1974) used
the surface arealmass (ARM) ratio to demonstrate that the increase in metabolic rate and
cooling rate were significantly greater in persons with a higher A/M ratio. Therefore,
women with considerably higher Ah4 and similar percentage body fat than men, were
found to cool more quickly. Others, however, have found that A h 4 affects the cooling
rate minimally (White et al. 1992, Toner et al. 1986).
Predictive models of cooling rate maybe nonlinear (Wissler 1985, Tikuisis et al.
1988) or linear models (Timbal et al. 1976, Hayward et al. 1975, Hall 1972, Smith and
Hames 1962). Tikuisis et al. (1988) demonstrated that the predictive ability of a model
improved with inclusion of morphology as a variable in the model's structure. In this
thesis two approaches were used in predicting the cooling rate of subjects immersed in
cold water: a linear approach using linear regression and a nonlinear approach, using a
neural network. Both models are based on body physique and water temperature.
IV: Summary
In the existing literature there is a paucity of data regarding the thermoregulatory response
of a human exposed to cold water immersion in a compressed air environment. Studies on
the narcotic effect of hyperbaric N2 are mainly cncerned with psychomotor performance
and there is little information on the effect of narcosis on thermoregulatory, autonomic
and behavioural responses. Whether an altered thermal response can be attributed to the
narcotic effect of hyperbaric N2 and/or hyperoxia, associated with compressed air
breathing, is not clear. Studies comparing the narcotic effects of hyperbaric N2 and
clinically used anesthetics, such as N20, are limited to psychomotor performance. The
influence of these agents on the thermoregulatory, autonomic and behavioural response
has not yet been established. Finally, since the cooling rate of subjects immersed in cold
water will depend on body composition and shape as well as on the water temperature, a
model for prediction of survival times in cold water should account for the effect of body
physique.
AIMS OF THE PRESENT STUDIES
The four studies presented in this thesis examine the effect of compressed air and nitrous
oxide on thermoregulatory response and the perception of thermal comfort of humans
immersed in cold water.
The specific aims of the Studies I, 11, I11 and IV were as follows:
to investigate whether the autonomic thermoregulatory response and perception of
thermal comfort are altered in a hyperbaric environment (I);
to determine whether an increase in cooling rate and suppressed perception of thermal
discomfort observed at 6 ata is due to the effect of an increased PO2 associated with
compressed air breathing (11);
to assess whether an increase in atmospheric pressure affects shivering thermogenesis
in subjects immersed in cold water (111);
to assess whether the effect of increased PN2 on shivering, cooling rate and perception
of thermal comfort are dose dependent (111);
to compare the narcotic effects of PN20 and PN2 on thermoregulation (111);
to determine whether morphological and gender differences affect physiological
reaction to thermal stress (IV);
to develop a regression equation based on body physique, water temperature and
narcosis level to predict the cooling rate of nude humans during diving (IV);
t o develop a regression equation based on body physique and water temperature to
predict the survival time of nude humans during head out immersion in cold water
(IV).
MATERIALS AND METHODS
This section outlines general methods common to all four experimental studies. Details of
specific methods, protocols and instrumentation are given in each study.
Subjects
Healthy volunteers of both genders were used for the studies. Their participation in the
experiment was subject to a doctor's approval. All subjects were familiarized with
experimental protocol, which was approved by the institutional Ethics Review
Committee. The experimental procedure was thoroughly explained to each subject prior
to their participation and informed consent. Subjects were aware that they could
withdraw from the study at any time. All subjects participating in a hyperbaric trial had
previous experience with compression in a hyperbaric chamber.
Protocol
The same protocol was used in all studies, to simulate the conditions during compressed
air diving where divers are not wearing a heated protective dry suit. Subjects dressed only
in a swim suit, and sat quietly in a suspended chair in continuously stirred water,
immersed up to their neck.
Hyperbaric chamber
The hypolhyperbaric chamber at School of Kinesiology (Simon Fraser University)
consists of 3 interconnected steel-walled pressure vessels: Entry Lock (7.23 m3), Main
Lock (13.8 m3) and Wet Lock (9.6 m". The system is rated to approximately 300 meters
of sea water pressure (300 msw or 30 ata) and to 12000 meters above sea level altitude.
The chamber is 2 m in diameter and 7.5 m long overall. All immersions in studies I and I11
were conducted inside the Wet Lock. During the hyperbaric trials all compartments were
compressed. The water temperature was brought to the desired temperature using a
coolinglheating unit. Throughout the experiment water temperature remained very close
to the initial temperature due to high amount of water in the Wet Lock.
Compression and decompression
During compression, the subject sat on a chair, suspended above the wet lock, with all the
probes in place and connected. Compression was conducted at a rate of approximately
1.2 atm-min-'. The decompression profile was determined for each dive separately,
depending on the bottom time. The profile followed the DCIEM Air Diving Tables and
Oxygen Decompression Tables protocol. Decompression time was never longer than the
244 minutes, required to decompress From 1 hour spent at a depth of 50 meters (I).
During all decompressions done in Study 111, pure oxygen was inspired intermittently at
20 minute intervals to reduce the risks of decompression sickness.
Personnel
During each hyperbaric experiment a qualified diver accompanied the subject inside the
chamber. Other research personnel, including a medical doctor and technical staff - two
chamber operators, and a back-up diver, assisted with the experiments from outside the
chamber.
Rewarming procedures
Upon exiting the cold water, the hydrostatic pressure, which during immersion aids
venous return and assists cardiac output, is withdrawn. Therefore the blood which is
pooled in the central regions of the body during immersion, returns to the cold extremities,
and comes back to the core much colder. The core region of the body continues to cool
resulting in a phenomenon called afterdrop. The occurrence of afterdrop may also be
explained as a result of heat transfer by physical means and need not to involve the
circulatory system. If heat is applied to superficial tissues, the direction of heat flow will
32
not reverse immediately, and heat will continue to flow outward from warm core areas to
cooler outer regions, resulting in an afterdrop. Rewarming in a hot bath (39•‹C - 41•‹C)
increases the hydrostatic pressure and supports cardiac output. This method of
rewarming was possible in normobaric trials. During decompression after a hyperbaric
trial, subjects were rewarmed passively in a sleeping bag by endogenous heat produced by
shivering. If necessary, subjects continued to be rewarmed in bath after completion of
decompression.
Core temperature measuring sites
Core temperature was monitored sites in the present studies from the distal esophagus
and 15 cm beyond the rectum. The esophageal probe insertion length was determined
from the sitting height following the formula b, = 0.479-J&, - 4.44 (Mekjavic and Rempel
1990). The distal esophagus is considered the most reliable core temperature monitoring
site (Gerbrandy et al. 1954), reflecting the temperature in the pulmonary artery where any
change of thermal state of the body is evident within seconds (Rowell 1986, Cooper and
Kenyon 1957, Cranston et al. 1954). The rectal temperature is not so sensitive to
temperature change and seems higher during the cooling phase than the esophageal
temperature (Tes) (Mather et al. 1953), and responds more slowly (Molnar and Read
1974) perhaps due to the lower blood flow and better insulation in the visceral area. The
temperature reading from the rectal site depends on the insertion length of the probe, the
water temperature and the amount of insulation of each subject. Tes is able to track a fast
change in temperature but fluctuates due to cooling from the alternate expiration of warm
air and the flow of cooler air inspired at each breath (Molnar and Read 1974). The
validity of prediction of survival time in study IV requires that the core temperature
monitoring sites in the distal esophageal and the visceral region be well correlated.
Immersions
All immersions in Studies I and I11 were conducted inside the Wet Lock of a hyperbaric
chamber. Water mixing and flow around the subject, was achieved by placing a.loop of
perforated Tygon tube on the chamber floor around the subject. The tube was connected
to the external cylinder with compressed air. Bubbles of air produced water movement
around the subject and maintained a minimal thermal gradient between the skin and water
throughout the experiment. The immersions in Study I1 took place in a water tank
measuring 2 10 x 105 x 2 10 cm. Water temperature was maintained constant with a
coolinglheating unit. Water in the tank was continiously agitated throughout the
experiment by a battery powered propeller.
Anthropometric measurements
Anthropometric measurements were made on each subject by a trained anthropometrist.
Compressed adipose tissue thickness was determined using the caliper t echque at each
skinfold site using the same caliper closing pressure. Each measurement was made twice
and a mean measure was reported. Anthropometric indexes of ectomorphy, mesomorphy
and endomorphy were calculated fiom a regression equation. Body surface area (A) was
estimated from known body height (HT) and weight (WT) using the formula of DuBois
and DuBois (1 916):
A= WP J25 - HP 725. 7 1-84 @In*)
Measured anthropometric variables were used to calculate the proportinal amount of skin,
adipose, muscle, bone and residual tissue mass in each subject according to Kerr (1988).
Perception of thermal comfort
In the present thesis, subjects were asked to rate the magnitude of their thermal
discomfort. The thermal comfort vote in these studies reflects a subject's change in
perception of thermal comfort as a hnction of Tes, since skin temperature was constant
during each immersion. Subjects rated their perception of their thermal state at 5 minute
intervals, on a 21-point scale (Enander et al. 1979), with a middle point 0 defined as
thermo-neutral ( + I 0 = very very hot, +8 = very hot, +6 = hot, +4 = moderately hot, +2 =
warm, 0 = neither warm nor cold, -2 = cool, -4 = moderately cold, -6 = cold, -8 = very
cold, -10 = very very cold). In addition, a 5-point scale (Chattonet and Cabanac 1965)
was used for sensation of thermal comfort, where +2 indicates "very pleasant", +1 =
pleasant, 0 = neutral, -1 = unpleasant and -2 = very unpleasant. Subjects were first asked
to choose a number from a 21-point scale in response to question "how cold are you". In
response to second question "how do you feel", subjects chose a number from a 5-point
scale. Whereas the first scale evaluates each subject's sensation of thermal comfort, the
purpose of the second scale was to evaluate the possible effect of narcosis on perception
of cold.
Prediction of core cooling using a nonlinear artificial neural network (ANN)
Heat loss and the metabolic rate of humans exposed to cold depends mostly on the
temperature gradient, body surface area and body shape and composition. To develop a
predictive model of core cooling as a function of body physique, a nonlinear relationship
between the anthropometric variables (i.e. between surface area and height and weight)
may be explored. Therefore, two approaches to modeling the cooling rate were used: a
linear approach using linear regression and a nonlinear approach, using a neural network.
The theory of the ANN is to define a nonlinear relatinship which is usually hard
to define or represent by a mathematical equation. A neural network consists of several
layers of artificial neurons with a local memory. The layers connect those neurons that
receive the input signals and those that generate the outputs. An example of a neural
network with three layers and interconnections between the neurons in those layers is
represented in Fig. 4. Each neuron in this network receives signals from all those in the
previous layer, reacts to those signals and sends its output to all neurons in the next layer.
The ANN represents a parallel structure since the computations of the components are
independent of each other. The way in which a neuron reacts depends upon a weighting
factor assigned to each input. The weights define the behaviour of the network but do not
have to be specified in advance. Instead, the network is trained on sets of sample data and
adjusts its own weights until its responses are judged to be correct (until the error for the
entire training set reaches the minimum or when a predetermined number of iterations had
been performed). The ability to adjust the input weights gives the neural network learning
capability. By training the ANN, a non-linear system can be modeled by properly
adjusting weights of connections among nodes in the network.
Back-propagation (of error) is one of the most commonly used learning rules for
the layered unidirectional - feedforward neural network (FFNN). Back propagation is an
iterative gradient algorithm designed to minimize the mean square error between actual
output and the target output. The difference between the output and target vector is fed
back through the network and the weights are readjusted in such a way as to reduce the
error. This new set of network weights is used to produce a new output vector, which is
compared again with the target vector. The weights are readjusted until the error for the
entire training set reaches an acceptably low level.
Output
A
First hidden
Fig. 4: An example of a neural network with 6 inputs, 1 hidden layer with 10 neurons
and 1 output with all interconnections. The various size of the boxes in the hidden layer
represent different weights.
STUDY I
BREATHING AIR AT 6 ATA INCREASES THE RATE OF CORE COOLING AND
SUPRESSES THE PERCEPTION OF THERMAL DISCOMFORT
IN HUMANS IMMERSED IN COLD WATER
ABSTRACT
Thermoregulatory responses of eight healthy subjects, six men and two women, were
compared at 1 and 6 ata during head out immersion in 15•‹C water. Both trials were
conducted in a hyperbaric chamber. During immersion, esophageal temperature (Tes) and
skin temperature (Tsk) at two sites (chest and calf) were recorded at minute intervals.
Oxygen uptake ( ~ 0 ~ ) was determined at 5 minute intervals. The order of the two trials
was alternated randomly among subjects. The rate of core cooling (T ,,) was 20.1%
greater during the 6 ata trial (mean * SE, -2.34 * 0.4 "c.K') than during the 1 ata trial
(-1.87 f 0.6 T-h- ' ; p 10.05). Subjects perceived that immersion at 6 ata was less cold
than immersion at 1 ata despite significantly greater T ,,. There was no evidence from the
VO? data of change in heat production between the two conditions.
INTRODUCTION
During diving in cold water, divers may be exposed to a high rate of convective/conductive
heat transfer and a low temperature of the aqueous environment, which can induce a drain
of heat from the body's surface (Webb 1982). During deep ocean diving the heat loss
from respiratory tract is also increased (Piantadosi et al. 198 1). Therefore, research has
focused primarily on thermal protection of divers and minimizing respiratory heat loss.
Furthermore, a blunted appreciation of cold in divers (White et al. 1980) during the onset
and progression of hypothermia may be a reason for diving accidents.
In two previous studies, Mekjavic and Sundberg (1 992) and Passias et al. (1 992)
have demonstrated that a narcosis induced by inhalation of a normoxic gas mixture
containing 30% nitrous oxide (NzO) shifts the core temperature threshold for the onset of
shivering to a lower level and significantly attenuates oxygen uptake a criterion measure of
shivering response. The observed increase in cooling rate during narcosis has been
attributed primarily to attenuation of shivering thermogenesis by the anesthetic action of
N20. Accordingly, it was hypothesized that narcosis induced by hyperbaric nitrogen,
might also attenuate shivering thermogenesis and might therefore be a contributing factor
in the development of hypothermia in compressed air diving.
The present study (I) was designed to investigate the effect of compressed air on
thermoregulation of humans immersed in cold water. The objective was to assess whether
nitrogen narcosis attenuates shivering thermogenesis, alters perception of cold and
contributes to an enhanced cooling rate of the deep body core.
METHODS
Eight subjects (six men and two women) participated in the study. Their age, weight and
height were 28 * 2 years, 74 * 6 kg and 178 * 3 cm (mean k SD), respectively. The
subjects were familiarized with the protocol and instrumentation before the immersion
trials, and all had previous experience of diving in a hyperbaric chamber. The schematic of
the experimental setup is presented in Fig. 1-1.
Protucol
Experiments took place in a hyperbaric chamber consisting of an entry lock, main lock and
wet lock situated beneath the entry lock. All subjects performed two experimental trials,
one at 1 ata and one at 6 ata. The two trials were separated by a minimum of 5 days and
the order in which the trials were conducted was alternated randomly among subjects.
Subjects wearing only a swim suit were instrumented and sat in a chair suspended above
the wet lock of the hyperbaric chamber. In the 6 ata trials, the subjects were compressed
at the rate of a 1.2 atm-min-'. After a 5 minute rest period at 6 ata, each subject was
lowered rapidly via a pulley system into the wet lock, and remained immersed up to the
neck in 15•‹C water for a maximum of 60 minutes during a trial at 1 ata, and for 45 minutes
during a trial at 6 ata. The maximum immersion time at 6 ata was restricted by the
maximum bottom time of the DCIEM Air Diving decompression table approved by the
ethics committee. An experiment was terminated if the esophageal temperature (Tes)
decreased to 35•‹C or by 2•‹C below the subject's pre-immersion temperature. Upon
completion of each immersion at 6 ata, the subject was transferred into the main lock of
the hyperbaric chamber and rewarmed passively in a well insulated sleeping bag. After
each immersion at 1 ata. the subject was rewarmed in a hot tub.
Znstrument(ition
Tes was measured with a YSI 702A thermistor probe (Yellow Springs Instruments,
Yellow Springs, OH) inserted through a nostril into the esophagus to the level of the left
ventricle. Skin temperature (Tsk) was recorded from two sites, mid chest and medial calf,
using YSI 701 thermistors. Oxygen uptake ( ~ 0 ~ ) was measured by collectin of respired
gas in a meteorological balloon. Samples of expired gas were collected every 5 minutes
throughout the course of an experiment. The subjects breathed through a two-way
respiratory valve (Hans Rudolph, Kansas City, MO), the expiratory side of which was
connected with corrugated respiratory tubing to a two way valve and a meteorological
balloon. Expired gas was collected for I minute in the normobaric trials In the hyperbaric
trials, the expired gas sample was collected for 30 seconds in order t o allow for bag
expansion during the decompression. Expired ventilation (V 3 was determined from one
minute readings of a Parkinson Cowan dry gas volume meter (Chatham, ON) throughout
the experiment and after the experiment the values were confirmed by exhausting the
balloons through the same volume meter. The concentration of O2 and C 0 2 in the expired
gas was analyzed with ;in Arnetek Applied Electrochemistry S-3A (Pittsburgh, PA)
oxygen analyzer and a Beckman (Schiller Park, IL) carbon dioxide analyzer. During the
hyperbaric trials filled meteorological balloons were kept inside the hyperbaric chamber
(Fig. 1-1) and gas analysis of the contents of each was completed after the
decompression. During rest and throughout an immersion at 5 minutes intervals, subjects
were asked to give rating of their thermal state. They were asked to choose a number
from a 21 point scale (Enander et al. 1979), where the middle point of 0 indicated
'thermoneutrality' (+I0 = very very hot, +8 = very hot, +6 = hot, +4 = moderately hot,
+2 = warm, 0 = neither warm nor cold, -2 = cool, -4 = moderately cold, -6 = cold, -8 =
very cold, -10 = very very cold). In addition, a 5-point scale (Chattonet and Cabanac
1965) was used to determine subject's sensation of thermal comfort, on a scale on which
+2 indicated "very pleasant", +1 = pleasant, 0 = neutral, -1 = unpleasant and -2 = very
unpleasant.
Dntn nnnbsis
The rate of core cooling was obtained by performing a regression analysis on the linear
portion of the cooling curve. The linear portion of the Tes cooling curve was determined
from the point in immersion at which a steady fall in Tes was observed until the end of
immersion. Regression analysis of the linear portion of the Tes response for each subject
yielded the slopes of the Tes response ("c-h-') which was compared between the
conditions ( 1 and 6 ata) using a Student paired t-test. Significance was established at the
5% level. The perception ratings of thermal comfort reported by the subjects in each
condition were compared using a non-parametric Wilcoxen signed rank test at each 0.5"C
decrement of Tes.
RESULTS
Skirl temperature
During the resting period in air prior to immersion and throughout the immersion, the
unweighted group mean skin temperature ( f ,k) from the two measuring sites had similar
values. The resting i sk of 3 1.6 * 0.2"C decreased to a stable value of 16.9 * 0.4OC after
immersion for 1 hour at 1 ata At 6 ata f ,k decreased from 3 1.3 * O.Z•‹C during rest to
15.9 * 0.5"C during immersion. The difference in immersion T sk between the trials was
not significant. Following an initial drop on entry to the water, Tsk did not vary
throughout the immersion and maintained a stable value slightly above the water
temperature.
i3ophageal temperature
Immersion in a hyperbaric trial was shorter due to the restraint imposed by the
decompression table and the ethics committee constraints. The average dive duration was
44 minutes compared with a 56 minute normobaric trial. Despite this, the mean end-
immersion Tes was lower at 6 ata compared with 1 ata, although the difference was not
significant (Fig. 1-2). The onset of continuous cooling started earlier in the hyperbaric
trial (mean * SE, 12 * 1.6 min) compared with 1 ata trial (14.3 1.4 min; p 5 0.05; Fig.
1-2). In all trials core temperature never decreased below 35•‹C. A linear regression was
conducted on the linear portion of the Tes response for each subject, and the slope and
coefficient of correlation (R') is hown in Table I - 1 The rate of core cooling (T e& was
greater at 6 ata (-2.34 i 0.41 "c-K'; p < 0.05) compared with the 1 ata trial (-1.87 * 0.59
"c-h-').
Thernrnl Conrfort Vote
When subjects rated their perception of comfort on a 5 point scale there was no
significant difference between the 1 and 6 ata trial. In contrast, there was a significant
difference between 1 and 6 ata when perception of thermal state was rated on a 21 point
scale (p < 0.05, see Fig. 1-3). Subjects perceived their thermal state consistently colder at
1 ata than at 6 ata for the same value of ATes. Statistical analysis was not attempted at
ATes = - 1.5"C since only 3 subjects cooled to that degree in both trials.
The oxygen uptake measurement was very variable between subjects. Due to technical
problems with data collection which is detailed in Appendix, 5 subjects out of 8 had to be
excluded from the analysis. For this reason results of only 3 subjects are presented. The
removal of 5 subjects from analysis was determined from analysis of their VCO,, v 4
and vI (ATPS) data. The respiration exchange ratio (RER) obtained for the group for
v C O ~ / V Q showed an unreasonably high (above 2) or low (below 0.5) value in excluded
subjects. Fig. 1-4 shows the expired ventilation as a function of time and VQ as a
fbnction of Tes for 3 subjects. The amount of data presented was not sufficient for
statistical analysis of the group mean. The results of 3 subjects in Fig. 1-4 do not show
an efTect of N2 narcosis at 6 ata on shivering thermogenesis.
DISCUSSION
The finding that hyperbaric exposure increased the cooling rate of Tes in response to cold
water immersion may be due to an increased heat loss andlor decreased heat production.
Despite the greater cooling rates, subjects perceived immersion at 6 ata as less cold than at
1 ata. Similarly Passias et al. (1 992) and Mekjavic and Sundberg ( 1 992) observed a greater
37
cooling rate and warmer rating of thermal state by subjects of similar age during cold water
immersion while they inhaled normoxic gas mixture containing 30% N20 Although the
effect of nitrogen narcosis on psychomotor performance is similar to that of the narcosis
induced by inhalation of N20 (Hesser et al. 1978), there is no evidence so far of the effect
of nitrogen narcosis on the thermoregulatory response of humans immersed in cold water.
It has been shown, however, that anesthetic agents in general, inhibit the thermoregulatory
response in animals (Hammel 1988) and humans (Sessler et al. 1988 a, b, Sessler 1991).
Since N2, like anesthetics used in clinical practice such as nitrous oxide, ethylene and
cyclopropane, are all considered biologically inert, N2 could be expected to act on the
thermoregulatory system by a similar mechanism as a general anesthetic gas (Carpenter
1954). The nitrogen inert gas theory is based on the Meyer-Overton hypothesis (Meyer
1899) who established a parallel between the affinity of an anesthetic for lipid and its
narcotic potency. It was suggested that narcosis is most probably due to the penetration
of the cell membrane by the anesthetic substance (Meyer and Hopff 1923).
It is difficult to conclude from the present study whether there is any difference in
oxygen consumption between the 1 and 6 ata immersion. Results from three subjects
presented in Fig. 4 do not show an effect of Nz narcosis at 6 ata on shivering
thermogenesis. However, the amount of data presented is not sufficient for any statistical
analysis.
Passias et al. (1992) and Mekjavic and Sundberg (1992) showed an attenuation of
shivering thermogenesis in subjects breathing normoxic gas .mixture containing 30% N20,
represented by a depression of oxygen uptake by approximately 40% in two studies
despite a difference in the water temperature (15•‹C and 28•‹C respectively). They also
observed a shift of the threshold for the onset of shivering towards lower core
temperatures when subjects breathed 30% N20 with oxygen. The authors concluded that
30% N 2 0 normoxic gas mixture had no effect on thermoregulatory vasoconstriction, and
that any possible depressant effect had been overridden by the intense peripheral cold
3 8
stimuli They based their conclusion on the observation that there was no difference in
heat flux, or forearm-fingertip temperature gradient between the N20/02 and air
inhalation.
It has been shown previously that general anesthetics substantially reduce the
temperature for the onset of vasoconstriction (Sessler et al. 1988 a, b) and increase the
sweating threshold (Washington et a1 1993, Kurz et al. 1993). An - anesthesia induced
withdrawal of the vasoconstrictor tone of skin blood vessels would result in an increased
skin blood flow and enhanced heat dissipation. However, in the present study the mean
value of Tsk was 1•‹C lower at 6 ata (although not significantly) compared to 1 ata (p >
0.05). At the same water temperature Passias et al. (1992) observed only a 0. 1•‹C lower
mean Tsk during N20 inhalation (p > 0.05). This suggests, that neither PN2 = 4.8 atm nor
PN20 = 0.3 atm has enough anesthetic potency to supress vasomotor tone, and may have
an opposite effect, especially at increased PN2 This agrees with a study of Eisele and
Smith (1972), who observed that a subanesthetic concentration of inhaled 40% N20
produced a sympathomimetic action of N20. N20 may increase the sympathetic outflow
from the brain and inhibit removal of norepinephrine by the lung (Naito and Gillis 1973).
Therefore, more of the norepinephrine released into the venous circulation will be
available to act on the systemic circulation causing vasoconstriction.
A hrther observation of Passias et al. (1992) was that the thermosensitivity (gain)
of the shivering response (expressed as A v ~ / A T ~ ~ ) was unaffected by N20 during
cooling, and the slope of A V O ~ / A T ~ ~ was shifted in parallel towards the reduced
threshold for shivering by 0.95"C in 30 % N20 Unfortunately, comparison with the
present study is not possible, due to insufficient vo2 data. However, a similar parallel
shift of A V O ~ I A T ~ , , rather than a change in the gain was observed in Study 111 of this
thesis.
Direct comparison between dit'ferent studies is difficult, as such comparison relies
on the assumption that the narcotic potencies of an anesthetic gas and N2 at elevated gas
39
pressure are equivalent, which may not be valid. As in clinical studies, the effect of N2
narcosis on therrnoregulatory function has not been investigated adequately enough to
draw any substantive conclusion regarding whether the increased susceptibility to
hypothermia arises due to enhanced heat loss or a decreased heat production.
Furthermore, a variety of well known anesthetics are not simply reversible depressants of
cellular function They can also sensitize and stimulate, particularly in low concentration
(Paton and Speden 1965). This was demonstrated by Cheung (1993) who cooled subjects
in 20•‹C water and observed a significantly higher V 0 2 response when breathing 10% N 2 0
and a significantly depressed VO, when breathing 25% N 2 0 compared to air breathing.
Similarly, in study I11 of this thesis, the V% at 5 ata of air (PN2 = 4 atm) was
significantly (p i 0.05) higher compared to VO? in air at 1 ata, when 5 subjects with the
highest cooling rates were analyzed.
During diving the provision of heat for the diver becomes increasingly important
as depth increases, and the precision of control also becomes more critical with increasing
depth. At all depths however, the control is ultimately based upon the diver's subjective
sensation of heat and cold. In the present study, subjects were not given the opportunity
to respond behaviorally to the imposed thermal stress, but were asked to quantify their
thermal state. The results at 6 ata reflect a change in the perception of cold as a function
of T e , since Tsk was constant during the immersion. Immersion at 6 ata was perceived
as less cold (p 5 0.05) despite the significantly greater cooling rates. However, the
differences were not significant with a 5 point scale which might be due to its lower level
of discrimination. For the same drop in Tes subjects could choose from 10 levels on the
21 point scale (from 0 "neutral" to -10 "very very cold") compared to 2 levels on the 5
point scale (from 0 "neutral" to -2 "very unpleasant"). Therefore, for the significant
difference of 3 points in average at ATes = 0 5•‹C from the 10 point scale is 30% of the
whole range. That shift of 3 points is below the discrimination threshold on the 5 point
scale.
40
In conclusion, this study shows that TeS cooling rate in human Pubjects during
immersion in 15•‹C water is accelerated in hyperbaria compared with 1 ata. Since oxygen
per. .w does not have a marked efTect on thermoregulation (Study II), the more rapid onset
of hypothermia is most likely due to increased PN2. It is also concluded, that an altered
perception of the thermal state observed during nitrogen narcosis may play a significant
role in the development of hypothermia of compressed air divers.
REFERENCES
Carpenter FG: Anesthetic action of inert and unreactive gases on intact animals and isolated tissues, Ant JPhysiol, 178:505-509, 1954.
Chattonet J, Cabanac M: The perception of thermal comfort, l t ~ t JBiometeor, 9: 183- 193, 1965.
Cheung SS: Dose-dependent effects of sub-anesthetic levels of nitrous oxide on thermal balance in humans, M.Sc. Thesis, School of Kinesiology, Simon Fraser University, 1993.
Eisele 6I, Smith NTY: Cardiovascular effects of 40 percent nitrous oxide in man, A ~ e s / h A?m/g Cl(rretit Researches, 5 1(6):956-962, 1972.
Enander A, Ljungberg AS, Holmer I: Effect of work in cold stores of man, Scand J Work Et~virori Hed/h, 5 : 1 95-204, 1979.
Hammel HT: Anesthetics and body temperature regulation, (Editorial views), A)ies/hesiology, 68(6):833-835, 1988.
Hayward JS, Keatinge WR: Progressive symptomless hypothermia in water: Possible cause of diving accidents, Brit Med J, 1 : 1 1 82, 1979.
Herdman SJ: Recovery of shivering in spinal cats, Exprinterit Neural, 59: 177- 189, 1978.
Hesser CM, Fagraeus L, Adolfson J: Roles of nitrogen, oxygen and C02 in compressed air narcosis, Uriclersen Bionted Res, 5(4): 39 1-400, 1978.
Kurz A, Sessler DI, Schroeder M, Kurz M: Thermoregulatory response thresholds during spinal anesthesia, Atwsth Amlg, 77: 72 1-726, 1993
Lopez M, Sessler DI, Walter K, Emerick T, Ozaki M: Rate and gender dependence of the sweating, vasoconstriction, and shivering thresholds in humans, Atres/hesiology, 80: 780- 788, 1994.
Mekjavic IB, Sundberg CJ: Human temperature regulation during narcosis induced by inhalation of 30% nitrous oxide, JAppl Physiol, 73(6):2246-2254, 1992.
Meyer H: Zur theorie der alkoholnarkose, Arch Exp Path Pharm, 42: 109- 1 18, 1899.
Meyer KH, Hopff H: Narcosis by inert gases under pressure, Hoppe-Seyler S Z. Physiol. Chem., 126:288-298, 1923.
Passias TC, Mekjavic IB, Eiken 0 : The effect of 30% nitrous oxide on thermoregulatory responses in humans during hypothermia, Atwsthesiology, 76(4):550-559, 1992.
Paton WDM, Speden RN: Anaesthetics and the central nervous system: Uptake of the anesthetics and their action on the central nervous system, BritMedBull, 21:44-48, 1965.
Piantadosi CA, Thalmam ED, Spaur WH: Metabolic response to respiratory heat-loss induced core cooling, J Appl Physiol: Respirat Etlviron Exercise Physiol, 50(4): 829-834, 1981.
Satinoff E: Neural organization and evolution of thermal regulation in mammals, Science, 201 : 16-22, 1978.
Sessler DI, Moayeri A, Stoen R, Glosten B, Hynson J, McGuire J: Therrnoregulatory vasoconstriction decreases cutaneous heat loss, Anesthesiology, 73: 656-660, 1990.
Sessler DI, Moayeri A: Skin-surface warming: heat flux and central temperature, Atzesthesiology, 73 : 2 18-224, 1990.
Sessler DI, Olofsson CI, Rubinstein EH: The thermoregulatory treshold in humans during nitrous oxide-fentanyl anesthesia, Atwsthesiology, 69:357-364, 1988a.
Sessler DI, Olofsson CI, Rubinstein EH, Beebe JJ: The thermoregulatory threshold in humans during halothane anesthesia, At1esthesiology, 68:836-842, 1988b.
Sessler DI, Rubinstein EH, Moayeri A: Physiologic responses to mild perianesthetic hypothermia in humans, Atzesthesiology, 75: 594-610, 1991.
Sessler DI: Central thermoregulatory inhibition by general anesthesia, Atzesthesiology, 75:557-559, 1991.
Washington DE, Sessler D1, Moayeri A, Merrifield B, McGuire J, Prager M, Belani K, Hudson S, Schroeder M: Thermoregulatory responses to hypertherrnia during isoflurane anesthesia in humans, J Appl Physiol, 74(1): 82-87, 1993.
Webb P: Thermal problems, In: The physiology atldmedicine of diving, Bennett PB and Elliot DH (Ed.), Best Publishing Co (Publ.), San Pedro, CA, pp:297-3 18, 1982.
White M, Allan D, Light I, Norman JN: Thermal balance in divers, Latlcet, p: 1362, June 1980.

TABLES AND FIGURES
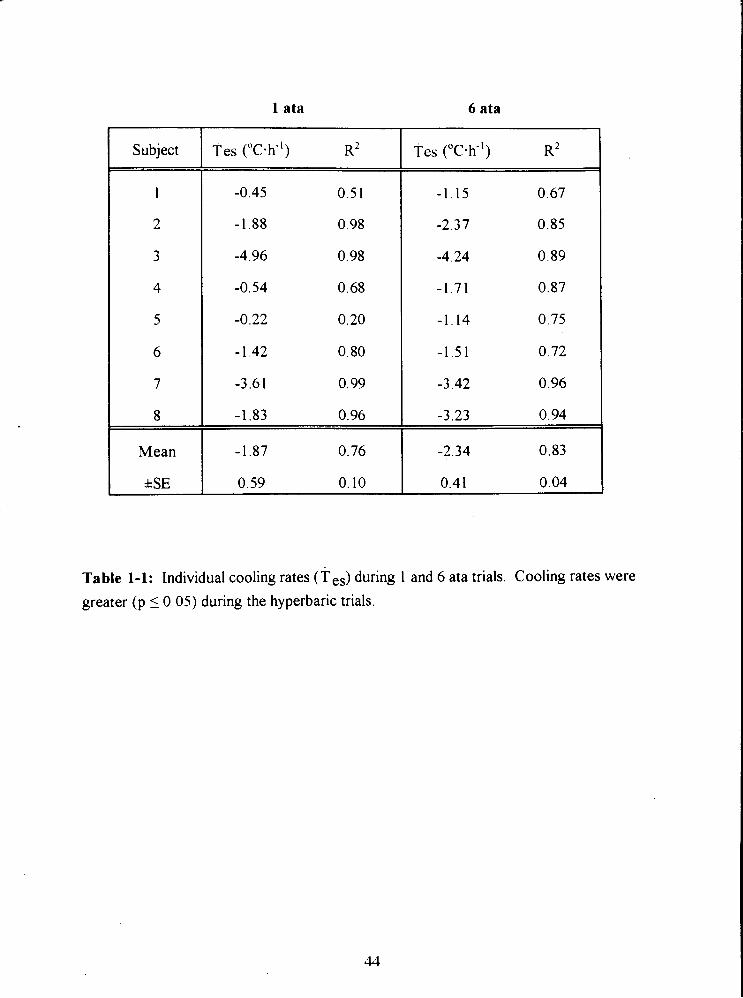
I ata
Subject Tes ("c-h") R2
1 -0.45 0.51
2 -1.88 0.98
3 -4.96 0.98
6 ata
Tes ("C-h-I) R2
Table 1-1: Individual cooling rates (Tes) during 1 and 6 ata trials. Cooling rates were
greater (p 10 .05) during the hyperbaric trials.
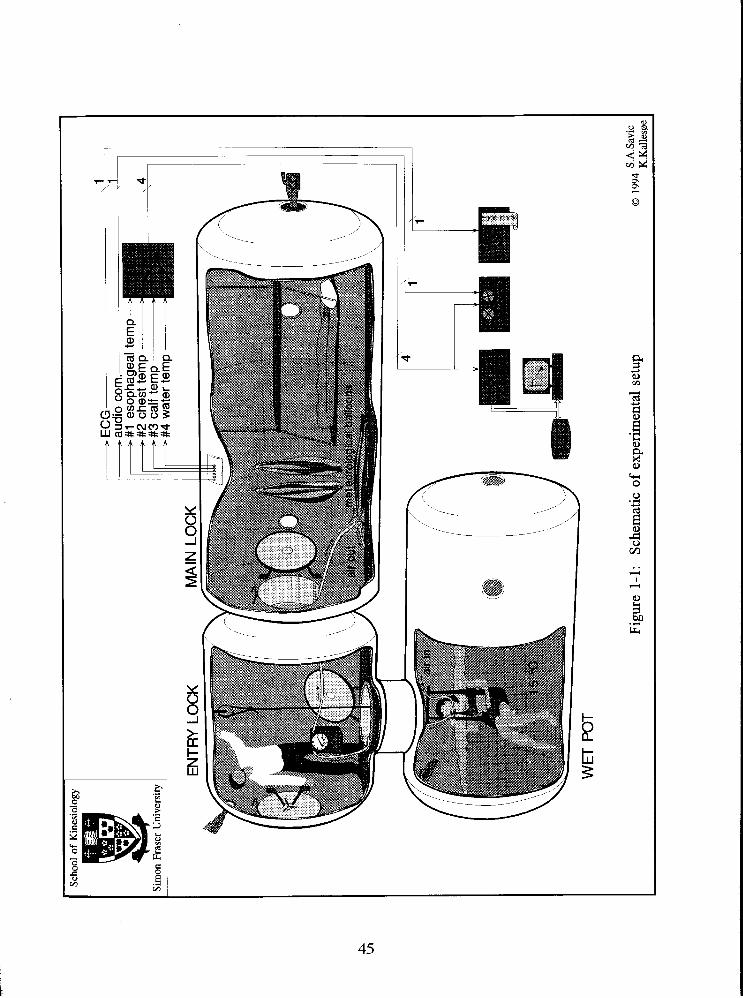
Scho
ol o
f K
ines
iolo
gy
. .
Gim
on F
rase
r U
nive
rsity
EN
TRY
LO
CK
M
AIN
LO
CK
WE
T P
OT
Figu
re 1
- 1 :
Sche
mat
ic o
f ex
peri
men
tal s
etup
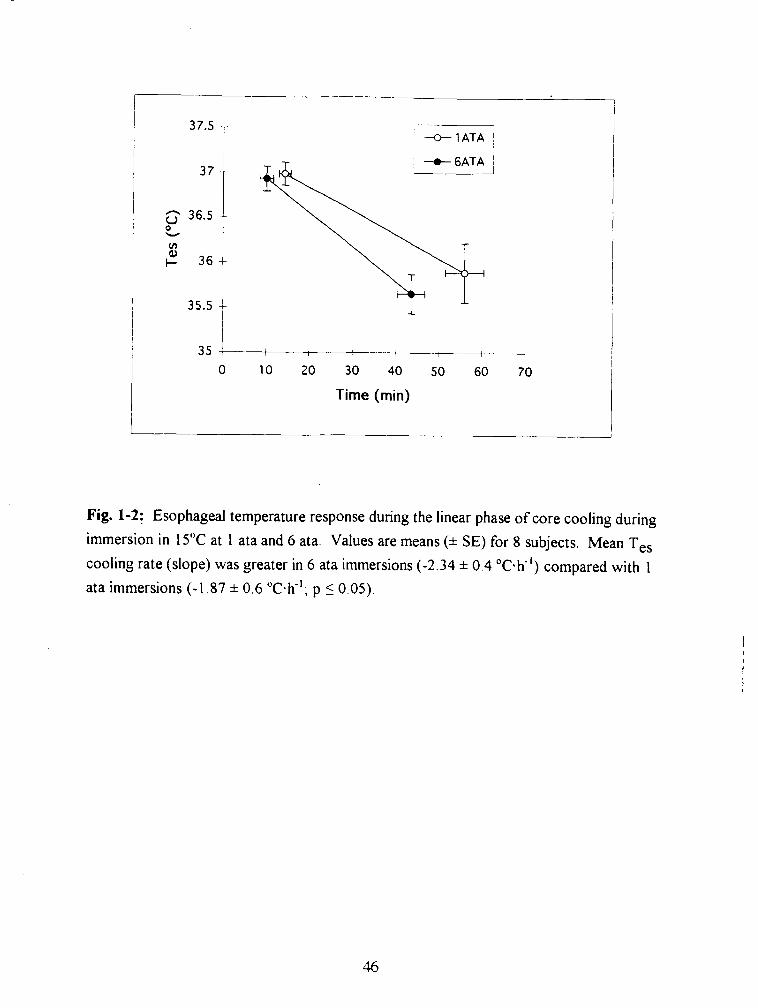
1
, U 1 ATA /
0 10 20 30 40 50 60
Time (min)
Fig. 1-2: Esophageal temperature response during the linear phase of core cooling during
immersion in 15•‹C at 1 ata and 6 ata. Values are means (* SE) for 8 subjects. Mean Tes
cooling rate (slope) was greater in 6 ata immersions (-2.34 * 0.4 "c-h-l) compared with 1
ata immersions (-1.87 * 0.6 ah-'; p 1 0.05).
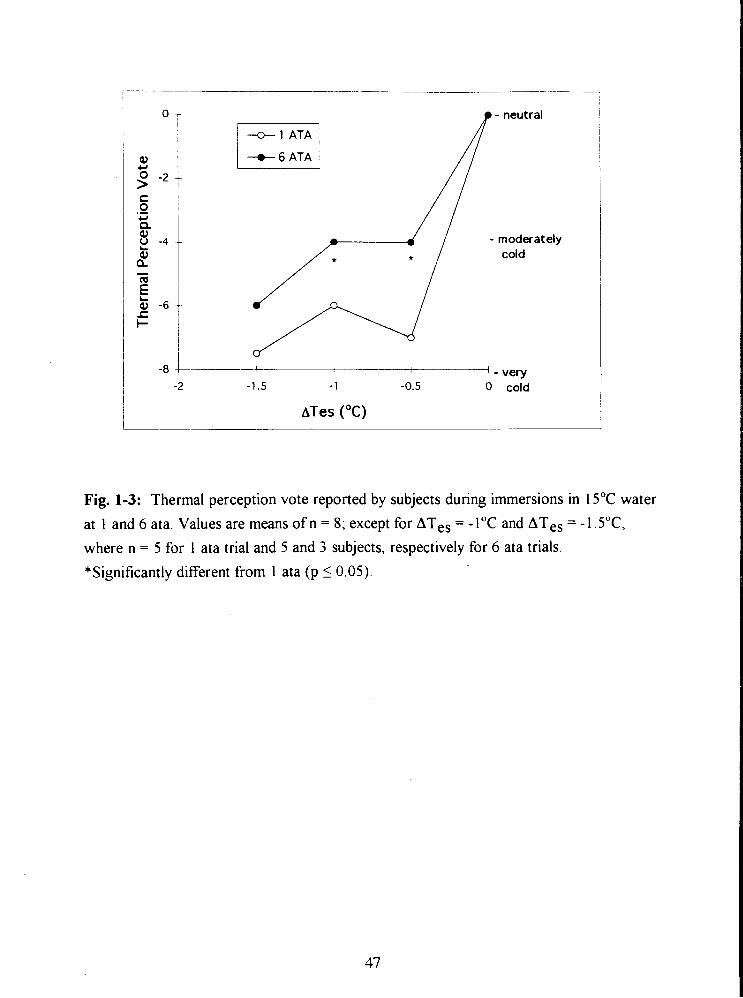
p - neutral
+ 1 ATA ,
I + 6 A T A i
4 - very -1.5 - 1 -0.5 0 cold
ATes (OC)
Fig. 1-3: Thermal perception vote reported by subjects during immersions in 15•‹C water
at 1 and 6 ata. Values are means of n = 8; except for ATes = - 1•‹C and ATes = - 1. S T ,
where n = 5 for 1 ata trial and 5 and 3 subjects, respectively for 6 ata trials.
*Significantly different from 1 ata (p 1 0.05).
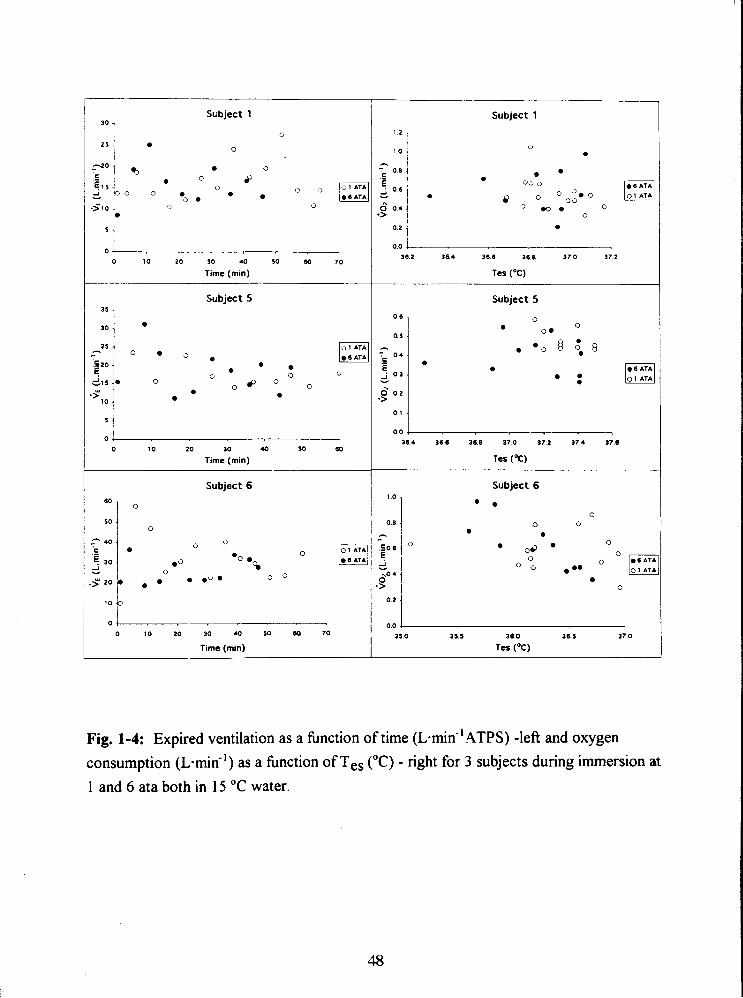
Subject 1 " 1
0 0 0 1 0 2 0 3 0 40 5 0 60 7 0
Time (mm)
Subject 5 .
1 1 0 2 0 3 0 40 5 0 60
Time (rnin)
Subject 6
0 1 0 2 0 3 0 40 5 0 60 7 0
Time (min)
Subject 1
Subject 5
Subject 6
35.0 35.5 36.0 3 6 5 37.0
Tes (OC)
Fig. 1-4: Expired ventilation as a hnction of time ( ~ m i n " ATPS) -left and oxygen consumption (L-mid') as a knction of Tes ("C) - right for 3 subjects during immersion at
1 and 6 ata both in 15 "C water.
APPENDIX 1
OXYGEN CONSUMPTION MEASUREMENTS IN HYPERBARIC CONDITIONS
Problems were encountered in Study I with ~ 0 2 and VCO? data collection and analysis
and the potential for error in V O ~ due to insufficient accuracy when measuring the O2
difference between two very similar fractions. This was detected in the form of unreliable
respiration exchange ratios. Hence a new method was introduced in Study 111. In the
following text both methods used in this thesis: a bag collection of expired gas (I) and a
mixing box with on line measurement (111) are compared and analyzed for accuracy. An
experiment was conducted in a hyperbaric chamber at 1 and 5 ata with 2 subjects resting
and lightly exercising on a bicycle. Both methods of ~0~ measurements were used and
compared for accuracy. Methodologies that were used in both studies are explained in
details in the 'Methods' section of both studies.
When breathing compressed air at 6 ata, the partial pressure of oxygen has a value
of 1.2558 atm (PO2 = 6 . 0.2093 atm). When the expired gas samples collected at 6 ata are
analyzed at 1 ata, as in study I, the difference between inspired and expired fractions of
0, - (F@, and FE02 respectively) is approximately 6 times smaller, requiring special care
and high accuracy of measurement. This includes multiple calibrations, stable recording
conditions and equipment capable of detecting small differences ( F I Q - FE02 = 0.3% to
0.6%). Any small error in analyzing the expired gas composition is magnified in the
calculation of VQ and VCO* by subtraction of two similar quantities.
INSTRUMENTATION
In Study I, the experimental setup consisted of following instrumentation: meteorological
balloons, dry gas volume meter, O2 and C02 analyzers. Subjects breathed through a two-
way respiratory valve, the expiratory side of which was connected with corrugated
respiratory tubing to a two way valve and a meteorological balloon. Expired gas was
collected every 5 minutes during the trial. Expired ventilation was determined from one
minute readings of a Parkinson Cowan dry gas volume meter throughout the experiment.
Concentration of O2 and C02 in the expired gas was analyzed with an oxygen analyzer
and a carbon dioxide analyzer after the each trial.
In Study 111, two gas mixing boxes, a ventilation meter (Alpha Technologies
Ventilation Module), O2 and C02 analyzers, a computer (Macintosh 11), a data
acquisition system (Hewlett - Packard Model 3497A data acquisition and control unit)
and LabView 2.1 software (LabView, National Instruments) were used. Inspired
ventilation was measured by a flow meter connected to the inspiratory side of an oronasal
mask (see Fig. 1 and 2 in Study 11). The signal from the turbine was directed through the
chamber wall to a serial port of the computer, for display and v02 calculation with a
LabView program. Expired gas was directed to a gas mixing box. A continuous sample of
expired gas was drawn from the mixing box and analyzed using an O2 and C02 analyzer.
In each hyperbaric trial an additional gas mixing box was introduced on the expiratory side
outside the chamber to ensure that a steady gas flow was drawn at constant pressure to
the gas analyzers. The output from the O2 and C02 analyzers was directed to the data
acquisition system from where data were sent to the LabView program for display,
analysis and storage.
Ventilation meter
The meter used in Study I was a Parkinson Cowan dry gas volume meter (Chatham, ON)
which gives a cumulative reading of volume. Calibration of the volume meter was
performed using the syringe of 7.82 L of volume. Calibration was conducted at normal
atmospheric pressure and at 5 ata. The average difference between two readings of the
dry gas meter from the known syringe volume of 7.82 L in 10 trials was -0.04 L at 1 ata
and +0.02 L at 5 ata.
The ventilation meter used in studies I1 and I11 was an Alpha Technologies
Ventilation Module, Model VMM11O (Laguna Hills, CA, USA). The ventilation meter
consists of a turbine allowing gas flow in both directions. The light emitted from four
infrared (IR) diodes is intermittently blocked by the rotating turbine producing a digital
signal which is subsequently transferred through the wall of the hyperbaric chamber to the
serial port of the computer. The process is as follows. When the turbine rotates once, 2
ml of gas is passed through the turbine, producing 4 pulses from the IR diodes. The
pulses are counted by a chip which sends the count to a microcontroller. Every 2 seconds
the count is sent by the microcontroller to the serial port of the computer. Therefore, if at
the end of the two second interval there are 800 counts, or 200 rotations of the turbine,
which would be equivalent to 400 ml of gas. The digital signal is then processed by
LabView 2.1 software for display of ventilation and calculation of oxygen consumption.
The ventilation meter was calibrated at 1 ata and 5 ata using a syringe of a known volume
(7.82 L). The measurement of the gas flow by the ventilation meter was insensitive to the
speed and rotation of the turbine during emptying or filling of the syringe. The average
difference from the known volume in 10 trials was 0.01 * 0.002 L at 1 ata and 0.02 * 0.003 L at 5 ata.
It is evident, therefore, that the turbine (Ventilation Module) and Cowan
ventilation meter were sufficiently accurate during normobaric and hyperbaric calibrations.
However, when using the Parkinson Cowan ventilation meter during the experiment,
minute ventilation data were obtained from a visual reading taken from the volume meter
at one minute intervals, timed with a stop watch. In this technique the precise timing is
crucial as well as accurate visual readings, since the needle may be rotating during the
readings. The average error made by visual readings from dry gas meter when compared
with turbine was 3.1%.
Meteorological balloons
In Study I, meteorological balloons were used to collect respired gas before the estimation
of the expired gas volume and O2 and C 0 2 content were analysed. After all gas samples
were collected in the meteorological balloons during the immersion, the balloons remained
inside the hyperbaric chamber until the end of the decompression procedure. Therefore,
the time elapsed between the sample collection and actual expired gas composition and
volume analysis averaged 3.5 hours. Experimental testing of this technique has shown
that this time span did not affect the volume content nor O2 and C02 concentration inside
the meteorological balloons.
Oxygen and carbon dioxide analyzers
The oxygen analyzer used in the Study I was an Arnetek (Applied Electrochemistry,
Pittsburgh, PA) Model S-3A. The accuracy of that O2 analyzer is + 0.01 % O2 and
sensitivity is + 0.001 % 0 2 . The oxygen analyzer used in the Studies I1 and I11 was also
an Ametek analyzer (same model). The carbon dioxide analyzer used in Study I was a
Beckman carbon dioxide analyzer (Schiller Park, IL). In Studies 11 and 111, an Arnetek
carbon dioxide analyzer Model CD-3A was used. The accuracy of both C 0 2 analyzers is
2 0.02 % C 0 2 and sensitivity is + 0.01 % COz. As shown, the accuracy of these
analyzers is adequate to detect differences of 0.3% to 1% expected in fractions of expired
Oz and C 0 2 during each hyperbaric experiment.
Data acquisition system
In Studies I1 and 111 the Hewlett - Packard Model 3497A data acquisition and control unit
was used for data acquisition (DAQ) The electrical signals generated by the transducers
or gas analyzers must be converted into a form that the DAQ system can accept This
was done by signal conditioning that can amplify a low level signal, linearize, isolate and
filter it for more accurate measurements before reaching a DAQ system. The
specifications of the DAQ system determines the accuracy of the signal conversion such
as number of channels, sampling rate, resolution and input range
Multiplexing is a common technique for measuring several signals with a single
analog to digital converter (ADC) The ADC samples one channel, switches to the next
channel, samples it, switches to the next channel and so on The HP3497A can accept a
maximum of 20 channels of input Sampling rate determines how often the conversion
takes place. Maximum sampling rate on the 5% digits displayed is 20 readings - sec-' for
20 channels In this thesis a maximum number of input channels was 7, thereby allowing
the DAQ system to sample each channel at almost 3 Hz Since the change in temperature
is rather slow, except for skin temperature upon immersion, the maximal sampling rate
was 0 17 Hz. According to the Nyquist sampling theorem the sample rate must be at
least twice the rate of the maximum frequency component in the signal It is evident that
the sampling rate of the DAQ system is not a limiting factor, since it is 17 times the
frequency of the input signal (0 17 Hz x 17 = 3 Hz)
Resolution was determined by the number of bits that the DAQ system uses to
rn-rc)q~nt the ~ q a l v p ; ~ ~ n q l The hisher the resolution, the smalkr thrz d e t ~ c t ~ h l e volta~e
change. Range refers to the minimum and maximum voltage level which the DAQ system
can quantie. The range, resolution, and gain available on a DAQ system determine the
smallest detectable change in voltage. According to the system specifications of the HP
3497A for the 10 V input range and a gain of 10, the sensitivity is 100 pV. Therefore the
resolution for the HP 3497A must be a minimum of 14 bits. A 14-bit converter divides
the analog range into 2'"teps. At 100 % 0 2 the gas analyzer is generating 5 V at the
input of the DAQ. One step of the coded signal corresponds to a minimal resolution of
0.002 % 02. Since the minimal resolution of the DAQ is smaller than the specified
accuracy of the O2 analyzer (0.01 % 02), it is evident that the DAQ is not a limiting
factor in the accuracy of the measurements. Similarly, at a maximal concentration of 15 %
C02 the output of the analyzer is 7.5 V, giving a resolution of 0.0002 % C02. This is
again much smaller than the specified accuracy of the C02 analyzer (0.02% COz).
The digital signal is then used by LabView 2.1 software for display of ventilation and
calculation of oxygen consumption. For calculation of oxygen consumption this software
also receives the data from an HP3497A in strings of ASCII code. These data are
converted into numeric values without truncation. Therefore, the LabView software was
not a limiting factor in accuracy.
EXPERIMENTAL TEST O F METHODOLOGY
Protocol:
Two subjects familiar with hyperbaric exposures performed sub-maximal exercise on a
cycle ergometer inside a hyperbaric chamber at 1 ata and at 5 ata. Five minutes of resting
was followed by 30 minutes cycling. Data were collected during rest and throughout the
exercise period. The rest of the protocol and decompression procedures during the
hyperbaric trials were as outlined in the 'Methods' section of the 'General introduction'.
Oxygen uptake was analyzed using two methods:
a) using the VI from the turbine and FE02 and FEC02 from a subject's expirate in the gas
mixing box
b) using the \jI from the turbine and FEOz and FEC02 from a subject's expired gas
collected into a meteorological balloon.
Experimental setup:
The inspiratory side of an oronasal mask was connected to a turbine (Alpha Technologies
Ventilation Module, Model VMMl10, Laguna Hills, CA, USA) for measurements of
inspired ventilation. The turbine was connected through the wall of the hyperbaric
chamber to a serial port of a Macintosh computer A LabView 2 1 program sampled the
digital signal from the turbine every 10 seconds and recorded inspiratory ventilation in real
time. The turbine was connected in series with a short piece of corrugated tubing to a
Parkinson Cowan dry gas volume meter, such that the subject inspired via the dry gas
meter and turbine Readings from the Parkinson Cowan meter were taken every minute.
The expiratory side of an oronasal mask was connected to a 2 way valve, which was in
1 ' r i ~ ' direction L r >*,-;ted to a meteorological 1) illc ! ir, :he other direction to a 5 L
expired gas Plexiglass mixing box. Every 5 minutes the 2 way valve was switched and 1
minute of expired volume was collected in the meteorological balloon. The gas collection
to the balloon was 30 sec long in the 5 ata trial, to compensate for the gas expansion upon
decompression. Otherwise, the expired gas was passed through the mixing box and a
continuous sample (200 ml-min-I) of expired gas was drawn from the mixing box through
the analyzers by the means of a pump, connected in series with the O2 and C02
analyzers, respectively. The excess of expired gas was exhausted from the mixing box
through a one-way valve to the chamber atmosphere. In the hyperbaric trial, the sample
of expired gas drawn from the mixing box was passed through the chamber wall by means
of a special through hull penetrator and entered a second 5 L Plexiglass mixing box. A
sample of the exhaled gas from the second mixing box was then drawn through the gas
analyzers. This arrangement ensured a steady flow to the gas analyzers at atmospheric
pressure. The analog output from the analyzers was fed to the HP 3497A DAQ system.
FE02 and FEC02 were recorded every 10 seconds using a LabView 2.1 program.
Results:
Inspired ventilation measured by the turbine matched the Parkinson Cowan volume meter
measurements. The difference between the two methods was 2.3% at 1 ata and 3% at 5
ata. FE02 and FEC02 were, on average, slightly higher when measured with a mixing box
compared with the bag analysis (0.013 % 0 2 and 0.018 % C02, respectively, at 1 ata and
0.018 % O2 and 0.023 % C02 at 5 ata). This difference could be due to a timing error,
matching samples which were not taken at exactly the same time. The sample from the
meteorological balloon was matched with a sample from a mixing box after the valve was
switched to the mixing box and the FE02 and FECOz values stabilized (approximately 1
minute). Overall, the VO, results obtained by these two methods matched well and it
does not seem that the difference in methodology in Study I and studies I1 and I11 could
have influenced the v O? results significantly,
CONCLUSIONS
In view of the tests of methodology of measuring VO? in hyperbaric conditions it seems
unlikely that ventilation measurements have influenced the VO, results. The tests also
show that the VO? measured with meteorological balloon method compared accurately
with a mixing box method. The difference in reading was the result of switching the valve
from the meteorological balloon after collecting the expired gas sample to a mixing box.
The data show that after switching the valve to a mixing box, a 30 second period was
required for the mixing box to be flushed. During that time the FEOz and FECOz would
have changed since a subject can not maintain exactly the same level of exercise and
ventilation throughout the experiment.
However, underestimation of VO? in Study I could be due to overestimation of
FEOq and to a lesser extent due to underestimation of FEC02. Table 1-2 line 1 shows an
example of 20.29 % expired O2 at 6 ata from Study I. Line 2 Table 1-2 shows an average
expected expired O7 of 20.6% during cold water immersion (simulated with sub-maximal
exercise on a cycle). Calculation shows that if FE02 is overestimated by 0.3 1% the
resultant 6 0 ~ will be 0.35 (~min" ) which is one third of the expected value (0.91
em in*'), depressed by 63%. Published data from Study I ' report an average of 30%
attenuation in ~0~ at 6 ata. Such a difference can not be explained with the present
methdology. However carehl consideration of the data from Study I showed a drift in the
calibration lines of the O2 analyzer which may cause such an error. Unfortunately, the
-- -- ' Mekjavlc IB. Savlc AS. hken O N~trogen narcosls attenuates shwerlng thermogenesis, J.4pp Ph-vsrol, 78(6)'224 1-2244. 1995
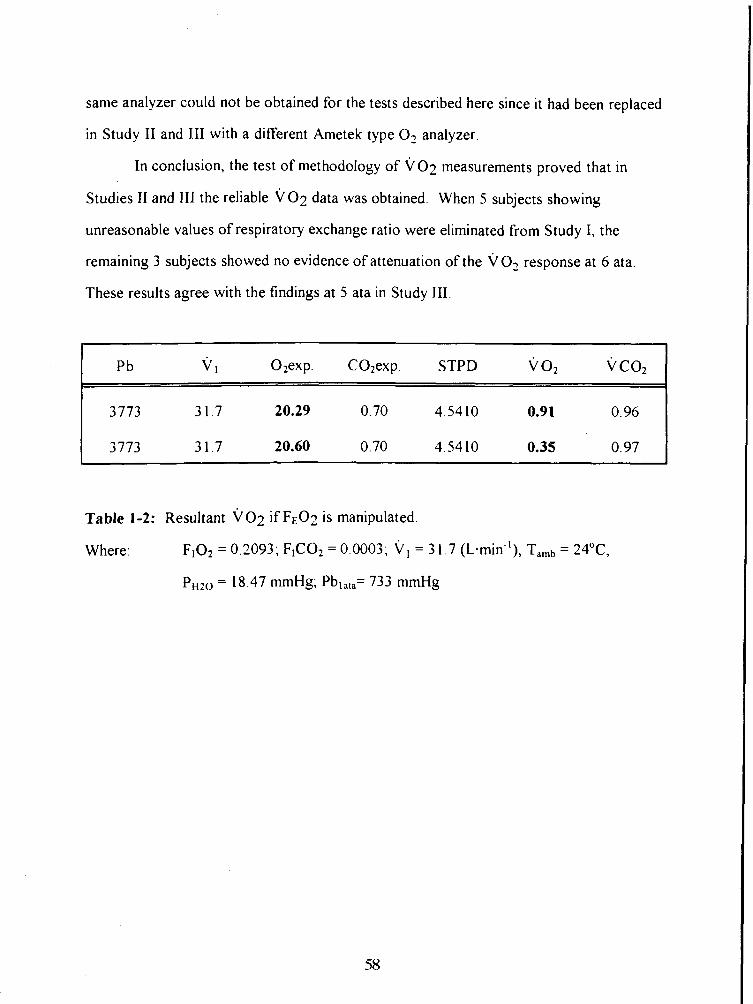
same analyzer could not be obtained for the tests described here since it had been replaced
in Study I1 and 111 with a different Ametek type O2 analyzer.
In conclusion, the test of methodology of i/02 measurements proved that in
Studies II and 111 the reliable ~ 0 2 data was obtained. When 5 subjects showing
unreasonable values of respiratory exchange ratio were eliminated from Study I, the
remaining 3 subjects showed no evidence of attenuation of the VO, response at 6 ata.
These results agree with the findings at 5 ata in Study 111.
Pb 02exp. C02exp. STPD v 0, V C O ~
Table 1-2: Resultant V O ~ if F E 0 2 is manipulated.
Where: F102 = 0.2093; F rC02 = 0.0003; V , = 3 1.7 ernin in-I), = 24"C,
PH20 = 18.47 mrnHg; Pbla,,= 733 mmHg
STUDY I1
THE THERMOREGULATORY RESPONSE OF
HUMANS TO COLD WATER IMMERSION DURING HYPEROXIA
ABSTRACT
The effect of hyperoxia on the human thermoregulatory response was investigated in 7
male subjects during head-out immersion in 20•‹C water for one hour. Each subject
completed two trials, breathing air and 100% O2 respectively. Esophageal temperature
(Tes), skin temperature (Tsk), oxygen uptake ( v 02) and heart rate (m), were recorded
at minute intervals. Perception of thermal comfort was assessed every 5 minutes of the
resting and immersion periods respectively. No significant difference was observed in the
rate of core cooling (T es) or in ~0~ between the trials. The average decrease in Tes
(ATes) was 1.05 2 0.290C when breathing air and 1.08 2 0.2 1•‹C when breathing 100%
0,. The average T es obtained fiom the linear portion of the Tes response. was -1 $27 * 0.09 "c -u~ when breathing air and - 1 14 * 0.07OC-h-l when breathing 100% O2 (p > 0,05),
Group mean \jo2 was 0.89 * 0.45 L. min-I in the oxygen trial and 1 .OO * 0.49 L. min-1 in
the air trial (p > 0.05). Regression analysis of A V O ~ ~ A T ~ ~ , which represents the gain of
the shivering response? did not show any significant difference between the slopes in the
two experimental conditions. Unweighted mean skin temperatures (f sk) attained a
similar end immersion value in both trials (air: 20.7 * 1.3OC; hyperoxia: 20.9 * 1.3"C).
Inspired ventilation and perception of thermal comfort showed no significant difference
between the trials. In contrast, heart rate was consistently and significantly lower (p 5
0.05) in the hyperoxic trial (air: 79 * 20 mi;'; hyperoxia: 7 1 * 18 min").
It is concluded, that thermal balance during cold water immersion is not affected
by hyperoxia, and that hyperoxia does not contribute to the attenuation of shivering
thermogenesis during compressed air diving.
INTRODUCTION
The incidence of hypothermia, prevalent among compressed air divers has been attributed
primarily to the potentiation of heat loss due to cold water and the cold compressed
breathing gas (Webb 1970). Hypothermia in diving has been termed "silent" hypothermia
(Hayward and Keatinge 1979). It develops without previous warning and can progress
into a severe type of hypothermia if precautions are not taken immediately. Though this
silent hypothermia has been suggested to be a consequence of the slow nature of core
cooling and the inability of the core sensors to detect it, there is a paucity of data
regarding the possible inhibition of a regulating autonomic response, which would be
activated to maintain core region thermal stability. Mekjavic and Sundberg (1 992) and
Passias et al. (1992), found that attenuation of heat production during inhalation of 30%
N 2 0 significantly contributed to the progression of cold water immersion hypothermia.
The observed magnitude of attenuation in heat production and increased core cooling in
the above studies suggests that a causative factor inducing an increased cooling rate during
compressed air diving could be the narcotic effect of an elevated PN2.
In the first study (I) eight subjects immersed up to the neck in 15•‹C water showed
greater cooling rate (p i 0.05) of esophageal temperature (Tes) at 6 ata compared with 1
ata. The immersion at an increased pressure was also consistently perceived as less cold
(p 5 0.05). A possible explanation was, that due to the narcotic property of hyperbaric
N,, an increased cooling would result from a depression of shivering, caused by ihbitory
action of increased PN2 on central nervous structures. The mechanism involved in
depressing the heat production could also have an inhibitory effect on thermal perception.
Unfortunately, due to difficulty in attaining consistent v O2 measures evidence for or
against depression in heat production during hyperbaria could not be obtained. In
addition, other factors at that depth, such as increased PO2 (1.2 atm) at 6 ata, and the
effect of pressure per se could not be ruled out.
Froese (1 958) reported that intermittent inhalation of 95% O2 (PO2 = 0.95 atm)
caused a decrease in VO? in subjects exposed to cold ambient air at 1 ata, and suggested
the cause was a hyperoxia-induced suppression of cold sensor activity. This hyperoxia-
induced depression of ~ 0 2 was also observed by MacCanon and Eitzman (1961) during
prolonged hyperoxic exposure f humans to cold air. A common conditin in both above
studies was the absence of any change in body temperature during cold exposure, despite
a significant reduction in heat production. According to Froese (1958), thermal balance
may have been maintained during the hyperoxic condition by the vasoconstrictive effect
of 02, which may have reduced heat loss from the skin.
The present study was undertaken to examine the hypothesis that hyperoxic gas .
breathing by subjects immered in cold water in a compressed air environment produces an
increase in core cooling rate. It was a10 hypothesized that a hyperoxia related alteration in
thermal afferent information would be reflected in a subjects thermal perception.
METHODS
The present study was designed to examine the effect of hyperoxia, associated with
compressed air breathing, on the human thermoregulatory response to immersion in cold
water. In order to eliminate the effects of pressure and nitrogen narcosis, the hyperoxia
present at 5 ata air breathing (PO? = 1 atm) was simulated by having the subject to inspire
100% 0, at 1 ata.
Su hjects
Seven healthy male subjects participated in the study, their participation was previously
approved by an attending physician. Their age was 25.6 * 2.8 years (mean * SD), height
177.6 * 8.5 cm and weight 73 k 10.7 kg. All subjects were familiarized with experimental
protocol, which was approved by an institutional review process, and each subject was
aware that he could withdraw from the study at any time.
Protocol
All subjects participated in two experimental trials, one breathing air and the other
breathing 100% 02. The order of the two trials was random and immersions were spaced
one week apart to avoid any effects of adaptation to hypothermia. In order to avoid the
effect of circadian rhythm, subjects performed each immersion at the same time of day.
The subject wore only a swim suit and was instrumented and seated in a chair
harness suspended above the immersion water tank A twenty minute rest period before
immersion was scheduled to allow tissue to saturate with oxygen in the hyperoxia trial.
During this latter period, expired C 0 2 and O7 values were recorded and they stabilized
within a maximum of 18 minutes. This is in accordance with the literature, which suggests
that 10 minutes of pure oxygen breathing plus 5 minutes of light exercise is sufficient for
nitrogen wash-out (Welch 1981). A twenty minute rest period was also incorporated in
the air trials. Cylinders containing the compressed gas were masked and subjects were not
informed of the breathing mixture administered. Four subjects received 100 % O2 in the
first trial, and air in the second trial, while the remaining three subjects received gas in the
alternate order. Prior to the commencement of each hyperoxia trial, the respiratory circuit
(mixing box, respiratory tubes and humidification system) was flushed with 100 %
o.,.rcy, arc! rho inAnvit>, =. d t h ~ ry+- - to ry circuit was evaluated by monitorin0 t h p n-
content within the circuit during the flushing phase. Precaution was taken to eliminate
any possibility of air leaking into the respiratory circuit.
Following the 20 minlite rest period, the subject was lowered rapidly into 20•‹C
water up to the neck. The subject remained immersed in continuously stirred water for
one hour. An immersions was terminated when esophageal temperature decreased to
35"C, or by 2•‹C from the preimrnersion value. Upon completion of the immersion, all
transducers were removed and the subject was assisted to a hot tub, for rewarming. The
subject remained in hot (around 40•‹C) and stirred water until he rewarmed completely.
Instrunten tntion
Skin temperature
Skin temperature (Tsk) was monitored with thermistors (Concept Engineering, USA,
model #FR-025-TH44018) attached to the skin with waterproof tape (Elastoplast, Smith
and Nephew, Lachine, Quebec) to minimize movement of the sensors and prevent water
from penetrating during immersion. Unweighted mean skin temperature (T sk) was
determined from skin temperature measurement made at four sites: chest (left lateral, mid-
clavicular line at the second intercostal space), left upper arm (upper anterior aspect, mid
portion), left thigh (anterior surface, mid portion) and left calf (lateral aspect, mid
portion).
Esophageal tertperatrire
Esophageal temperature (Tes) was obtained with a YSI 401 thermistor probe (Yellow
Springs Instruments, Yellow Springs, OH, USA) inserted through a nostril into the
esophagus, to the level of the left ventricle. Tes was used to estimate body core
temperature.
Vetrtilntioti and expired gas cotitetit
Both breathing gases, air (0.03% CO-,, 20.93% 02, 79.04% N-,) and 100% O-, were
humidified prior to inspiration by passing them through a water bath at room
temperature. The water bath was tightly covered with a meteorological balloon, in order
not to allow leakage and to provide a steady flow of breathing gas to the inspiratory side
of the breathing circuit. The top of the meteorological balloon was connected to a
ventilation meter (Alpha Technologies Ventilation Module, Model VMMl10, Laguna
Hills, CA, USA) which was connected with 135 cm of corrugated respiratory tubing
(Collins) to the inspiratory side of a one-way respiratory valve. Expired gas was directed
via 225 cm of corrugated tubing to a 5 L fluted Plexiglass mixing box. A continuous 0.5
L. min-' sample of gas was drawn from the mixing box for analysis of the O2 and CO,
content of the mixed expired gas using Ametek O2 and CO-, analyzers, respectively
(Ametek Systems, Pittsburgh, PA, USA). ~0~ was calculated based on measurements of
vl and the 0, - and CO, content of the expired gas at 10 second intervals. The 10 second
values throughout each minute were averaged to provide a minute value.
Heart rate
Heart rate was recorded with a Physio-Control Systems (Washington, USA)
electrocardiograph and assessed from an ECG trace obtained from three pre-gelled
electrodes, two placed laterally on the chest and one on the mid portion of the right
scapula.
Perception of thrnnal corr2fort
Each subject rated his perception of thermal comfort at 5 minute intervals, on a 2 1-point
scale (Enander et al. 1979), where +10 was defined as "very very hot", 0 as "neutral" and
- 10 as "very very cold". In addition, a 5-point scale (Chattonet and Cabanac 1965) was
used for sensation of thermal comfort, where +2 indicates "very pleasant", 0 indicates
"neutral" and -2 "very unpleasant".
Data acquisition
All variables including vI were continuously sampled and recorded on-line at 10-sec
intervals, using a data acquisition system (Hewlett Packard 3497A) and Labview 2.1
software (Labview, National instruments) on a Macintosh I1 computer (Apple Computer,
Inc., Cupertino, CA, USA).
Data analysis
A repeated measures analysis of variance with two factors (subjects and condition) on
each of the 6 variables: Tes, Tsk, v 0 2 , v C02 , v I and HR were performed for the resting
and immersion phase. During the resting phase the measurements were repeated 5 times,
each observation corresponding to 1 minute of the rest period. During the immersion
phase, the first observation was made during the sixth minute of immersion, after the
initial dynamic response of all variables upon immersion had stabilized. The initial
dynamic ~0~ response was analyzed separately. The area under the curve of the initial
increase in ~0~ was analyzed for the maximal peak, width and surface area. Linear
regression analysis of the linear portion of the Tes cooling response was performed
separately for each subject. The individual slopes of the Tes response were then
statistically compared between the experimental conditions with a Student paired t-test.
The linear portion of the Tes cooling curve was determined from the time during
immersion when a steady fall in Tes was observed until the end of immersion. The slopes
of the A VO~/AT,, relation for the two conditions, reflecting the gain of the shivering
response, were also compared between the two experimental conditions with a Student
66
paired t-test. AVO? and ATes represent the change relative to the preimmersion value.
The difference between the rating of thermal perception and sensation of thermal comfort
respectively for the two conditions, was compared with a Wilcoxon signed rank test.
RESULTS
Skit1 ternperotrrre
After a rapid drop immediately upon immersion, skin temperature stabilized quickly,
attaining a similar end immersion value in both trials. sk was 20.7 * 1.3OC when
breathing air and 20.9 * 1.3"C when breathing 100% 0,. There was no significant
difference in f sk between the trials during the rest period preceding immersion (air: 3 1.2
O.Z•‹C; hyperoxia: 30.5 * 0.7"C).
~op/zngetrl retrpermrre
All immersions were 60 minutes duration and Tes never decreased below 35•‹C (Fig. 2-1).
The average decrease in Tes in the air trial was 1.05 * 0.29'C and in the hyperoxia trial
1.08 * 02 l0C (Table 2-1). The rate of core cooling (T es, "c-K'), obtained from the linear
portion of the Tes response was not different between the trials (air: -1.27 * 0.09 "c-h-';
hyperoxia: -1.14 0.07 "c-K' ; p > 0.05; Table 2-2).
Itrspired vetrtilotiorr, carbotl dioxide yrotlrictiotr card oxygetr comittlpriotl
The group mean vI showed a similar value during five minutes of rest (p > 0.05) before
each trial. An initial hyperventilation due to the cold peripheral stimuli upon immersion
was obbei ved in 5 b ~ j t X t S . I I I L ~ I U ~ J ma11 L', ailCI iiic iirst 5 1ni1~ of iiumersion until
the end of the experiment attained the following values: 26.89 * 1 1 8 1 L min-I during air
breathing and 24.66 * 10.23 L. mi;' in the hyperoxia trial (Fig. 2-2). The difference
between conditions was not significant.
The group mean value of carbon dioxide production (VCO?) in the two trials was
not significantly different (air: 0.86 t 0.2 L min-I; hyperoxia: 0.85 * 0.1 L- mi;'). Fig. 2-
3 shows the m e a n ~ c 0 ~ response of seven subjects in the air and hyperoxia trial until the
end of immersion.
The group mean peak oxygen uptake V O ~ immediately after immersion was 1.86
* 0.67 L. mi;' in the air trial and 1.74 * 0.57 L - mi;' in hyperoxia. The area under the
curve of the initial dynamic ~ 0 2 response upon immersion was analyzed separately and
yielded the following results: the mean length of the v o2 transient response was 2.0 * 0.1 min in air and 1.91 * 0.1 min in the hyperoxia trial; the mean oxygen uptake volume
(area) was 9.93 * 1.62 L in the air trial and 11.04 * 3.2 L in the hyperoxia trial. No
significant difference in the width, maximal peak nor volume of the dynamic v 0,
response was found (p > 0.05). The group mean stable immersion ~0~ was 0.89 * 0.45
L- min-1 in the oxygen trial and 1 .OO * 0.49 L. min-1 in the air trial. There was no
significant difference between these values (p > 0.05). The mean oxygen uptake for seven
subjects during head out immersion breathing air and 100% O2 is shown in Fig. 2-4.
The gain of the shivering response determined from the relation A V O ~ J A T ~ ~ , is
shown in Table 2-3. The average slope of A V O , J A T ~ ~ was not different between the
trials (air: -0.41 k 0.3 1 ~ . m i i ' .'c"; hyperoxia: -036 * 0.24 L. m i n ' l 0 ~ - ' ; p > 0.05).
Hem-1 rtrte
Heart rate (Fig. 2-5) was consistently and significantly lower (p i 0.05) in the hyperoxia
trial (71 *18 min-') compared with the air trial (79 * 20 mi;').
T/wtrml perceptior~ arm! serisatiori of corrrfort
The thermal perception and sensation of comfort data was compared between the two
trials at standard ATeSLs of 0.5 and 075•‹C decrease in core temperature. No significant
difference in perception of thermal comfort was found for these degrees of temperature
change (p > 0.05). Since only three subjects cooled by 1•‹C in both trials, statistical
comparison for a 1•‹C decrease in core temperature was not possible. Fig. 2-6 represents
the mean values for seven subjects of the thermal perception vote at ATes = -0.5"C.
DISCUSSION
The present study demonstrates that an imposed hyperoxia of 5 ata air breathing does not
significantly affect shivering thermogenesis and perception of thermal comfort during cold
water (20•‹C) immersion. This conflicts with previous reports, showing that both
intermittent inhalation of 100% O2 (Froese 19%) or prolonged hyperoxia (MacCanon and
Eitzman 196 1) reduce metabolism during cold air exposure and improve the perception of
thermal comfort
While nitrogen has an anesthetic effect in air, even at normal atmospheric pressure
(Winter et al. 1975) which is potentiated at increased pressure, hyperbaric oxygen is
widely agreed to be toxic and to cause convulsions and pulmonary damage above 3 ata.
Therefore, a possible mechanism by which O2 may interfere with neural transduction of
thermal information, axonal propagation rate and central processing of thermal afferent
information must be discussed in terms of both the toxic and anesthetic properties of an
elevated POz. The level and duration of the hyperoxic exposure in the present study, as
well as in the studies of Froese ( 1958) and MacCanon and Eitzman ( I96 I), was probably
insufficient to give rise to a deleterious change in neural fbnction and brain metabolism.
69
Based on relative lipid solubility, oxygen is about twice as soluble as nitrogen, and
therefore should be at least twice as potent a narcotic Unlike N2 or N20, 0 2 is used in
oxidative processes of the metabolism in the body. Therefore, tissue PO2 will not '
equilibrate with inspired 0 2 or even arterial O2 as in the case of PN2 and PN20. Paton
(1967) and Smith and Paton (1976) demonstrated in mice that the ratio of the partial
pressures of 0 2 and N2 which produce anesthesia is 2.6, indicating a greater anesthetic
potency of 0 2 . This has been shown in humans by Hesser et al. (1978) who
demonstrated a 10% decrement in arithmetic performance of divers exposed to either air
or PO2* = 1.7 atm. When the same group of divers was exposed to compressed air at 8
ata (PN2 = 6.35 atm; PO2 = 1.65 atm) the effect of N2 alone on the performance caused a
decrease of 10% compared with breathing pure oxygen at 1.7 ata (PO2 = 1.7 atm). This
suggests that for producing similar degrees of decrement in mental hnction, PN2 must be
3 to 4 times greater than PO2.
Froese (1958) showed that inhalation of 95% 0 2 at normal room temperature
(25•‹C) did not impair oxygen consumption in normally dressed subjects, but during
exposure to cold room air (lO•‹C), the intermittent inhalation of 95% 0 2 significantly
lowered oxygen consumption. Since the rectal temperature was not altered, peripheral
vasoconstriction was suggested as the means for maintaining thermal balance. It was
suggested that an increased oxygen pressure might modi@ the metabolic response to cold
by affecting the temperature receptors of the skin A study by MacCanon and Eitzman
(1961) also showed a reduced oxygen consumption, produced less shivering and less
thermal discomfort in prolonged hyperoxia during cold air exposure. The discrepancy of
this result with the present ~ 0 2 results might be due to the Douglas bag method which
the former authors used for gas collection. This method has been proven to underestimate
the ~ 0 2 values in hyperoxia (Welch and Pedersen 198 1). It is also possible that the
greater thermal stimulus provided by immersion in 20•‹C water as in the present study
compared with exposure to 10•‹C air, as in the above studies, may have overridden any
70
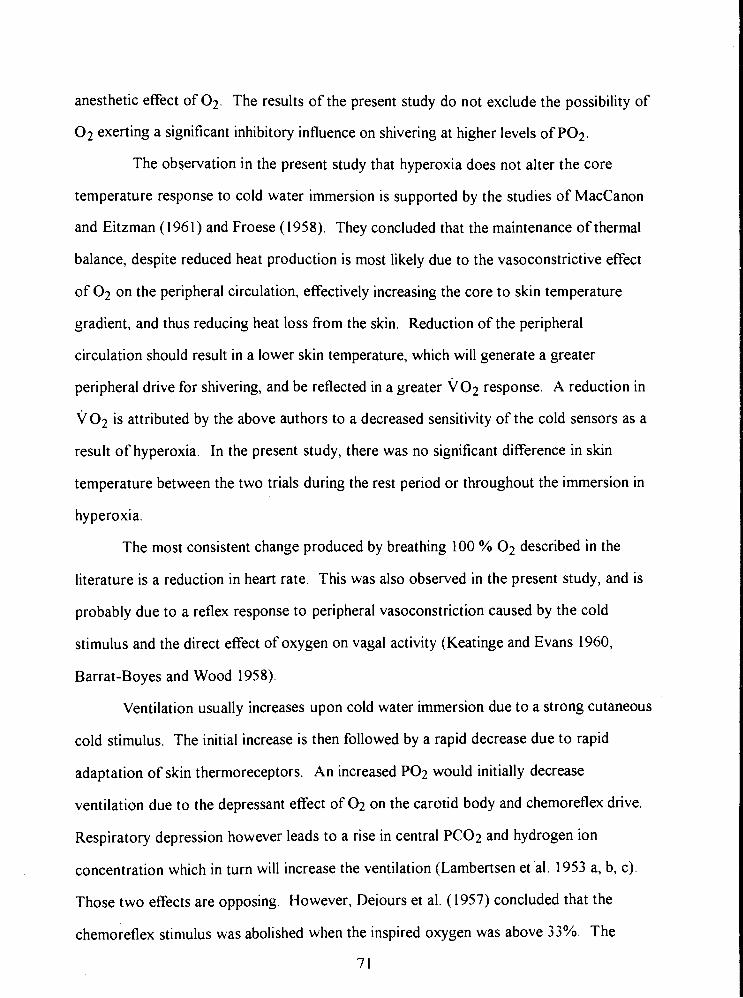
anesthetic effect of 02. The results of the present study do not exclude the possibility of
O2 exerting a significant inhibitory influence on shivering at higher levels of PO2.
The observation in the present study that hyperoxia does not alter the core
temperature response to cold water immersion is supported by the studies of MacCanon
and Eitzman (1961) and Froese (1958). They concluded that the maintenance of thermal
balance, despite reduced heat production is most likely due to the vasoconstrictive effect
of 0 2 on the peripheral circulation, effectively increasing the core to skin temperature
gradient, and thus reducing heat loss from the skin. Reduction of the peripheral
circulation should result in a lower skin temperature, which will generate a greater
peripheral drive for shivering, and be reflected in a greater ~ 0 2 response. A reduction in
~0~ is attributed by the above authors to a decreased sensitivity of the cold sensors as a
result of hyperoxia. In the present study, there was no significant difference in skin
temperature between the two trials during the rest period or throughout the immersion in
hyperoxia.
The most consistent change produced by breathing 100 % O2 described in the
literature is a reduction in heart rate. This was also observed in the present study, and is
probably due to a reflex response to peripheral vasoconstriction caused by the cold
stimulus and the direct effect of oxygen on vagal activity (Keatinge and Evans 1960,
Barrat-Boyes and Wood 1958).
Ventilation usually increases upon cold water immersion due to a strong cutaneous
cold stimulus. The initial increase is then followed by a rapid decrease due to rapid
adaptation of skin thermoreceptors. An increased PO2 would initially decrease
ventilation due to the depressant effect of 0 2 on the carotid body and chemoreflex drive.
Respiratory depression however leads to a rise in central PC02 and hydrogen ion
concentration which in turn will increase the ventilation (Lambertsen et al. 1953 a, b, c)
Those two effects are opposing. However, Deiours et al. (1957) concluded that the
chemoreflex stinulus was abolished when the inspired oxygen was above 33%. The
7 1
present results show an initial increase in V, upon cold water immersion in both
conditions, then a decrease, and an eventual end immersion value which is not significantly
different between the conditions of the present experiment.
The present findings also show that at a PO2 = 1 atm, the central drive for
shivering, expressed by the relation A V O ~ I A T ~ ~ is not affected by hyperoxia (Table 2-3).
This study also demonstrates that perception of thermal comfort is not impaired during
100 % O2 breathing. This is not in agreement with results of MacCanon and Eitzman
(1961), whose subjects felt less thermal discomfort in hyperoxia, and Goldscheider and
Ehrmann (1924), who reported that O2 applied externally to the finger would lower the
threshold for the sensation of warmth by 5 to 7•‹C.
In conclusion, though 0 2 has been reported to impair the thermoregulatory
response to mild cold exposure in air, the present results show no significant attenuation
of thermoregulation during cold water immersion. Thus, it is unlikely that the attendant
hyperoxia of compressed air, equivalent to the hyperoxia of the present study, would
contribute significantly to impairment of the thermoregulatory response and perception of
thermal comfort. Any depressant effect on heat production mechanisms in a compressed
air environment, is more likely to be due to an increased PN2 than an increased PO2.
REFERENCES
Barrat-Boyes BG, Wood EH: Cardiac output and related measurements and pressure values in the right heart and associated vessels, together with an analysis of the hemodynamic response to the inhalation of high oxygen mixtures in healthy subjects, J Lab C l i n Me4 5 1 : 72-90, 1958.
Bennett PB, Ackles KN: The narcotic effects of hyperbaric oxygen, 4th lt i t Con Hyperbaric bled, Sapporo, Japan, pp: 74-79, 1969
Chattonet J, Cabanac M: The perception of thermal comfort, 1t1t JBiometeor, 9: 183-193, 1965.
Dejours P, Labrousse Y, Raynaud J, Teillac A: Stimulus Oxygene chemoreflex de la ventilation a basse altitude (50m) chez I'homme, JPhysiol (Paris), 49: 115, 1957.
Enander A, Ljungberg AS, Holmer I: Effect of work in cold stores of man, Scatld J Work Etlvirotl Health, 5: 195-204, 1979.
Froese G: Effects of breathing 0 2 at one atmosphere on the response to cold in human subjects, JAppl Physiol, 13 :66-74, 1958.
Goldschneider A, Ehrmann R: Untersuchungen Uber den Temperatursinn, PfIlrgers Archiv firr die gesanite Physiologie des Mem; 206 : 3 03 -3 07, 1 924.
Hayward JS, Keatinge WR: Progressive symptomless hypothermia in water: Possible cause of diving accidents, Brit MedJ, 1 : 1 182, 1979.
Hesser CM, Fagraeus L, Adolfson J: Roles of nitrogen, oxygen and carbon dioxide in compressed air narcosis, Undersea Bionied Res, 5(4): 39 1-400, 1978.
Keatinge WR, Evans M: The respiratory and cardiovascular response to immersion in cold and warm water, * 1960.
Keatinge WR, Hayward MG, McIver NKI: Hypothermia during saturation diving in the North Sea, Brit Med J, 29 1, 1980.
Lambertsen CJ, Kough RH, Cooper DY, Emmel GL, Loeschcke HH, Schmidt CF: Comparison of relationship of respiratory minute volume to pC02 and pH of arterial and internal jugular blood in normal man during hyperventilation produced by low concentrations of C02 at 1 atmosphere and by 0 2 at 3.0 atmospheres, JAppl Physiol, 5(9):803-8 13, 1953a.
Lambertsen CJ, Kough RH, Cooper DY, Emmel GL, Loeschcke HH, Schmidt CF: Oxygen toxicity. Effects in man of oxygen inhalation at 1 and 3.5 atmospheres upon blood gas transport, cerebral circulation and cerebral metabolism, J Appl Physiol, 5(9):47 1-485, 1953b.
Lambertsen CJ, Stroud MW, Gould RA, Kough RH, Ewing JH, Schmidt CF: Oxygen toxicity. Respiratory responses of normal men to inhalation of 6 and 100% oxygen under 3.5 atmospheres pressure, JApplPhysiol, 5(9):487-494, 1953~.
MacCanon DM, Eitzman DD: Effects of oxygen inhalation on responses to cold exposure, J Appl Physiol, 16: 627-632, 196 1
Mekjavic IB, Sundberg CJ: Human temperature regulation during narcosis induced by inhalation of 3O?6 nitrous oxide, JAppl Physiol, 73:2246-2254, 1992.
Passias TC, Mekjavic IB, Eiken 0: The effect of 30% nitrous oxide on thermoregulatory responses in humans during hypothermia, At~esthe.s iol~, 76:550-559, 1992.
Paton WDM: Experiments on the convulsant and anaesthetic effects of oxygen, Br J Pharntac C'hemother, 29: 3 50-366, 1967.
Smith RA Paton WDM: The anesthetic effect of oxygen, Atlesth Atlalg, 55(5): 734-736, 19-Ib.

Webb P: Body heat loss in undersea gaseous environments, Aerosynce Med, 41(11): 1282-1288, 1970.
Welch HG, Pedersen PK: Measurement of metabolic rate in hyperoxia, JAppl Physiol, 51:725-731, 1981.
Winter PM, Bruce DL, Bach MJ, Jay GW, Eger EI: The anesthetic effect of air at atmospheric pressure, Anesthesiology, 42(6): 658-66 1, 1975.

TABLES AND FIGURES
AIR
Table 2-1: Individual maximal decrease in Tes (ATes) in 7 subjects when breathing air
and 100% O2 during head out immersion in 20•‹C water. The group mean difference
between conditions was not significant.
7
M ean
0.86
1 .05
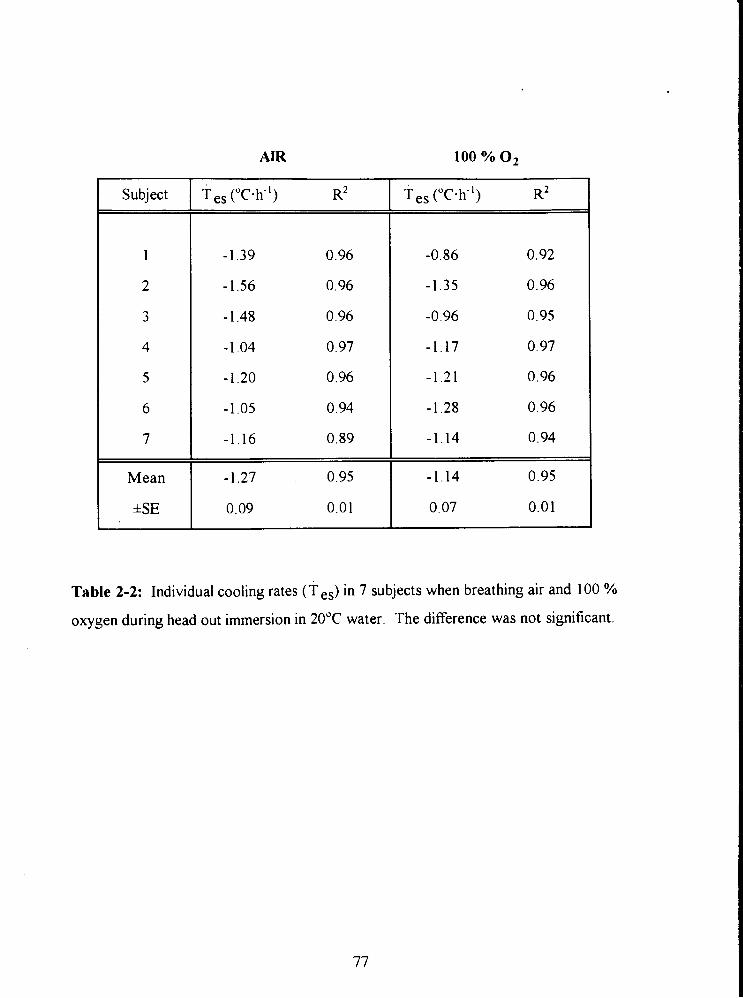
AIR
Subject
Mean
*SE
Table 2-2: Individual cooling rates (T ,,) in 7 subjects when breathing air and 100 %
oxygen during head out immersion in 20•‹C water. The difference was not significant.
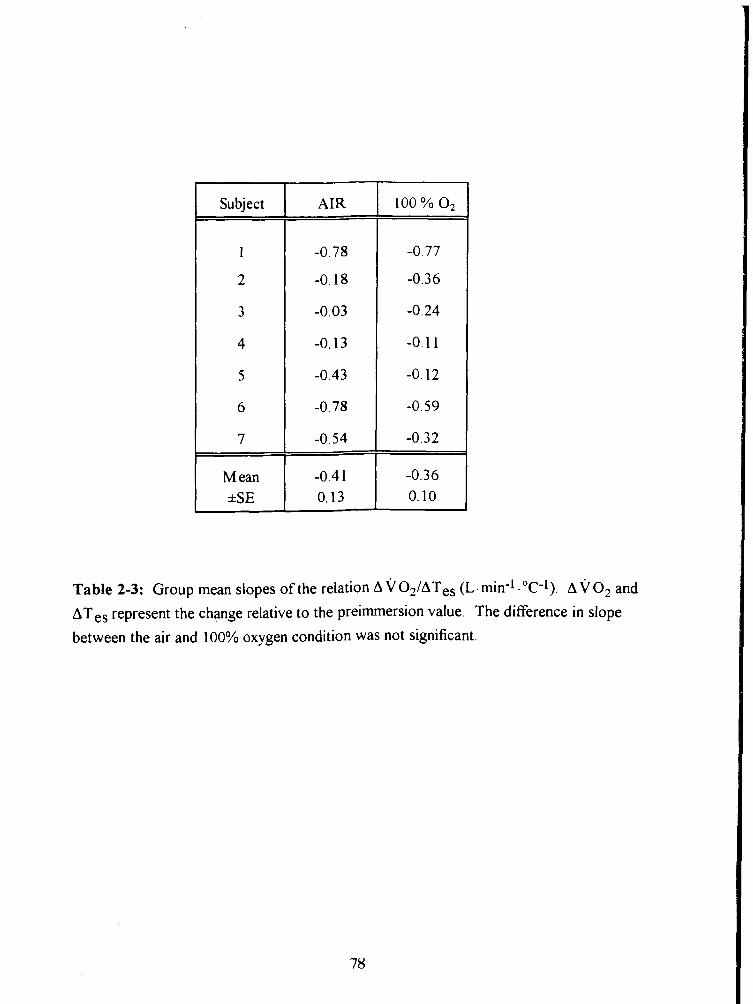
Subject
1
2
3
4
5
6
7
M ean *SE
AIR
Table 2-3: Group mean slopes of the relation A v O ~ I A T ~ , (L - min-I . OC-1). A v o2 and
ATes represent the change relative to the preimmersion value. The difference in slope
between the air and 100% oxygen condition was not significant.
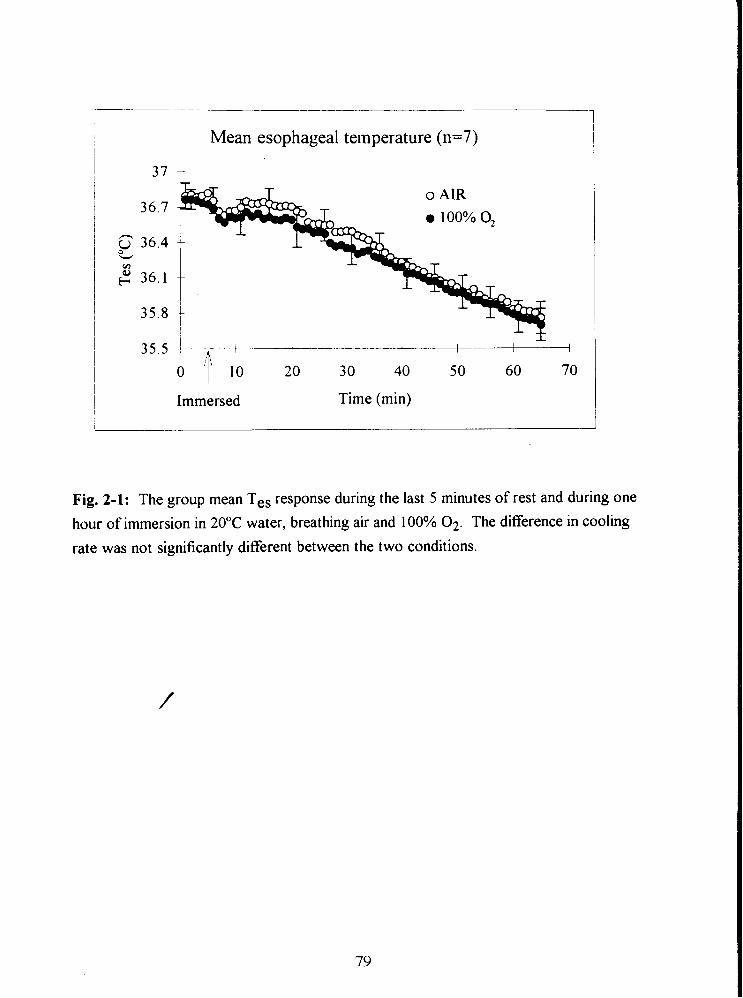
I Mean esophageal temperature (n=7)
Immersed Time (min)
Fig. 2-1: The group mean Tes response during the last 5 minutes of rest and during one
hour of immersion in 20•‹C water, breathing air and 100% 02. The difference in cooling
rate was not significantly different between the two conditions.
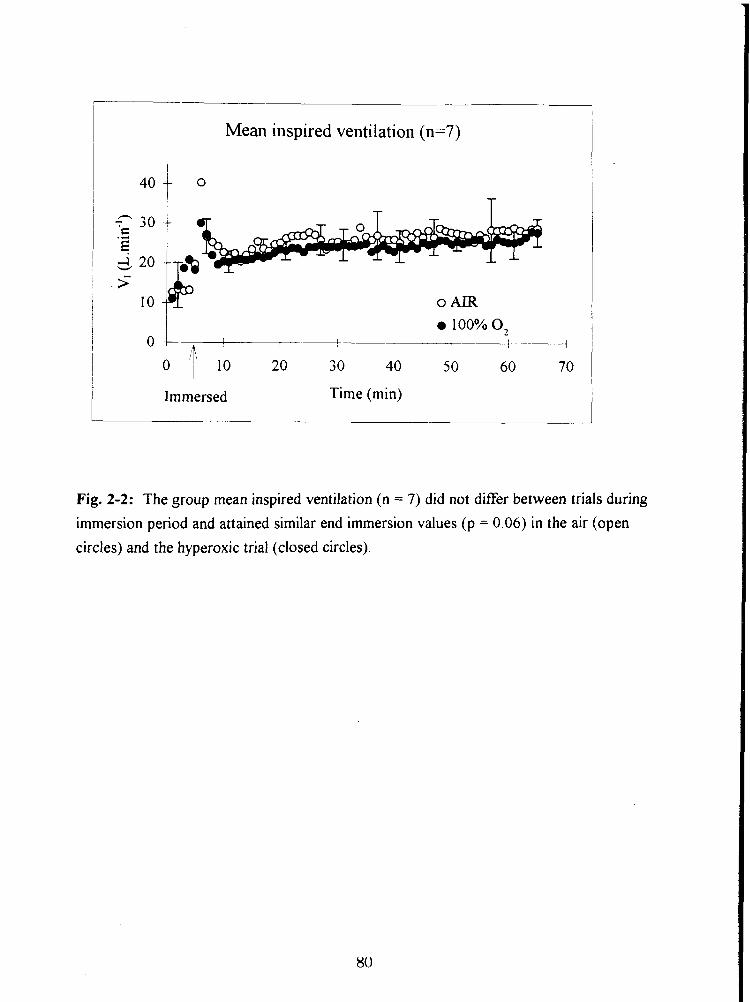
Mean inspired ventilation (n=7)
o AIR
0 ' ~ ' 10 20 30 40 50 60 70
Immersed Time (min)
Fig. 2-2: The group mean inspired ventilation (n = 7) did not differ between trials during
immersion period and attained similar end immersion values (p = 0.06) in the air (open
circles) and the hyperoxic trial (closed circles).
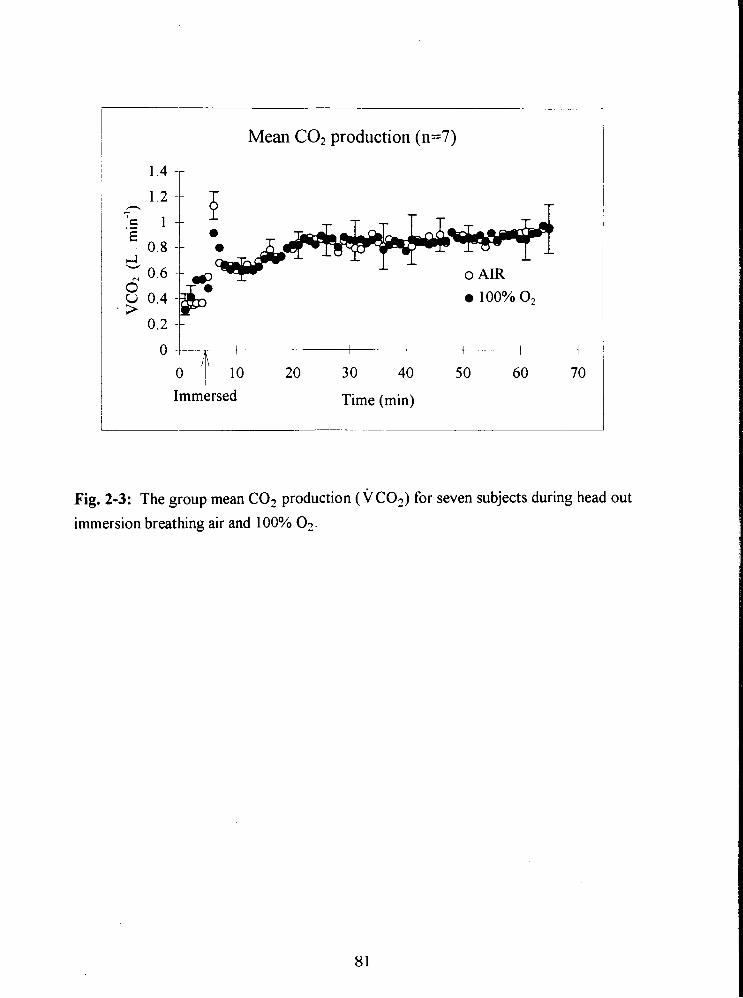
Mean C02 production (11=7)
1.4 -r
Immersed Time (min)
Fig. 2-3: The group mean C 0 2 production (VCO?) for seven subjects during head out
immersion breathing air and 100% 0 2 .
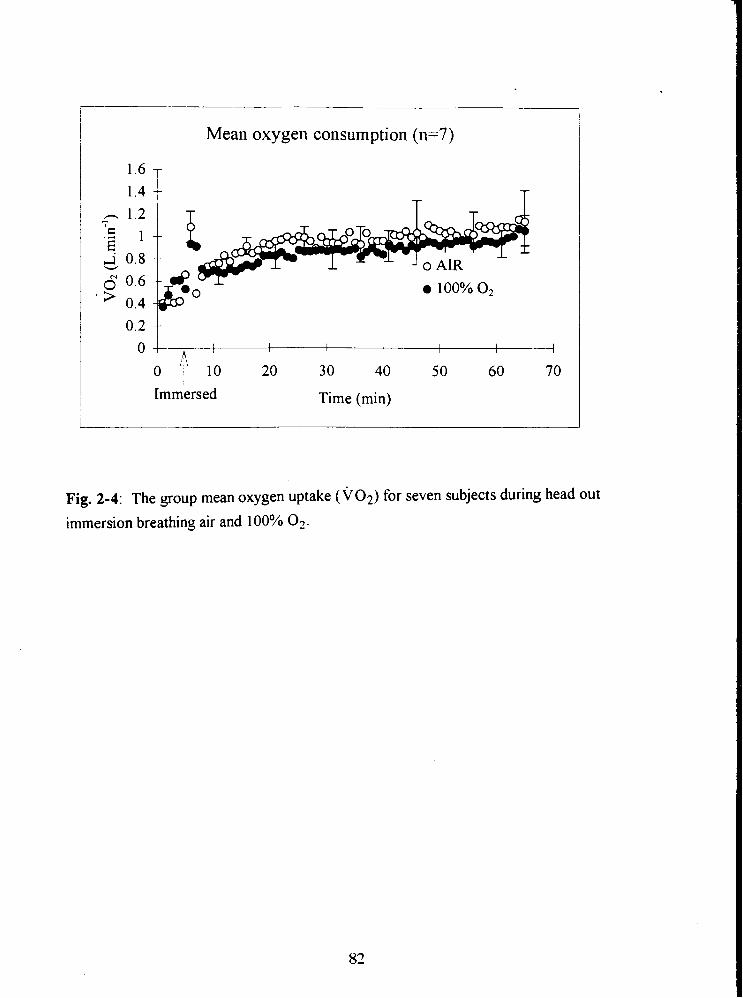
Mean oxygen consumption (n=7)
0 4 I I 1 I I I I 4
o 1b 20 30 40 50 60 70
Immersed Time (min)
Fig. 2-4: The group mean oxygen uptake ( ~ 0 ~ ) for seven subjects during head out
immersion breathing air and 100% 02.
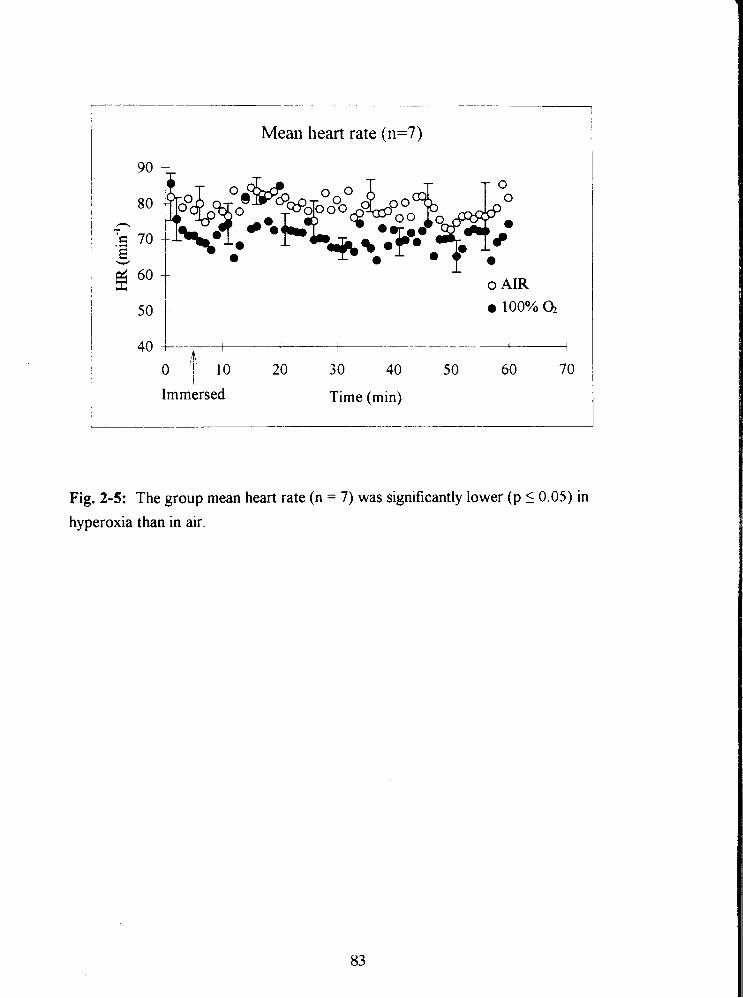
- --
Mean heart rate (n=7)
o AIR
I L I 1 I I
F ,b I
O i 20 30 40 5 0 60 70
Immersed Time (min)
Fig. 2-5: The group mean heart rate (n = 7) was significantly lower (p 1 0.05) in
hyperoxia than in air.
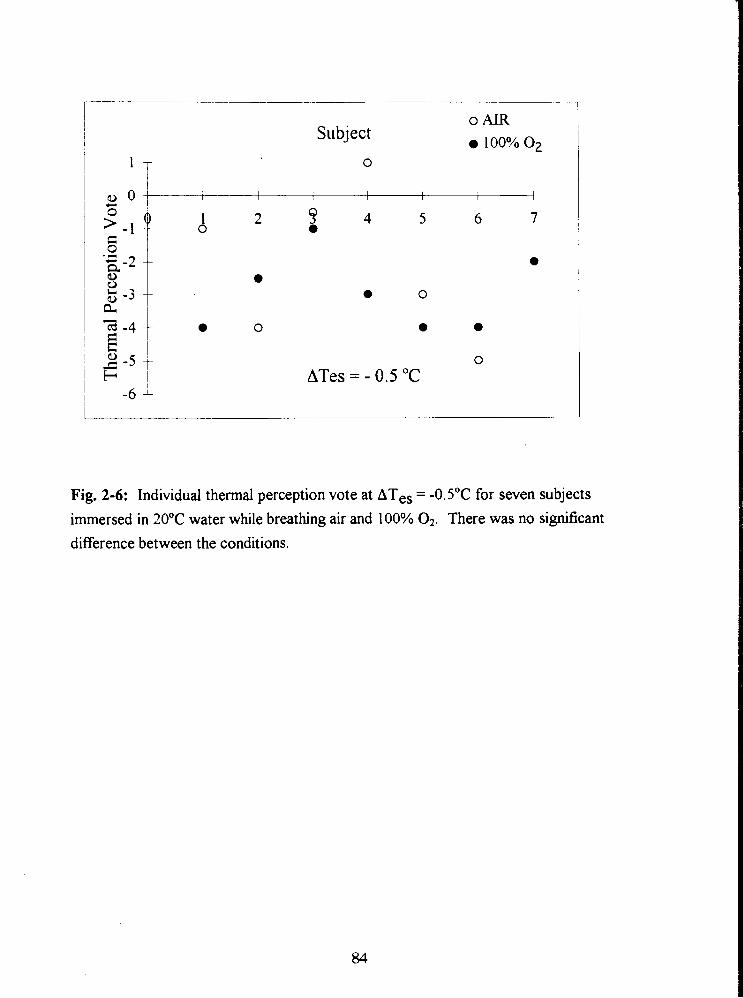
Subject 0 AIR
100% o2
ATes = - 0.5 "C
Fig. 2-6: Individual thermal perception vote at ATes = -0.5"C for seven subjects immersed in 20•‹C water while breathing air and 100% 02. There was no significant difference between the conditions.
STUDY 111
THE THERMOREGULATORY RESPONSE OF HUMANS TO COLD WATER
IMMERSION DURING COMPRESSED AIR BREATHING AND INHALATION OF
30% NITROUS OXIDE
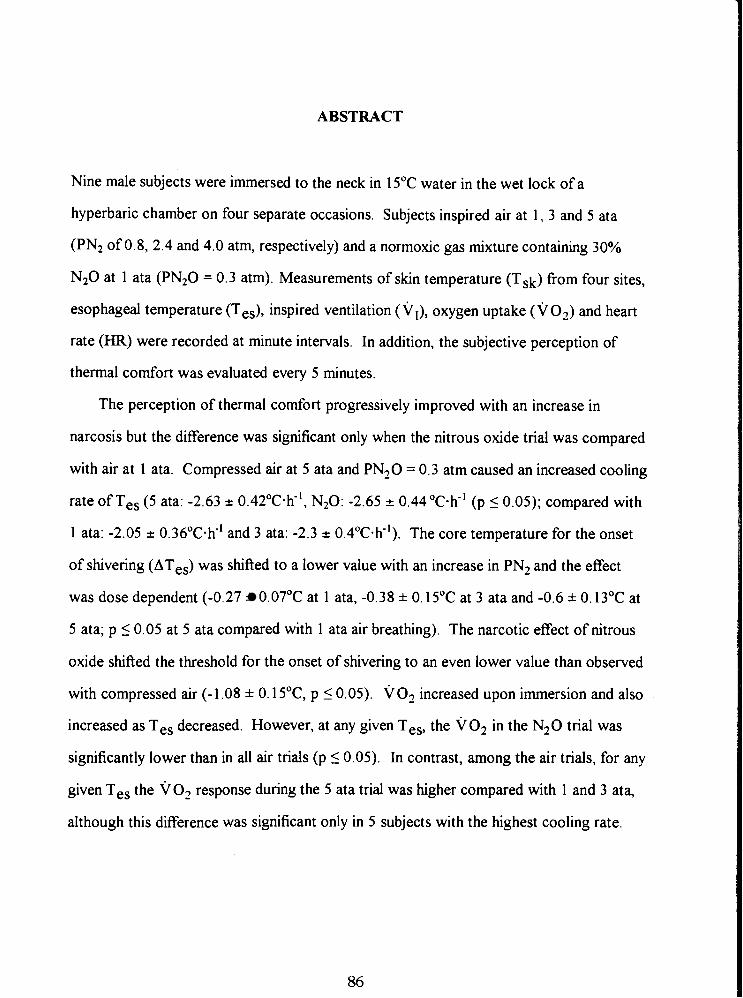
ABSTRACT
Nine male subjects were immersed to the neck in 15•‹C water in the wet lock of a
hyperbaric chamber on four separate occasions. Subjects inspired air at 1, 3 and 5 ata
(PN2 of 0.8, 2.4 and 4.0 atm, respectively) and a normoxic gas mixture containing 30%
N20 at 1 ata (PN20 = 0.3 atm). Measurements of skin temperature (Tsk) from four sites,
esophageal temperature (Tes), inspired ventilation ( v ~ ) , oxygen uptake ( ~ 0 , ) and heart
rate (HR) were recorded at minute intervals. In addition, the subjective perception of
thermal comfort was evaluated every 5 minutes.
The perception of thermal comfort progressively improved with an increase in
narcosis but the difference was significant only when the nitrous oxide trial was compared
with air at 1 ata. Compressed air at 5 ata and PN,O = 0.3 atm caused an increased cooling
rate of Tes (5 ata: -2.63 2 0.42"~.h-', NzO: -2.65 2 0.44 "c-h-' (p 5 0.05); compared with
1 ata: -2.05 _+ 0.36"c.h-' and 3 ata: -2.3 A 0.4"~.h-'). The core temperature for the onset
of shivering (ATes) was shifted to a lower value with an increase in PN, and the effect
was dose dependent (-0.27 0.07"C at 1 ata, -0.38 * 0.15"C at 3 ata and -0.6 * 0.13"C at
5 ata; p 5 0.05 at 5 ata compared with 1 ata air breathing). The narcotic effect of nitrous
oxide shifted the threshold for the onset of shivering to an even lower value than observed
with compressed air (-1.08 * 0. ls0C, p i 0.05). VO, increased upon immersion and also
increased as Tes decreased. However, at any given Tes, the VO, in the N20 trial was
significantly lower than in all air trials (p 5 0.05). In contrast, among the air trials, for any
given Tes the VO, response during the 5 ata trial was higher compared with 1 and 3 ata,
although this difference was significant only in 5 subjects with the highest cooling rate.
INTRODUCTION
Hypothermia in divers is one of the main hazards in deep commercial diving (Keatinge et
al. 1980, Hayward and Keatinge 1979) and has been identified as a cause of fatalities.
During diving, divers are exposed to the high convective/conductive heat capacity and a
low temperature of the aqueous environment, which induces a major drain of heat from
the body surface (Bridgman 1990, Webb 1982, 1970) and respiratory tract (Piantadosi et
al. 198 1). Padbury et al. (1987) observed that a diver performing a simulated wet dive in a
hyperbaric chamber was unaware of his falling body temperature, thus he did not elevate
the temperature of his breathing gas nor did he exhibit any thermogenic responses.
In Study I of this thesis, subjects perceived cold water immersion at 6 ata
consistently more thermally comfortable than at 1 ata, despite the greater core cooling
observed during the hyperbaric experiment Other investigators have also observed that
narcosis impairs a person's perception of thermal status (Pertwee et al. 1990, 1986) and
thus their ability to initiate any effective countermeasure, exacerbating the progression to
hypothermia (Keatinge, Hayward and McIver 1980, White et al. 1980, Hayward and
Keatinge 1979).
Study I1 demonstrated, that breathing 100% oxygen at 1 ata did not alter
thermoregulatory response (Savic and Mekjavic 1994). Hence this suggests that an
accelerated core cooling rate and improved perception of thermal comfort observed in
subjects immersed at 6 ata (Study I), are due to a pressure related narcotic effect of
nitrogen. It has been shown that the alteration of thermal perception and shivering
response are also induced by inhalation of a general anesthetic (Giesbrecht 1994, Lopez et
al. 1994, Vassilieff et al. 1994, Kurz et a1 1993, Sessler 1991, Hammel 1988), and a sub-
anesthetic concentration of nitrous oxide (Cheung 1993, Mekjavic and Sundberg 1992,
Passias ct a1 1992) T!i, .,' :. cf the present study was to investigate w h z h r t h ~ ,r,het of
hypothermia among compressed air divers was accelerated due not only to an extensive
heat loss, but also to an attenuated heat production.
Comparative behavioural studies using nitrous oxide and hyperbaric air have shown
that 30% N 2 0 in a normoxic air mixture induces psycho-motor impairment similar to
compressed air at 6.7 ata (Biersner 1987, Biersner et al. 1977). The anesthetics used in
clinical practice such as nitrous oxide, ethylene and cyclopropane are considered inert
(Featherstone and Muehlbaecher 1963), and seem unlikely to have a different mechanism
of action than N2 (Carpenter 1954). The concentration of anesthetics used clinically far
exceeds the narcotic potency of N2 in compressed air diving. There are, however, some
reports which suggest that inhalation anesthetics act directly and negatively on
cardiovascular thermoregulation by suppressing the onset threshold for initiation of an
effective regulatory response (Kurz et al. 1993, Sessler 1991).
The oxygen consumption data from Study I were not sufficient to determine
whether the observed increase in core cooling at 6 ata is due to increased heat loss or
decreased heat production. This study was, therefore, designed to investigate whether an
elevated level of PN, (2.4 and 4.0 atm) suppresses thermoregulatory shivering in the
subject immersed in cold water. A second objective was to determine, whether the
improvement of thermal comfort observed at 6 ata (Study I) occurs at lower levels of PN2.
It was postulated that if such an effect on autonomic and behavioural thermoregulation
exists, it would be dose dependent. The study also compared the effect of 30% N 2 0 and
hyperbaric N2 on human responses to cold immersion. Their effect on thermoregulatory
response and perception of thermal comfort is discussed.
METHODS
Nine healthy male subjects participated in a head out immersion in 15•‹C water on four
separate occasions for a maximum of one hour. Their participation was previously
approved by the attending physician. The experimental protocol was approved by the
institutional Ethics Review Committee and the procedure was thoroughly explained to
each subject prior to their participation and informed consent. Subjects were aware that
they could withdraw from the study at any time. All subjects had previous experience
with compression in a hyperbaric chamber. On one occasion subjects inspired a gas
mixture of 30% NzO, 20.93 % O2 and 49.07 % N2 at 1 ata. On other occasions they
inspired air at ambient pressures of 1, 3 and 5 ata. The trials were conducted in a
hyperbaric chamber.
Experimental trials were chosen randomly and were spaced one week apart, to
avoid adaptation to hypothermia. To avoid the effect of circadian rhythm, subjects
performed each immersion at the same time of the day. Once the subject was
instrumented, he sat in a chair suspended above the wet lock of the hyperbaric chamber.
A twenty minute resting period was incorporated in each normobaric trial (air at 1 ata and
normoxic gas mixture with 30% N,O) to allow saturation of the tissue with nitrous oxide.
In hyperbaric trials (at 3 ata PN, is 2.4 atm, at 5 ata P N is 4.0 atm) only a five minute
resting period was allowed once the desired pressure was reached. This change in
protocol was due to the restriction of the total bottom time (45 min at 5 ata and 55 min at
3 ata including compression) in order to limit the decompression requirement. After the
resting period was completed, the subject was immersed in continuously stirred water
while suspended by a pulley system and sat in the water. A normobaric immersion was
terminated after 60 minutes, or when Tes dropped to either 35•‹C or 2•‹C below the pre-
immersion value The subjects was then rewarmed in a warm stirred water bath
maintained at 40•‹C. In all hyperbaric trials subjects were transferred to the main lock for
rewarming in a sleeping bag before decompression commenced.
Skin temperature was measured from four sites (upper arm, chest, thigh, calf) with
YSI 701 thermistor probes (Yellow Springs Instruments, Yellow Springs, OH). Mean
Tsk (T ,k) was obtained by taking the unweighted average of all four sites. A flexible YSI
704 thermistor probe was inserted through subject's nostril into the esophagus, to the
level of the left ventricle, for monitoring the esophageal temperature. Inspired ventilation
was measured by a flow meter (Alpha Technologies Ventilation Module, Laguna Hills,
CA) connected to the inspiratory side of an oronasal mask. In hyperbaric trials the
inspiratory side of the flow meter was open to the chamber atmosphere. In normobaric
trials, the breathing mixture, either air or 30% N20, was delivered from compressed gas
cylinders to a humidification system consisting of a water bath maintained at room
temperature and covered with a Douglas bag (see Fig. 3-1). The outlet from the Douglas
bag was connected to the flow meter. This ensured similar humidity and temperature of
the gas in all trials and reduced respiratory evaporative heat loss to a similar degree in all
four conditions. Expired gas was directed to a 5 L fluted Plexiglass mixing box. A
continuous 0.5 L. min-' sample of expired gas was drawn from the mixing box and
analyzed using O2 and C02 analyzers (Ametek Systems, Pittsburgh, PA). In hyperbaric
trials an additional 5 L mixing box was introduced on the expiratory side outside the
chamber to ensure that a steady gas flow was drawn at constant pressure to the gas
analyzers (see Fig. 3-2). Heart rate was measured from an electrocardiogram (Physio -
Control Systems, Washington, USA) obtained from two precordial electrodes placed
laterally on the chest and a ground electrode on the mid portion of the right scapula. An
electrocardiogram was examined for arrhythmias and heart rate was determined from the
average R-R interval of seven consecutive beats. Subjects rated their perception of
thermal comfort at 5 minute intervals, on a 2 1 -point scale (Enander et al. 1979), where
+I0 was defined as "very very hot", 0 as "neutral" and -10 as "very very cold". The
narcotic potency (NP) of PN2 and PN20 was determined from the Bunsen coefficient
(Bennett 1982, Carpenter 1954) multiplied by the pressure of the gas (atrn). The Bunsen
coefficient (Bc) determines to what extent the gas is soluble (cc.cc") in olive oil
(representing the lipid biomembrane) at 37OC at 1 atmosphere (760 mrnHg). Bc for N2 is
0.067 and for N@ is 1.6 (CC-CC-I). Therefore, the calculated NP of Nz in air at normal
atmospheric pressure (PN2 = 0.8 atm) is NP = 0.067 - 0.8 = 0.0536 cc-cc-'satm. The NP
of 30% N20 normoxic gas mixture inspired at 1 ata (PN20 = 0.3 atm, PN2 = 0.5 atm) is
N P N ~ + N2O = NPN2 + N P ~ ~ ~ = 0.5 1 cc-cc-'.atm, which is equivalent to the narcotic
potency of nitrogen present in compressed air at 9.57 ata (PN2 = 7.66 atrn).
All variables were continuously sampled and recorded at 10-sec intervals, using a
data acquisition system (Hewlett Packard 3497A) and LabView 2.1 software (LabView,
National instruments) on a Macintosh I1 computer (Apple Computer, Inc., Cupertino,
C A).
Data analysis
A one way analysis of variance ANOVA with repeated measures was performed on the -
mean of each of 6 variables: Tes, T VO?, V C O ~ , V ~ and HR for four conditions (1, 3
and 5 ata air and 0.3 atrn N20). Resting values for all variables were determined by
averaging the values recorded during the resting phase. For the analysis during the
immersion phase, the first observation was taken from minute four of immersion, after the
initial dynamic response of all variables due to onset of immersion had stabilized. When a
single significant difference among the mean values was found, a multiple comparison of
means, using a modified Tukey's test, was performed to determine the source of the
difference (Kleinbaum et al. 1988). Linear regression analysis was performed on the linear
portion of the Tes response of each subject separately (Appendix 2, 3-14 and 3-15). The
resulting slopes of the Tes response were statistically analyzed in a one way ANOVA.
The linear portion of the Tes cooling curve was determined from the time of immersion
when a steady fall in Tes was observed until the end of immersion (Appendix 2, Fig. 3-14
and 3-1 5). Also a logarithmic regression was performed on the Tes cooling curve and
tested for parallelism. Similarly, a linear regression and logarithmic regression were
performed on the ~0~ response and the slopes were tested for parallelism. The onset of
shivering was determined from the increase in V O ~ , and the shivering threshold defined as
drop in Tes relative to the resting phase, beyond which all minute VO- measures were
greater than the median v O2 value of the subject at rest (Appendix 2, Fig. 3- 14 and 3- 15).
The shivering threshold values obtained were compared using a one way ANOVA.
Ratings of thermal comfort for the four conditions were compared with a Friedman non
parametric test. For all analyses, the 5% level was chosen as the level of statistical
significance.
Graphid preseritatiotl of t/w data
Due to the restricted immersion time in the hyperbaric exposure some subjects of higher
mass did not establish a steady cooling rate. Therefore, for graphical presentation of the
relationship A V O ~ / A T ~ ~ only 5 subjects (I, 3, 4, 6 and 9 from Table 3-3) who cooled
more than 1•‹C during the time of the shortest immersion (25 minutes) were selected.
Other mean data were also plotted over the time of the shortest immersion.
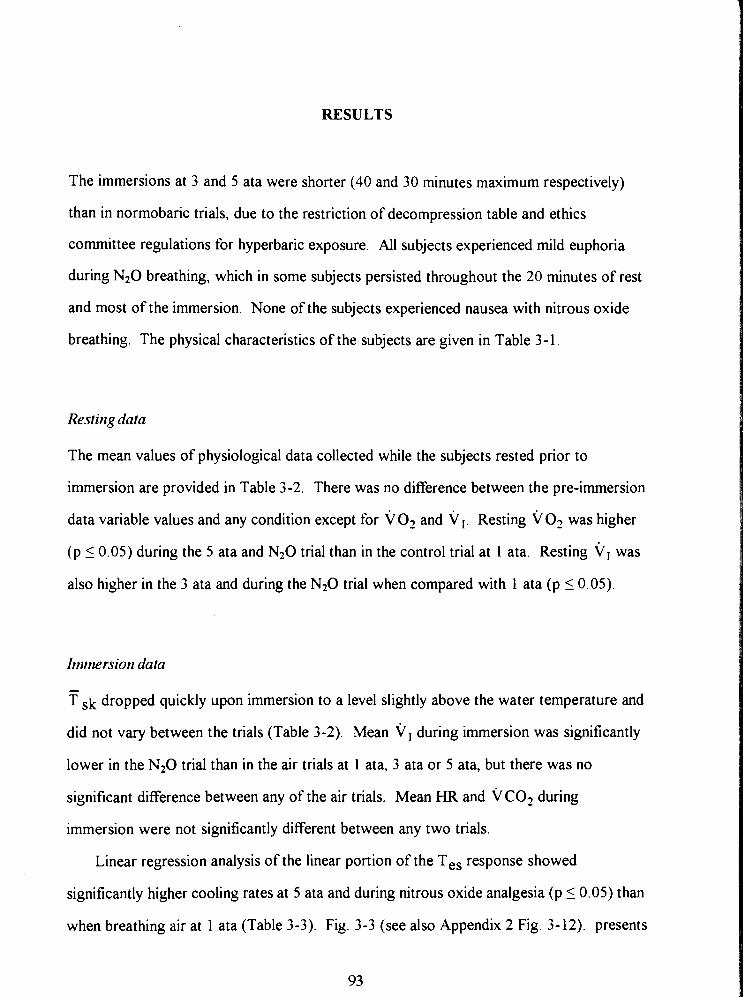
RESULTS
The immersions at 3 and 5 ata were shorter (40 and 30 minutes maximum respectively)
than in normobaric trials, due to the restriction of decompression table and ethics
committee regulations for hyperbaric exposure. All subjects experienced mild euphoria
during N20 breathing, which in some subjects persisted throughout the 20 minutes of rest
and most of the immersion. None of the subjects experienced nausea with nitrous oxide
breathing. The physical characteristics of the subjects are given in Table 3-1.
Resting data
The mean values of physiological data collected while the subjects rested prior to
immersion are provided in Table 3-2. There was no difference between the pre-immersion
data variable values and any condition except for VO? and vI. Resting VO? was higher
(p < 0.05) during the 5 ata and N20 trial than in the control trial at 1 ata. Resting vI was
also higher in the 3 ata and during the N20 trial when compared with 1 ata (p 10.05).
Itnt~~ersiot~ data
f sk dropped quickly upon immersion to a level slightly above the water temperature and
did not vary between the trials (Table 3-2). Mean vI during immersion was significantly
lower in the N20 trial than in the air trials at 1 ata, 3 ata or 5 ata, but there was no
significant difference between any of the air trials. Mean HR and VCO? during
immersion were not significantly different between any two trials.
Linear regression analysis of the linear portion of the Tes response showed
significantly higher cooling rates at 5 ata and during nitrous oxide analgesia (p I 0.05) than
when breathing air at 1 ata (Table 3-3). Fig. 3-3 (see also Appendix 2 Fig. 3-12). presents
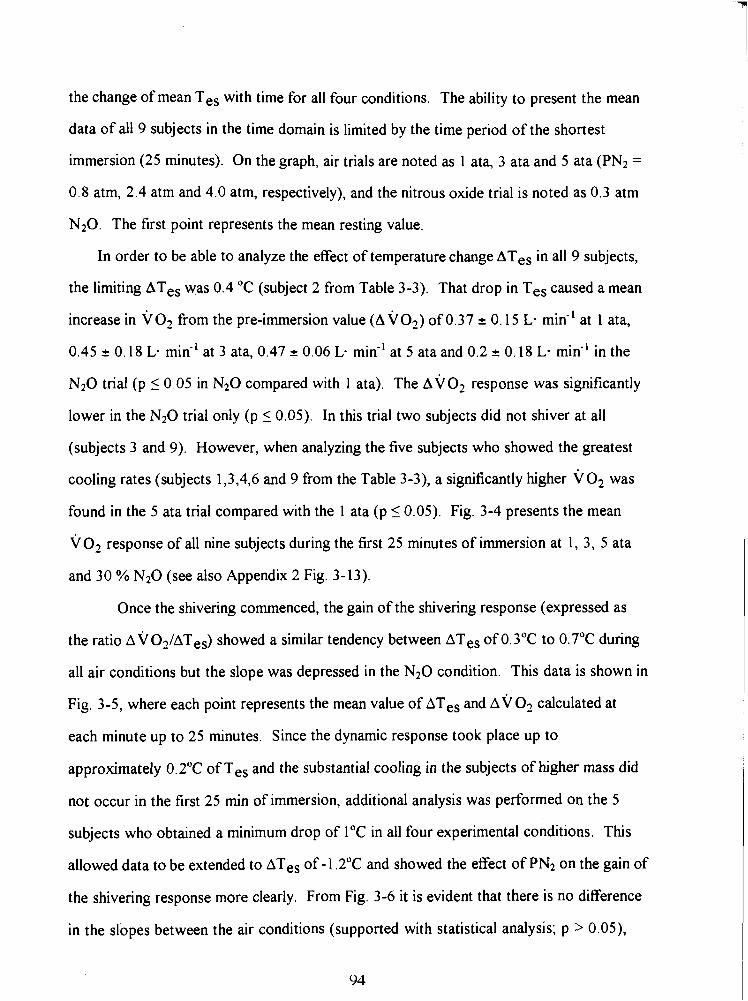
the change of mean Tes with time for all four conditions. The ability to present the mean
data of all 9 subjects in the time domain is limited by the time period of the shortest
immersion (25 minutes). On the graph, air trials are noted as 1 ata, 3 ata and 5 ata (PN2 =
0.8 atm, 2.4 atm and 4.0 atm, respectively), and the nitrous oxide trial is noted as 0.3 atm
N20. The first point represents the mean resting value.
In order to be able to analyze the effect of temperature change ATes in all 9 subjects,
the limiting ATes was 0.4 O C (subject 2 from Table 3-3). That drop in Tes caused a mean
increase in V O ~ from the pre-immersion value (A ~ 0 ~ ) of 0.37 2 0.15 L. min-' at 1 ata,
0.45 2 0.18 L- min-' at 3 ata, 0.47 2 0.06 L. min" at 5 ata and 0.2 2 0.18 L. min-' in the
N20 trial (p < 0.05 in N20 compared with 1 ata). The AVO:! response was significantly
lower in the N20 trial only (p 5 0.05). In this trial two subjects did not shiver at all
(subjects 3 and 9). However, when analyzing the five subjects who showed the greatest
cooling rates (subjects 1,3,4,6 and 9 from the Table 3-3), a significantly higher ~0~ was
found in the 5 ata trial compared with the 1 ata (p 5 0.05). Fig. 3-4 presents the mean
\jo2 response of all nine subjects during the first 25 minutes of immersion at 1, 3, 5 ata
and 30 % N20 (see also Appendix 2 Fig. 3- 13).
Once the shivering commenced, the gain of the shivering response (expressed as
the ratio A V O ~ / A T ~ ~ ) showed a similar tendency between ATes of O.3OC to 0.7OC during
all air conditions but the slope was depressed in the N20 condition. This data is shown in
Fig. 3-5, where each point represents the mean value of ATes and AVO^ calculated at
each minute up to 25 minutes. Since the dynamic response took place up to
approximately 0.2"C of Tes and the substantial cooling in the subjects of higher mass did
not occur in the first 25 rnin of immersion, additional analysis was performed on the 5
subjects who obtained a minimum drop of 1•‹C in all four experimental conditions. This
allowed data to be extended to ATes of -1.2"C and showed the effect of PN2 on the gain of
the shivering response more clearly. From Fig. 3-6 it is evident that there is no difference
in the slopes between the air conditions (supported with statistical analysis; p 0.05),
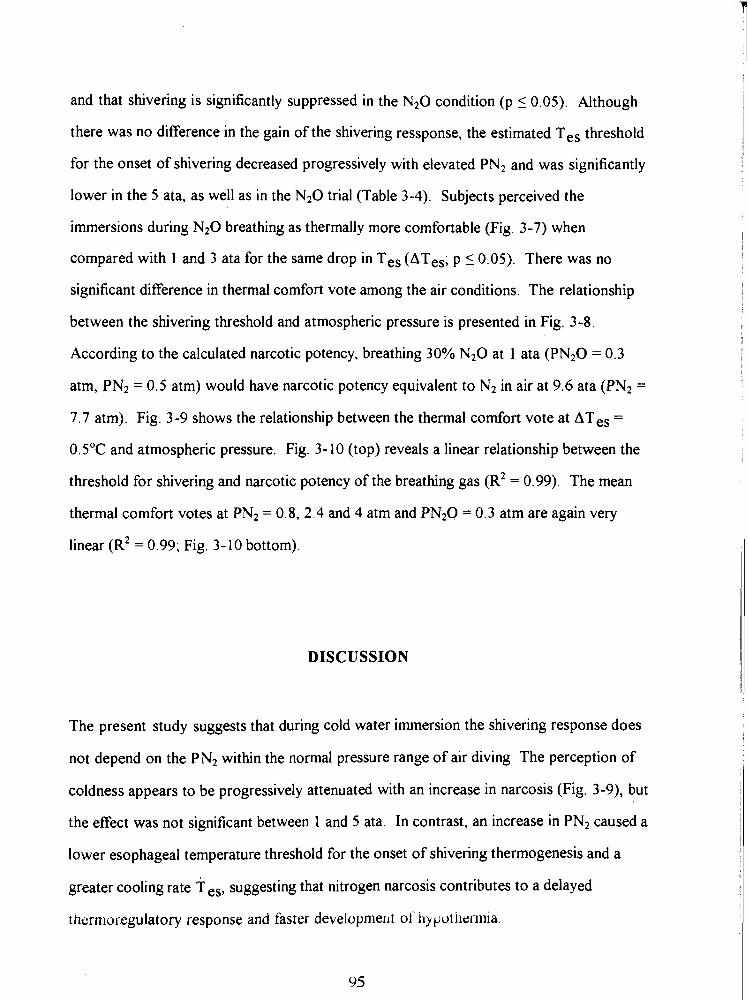
and that shivering is significantly suppressed in the N20 condition (p 5 0.05). Although
there was no difference in the gain of the shivering ressponse, the estimated Tes threshold
for the onset of shivering decreased progressively with elevated PN2 and was significantly
lower in the 5 ata, as well as in the N20 trial (Table 3-4). Subjects perceived the
immersions during N20 breathing as thermally more comfortable (Fig. 3-7) when
compared with 1 and 3 ata for the same drop in Tes (ATes; p 10.05). There was no
significant difference in thermal comfort vote among the air conditions. The relationship
between the shivering threshold and atmospheric pressure is presented in Fig. 3-8.
According to the calculated narcotic potency, breathing 30% N20 at 1 ata (PN20 = 0.3
atm, PN2 = 0.5 atm) would have narcotic potency equivalent to N2 in air at 9.6 ata (PN2 =
7.7 atm). Fig. 3-9 shows the relationship between the thermal comfort vote at ATes =
0.5"C and atmospheric pressure. Fig. 3-10 (top) reveals a linear relationship between the
threshold for shivering and narcotic potency of the breathing gas ( R ~ = 0.99). The mean
thermal comfort votes at PN2 = 0.8, 2.4 and 4 atm and PN20 = 0.3 atm are again very
linear ( R ~ = 0.99; Fig. 3-10 bottom).
DISCUSSION
The present study suggests that during cold water immersion the shivering response does
not depend on the PN2 within the normal pressure range of air diving The perception of
coldness appears to be progressively attenuated with an increase in narcosis (Fig. 3-9), but
the effect was not significant between 1 and 5 ata. In contrast, an increase in PN2 caused a
lower esophageal temperature threshold for the onset of shivering thermogenesis and a
greater cooling rate T es, suggesting that nitrogen narcosis contributes to a delayed
thermoregulatory response and faster developmerit of i~y~otl~errn~a.
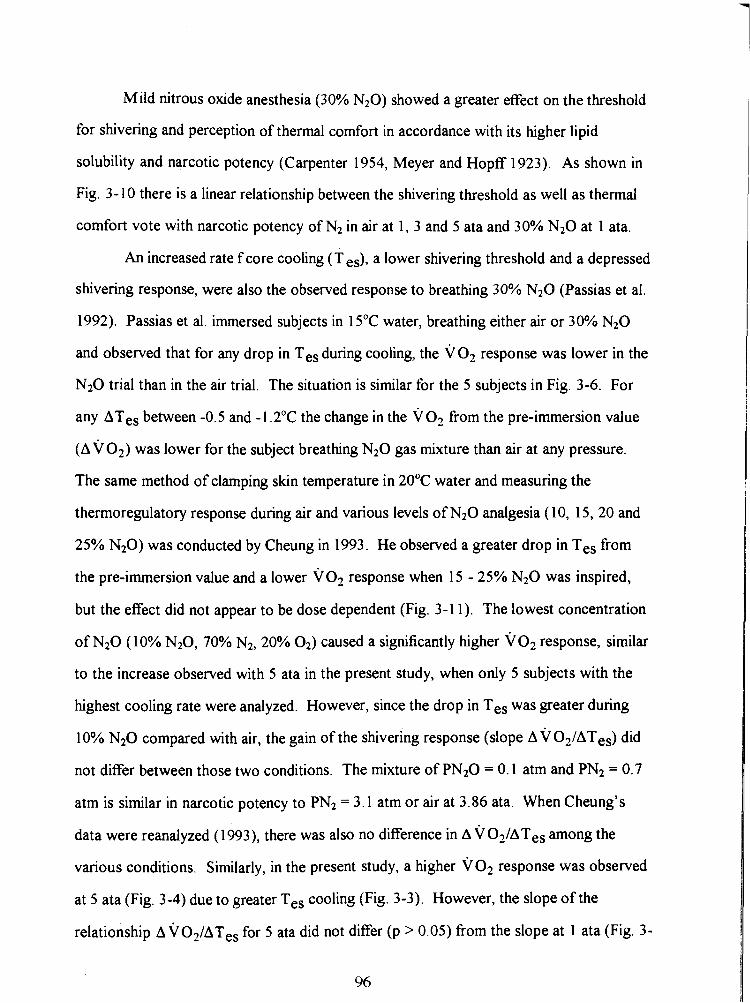
Mild nitrous oxide anesthesia (30% N20) showed a greater effect on the threshold
for shivering and perception of thermal comfort in accordance with its higher lipid
solubility and narcotic potency (Carpenter 1954, Meyer and Hopff 1923). As shown in
Fig. 3- 10 there is a linear relationship between the shivering threshold as well as thermal
comfort vote with narcotic potency of N2 in air at 1, 3 and 5 ata and 30% N20 at 1 ata.
An increased rate f core cooling (T es), a lower shivering threshold and a depressed
shivering response, were also the observed response to breathing 30% N20 (Passias et al.
1992). Passias et al. immersed subjects in 15•‹C water, breathing either air or 30% N20
and observed that for any drop in Tes during cooling, the VO, response was lower in the
N20 trial than in the air trial. The situation is similar for the 5 subjects in Fig. 3-6. For
any ATes between -0.5 and -1.2"C the change in the VO., from the pre-immersion value
(AVO*) was lower for the subject breathing N20 gas mixture than air at any pressure.
The same method of clamping skin temperature in 20•‹C water and measuring the
thennoregulatory response during air and various levels of NzO analgesia (1 0, 15, 20 and
25% N20) was conducted by Cheung in 1993. He observed a greater drop in Tes from
the pre-immersion value and a lower VO* response when 15 - 25% N20 was inspired,
but the effect did not appear to be dose dependent (Fig. 3-1 1). The lowest concentration
of N20 (1 0% N20, 70% N2, 20% 02) caused a significantly higher VO* response, similar
to the increase observed with 5 ata in the present study, when only 5 subjects with the
highest cooling rate were analyzed. However, since the drop in Tes was greater during
10% N20 compared with air, the gain of the shivering response (slope A V O ~ / A T , ~ did
not differ between those two conditions. The mixture of PN20 = 0.1 atm and PN2 = 0.7
atm is similar in narcotic potency to PN2 = 3.1 atm or air at 3.86 ata. When Cheung's
data were reanalyzed (1993), there was also no difference in A V O ~ / A T ~ ~ among the
various conditions. Similarly, in the present study, a higher ko2 response was observed
at 5 ata (Fig. 3-4) due to greater Tes cooling (Fig. 3-3). However, the slope of the
relationship A VO.,/AT~, for 5 ata did not differ (p > 0 05) from the slope at 1 ata (Fig. 3-
6) in five subjects who cooled for more than 1•‹C Tes during first 25 mhutes of
immersion. In contrast, for 30% N20 the AVO? response as a fhction of ATes was
depressed (Fig. 3-6).
It is possible that the increased core cooling rate measured at 5 ata and 30% NzO
conditions result from an increased heat loss from the periphery. However, the f sk
during immersion did not vary among trials, which suggests that there was no change in
the core - skin temperature gradient due to narcosis. Also, Cheung (1993) and Passias et
al. (1992) showed no change in skin heat flux during any N20 trial, which indicates that
the amount of heat loss is similar during N20 and air breathing. It is possible, that a
strong cutaneous stimulus from immersion in cold water and the increased central drive
due to falling core temperature, act together to ovemde any vasodilatory effect of the
anesthetic. However, it has been demonstrated, that in contrast to many inhaled
anesthetics, N20 may increase the sympathetic outflow from the brain (Fukunaga and
Epstein 1973) and inhibit removal of norepinephrine by the lung (Naito and Gillis 1973).
Therefore, norepinephrine released into the venous circulation would be available to act on
the systemic circulation producing some vasoconstriction.
Other effects, such as that exerted by N20 on cutaneous thennoreception and the
peripheral conduction of thermal stimuli, are reported to be negligible (Jong and Nace
1967, Somjen 1967). Narcosis produced with an inhaled anesthetics impairs synaptic
transmission at either pre- or postsynaptic junctions (Bennett 1967, Thesleff 1956).
Similarly, compressed air inhibits synaptic transmission (Bennett 1982), decreases the
frequency of the action potentials (Carpenter 1954), decreases the magnitude and
increases the duration of action (Rosenberg and Heavner 1980), suggesting that
both peripheral and central neural structures are affected by inert gas narcosis imposed at
high pressures.
Shivering is believed to occur only when maximal vasoconstriction and behavioural
manoeuvres are insufficient to maintain an appropriate mean body temperature.
According to Lopez et al. (1994), vasoconstriction occurs at ATes = -0.2"C, whereas
shivering occurs after a much greater change in core temperature (ATes = - 1.4"C) (also
Kurz et al. 1993, Sessler 1991). The observation, that initiation of shivering is controlled
less well than vasoconstriction would also suggest, that shivering may be, in large part,
mediated by phylogenetically older centers (Satinoff 1978) particularly the spinal cord
(Herdman 1978). Satinoff (1 978) has proposed a hierarchical organization of
thermoregulatory control in which the signal is successively processed in the spinal cord,
medulla and hypothalamus. In this system the phylogenetically "older" centres subserve
"newer" centres dominated by the hypothalamus, responsible for finer thermoregulatory
control. Experimental evidence supports the view, that the areas of highest complexity,
involving polysynaptic pathways, are most affected by anesthetics (Poterack et al. 1991)
and that the control then passes to a lower centre, possibly in the spinal cord which
would exert a coarser regulation, first decreasing the vasoconstriction threshold then the
shivering threshold. Satinoffs' concept can be used to explain the results of the present
study. Thus, greater impairment of the activation threshold for shivering is caused by
inhibition of the higher level integration at the hypothalamus with both N2 and N20
narcosis. The regulation is preserved at a lower level, less susceptible to narcotic
impairment, thus preserving the thermosensitivity and gain of the shivering response.
The conclusion from this study is, that a compressed air environment and N20
inhalation increase the core cooling rate ("C-h-') of subjects immersed in 15•‹C water, and
that the effect depends on the narcotic potency of the inspired gas mixture. Perception of
thermal comfort is progressively attenuated by an increased narcotic potency of the
breathing mixture and the effect is linear ( R ~ = 0.99). The core temperature threshold for
the onset of shivering is related to the narcotic potency of the inhalate and the relationship
is also linear ( R ~ = 0.99). Although no difference was found in the gain of shivering
response at 1, 3 and 5 ata of air, there was evidence of an attenuated gain in the N20
condition in 5 subjects.
REFERENCES
Abraini JH, Joulia F: Psycho - sensorymotor performance in divers exposed to 6 and 7 ata of compressed air, Eur JAppl Physiol, 65: 84-87, 1992.
Bennett PB, Papahadjopoulos D, Bangham AD: The effects of raised pressure of inert gas on phospholipid membranes, Lve Sci, 6:2527-2533, 1967.
Bennett PB: Inert gas narcosis, In: The physiology and medicine of diving, Bennett PB and Elliot DH (Ed.), Best Publishing Co., San Pedro, CA, pp: 239-261, 1982.
Bennett PB: Inert gas narcosis and HPNS, In: DivingMedicine, Bove AA, Davis JC Eds. 2nd Ed. W.B. Saunders Comp., pp:69-8 1, 1990.
Biersner RJ, Hall DA, Neurnrnan TS, Linaweaver PG: Learning rate equivalency of two narcotic gases, JAppl Psychol, 62:8747-50, 1977.
Biersner RJ: Emotional and physiological effects of nitrous oxide and hyperbaric air narcosis, Aviat Space Environ Med, 58:34-38, 1978.
Bloch M: Some systemic effects of nitrous oxide, Brit JAnaesth, 35:63 1-639, 1963.
Bridgman SA: Thermal status of Antarctic divers, Aviat Sapce Environ Medicine, 61:795-801, 1990.
Carpenter FG: Anestehtic action of inert and unreactive gases on intact animals and isolated tissues, Am JPhysio, l78:505-509, 1954.
Chattonet J, CabanacM: The perception of thermal comfort, Int JBiometeor, 9: 183-193, 1965.
Cheung SS: Dose-dependent effects of sub-anesthetic levels of nitrous oxide on thermal balance in humans, M.Sc. Thesis, School of Kinesiology, Simon Fraser University, 1993.
Ciammaichella RA: The effect of narcosis on aerobic performance, M.Sc. Thesis, School of Kinesiology, Simon Fraser University, 1994.
Eger EI: Nitrous oxide N 2 0 , Cardiovascular effects of nitrous oxide, Elsevier Science Publishing Company. Inc., New York, pp: 125-1 56, 1985.
Eisele JH, Smith NTY: Cardiovascular effects of 40 percent nitrous oxide in man, Anesth Analg. .. Current Researches, 5 1(6):956-962, 1972.
Enander A, Ljungberg AS, Holmer I: Effect of work in cold stores of man, Scand J Work Erlviror~ Health, 5: 195-204, 1979.
Foregger R: Surface temperature during anesthesia, Anesthesiology, 4: 392-402, 1942.
Fukunaga AF, Epstein RM: Sympathetic excitation during nitrous oxide - halothane anesthesia in the cat, Anesthesiology, 39:23-36, 1973.
Giesbrecht GG: Human thermoregulatory inhibition by regional anesthesia, Editorial views, Anaesthesiology, 8 1 : 277-28 1, 1994.
Hammel HT: Anesthetics and body temperature regulation, (Editorial views), Anesthesiology, 68(6):833-835, 1988.
Hayward JS, Keatinge WR: Progressive symptomless hypothermia in water: Possible cause of diving accidents, Brit MedJ, I : 1 182, 1979.
Herdman SJ: Recovery of shivering in spinal cats, Experiment Neurol, 59: 177- 189, 1978.
Hynson JM, DI, Moayeri A, McGuire J: Absence of nonshivering thermogenesis in anesthetized adult humans, Anesthesiology, 79: 695-703, 1993.
Jong R, Nace R: Nerve impulse conduction and cutaneous receptor responses during general anesthesia, Anesthesiology, 28:85 1-855, 1967.
Keatinge WR, Hayward MG, McIver NKI: Hypothermia during saturation diving in the North Sea, Brit Med J, 29 1, 1980.
Kleinbaum DG, Kupper LL, Muller KE: Applied regression analysis and other ntultivariable methods; Ch. 14 and 17, PWS-Kent Publ. Comp., Boston, 1988.
Kurz A, Sessler DI, Schroeder M, Kurz M: Thermoregulatory response thresholds during spinal anesthesia; Anesth Analg, 77: 72 1-6, 1993.
Lopez M, Sessler DI, Walter K, Emerick T, Ozaki M: Rate and gender dependence of the sweating, vasoconstriction, and shivering thresholds in humans, Anesthesiology, 80:780- 788, 1994.
Mekjavic IB, Sundberg CJ: Human temperature regulation during narcosis induced by inhalation of 30% nitrous oxide, JAppl Physiol, 73:2246-2254, 1992.
Meyer KH, Hopff H: Narcosis by inert gases under pressure, Hoppe-Seyler 's Z. Physiol. Chem., 126:288-298, 1923.
Naito H, Gillis CN: Effects of halothane and nitrous oxide on removal of norepinephrine from the pulmonary circulation, Anesthesiology, 39575-580, 1973.
Ohlson KBE, Mohell N, Cannon B, Lindahl SGE, Nedergaard J: Thermogenesis in brown adipocytes is inhibited by volatile anesthetic agents, Anesthesiology, 8 1 : 176- 183, 1994.
Padbury EH, bnnestad I, Hope I, Knudsen I, Myrseth G, Vaernes R: Undetected hypothermia: Further indications In: IJndenvater and Hyperbaric Physiology, IX ed. Bovie AA, Bachrach AJ and Greenbaum LJ Jr., Bethesda, Undersea Hyperbaric Medical Society, 1987.
Passias TC, Mekjavic IB, Eiken 0: The effect of 30% nitrous oxide on thermoregulatory responses in humans during hypothermia, Anesthesiology, 76(4):550-559, 1992.
Paton WDM, Speden RN: Anaesthetics and the central nervous system: Uptake of the anesthetics and their action on the central nervous system, Brit Med Bull, 2 1 :44-48, 1965.
Pertwee RG, Marshall NR, Macdonald AG: Behavioral thermoregulation in mice: Effects of low doses of general anaesthetics of different potencies, Exp Physiol, 75:629-637, 1990.
Pertwee RG, Marshall NR and Macdonald AG: Effects of subanesthetic doses of inert gases on behavioral thermoregulation in mice, J Appl Physiol, 6 l(5): 1623- 1633, 1986.
Piantadosi CA, Thalmann ED, Spaur WH: Metabolic response to respiratory heat-loss induced core cooling, JAppl Physiol: Respirat. Environ. Exercise Physiol., 50(4):829-834, 1981.
Poterack KA, Kampine JP, Schmeling WT: The effect of halothane on thermosensitive neurons in the preoptic region of the anterior hypothalamus in acutely instrumented cats, Anesthesiology, 75:625-633, 199 1.
Rosenberg PH, Heavner JE: Temperature-dependent nerve blocking action of lidocaine and halothane, Acta anaesth. scand., 24:3 14-320, 1980.
Satinoff E: Neural organization and evolution of thermal regulation in mammals, Science, 20 1 : 16-22, 1978
Savic SA, Mekjavic IB: Effect of inspiring 100% oxygen on shivering thermogenesis, Proc. 20th Ann. Meeting EUBS, Istanbul, Turkey, Sep. 1994.
Sessler DI: Central thermoregulatory inhibition by general anesthesia, Anesthesiology, 75:557-559, 1991.
Sessler DI, Olofsson CI, Rubinstein EH: The therrnoregulatory treshold in humans during nitrous oxide-fentanyl anesthesia, Anesthesiology, 69:3 57-364, 1988.
Sessler DI, Rubinstein EH, Moayeri A: Physiologic responses to mild perianesthetic hypothermia in humans, Anesthesiology, 75 :594-6 10, 199 1.
Smith TC, Colton ET, Behar MG: Does anesthesia alter hemoglobin dissociation?, Anesthesiology, 32: 5- 12, 1970.
Somjen G: Effects of anesthetics on spinal cord of mammals, Anesthesiology, 28: 135-143, 1967.
Thesleff S: The effect of anesthetic agents on skeletal muscle membrane, Acta Physiol Scan4 37:335-349, 1958.
Vassilieff N, Rosencher N, Sessler DI, Conseiller C: The shivering threshold during spinal anesthesia is reduced in the elderly, Abstract, A~~esthesiology, 8 1 (3A): Al I, 1994.
Webb i+ . i I I , ~ lliai poblems, In. The y h p r u l o ~ a r d n~edicrne of di\~ittg, Bennett 1% dad Elliot DH (Ed.), Best Publishing Co (Publ.), San Pedro, CA, pp:297-3 18, 1982.

Webb P: Body heat loss in undersea gaseous environments, Aerospace Med, 41(11): 1282-1288, 1970.
White M, Allan D, Light I, Norman JN: Thermal balance in divers, Lancet, pp: 1362, June
1980.

TABLES AND FIGURES
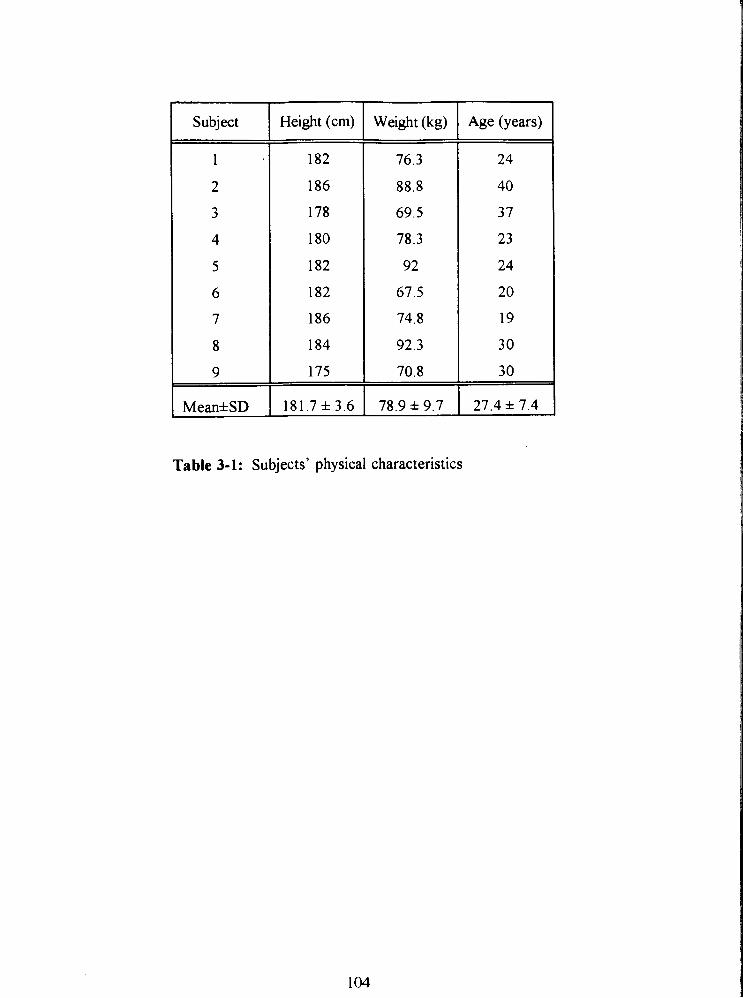
Height (cm) Weight (kg) Age (years)
Mean*SD 1 181.7 * 3.6 1 78.9 * 9.7 1 27.4 + 7.4
Table 3-1: Subjects' physical characteristics
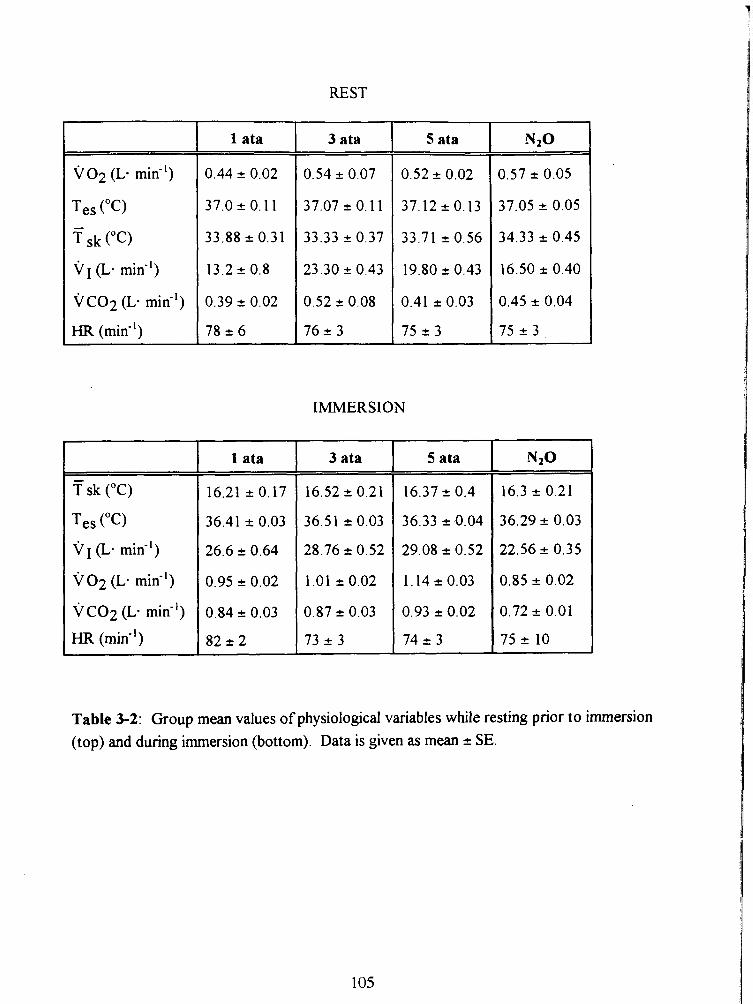
REST
V O ~ (L. mid')
Tes ("C) - T sk (OC)
v (L. min")
V C O ~ (L- mid1)
HR (mid1)
T sk ("C)
Tes ("C)
v (L. min-')
~ 0 2 ( L a min-')
V C O ~ (L. min-')
HR (min-')
1 ata
1 ata
3 ata
IMMERSION
3 ata
5 ata
5 ata
Table 3-2: Group mean values of physiological variables while resting prior to immersion (top) and during immersion (bottom). Data is given as mean + SE.
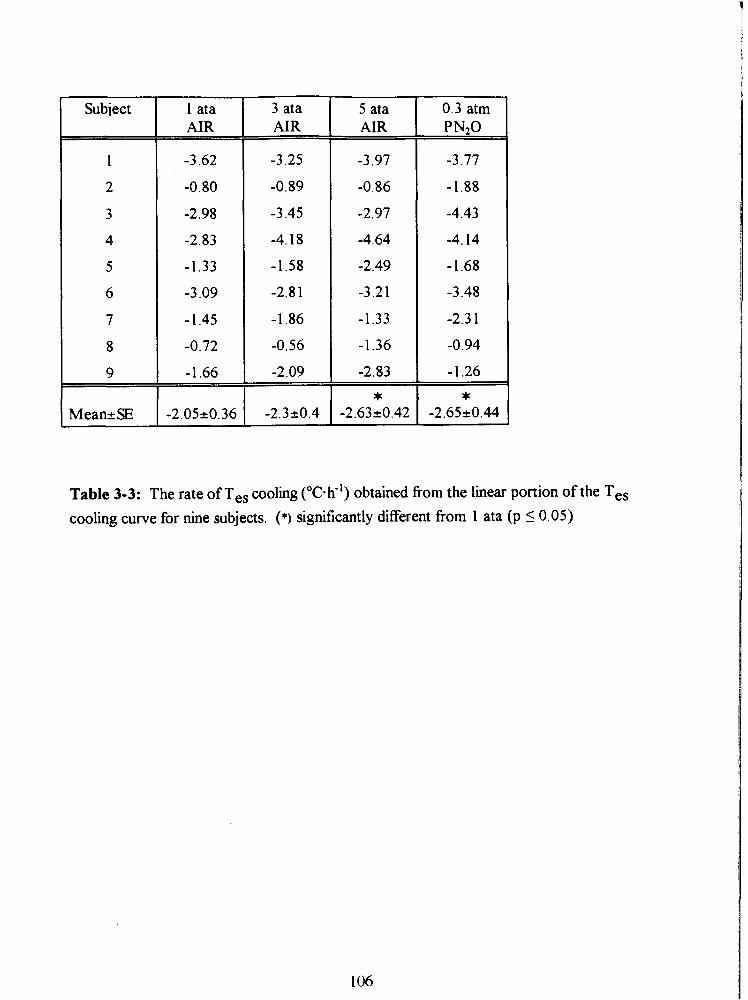
Subiect 1 ata AIR
3 ata AIR
5 ata AIR
-3.97
-0.86
-2.97
-4.64
-2.49
-3.2 1
-1.33
-1.36
-2.83
0.3 atm PNzO
-3.77
-1.88
-4.43
-4.14
-1.68
-3.48
-2.3 1
-0.94
-1.26
Table 3-3: The rate of Tes cooling ('C-h") obtained from the linear portion of the Tes cooling curve for nine subjects. (*) significantly different from 1 ata (p 5 0.05)
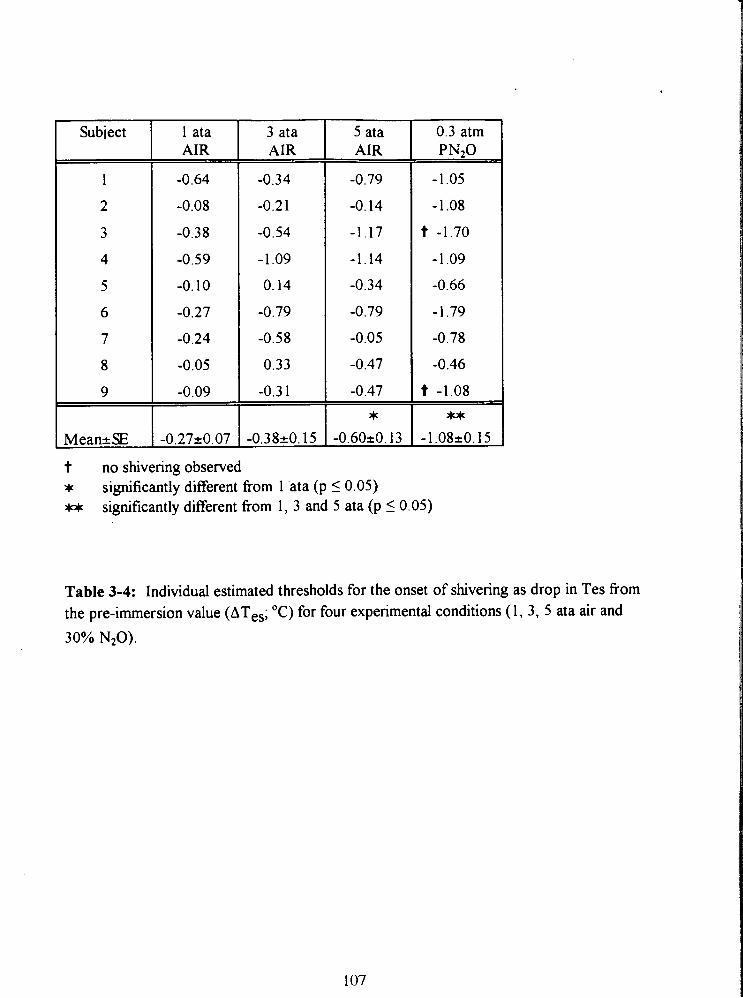
Subiect 1 ata AIR
-0.64
-0.08
-0.38
-0.59
-0.10
-0.27
-0.24
-0.05
-0.09
3 ata AIR
-0.34
-0.21
-0.54
-1.09
0.14
-0.79
-0.58
0.33
-0.3 1
5 ata AIR
-0.79
-0.14
-1.17
-1.14
-0.34
-0.79
-0.05
-0.47
-0.47
0.3 atm PN20
-1.05
- 1.08
t -1.70
- 1 .O9
-0.66
-1.79
-0.78
-0.46
t -1.08
t no shivering observed * significantly different fiom 1 'ata (p 5 0.05) w significantly different fiom 1, 3 and 5 ata (p I 0.05)
Table 3-4: Individual estimated thresholds for the onset of shivering as drop in Tes from the pre-immersion value (ATes; O C ) for four experimental conditions ( 1 , 3, 5 ata air and 30% NzO).
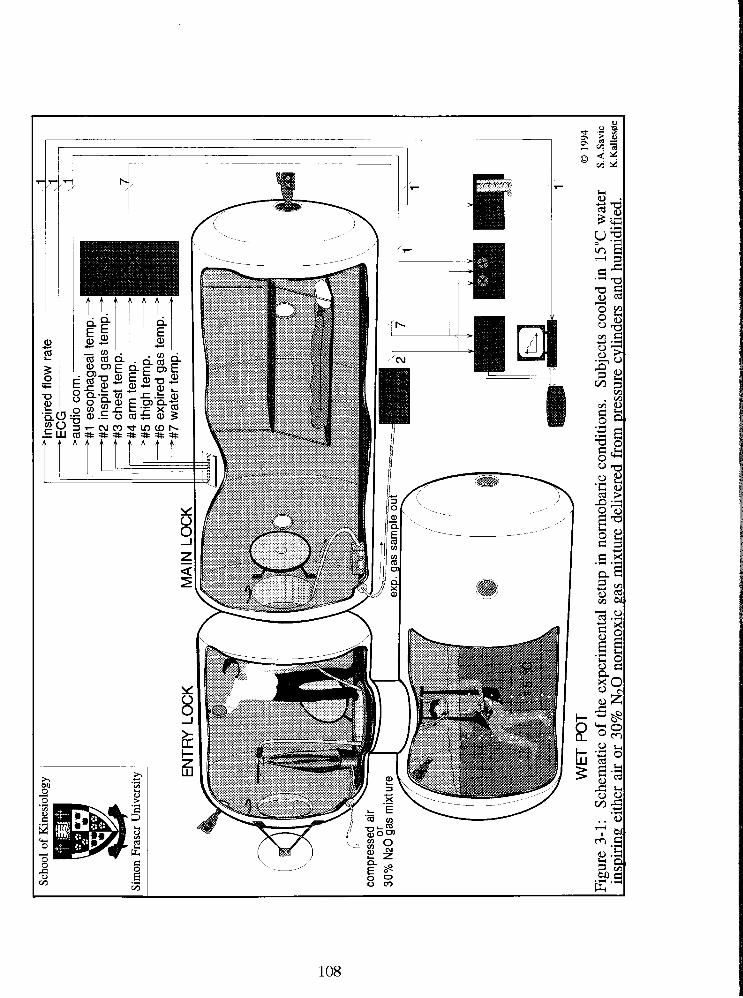
Scho
ol o
f K
ines
iolo
gv
Sim
on F
rase
r U
nive
rsity
inspired fl
ow r
ate 1
esop
hage
al
insp
ired
gas
ches
t te
mp.
ar
m t
emp.
- th
igh
tem
p.-
expi
red
gas
wat
er te
mD
. tem
p.-
tem
p.
'igur
e 3-
1:
Sch
emat
ic o
f th
e ex
peri
men
tal s
etup
in n
orm
obar
ic c
ondi
tion
s.
Sub
ject
s co
oled
in
15•‹
C w
ater
S.
A.S
avic
insp
irin
g ei
ther
air
or
30%
N7O
nor
rnox
ic g
as m
ixtu
re d
eliv
ered
fro
m p
ress
ure
cylin
ders
and
hum
idif
ied.
K
.Kde
"e
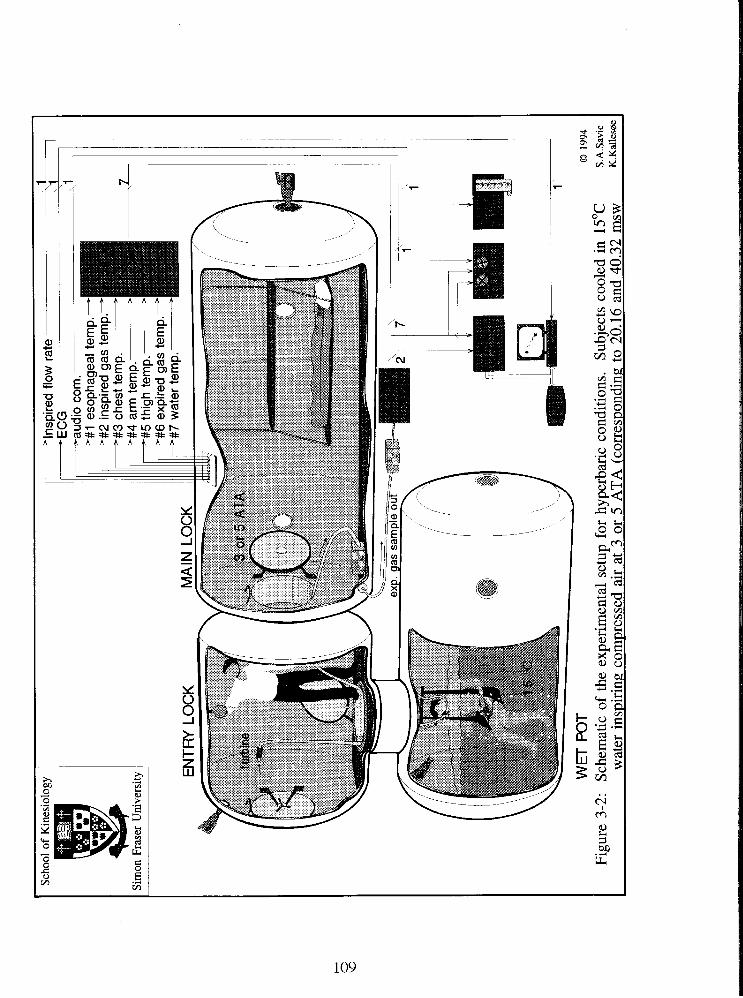
Scho
ol o
f K
ines
iolo
gy
Sim
on F
rase
r U
nive
rsity
Eau
u~
u
#1 e
soph
agea
l b
ul I I.
tem
p. -
#2 in
spire
d ga
s te
mp.
? #3
che
st te
mp.
- #4
arm
tem
p.
>
#5 th
igh
tem
p.-
#6 e
xpire
d ga
s te
mp.
- P
#7
wat
er tern^.^
WE
T P
OT
Figu
re 3
-2:
Sch
emat
ic o
f th
e ex
peri
men
tal s
etup
for
hyp
erba
ric
cond
itio
ns.
Sub
ject
s co
oled
in
15O
C w
ater
ins
piri
ng c
ompr
esse
d ai
r at
3 o
r 5
AT
A (
corr
espo
ndin
g to
20.
16 a
nd 4
0.32
msw
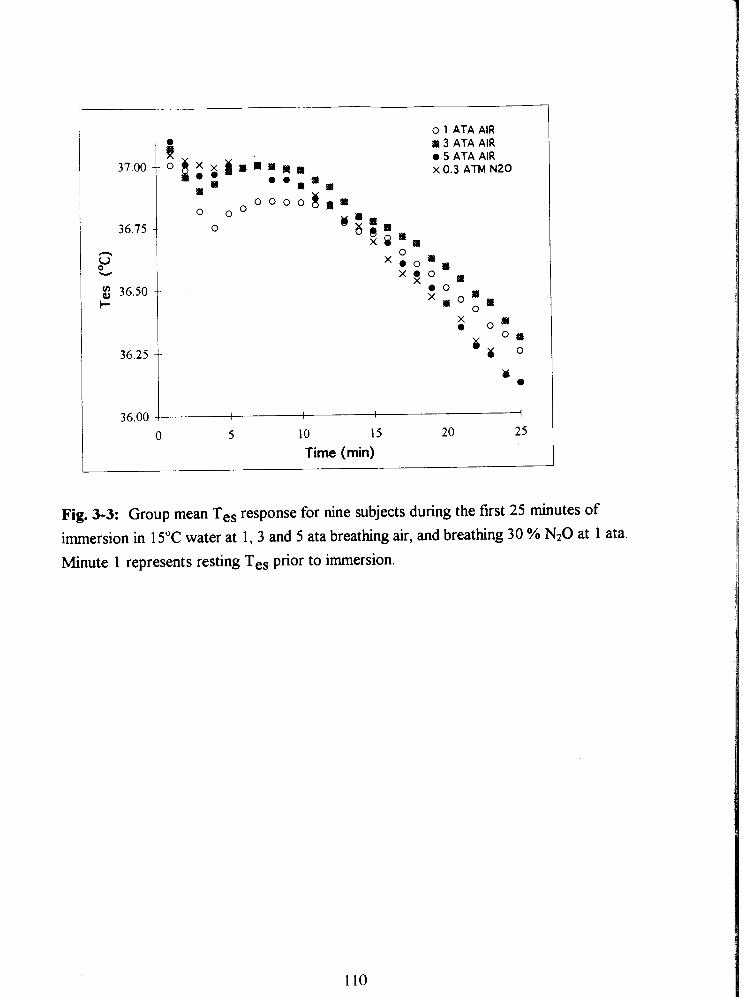
o 1 ATA AIR
i s 3 ATA AIR 0 5 ATA AIR
O i : r i ~ n a ~ m x 0.3 ATM N20
r I * * m a s o o o o g * m
0 o O o u a m m
% a .
. - r 3 ATA AIR - ~
0 5 ATA AIR x 0 .3 ATM N20
0 5 10 15 20 25 Time (min)
Fig. 3-3: Group mean Tes response for nine subjects during the first 25 minutes of immersion in 15•‹C water at 1, 3 and 5 ata breathing air, and breathing 30 % N20 at 1 ata. Minute 1 represents resting Tes prior to immersion.
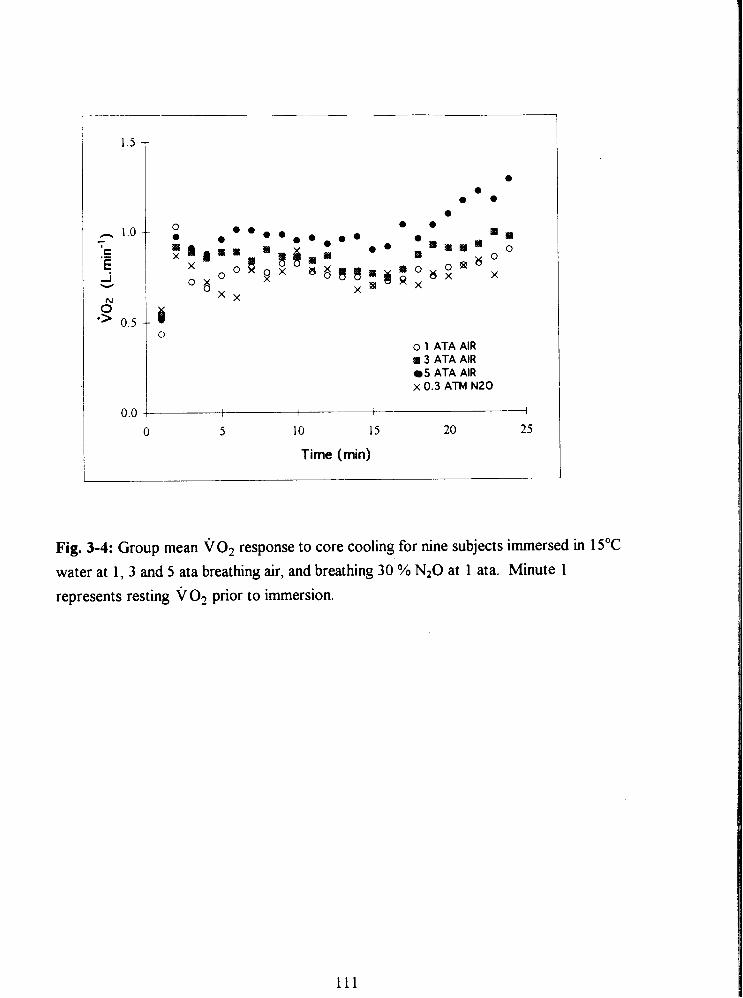
o 1 ATA AIR a 3 ATA AIR
5 ATA AIR x 0.3 ATM N20
0 5 10 15 20 25
Time (min)
Fig. 3-4: Group mean VO, response to core cooling for nine subjects immersed in 15•‹C
water at 1, 3 and 5 ata breathing air, and breathing 30 % N20 at 1 ata. Minute 1
represents resting VO, prior to immersion.
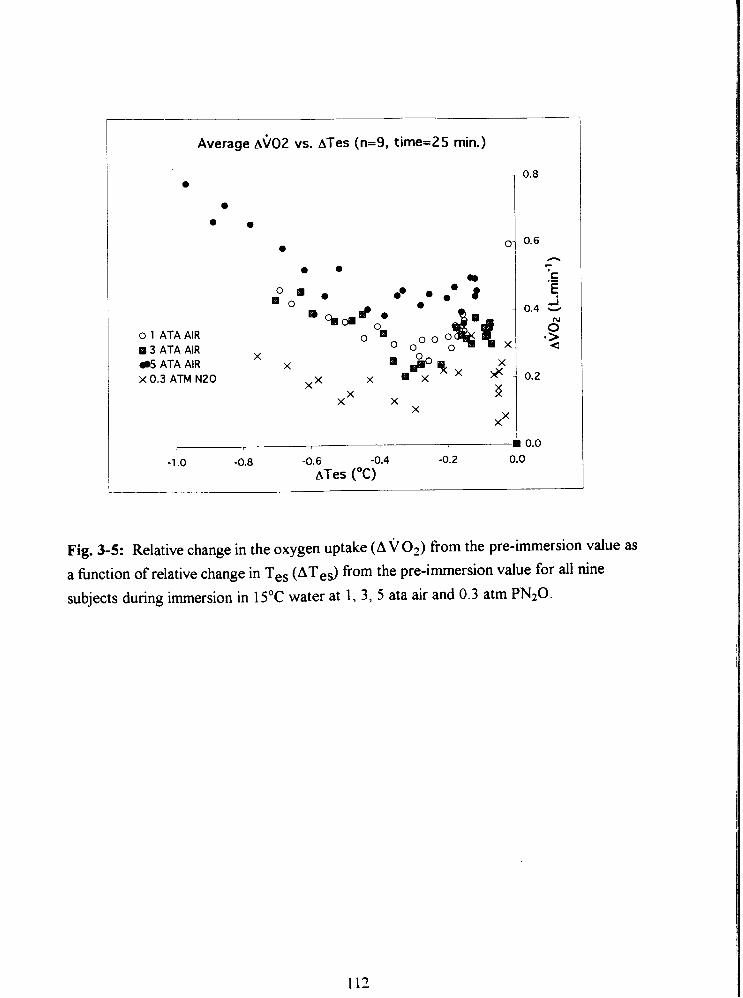
Average ~ $ 0 2 vs. ATes (n=9, time=25 min.)
o 1 ATA AIR 88 3 A T A AIR
5 ATA AIR x 0.3 A T M N20
Fig. 3-5: Relative change in the oxygen uptake ( A v o Z ) from the pre-immersion value as a function of relative change in Tes (ATeS) from the pre-immersion value for all nine subjects during immersion in 15'C water at 1 , 3 , 5 ata air and 0.3 atm PN20.
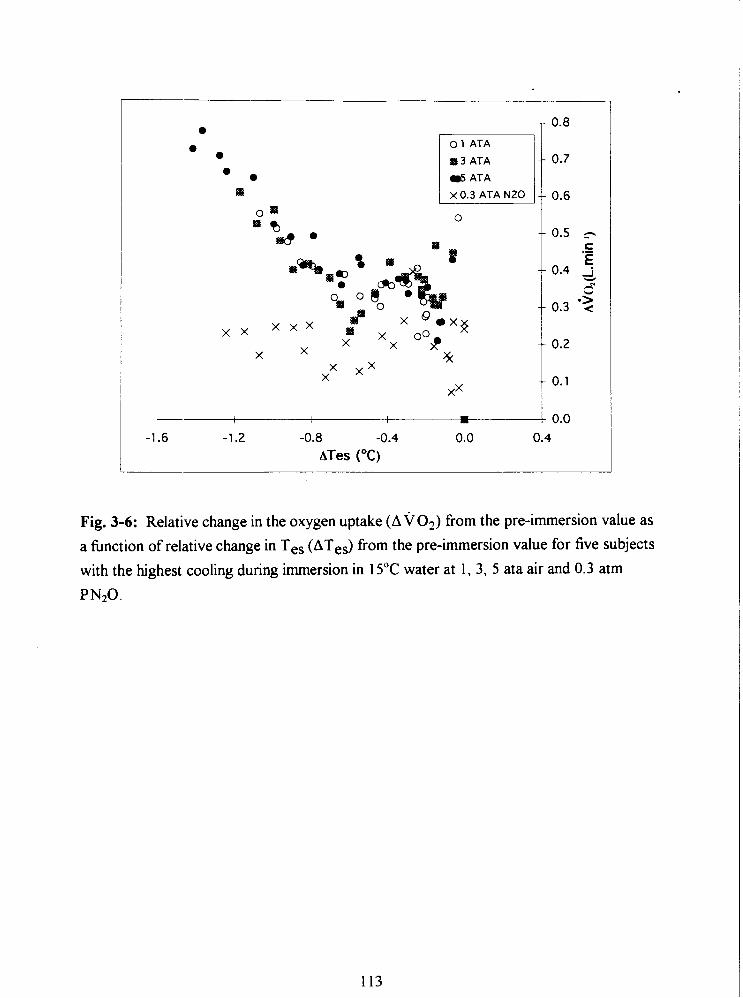
0 1 ATA
B 3 ATA
5 ATA
0
Fig. 3-6: Relative change in the oxygen uptake (A v 02) from the pre-immersion value as
a fkction of relative change in Tes (ATes) from the pre-immersion value for five subjects
with the highest cooling during immersion in 15•‹C water at 1, 3, 5 ata air and 0.3 atm
PN20.
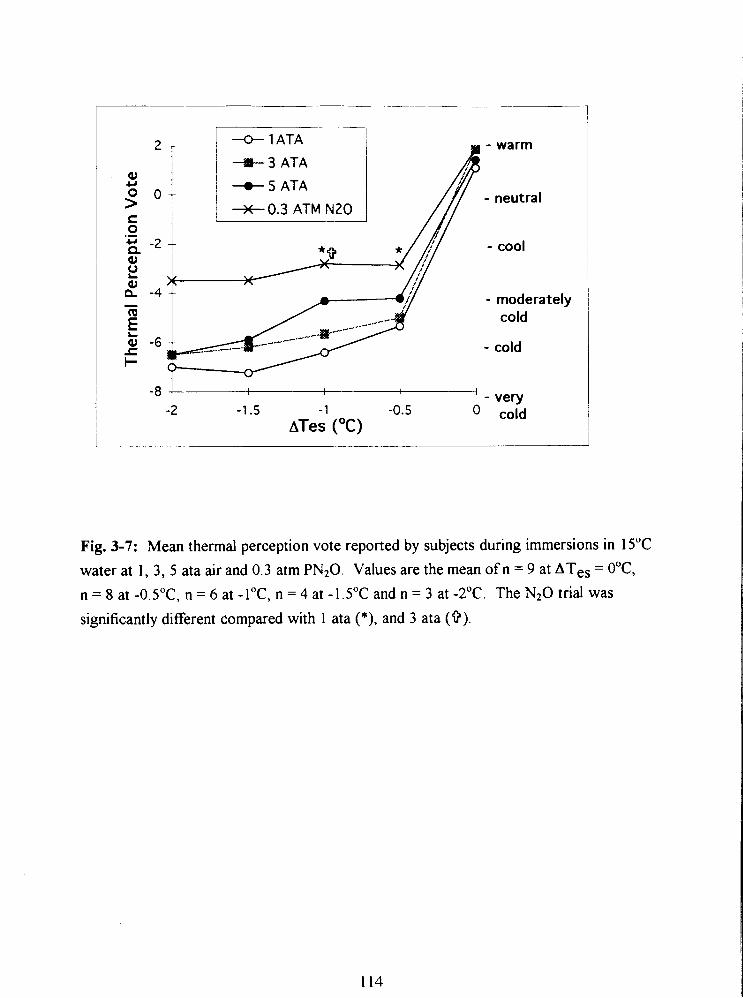
- warm
- neutral
- cool
- moderatel cold
- cold
-1.5 - 1 -0.5 ATes ( O C )
Fig. 3-7: Mean thermal perception vote reported by subjects during immersions in 15•‹C
water at 1, 3, 5 ata air and 0.3 atm PN20. Values are the mean of n = 9 at ATes = O•‹C,
n = 8 at -0.5"C, n = 6 at -l•‹C, n = 4 at -1.5"C and n = 3 at -2•‹C. The N20 trial was
significantly different compared with 1 ata (*), and 3 ata (9).
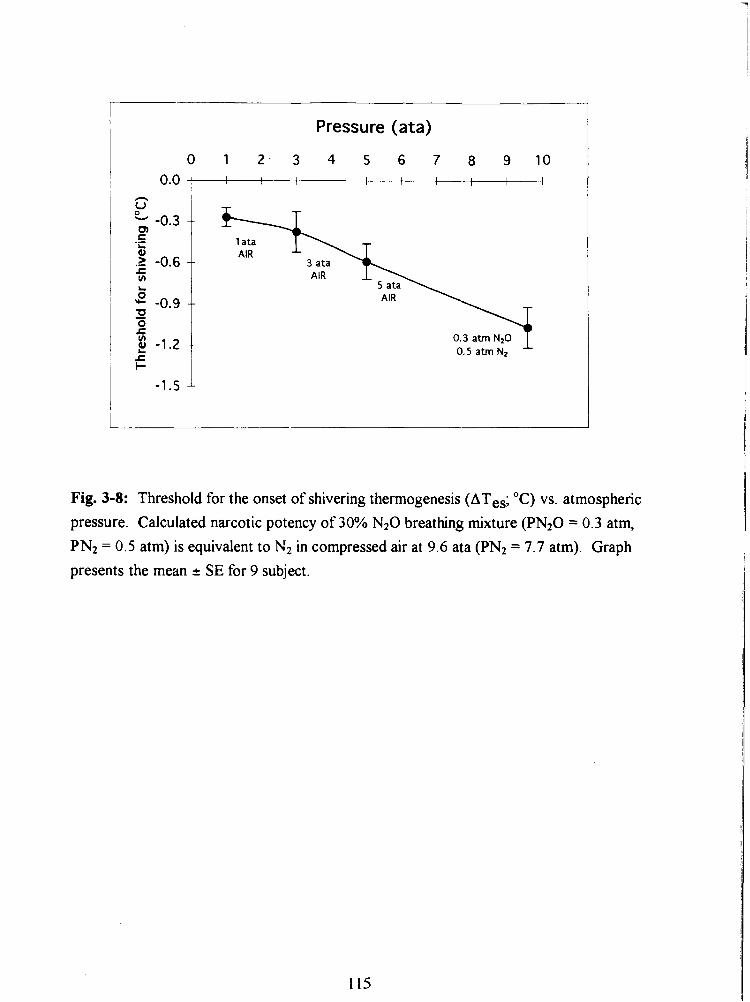
Pressure (ata)
Fig. 3-8: Threshold for the onset of shivering thermogenesis (ATes; "C) vs. atmospheric
pressure. Calculated narcotic potency of 30% N 2 0 breathing mixture (PN20 = 0.3 atm, PN2 = 0.5 atm) is equivalent to N2 in compressed air at 9.6 ata (PN2 = 7.7 atm). Graph presents the mean 2 SE for 9 subject.
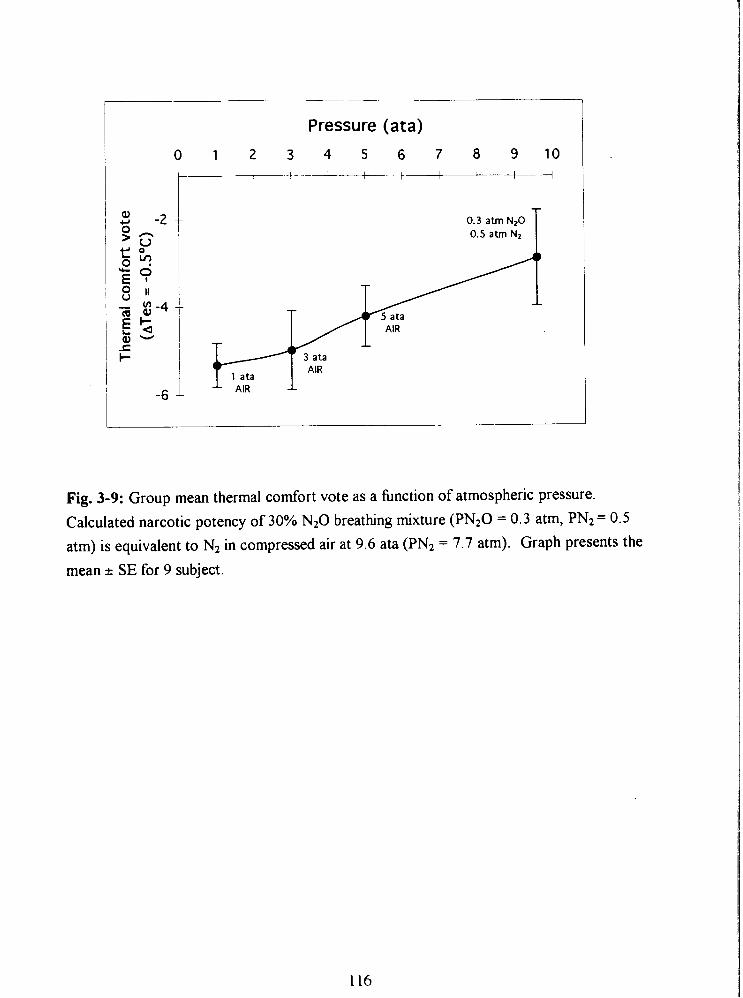
Pressure (ata)
0 1 2 3 4 5 6 7 8 9 1 0 I 1 I I I 1 I I
I I I
AIR I
0.3 atm N20 0.5 atm Nz T
Fig. 3-9: Group mean thermal comfort vote as a hnction of atmospheric pressure.
Calculated narcotic potency of 30% N20 breathing mixture (PN20 = 0.3 atm, PN2 = 0.5
atm) is equivalent to N2 in compressed air at 9.6 ata (PN2 = 7.7 atm). Graph presents the
mean I.- SE for 9 subject.
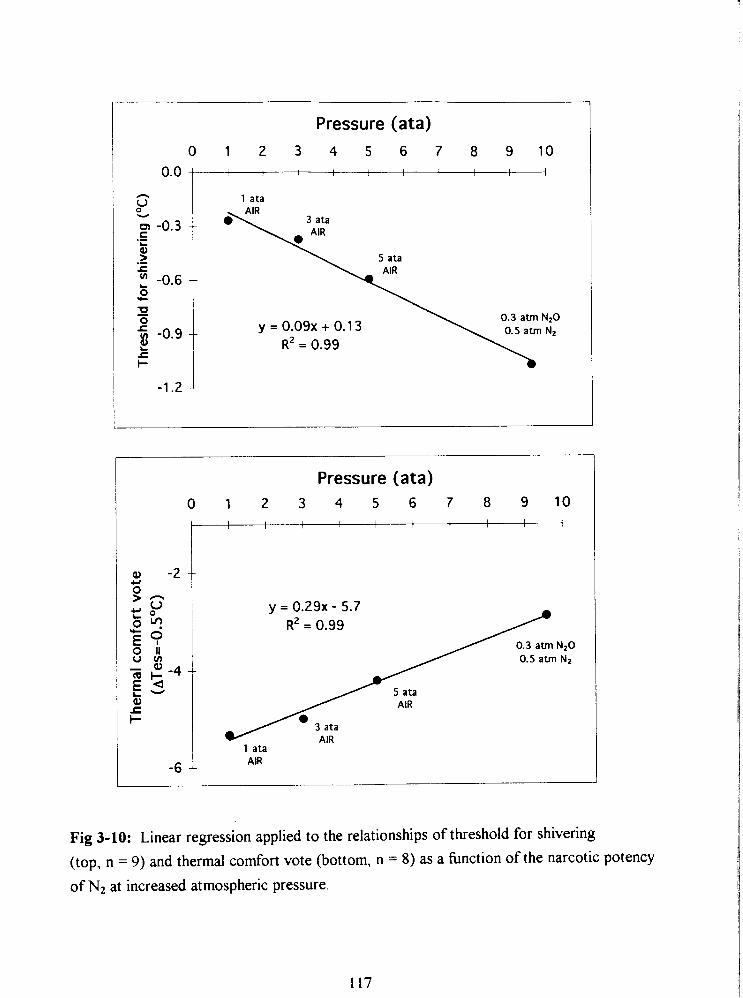
Pressure (ata) 0 1 2 3 4 5 6 7 8 9 1 0
I I I I 1 , I I
1 ata
Pressure (ata) 0 1 2 3 4 5 6 7 8 9 1 0
0.5 atm N,
1 ata
-6 1 AIR
Fig 3-10: Linear regression applied to the relationships of threshold for shivering
(top, n = 9) and thermal comfort vote (bottom, n = 8) as a function of the narcotic potency
of Nz at increased atmospheric pressure.
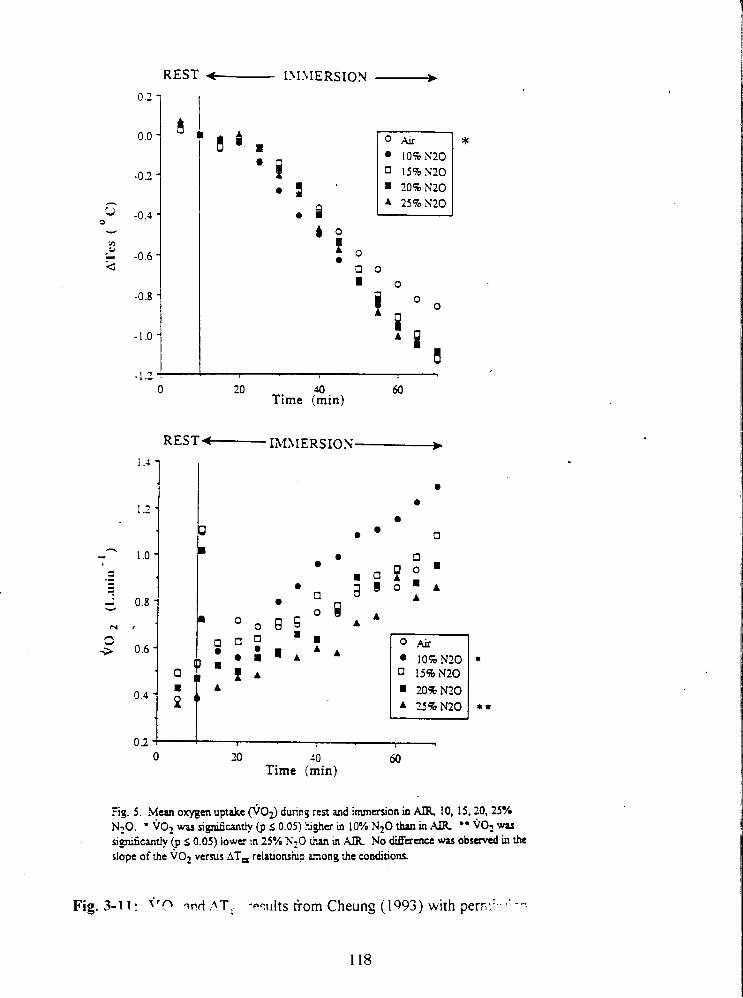
REST IM.\IERSION -
0 20 do 60 Time (min)
0 20 20 60 Time (min)
Fig. 5 . Mean oxygen uptake @03 dump rest and immation in a 10, 15,20.25% N20. ' ~0~ was n@cantly (p 5 0.05) higher m 10% N20 than in AIR " v02 was s~@cantly (p s 0.05) lower In 25% WZO inan in AIR No M a a c e was observed in the slope of the vo2 versus AT, relauonshp among the conditions.
. . Fig. 3-1 1 : f'n lvrt ,ATi -wilts from Cheung (1 993) with perr.: . --
118

APPENDIX 2
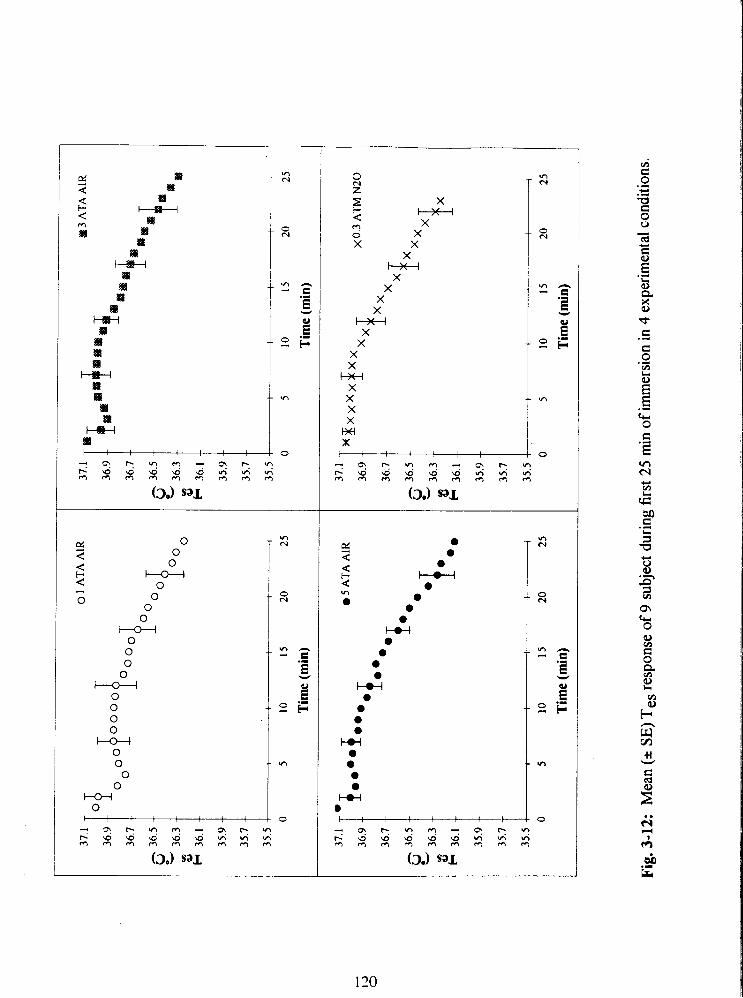
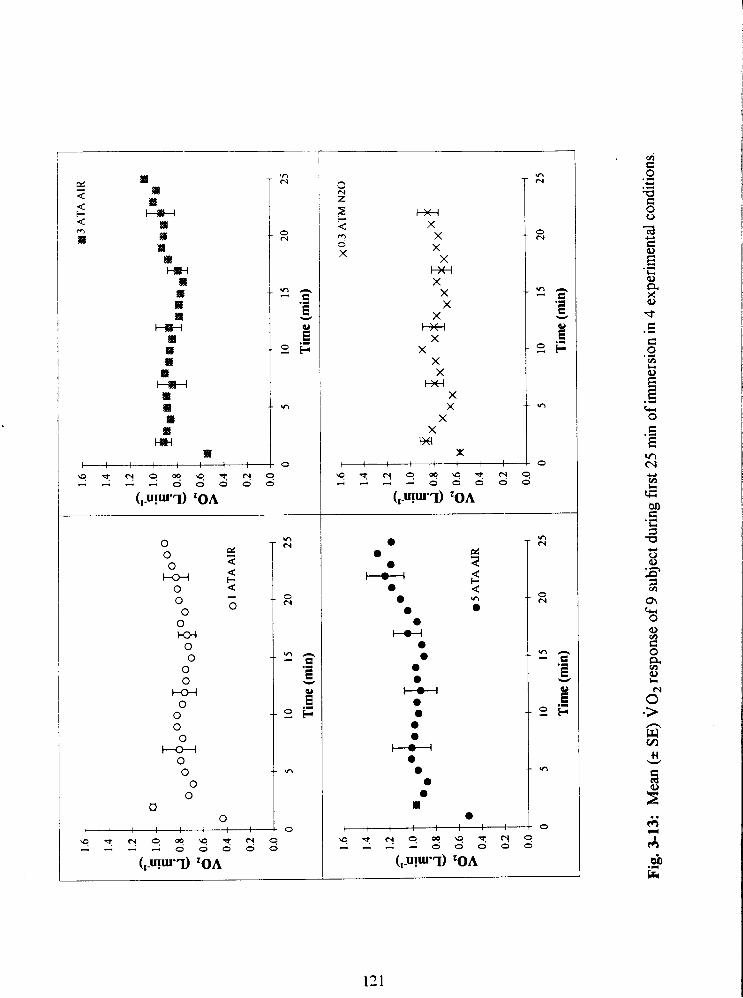
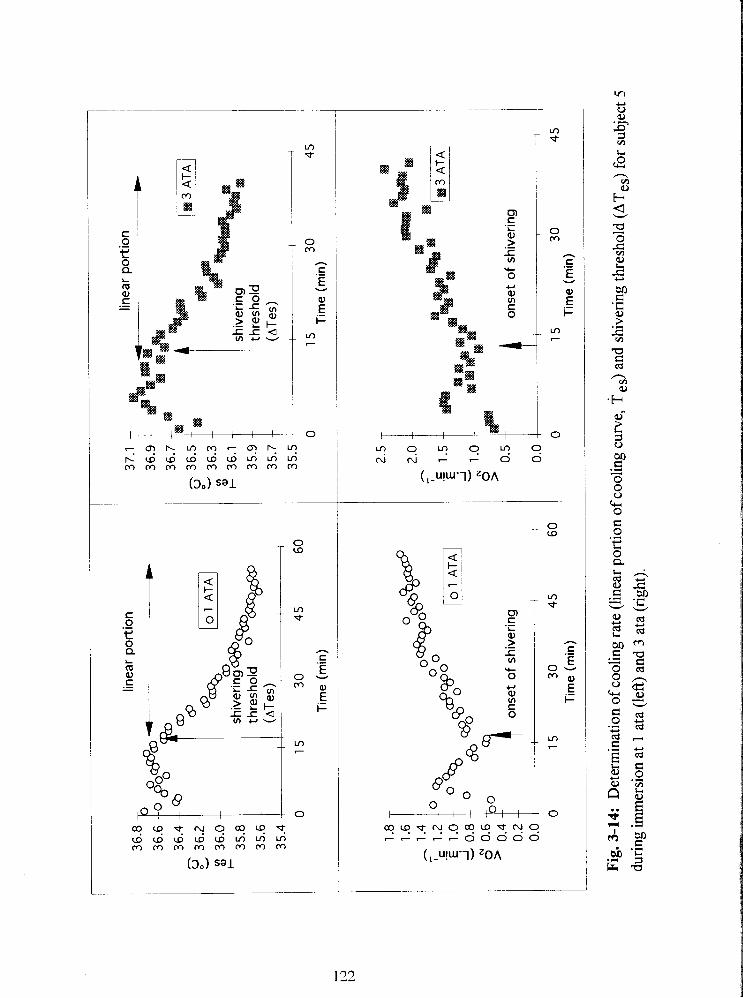
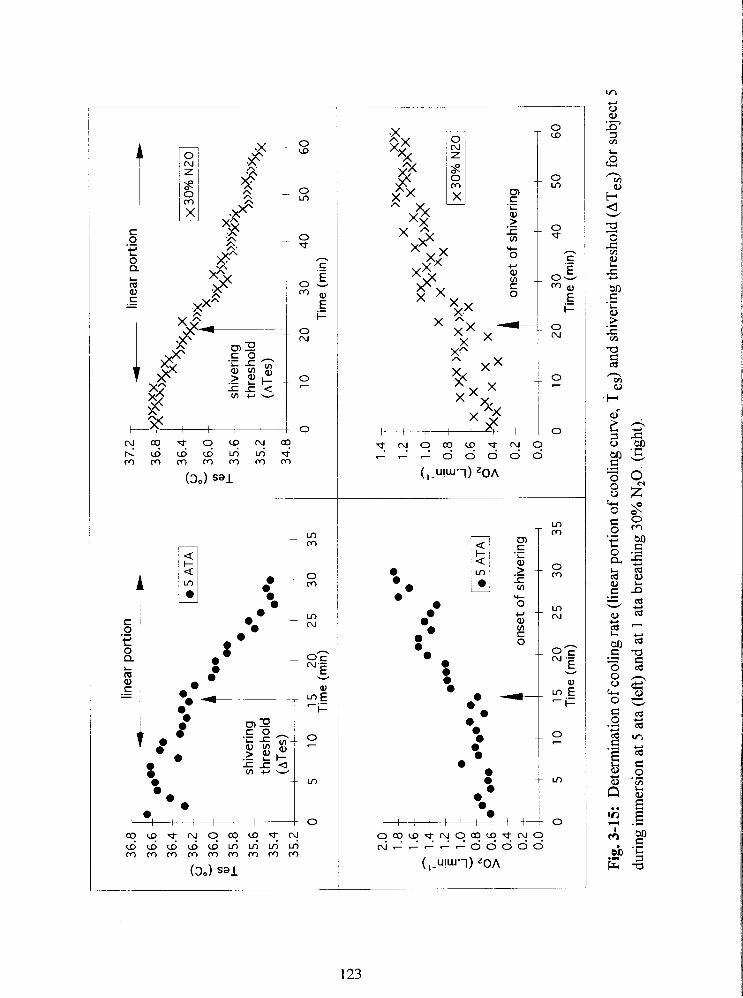
shiv
erin
g th
resh
old
(~T
es
) '
0 5
10
1
5
20
25
3
0
35
Tim
e (m
in)
4 on
set
of s
hive
ring
0 5
10
1
5
20
25
3
0
35
Tim
e (m
in)
37.2
T
4
linea
r po
rtio
n +
n >>
- sh
iver
ing
W5
~?
) >;$a
thre
shol
d %
)))%
jax
34.8
0 1
0
20
3
0
40
50
6
0
Tim
e (m
in)
0.2
--
onse
t of
shi
verin
g
0.0
I 1
1 I
I 1
I
0 1
0
20
3 0
4
0
50
60
T
ime
(min
)
Fig
. 3-1
5:
Det
erm
inat
ion
of c
oolin
g ra
te (l
inea
r por
tion
of c
oolin
g cu
rve,
T e
s) a
nd s
hive
ring
thre
shol
d (A
Tes
) for
sub
ject
5
duri
ng im
mer
sion
at 5
ata
(le
ft) a
nd a
t 1
ata
brea
thin
g 30
% N
,O.
(rig
ht).
STUDY IV
THE PREDICTION OF BODY CORE COOLING RATE AND SURVIVAL TIME
OF HUMANS IMMERSED IN COLD WATER
ABSTRACT
This study evaluates the progression into hypothermia of subjects immersed in cold
water A model based on body physique, water temperature (Tw) and narcosis level
@JP) was developed for predicting the cooling rate of subjects during compressed air
diving. Data were gathered fiom 4 independent hypothermia studies using the same
immersion methodology on 44 subjects. Subjects wearing only a swim suit were
immersed up to the neck in cold water until their core temperature decreased to 35•‹C or
for 2•‹C from the pre-immersion value. Immersions conducted in hyperbaric conditions
were limited to the maximum bottom time of the approved decompression schedule. 25
subjects were cooled in water of 11.2"C, 13 subjects in 15•‹C and 6 in 20•‹C water.
Subjects were of both genders (14 females and 30 males) and included a wide range of
physiques. As 19 subjects were cooled at several levels of narcosis, a total of 79
immersions were completed.
To determine the anthropometric measures which would be the best predictors of
the rate of core cooling 43 raw and derived anthropometric measures were subjected to
regression analysis. The 4 anthropometric measures yielding best prediction were: medial
calf skinfold thickness (MCSF), medial calf girth (CG), acrornial height (ACHT) and tibia1
height (TBHT). A linear regression model to predict cooling rate from variables Tw, NP,
MCSF, CG, ACHT, TBHT was then developed using all 79 cases. An artificial neural
network was used to develop nonlinear models based on the same input variables. The
outputs of the models were compared and the linear regression model performed better
than the non linear models.
Regression models were also developed to predict cooling rate and survival time
during head out immersion based upon water temperature and body composition (MCSF,
, A i , 1 L I he predicted survival times (mean * SI)) of males and females,
based on Canadian population data, were predicted as a fhction of water temperature and
physique. The developed model of survival time was compared to existing predictive
models.
INTRODUCTION
Although death in cold water accidents can occur due to burns, drowning or shock, the
survivors will often be immersed in cold water supported with a life jacket and the
prediction of survival of hypothermic victims is of practical importance. Scarce and
inadequate data obtained from accidental hypothermia in shipwreck survivors (Molnar
1946), recreational boaters and fishermen (Harnett et al. 1983) and aircraft accidents
(Brooks and Rowe 1984) usually refer to the "tolerance limit" of the victim. The
definition of tolerance uses death as an end point which is, of course, unacceptable in the
context of human experimentation. Immersion experiments designed to estimate the
tolerance limit under laboratory conditions, usually bring core temperature to 35"C, from
which the recovery from hypothermia is complete and without complications. Predictive
models developed from the above studies have resulted in complex nonlinear computer
model solutions using heat loss and heat productive thermoregulatory mechanisms
(Wissler 1985, Tikuisis et al. 1988) or simple linear models establishing the relation
between the environmental temperature, core temperature and time, as a measure of
survival (Hayward et al. 1975). Other models for predicting survival time are based on
limits of heat production and heat loss (Timbal et al. 1976, Hall 1972, Smith and Hames
1962).
There is a general agreement in the literature that subcutaneous fat provides an
insulative barrier to the loss of body heat during exposure to cold. Clark ana Edholm
(1 985), Sloan and Keatinge (1 973), Burton and Edholm (1969), Wyndham et al. (1968),
Keatinge (1960), Pugh and Edholm (1955) have shown that subjects with greater skinfold
thickness will cool more slowly than lean subjects resting in cold air or water of the same
temperature. Comparative studies of the thermoregulatory response between gender have
shown that total body mass and muscle mass contribute significantly to core cooling,
while gender and adipose tissue mass do not have an important effect (Park et al. 1984,
Veicsteinas et al. 1982, Anderson et al. 1995). According to Park et al. (1984) and
Veicsteinas et al. (1982) a skeletal muscle beneath the superficial insulative shell of skin
and subcutaneous fat can provide up to 75% of insulation in non-exercising man. This
insulation provided by muscle which is poorly perfbsed due to vasoconstriction is
removed by exercising hyperemia. Hayward and co-workers (1975) reported a
significantly slower (40%) cooling rate in the male subjects than the female subjects, but
only at a water temperature of 10.5"C. The difference was attributed to significantly
greater body mass of males compared to females. Also Keatinge (1 960) and Kollias et al.
(1974) have reported a slower rate of core cooling and metabolic heat production in men.
Other studies have found a positive correlation between the surface area to mass ratio and
cooling rate in adults (McArdle et al. 1984, Kollias et al. 1974, Pugh and Edholm 1955)
and children (Sloan and Keatinge 1960).
The purpose of this study was to develop a reliable and simple quantitative
relationship between the rate of core cooling of a diver and, body physique, water
temperature and narcosis level. A second objective was to develop a model for prediction
of survival time during head out immersion based on body physique and water
temperature at 1 ata. The prediction is pertinent for an inactive, unclothed person, in cold
water. It was assumed that death occurs at 30•‹C core temperature. Animal experiments
suggest that ventricular fibrillation (Bigelow 1950) or respiratory failure (Popovic and
Ponovic 1974) is a terminal event occurring between 25 - 30•‹C rectal temperature. Death
due to hypothermia in man is generally attributed to ventricular fibrillation (Hervey 1973,
127
Swan et al. 1955) although direct evidence such as an ECG recording, is'seldom available .
at the time of death.
METHODS
The decrease in core temperature in response to cold immersion was compared in 4
separate studies. Three studies were conducted by the same experimenter (Study I, 11, I11
by Savic in 1991, 1993 and 1994 respectively) and the fourth study was conducted by
another experimenter in the same laboratory (Conn and Morrison 1979), using the same
immersion techniques. Core temperature monitoring sites were in the distal esophagus
(37 - 42 cm; I, 11,111) and 15 cm beyond the rectum (IV). In all studies, subjects were
wearing a swim suit and sitting quietly in water up to the neck, until core temperature
dropped by 2•‹C from the pre-immersion value, or to a minimum of 35•‹C. Water
temperature was 15•‹C in Studies I and II,20•‹C in Study 111, and 1 1.2"C in Study IV. In
Study IV subjects were of both genders (12 females and 13 males) and selected to provide
a wide range of body composition, whereas in Study I, I1 and I11 subjects were males
(except in Study I where 2 females of average built participated).
The anthropometric assessment was performed by an anthropometrist following
the standardized procedure as recommended by Ross and Marfell-Jones (1991).
Atitluopornetric rrleasurerrzerlts
Anthropometric measurements included the measures of weight, height, sitting height,
anterior-posterior chest depth, head girth and foot length; projected lengths including
acromial, radial, stylion, dactylion, spinale and tibia1 height; biacromial, biiliocristal and
u a l l ~ ~ ~ ~ b c ;hest b ~ . e ~ ~ , h~d ths 01 I ~ U , I ~ C ~ U ~ and femur; relaxed and flexed arm girth,
forearm, wrist, chest, waist, upper thigh, calf and ankle girth. Compressed adipose tissue
thickness was determined using the caliper technique at each of 6 skinfold sites (triceps,
subscapular, suprailiac, abdominal, front thigh and medial calf) using the same closing
pressure. Each measurement of length, height, girth, breadth and skinfold was taken twice
to reduce variations, and the mean score was reported. Anthropometric indexes of
ectomorphy (ECTO), mesomorphy (MESO) and endomorphy (ENDO) were calculated
using regression equations explained in the Heath Carter Somatotype method (Carter
1980). Body surface area was estimated from body height and weight using the formula
of DuBois and DuBois (19 16) A = wP"'~ - HT'."~ - 71.84, where A is surface area
(cm2), WT is body mass (kg) and HT is height (cm). These anthropometric variables were
used for the fractionation of skin, adipose, muscle, bone and residual tissue mass as
suggested by the model of Kerr (1988).
Narcotic potency
For the purpose of this study it was assumed that the narcotic potency of a gas was
directly related to the quantity of gas dissolved in the lipid biomembrane. The narcotic
potency (NP) of the breathing mixture in various studies was determined by the Bunsen
coefficient (Bennett 1982, Carpenter 1954) multiplied by the pressure of the gas (atm).
The Bunsen coefficient (Bc) determines to what extent the gas is soluble in olive oil
(representing the lipid biomembrane) at 37OC (cc-cc-') at a pressure of 1 atmosphere (760
mmHg). Bc for N2 is 0.067 and for N20 is 1.6 (cc-cc-'). Therefore, the calculated NP of
N2 in air at normal atmospheric pressure (PN2 = 0.8 atm) is NP = 0.067 . 0.8 = 0.0536
c c ~ ~ - ' . The NP of 30% N20 nonnoxic gas mixture inspired at 1 ata (PN20 = 0.3 atm,
PN2 = 0.5 atm) is NPN2 + N20 = NPN2 + NPN2, = 0.51 cc.cc", which is equivalent to the
narcotic potency of nitrogen present in compressed air at 9.57 ata (PN2 = 7.66 atm).
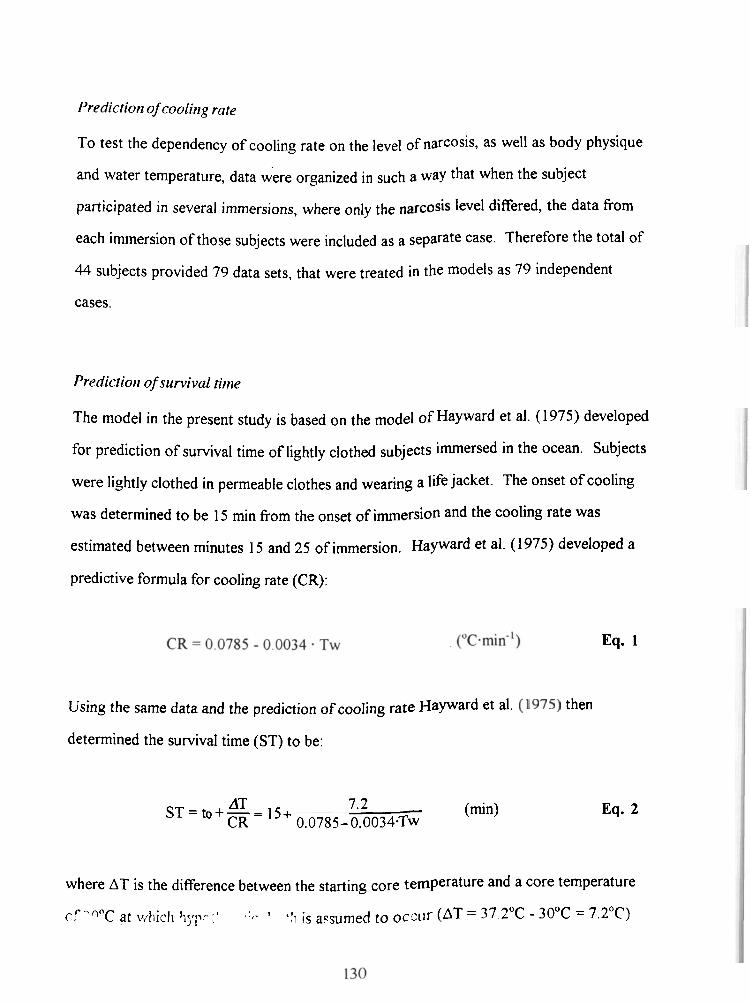
Prediction of coolirtg rote
TO test the dependency of cooling rate on the level of narcosis, as well as body physique
and water temperature, data were organized in such a way that when the subject
participated in several immersions, where only the level differed, the data from
each immersion of those subjects were included as a separate case. Therefore the total of
44 subjects provided 79 data sets, that were treated in the models as 79 independent
cases.
Prediction of survival t h e
The model in the present study is based on the model of Hayward et a]. (1 975) developed
for prediction of survival time of lightly clothed subjects immersed in the ocean. Subjects
were lightly clothed in permeable clothes and wearing a life jacket. The onset of cooling
was determined to be 15 min from the onset of immersion and the cooling rate was
estimated between minutes 15 and 25 of immersion. ~ a y w a r d et al. (1975) developed a
predictive formula for cooling rate (CR):
Using the same data and the prediction of cooling rate HaYWard et a 1 then
determined the survival time (ST) to be:
AT ST= to+-= 15+ 7.2 (min) CR 0.0785- 0.0034=Tiv
Eq. 1
Eq. 2
where AT is the difference between the starring core temperature and a core temperature
cr ?QnC at [~,!~ich tifl- 7 .:.- I +!j is a.csumed to occur (AT = 37 2•‹C - 30•‹C = 7.2"C)
The prediction of survival time in the present study was based on the assumption
that death would occur on average at 30•‹C core temperature, where loss of consciousness
in the victim is expected. The starting core temperature is based on the average starting
temperature of 44 subjects immersed in 4 different water temperatures and breathing air in
the present study. The drop in core temperature to 30•‹C was assumed to be linear. In
the model used in this study the cooling rate (CR) and the time at which the cooling
started (to) were modeled as a fbnction of both water temperature and anthropometric
variables that produced a significant effect. The linear regression was applied on the data
from 44 subjects immersed in various water temperatures at 1 ata.
Cross correlation
The relationships among all 46 variables (43 raw and derived anthropometric variables,
cooling rate, water temperature, and narcosis level) were examined. A statistical analysis
software application (SAS) was used to generate a correlation matrix. The strength of the
relationship between two variables is reflected in the Pierson correlation coefficient (-1 5 r
5 1). To have probability significant at the 0.05 level, a single variable would require a
correlation of r = 0.22. A correlation above 0.44 indicates a probability of 5 0.0001.
Regression analysis
In order to examine the extent to which the cooling rate (CR; "c-h-') could be explained in
terms of water temperature (Tw), narcotic potency (NP), 3 1 raw anthropometric
measures and 12 derived anthropometric body measures, the following method was used.
The variables included in the model were chosen by inspection of scatter plots and the
correlation matrix, based on their high individual correlation with cooling rate and low
cC\r, ' 1 ' a . ' r ' ' r r variables. bfdels of this tlrpc :. ' rIcd theorctiw:ly meaninghl
variables. Stepwise regression analysis was performed and backward elimination was
used to reduce the number of variables. Backward elimination removed, in each step, the
variable with the smallest contribution to the model (smallest F statistics), until only the
variables that contributed significantly at the 0.1 level were left in the set.
Artificial neural networks
Using the variables that most strongly affect core cooling rate, according to the multiple
regression analysis, a series of artificial feed forward neural networks (FFNN) were
designed to predict the cooling rate response for a given series of inputs. A supervised
FFNN (Neuralworks IVPLUS, Neuralware Inc., Pittsburgh, PA) was trained to predict
the rate of core cooling as a nonlinear function of the input variables. All networks
consisted of 3 layers and had the following structure: 1 input layer with 5 or 6 input
neurons, 1 hidden layer with 4 - 10 neurons and 1 output layer with 1 output neuron. A
network with one hidden layer was chosen for modeling the cooling rate, since it has been
shown that a single hidden layer is sufficient to approximate any complex continuous
nonlinear function by adding more neurons in the hidden layer (Funahashi 1989). All
neurons (nodes) in the network were hlly interconnected. The output of a neuron was a
smooth sigmoidal function of the input with values between 0 and 1 (Hush and Home
1993, Zornetzer and Davis 1990). The FFNN was trained using sets of sample input and
output data. The learning rule chosen for training was back-propagation of error which
used the least mean square error algorithm and fed the difference between the output and
target array back through the network then readjusted the weights in such a way as to
minimize the error. This new set of network weights was then used to produce a new
output array, which was compared again with the target array. The weights were
readjusted until the error for the entire training set reached the minimum or when a
predetermined numbel of iterations had been performed. The architecture of the FFNN.
decision rule, learning ratio and tolerance of error were tested on the whole set of data by
varying the number of neurons in the hidden layer, number of input neurons and number
of iterations. For validation purposes the data set was then split into a training set
containing 69 cases which were used to train the network and a test set containing the
remaining 10 cases on which the performance of the network was tested.
RESULTS
Effect of gender attd body compositiorl on coolitg rate
Data for these statistics were taken from the study of Conn and Morrison (1979) in
which 12 females and 13 males were immersed in water with an average temperature of
11.2 "C (Table 4-1). The males had 38.2% lower mean skinfold thickness (MSF, pi0.05),
were 185% heavier (p 5 0.05). had a 44.5% higher muscle mass (Mmuscle, p 5 0.05) and
a 10.7% lower surface area to mass ratio (NM, p 5 0.05) than the females. While there
was no significant gender difference in the upper body skinfold thickness (sum of triceps,
suprailiac and abdomen skinfold), or adipose tissue mass (AT), females possessed a
significantly higher skinfold thickness in the lower body area (sum of thigh and calf
skinfold). The cooling rate was not significantly different between genders ( p > 0.05).
The Pierson correlation coefficient for selected raw and derived anthropometric measures
is reported in Table 4-2. In the present study there was a negative correlation between
cooling rate (CR) and water temperature (Tw; r = -0.44), MCSF (r = -0.48), CG (r =
- 8 , A I = - 2 5 ) 1 1 . 1 = - 2 ) There was a positive correlation
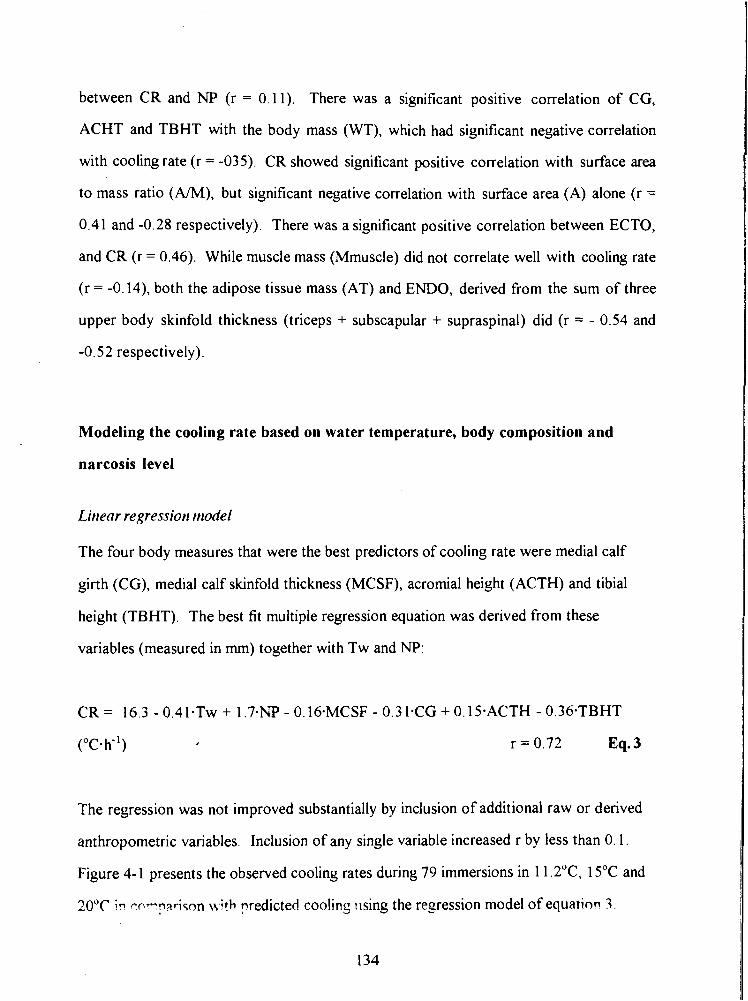
between CR and NP (r = 0.1 1). There was a significant positive correlation of CG,
ACHT and TBHT with the body mass (WT), which had significant negative correlation
with cooling rate (r = -035). CR showed significant positive correlation with surface area
to mass ratio (AM), but significant negative correlation with surface area (A) alone (r =
0.41 and -0.28 respectively). There was a significant positive correlation between ECTO,
and CR (r = 0.46). While muscle mass (Mmuscle) did not correlate well with cooling rate
(r = -0.14), both the adipose tissue mass (AT) and ENDO, derived from the sum of three
upper body skinfold thickness (triceps + subscapular + supraspinal) did (r = - 0.54 and
-0.52 respectively).
Modeling the cooling rate based on water temperature, body composition and
narcosis level
Lirreclr regression rrzodel
The four body measures that were the best predictors of cooling rate were medial calf
girth (CG), medial calf skinfold thickness (MCSF), acromial height (ACTH) and tibia1
height (TBHT). The best fit multiple regression equation was derived from these
variables (measured in mrn) together with Tw and NP:
CR = 16.3 - 0 . 4 1 . T ~ + 1.7-NP - O.16.MCSF - 0.31.CG + 0.15.ACTH - 0.36.TBHT
(OC-~") r = 0.72 Eq. 3
The regression was not improved substantially by inclusion of additional raw or derived
anthropometric variables. Inclusion of any single variable increased r by less than 0.1.
Figure 4-1 presents the observed cooling rates during 79 immersions in 11.2"C, 15•‹C and
20•‹C i.1 ro-yviwn \li.;th nredicted cooling !sing the regression model of equation 3
Results of the tron-lineor model with FFNN
To choose the learning step, allowed error, and other parameters of the ANN, the network
was trained with all 79 cases (Table 4-3 - top). Input variables were Tw, NP, MCSF,
CG, ACHT and TBHT. There were either 5 or 6 input variables. When only 5 input
variables were used TBHT was omitted. The number of hidden layer neurons used varied
from 4 -10. The nonlinear approximation was obtained with a sigmoid hnction and the
learning rule which was used was backpropagation of error. The optimal learning ratio
was determined by varying the step size for weight adjustment. It was found that
convergence was very slow if the step size was too small, and the system became
unstable if the step size was too large. The learning ratio was then set to 0.05. The error
tolerance was set to 0.001. The smaller the tolerance, the longer it took to train the
network. All the weights were initialized by a random generator.
In total, 29 FFNN were trained. The results of testing several different networks
in which the number of hidden layer neurons were altered, and the number of iterations
adjusted, are shown in Table 4-3 (top). The training sessions were performed using all 79
cases. It may be seen that the number of iterations had a great impact on the performance
of the FFNN. When the number of iterations for a FFNN with 10 hidden layer neurons
was decreased from lo6 to 2. lo5, the mean square error (MSE) more than tripled.
However, when the number of iterations was decreased in the same way with only 4
hidden layer neurons, the MSE increased only by 3 1%. When the number of hidden layer
neurons was altered from 10 to 4 with lo6 iterations, the MSE more than doubled.
However, with fewer iterations (2.10~) there was almost no change in MSE when the
number of hidden layer neurons was decreased from 10 to 4. The number of input
variables also had a strong effect. For example, decreasing the number of input variables
from 6 to 5 with lo6 iterations, more than doubled the MSE.
The best performing FFNN, with 6 inputs, 10 hidden layer neurons and lo6
iterations (Fig. 4-2) gave a MSE of 0.12. For comparison, the linear regression yielded a
MSE of 0.82.
To test the predictive power, various FFNNs were trained on 69 samples and then
tested on 10 independent samples. Two examples are presented at the bottom of Table 4-
3. The first is the FFNN which performed best when trained with lo6 iterations on all 79
cases (Fig. 4-2). In the validation study, the linear regression method outperformed the
FFNN. In the example given in Table 4-3, the prediction improved after lowering the
number of iterations from lo6 to 2-10', to provide a MSR of 2.03. This network
compared favorably with the linear regression model which gave a MSE of 1.95 as shown
in Fig. 4-3. The fact that the first FFNN, trained over lo6 iterations on all 79 cases,
provided a better fit than the regression model, but failed to perform as well when tested
on unseen data, indicates that the neural network was probably overtrained.
Modeling survival time in head out immersion at 1 ata
The cooling rate (CR) and the time at which the cooling started (to) were modeled as
finctions of water temperature and anthropometric variables that produced a significant
effect. Linear regression was performed on the data (Tw, MCSF, CG, ACHT, TBHT)
from 44 subjects immersed in 3 water temperatures at 1 ata. The resulting equations have
the following form:
CR = 17.3 - 0 . 3 6 . T ~ - 0.16.MCSF - 0.41CG +O. 14.ACHT - 0.27.TBHT ("c-h-')
Eq. 4
(min) Eq. 5
From the 4 anthropometric measurements that significantly influence the cooling rate only
MCSF and CG had a marked effect on to therefore ACHT and TBHT were not included
in the model (Eq. 5).
The cooling rates predicted by the regression model of Eq. 4 were compared with
those predicted by the model of Hayward et al. (1975) at different water temperatures
(Fig. 4-4). For this purpose the values of anthropometric variables in Eq. 4 were selected
from the average values of a Canadian population of 239 male university students. These
values are given in Table 4-4.
The prediction of survival time in this study was based on the assumption that
hypothermic death will occur on average at 30•‹C core temperature and the drop in core
temperature to 30•‹C was assumed to be linear. The average starting temperature of 44
subjects immersed in 3 different water temperatures and breathing air in this study was
37.2 * 0.2 "C.
Using the predictive relationships developed for to and CR (Eq. 4 and 5) a predictive
model for the survival time (ST) was constructed:
Fig. 4-5 compares the survival time predicted by the new model (Eq. 6) with Hayward's
model (Eq. 2). In this figure the new model (Eq. 6) used the mean anthropometric data
from the Canadian population of 239 male university students summarized in Table 4-4
(right).
Gerider diflererices iti tolerance litnits to cold water exposure
The new survival model was used to examine the effect of gender difference in tolerance
limits to cold water exposure (Fig. 4-6). The anthropometric data used in the model were
taken from an average Canadian student population of 206 females and 239 males. In
Table 4-4, this average Canadian population (right) is compared with 30 males and 14
females used in the present study (left). In addition, as the assumption of a cold tolerance
limit of 30•‹C is hypothetical, and based on very limited data a range of uncertainty was
introduced to the prediction of Fig. 4-6. It was assumed that upper and lower limits of
survival are 33•‹C and 27•‹C of core temperature for males (vertical stripes) and females
(horizontal stripes). This infers that at 30•‹C core temperature 50% of victims survive and
that certain death would occur below 27•‹C core temperature (although there are cases
reported when victims survive with even lower core temperature). The safe zone of Fig.
4-6 is below the shaded areas for each gender where the core temperature is above 33•‹C.
DISCUSSION
The predictive model for survival time developed in this study, is a simple relationship
between survival time and body physique of an inactive, nude person immersed in cold
water. It is based on linear regression equations of the time to establish core cooling and
the linear cooling rate, starting from a core temperature of 37 2•‹C down to 30•‹C, where
hypothermic death is assumed to occur The best prediction was achieved by using water
temperature, narcotic potency, medial calf girth, medial calf skinfold thickness, acromial
height and tibia1 height
When conducting multiple rwession analysis it was essential to determine the
minimum set of meaninghl independent variables to be used in the models According to
138
the regression analysis, the cooling rate is mainly dependent on the shape of the lower
body (CG and TBHT) and its insulative layer (MCSF). This would imply that most of
the body heat is lost through the lower extremities due to its higher surface area to mass
ratio ( A M ) compared with the trunk area Three out of four variables (CG, ACHT and
TBHT) correlated well with body mass, hrther indication that the body mass plays an
important role in the cooling processes. However, if CG, ACHT and TBHT are replaced
by weight alone in the predictive equation, important information on body physique is
lost. Cooling rate was also correlated with surface area to mass ratio ( A M ) , and surface
area (A) alone. There is also high correlation between A/M and WT which is due to the
way in which AM is determined. While weight and height (HT) are measured directly, A
is derived from a fhction of WT and HT. Similarly, there was a significant positive
correlation between ECTO, which is derived from height and weight ratio ( H T I ~ ~ )
and cooling rate. While muscle mass (Mmuscle) did not correlate well with CR both the
adipose tissue mass (AT) and ENDO, derived from the sum of three upper body skinfold
thickness (triceps + subscapular + supraspinal) did. However, when the derived variables
ECTO, END0 and MESO were combined together in a regression equation, or in a
multiplicative model of somatotype elements (ECTO/(MESO-ENDO)), the prediction
was poorer than with the present measured variables.
An artificial neural network and a linear regression model were applied to all data
to determine the model parameters. 29 different neural networks were designed and
tested. When the linear regression and neural network models were then applied to 85%
of the data and tested with the remainder of the data, suprisingly, the linear regression
equaled or outperformed the neural network in its power of prediction. It would be
expected, that in nonlinear problems, such as predicting cooling rate, the neural network
approach would be better. However, a weakness of the back-propagation algorithm when
applied to small data sets using many iterations is the possibility of overtraining the
network, and teaching it to perform well on the training sets only by learning the variance.
139
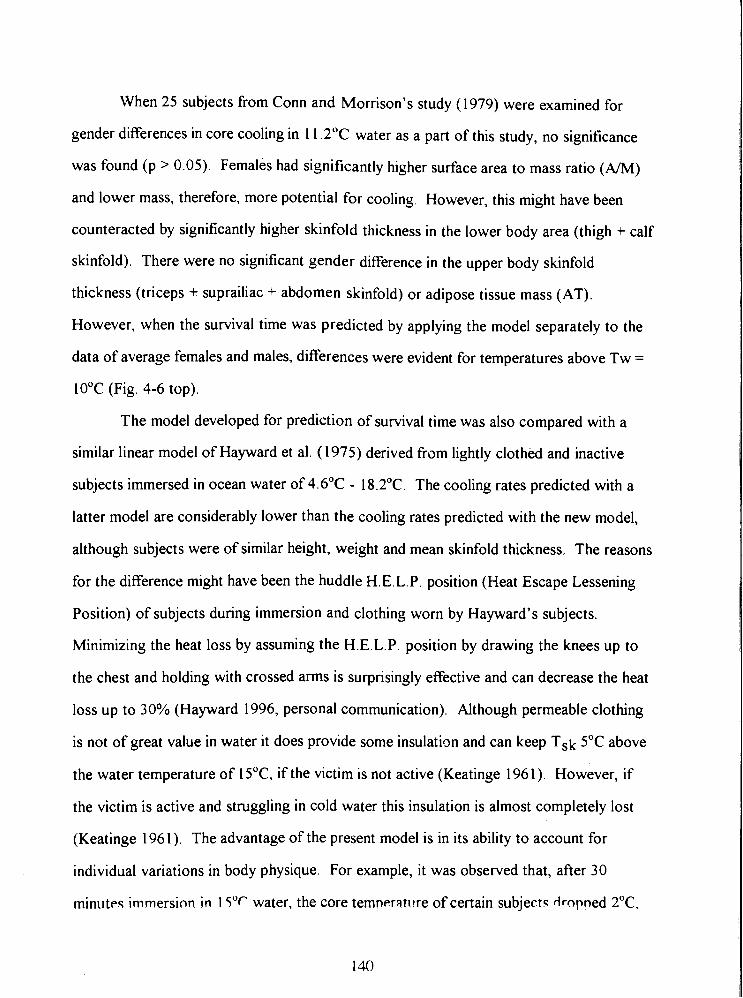
When 25 subjects from Conn and Morrison's study (1979) were examined for
gender differences in core cooling in 1 1 2•‹C water as a part of this study, no significance
was found (p > 0.05). Females had significantly higher surface area to mass ratio (A/M)
and lower mass, therefore, more potential for cooling However, this might have been
counteracted by significantly higher skinfold thickness in the lower body area (thigh + calf
skinfold). There were no significant gender difference in the upper body skinfold
thickness (triceps + suprailiac + abdomen skinfold) or adipose tissue mass (AT).
However, when the survival time was predicted by applying the model separately to the
data of average females and males, differences were evident for temperatures above Tw =
10•‹C (Fig. 4-6 top).
The model developed for prediction of survival time was also compared with a
similar linear model of Hayward et al. (1 975) derived from lightly clothed and inactive
subjects immersed in ocean water of 4.6"C - 18.2"C. The cooling rates predicted with a
latter model are considerably lower than the cooling rates predicted with the new model,
although subjects were of similar height, weight and mean skinfold thickness. The reasons
for the difference might have been the huddle H.E L P position (Heat Escape Lessening
Position) of subjects during immersion and clothing worn by Hayward's subjects.
Minimizing the heat loss by assuming the H.E.L.P. position by drawing the knees up to
the chest and holding with crossed arms is surprisingly effective and can decrease the heat
loss up to 30% (Hayward 1996, personal communication). Although permeable clothing
is not of great value in water it does provide some insulatim and can keep Tsk 5•‹C above
the water temperature of 15"C, if the victim is not active (Keatinge 196 1). However, if
the victim is active and struggling in cold water this insulation is almost completely lost
(Keatinge 1961). The advantage of the present model is in its ability to account for
individual variations in body physique For example, it was observed that, after 30
minutes immersion in 15•‹C water, the core temvratrrre of certain subject< rtropned 2•‹C.
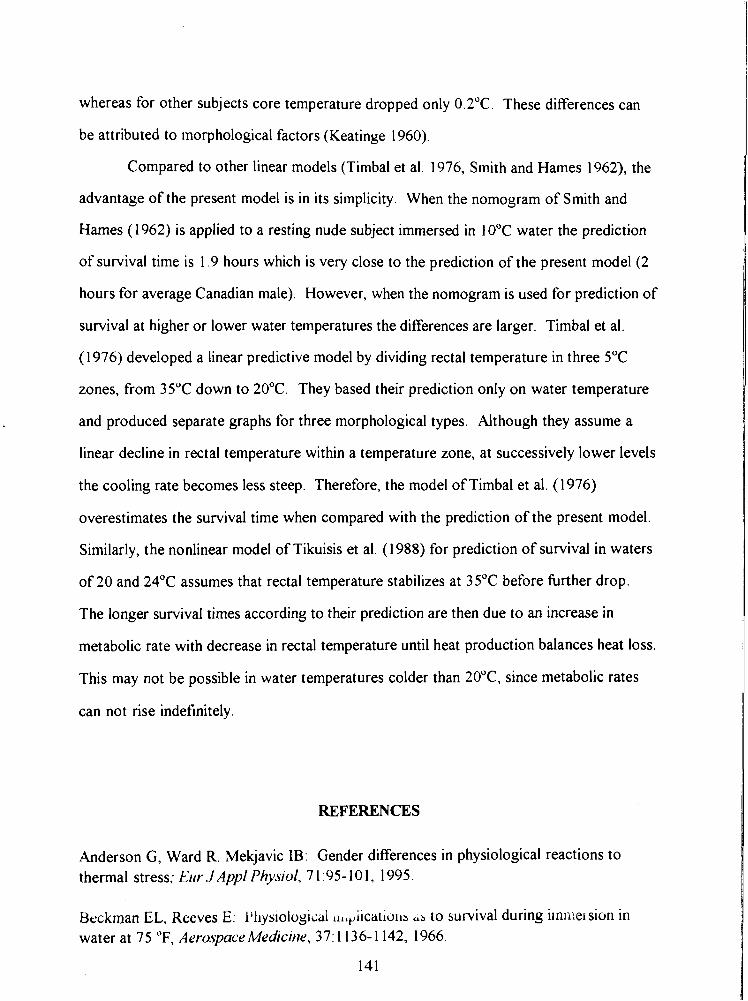
whereas for other subjects core temperature dropped only 0.2"C. These differences can
be attributed to ~norphological factors (Keatinge 1960).
Compared to other linear models (Timbal et al. 1976, Smith and Hames 1962), the
advantage of the present model is in its simplicity. When the nomogram of Smith and
Hames (1 962) is applied to a resting nude subject immersed in 10•‹C water the prediction
of survival time is 1.9 hours which is very close to the prediction of the present model (2
hours for average Canadian male). However, when the nomogram is used for prediction of
survival at higher or lower water temperatures the differences are larger. Timbal et al.
(1976) developed a linear predictive model by dividing rectal temperature in three 5•‹C
zones, from 35•‹C down to 20•‹C. They based their prediction only on water temperature
and produced separate graphs for three morphological types. Although they assume a
linear decline in rectal temperature within a temperature zone, at successively lower levels
the cooling rate becomes less steep. Therefore, the model of Timbal et al. (1976)
overestimates the survival time when compared with the prediction of the present model.
Similarly, the nonlinear model of Tikuisis et al. (1988) for prediction of survival in waters
of 20 and 24•‹C assumes that rectal temperature stabilizes at 35•‹C before hrther drop.
The longer survival times according to their prediction are then due to an increase in
metabolic rate with decrease in rectal temperature until heat production balances heat loss.
This may not be possible in water temperatures colder than 20•‹C, since metabolic rates
can not rise indefinitely.
REFERENCES
Anderson G, Ward R. Mekjavic IB: Gender differences in physiological reactions to thermal stress; Ekr J Appl Physiol, 7 1 :95- 101, 1995.
Beckman EL, Reeves E: i'hysiologiiai ~i~,~iicatiollb to survival during i~n~mision in
water at 75 "F, Aerospace Medicine, 37: 1 136- 1 142, 1966.
Bennett PB: Inert gas narcosis, In: The physioloay and ntedicirw of diving, Bennett PB and Elliot DH (Ed.), Best Publishing Co., San Pedro, CA, pp: 239-261,1982.
Bigelow WG, Lindsay WK, Greenwood WF: Hypothermia, its possible role in cardiac surgery: An investigation of factors governing survival of dogs at low body temperatures, Atit? Surg, 132:849-966, 1950.
Brooks CJ, Rowe KW: Water survival: 20 years canadian forces aircrew experience, Aviat Space Euviron Med, 55(1):41-51, 1984.
Burton AC, Edholm OG: Man in a cold environment, Monographs of the Physiological Society, No.2. Hafiler Publishing Comp., New York, N.Y ., 1969.
Carpenter FG: Anestehtic action of inert and unreactive gases on intact animals and isolated tissues, Ant J Physio, 178:505-509, 1954.
Carter E L : The Heath - Carter Somatotype Method, San Diego State University Syllabus Serveice, San Diego, 1980.
Carter E L : Physical structure of olympic athletes I: The Montreal Olympic Games Anthropological Project, Medicine andSport Science, Vol. 16, Karge Publ., Basil, 1982.
Clark RP, Edholm OG: Man in his thermal environment, Edvard Arnold (Publishers) Ltd., London, 1985.
Conn M, Morrison J: Unpublished data, School of Kinesiology, Simon Fraser University, Burnaby, B .C., Canada, 1979.
DuBois D, DuBois EF: Clinical calorimetry: A formula to estimate the approximate surface area if height and weight be known, Archives of internal medicine, 17:863-87 1 , 1916.
Featherstone R, Muehlbaecher C: The current role of inert gases in the search for anesthesia mechanisms, Pharntacol Rev, 15 :97- 12 1, 1963.
Funahashi KI: On the approximate realization of continious mapping by neural networks, Neural Networks, 2: 183-192, 1989.
Hall SF Jr: Prediction of tolerance in cold water and life raft exposures, Aerospace Med, 43(3):28 1-86, 1972.
Harnett RM, Pn~itt JR, Sias FR: A review of the literature concerning resuscitation from hypothermia: Part I- The problem and general approaches, Aviat Space Dtvirotl Med, 53(5):325-434, ' %'?
Hayward JS, Eckerson JD, Collis ML: Thermal balance and survival time prediction of man in cold water, Can J Physiol Pharnmol, 53 : 2 1-3 2, 1975.
Hayward M G, Keatinge WR: Roles of subcutaneous fat and thermoregulatory reflexes in determining ability to stabilize body temperature in water, JPhysiol, 320:229-25 1, 1981.
Hervey GR: Physiological changes encountered in hypothermia, Proc. of RoyalSoc. Med, 66:1053-1058, 1973.
Hush DR Horne BG: Progress in supervised neural networks; What's new since Lippmann, IEEE Sipa l Processing Magaim, January, pp: 8-3 7, 1993.
Keatinge WR: The effect of subcutaneous fat and of previous exposure to cold on the body temperature, peripheral blood flow and metabolic rate men in cold water, JPhysiol, 1531166-178. 1960.
Keatinge WR: The effect of work and clothing on the maintenance of the body temperature in water, &art J Exp Physiol, 46:69-82, 1961.
Kerr D: An anthropometric method for the fractionation of skin, adipose, bone, muscle and residual tissue masses, in males and females 6 to 77 years, MSc. Thesis, Simon Fraser University, Burnaby, B.C., Canada, 1988.
Kollias J, Barlett L, Bergsteinova V, Skinner JS, Buskirk ER, Nicholas WC: Metabolic and thermal of women during cooling in water, JApplPhysiol, 36(5):577-580, 1974.
McArdle WD, Magel JR, Gergley TJ, Spina RJ, Toner MM: Thermal adjustment to cold water exposure in resting men and women, JAppl Physiol, 56(6): 1565-1 57 1, 1984.
Molnar GW: Survival of hypothermia by men immersed in the ocean, J.A.M.A., 13 l(l3): 1046-1050-336, 1946.
Park YS, Pendergast DR, Rennie DW: Decrease in body insulation with exercise in cool water, Utldersea Biomedical Research, 1 l(2): 159- 168, 1984.
Popovic V, Popovic P: Hypothermia irl biology mdmedicine, Grune and Stratton Publ., New York. 1974.
Pugh LGC, Edholm G: The physiology of channel swimmers, Lancet, 2:76 1-768, 1955.
RossWD, Marfell-Jones MJ: Kinanthropometry; In: MacDougall JD, Wenger HA, Green HJ. eds. Physio/ogit:d t ~ c t i u p c ? f the elite athlete. C'hnn~pcrig)~. IL: Human Kinetics, pp:223- 308, 1991.
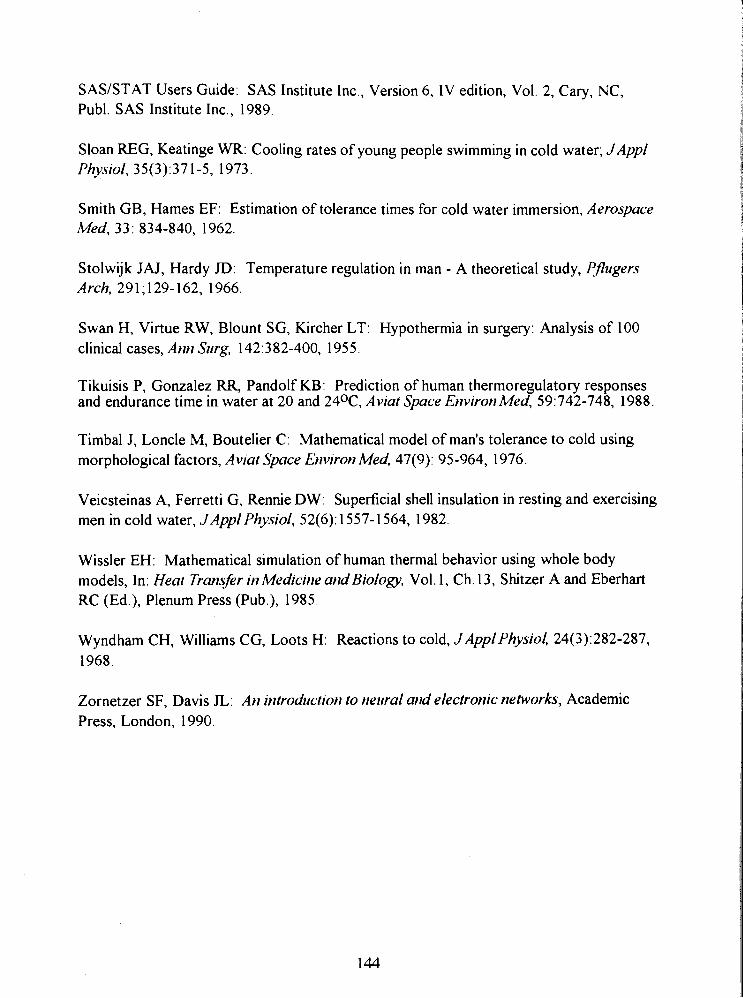
SASISTAT Users Guide: SAS Institute Inc., Version 6, IV edition, Vol. 2, Cary, NC, Publ. SAS Institute Inc., 1989.
Sloan REG, Keatinge WR: Cooling rates of young people swimming in cold water; JAppl Physiol, 35(3):371-5, 1973.
Smith GB, Hames EF: Estimation of tolerance times for cold water immersion, Aerospace Med, 33: 834-840, 1962.
Stolwijk JAJ, Hardy JD: Temperature regulation in man - A theoretical study, Pflugers Arch, 29 1 ; 129- 162, 1966.
Swan H, Virtue RW, Blount SG, Kircher LT: Hypothermia in surgery: Analysis of 100 clinical cases, A m Sirrg, l42:382-4OO, 1955.
Tikuisis P, Gonzalez RR, Pandolf KB: Prediction of human thermoregulatory responses and endurance time in water at 20 and 24OC, Aviat Space E~~viro t~ Med, 59:742-748, 1988.
Timbal J, Loncle M, Boutelier C : Mathematical model of man's tolerance to cold using morphological factors, Aviat Space EmGrotl Med, 47(9): 95-964, 1976.
Veicsteinas A, Ferretti G, Rennie DW: Superficial shell insulation in resting and exercising men in cold water, JAppl Physiol, 52(6): 1557-1 564, 1982.
Wissler EH: Mathematical simulation of human thermal behavior using whole body models, In: Heat Transfer in Medicine and Biology, Vol. 1, Ch. 1 3, S hitzer A and Eberhart RC (Ed.), Plenum Press (Pub.), 1985.
Wyndham CH, Williams CG, Loots H: Reactions to cold, JAppl Physiol, 24(3):282-287, 1968.
Zornetzer SF, Davis JL: An introd~rctioti to rleural mid electronic tletworks, Academic Press, London, 1990.

TABLES AND FIGURES
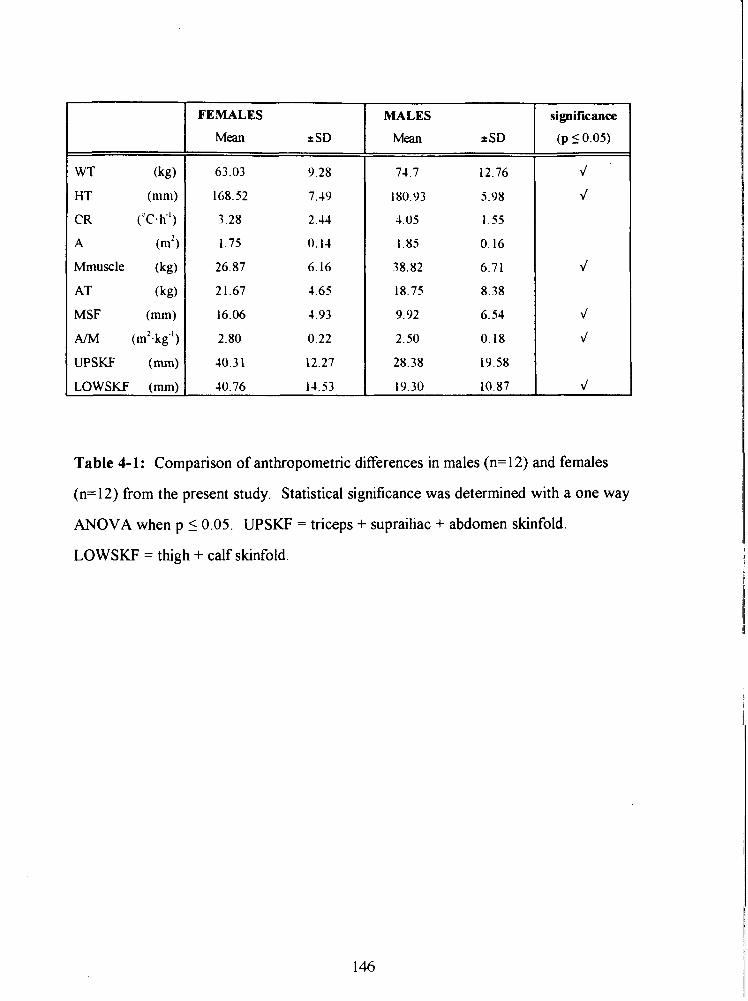
WT (kg)
HT (mm)
CR ('c. h-I )
A (m2)
Mmuscle (kg)
AT (kg)
MSF (mm)
AIM (m2.kg'l)
UPSKF (mm)
LOWSKF (mm)
FEMALES MALES
Mean + SD *SD
significance
(p 50.03
Table 4-1: Comparison of anthropometric differences in males (n=12) and females
(n=12) from the present study. Statistical significance was determined with a one way
ANOVA when p 10.05. UPSKF = triceps + suprailiac + abdomen skinfold.
LOWSKF = thigh + calf skinfold.
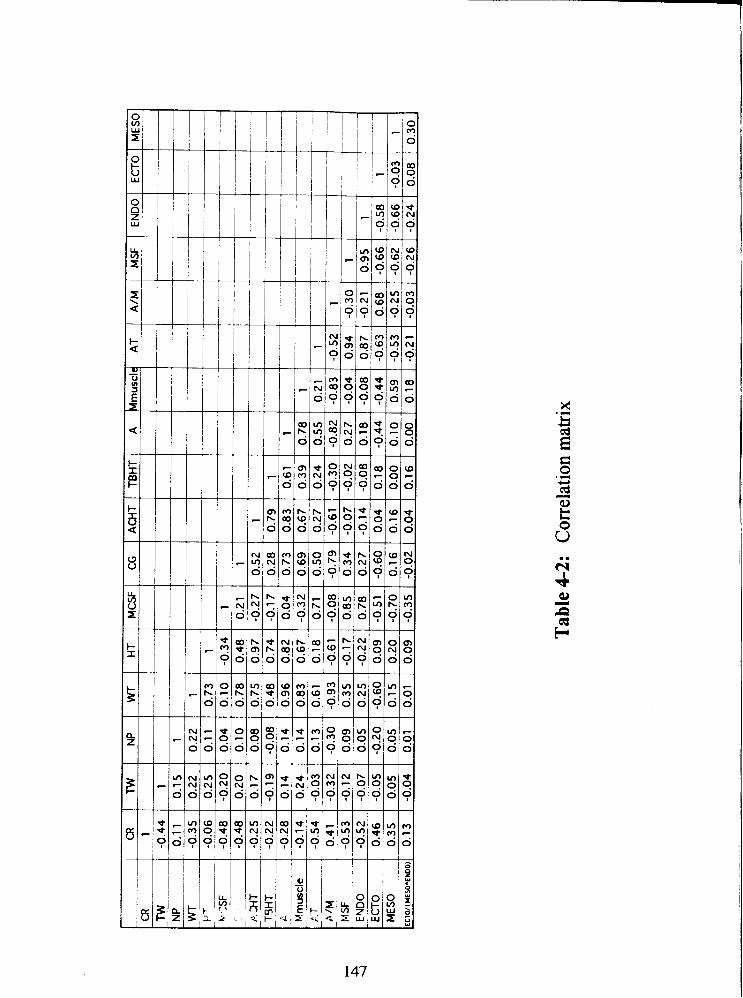
INPUT TRAIN ITEmTlONS NEURONS TEST MSE r DATA DATA
Table 4-3: Comparison of performance of FFNN with linear regression (*). Last
column in the table presents the correlation coefficient for linear regression.
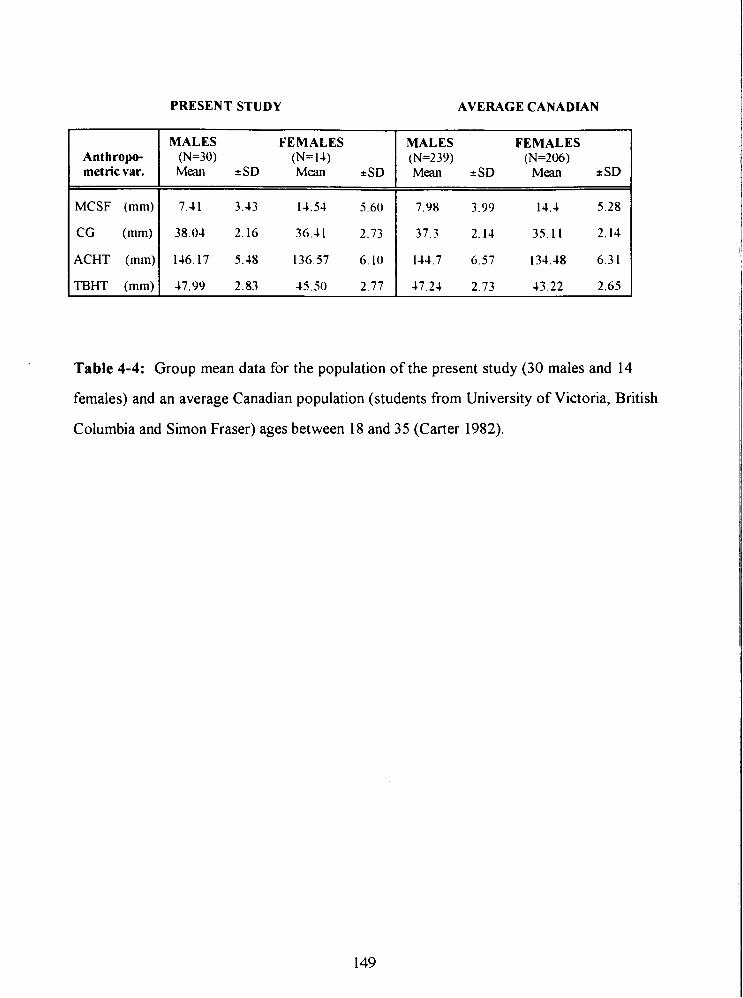
PRESENT STUDY AVERAGE CANADLAN
Anthropo- metricvar.
Table 4-4: Group mean data for the population of the present study (30 males and 14
females) and an average Canadian population (students from University of Victoria, British
Columbia and Simon Fraser) ages between 18 and 35 (Carter 1982).
MCSF (mm)
CG (mm)
ACHT (mm)
TBHT (mm)
MALES FEMALES (N=30) (N= 14) Mean +SD Mean +SD
7.41 3.43 14.54 14.4 5.28
38.04 2.16 36.4 1 37.3 2.14 35.11 2.14
146.17 5.48 134.48 6.31
47.99 2.83 45.50 43.22 2.65
MALES FEMALES (N=239) (N=206) Mean +SD Mean + SD
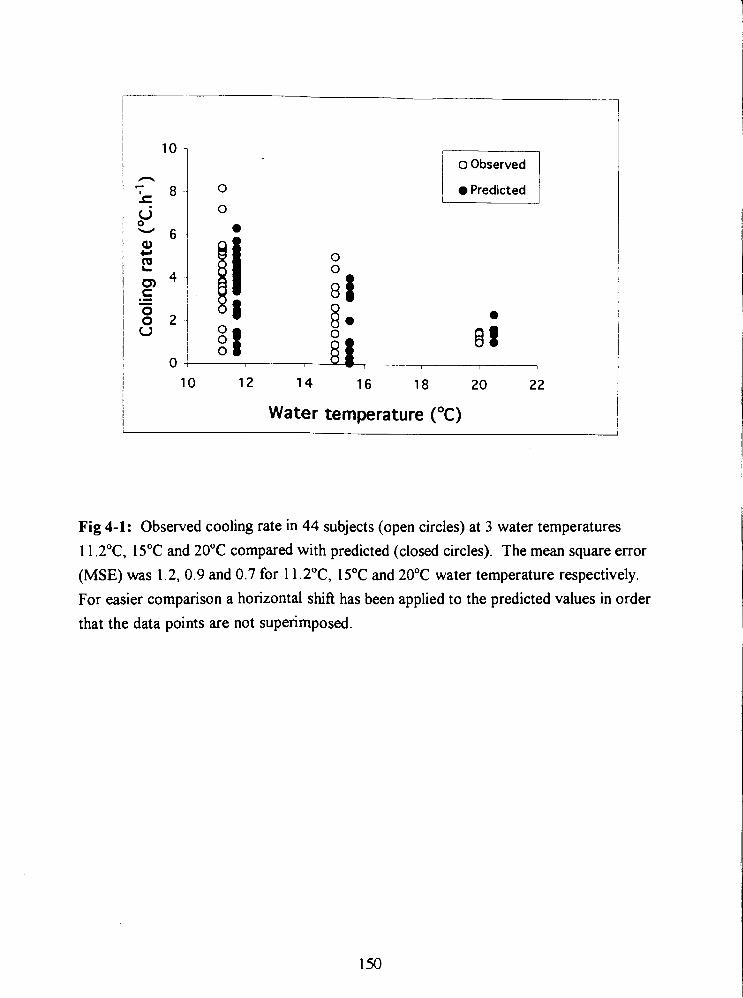
Predicted I
10 12 14 16 18 20 2 2
Water temperature (OC)
Fig 4-1: Observed cooling rate in 44 subjects (open circles) at 3 water temperatures 11.2"C, 15•‹C and 20•‹C compared with predicted (closed circles). The mean square error (MSE) was 1.2, 0.9 and 0.7 for 1 1.2"C, 15•‹C and 20•‹C water temperature respectively. For easier comparison a horizontal shift has been applied to the predicted values in order that the data points are not superimposed.
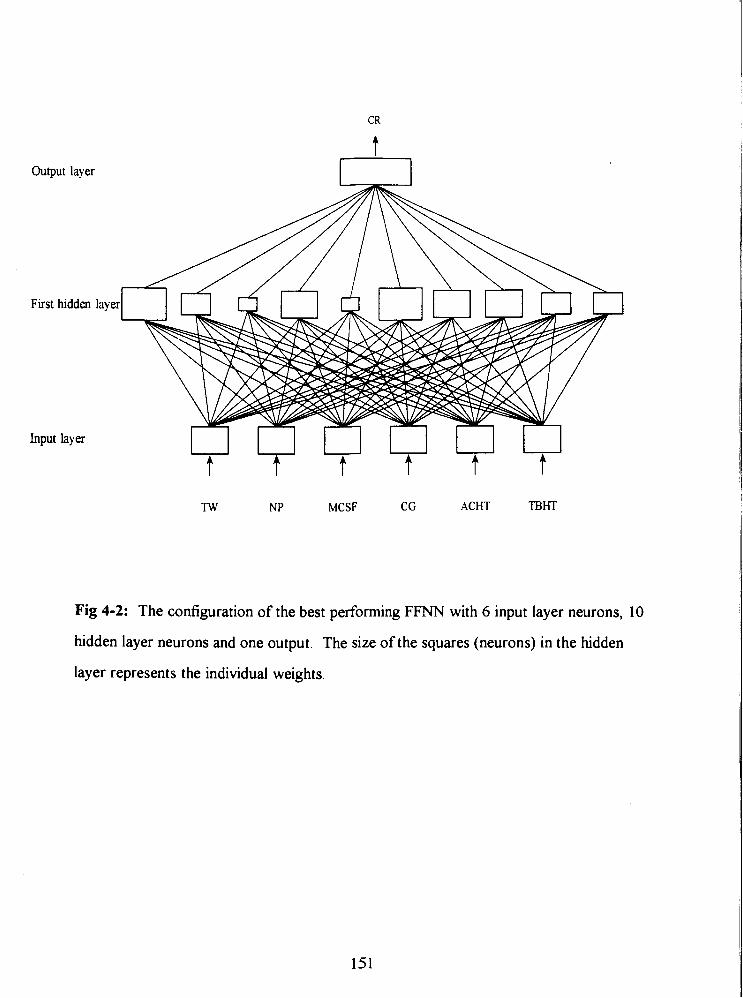
Output layer
First ludden layex
Input layer
TW NP MCSF CG ACHT TBHT
Fig 4-2: The configuration of the best performing FFNN with 6 input layer neurons, 10
hidden layer neurons and one output. The size of the squares (neurons) in the hidden
layer represents the individual weights.
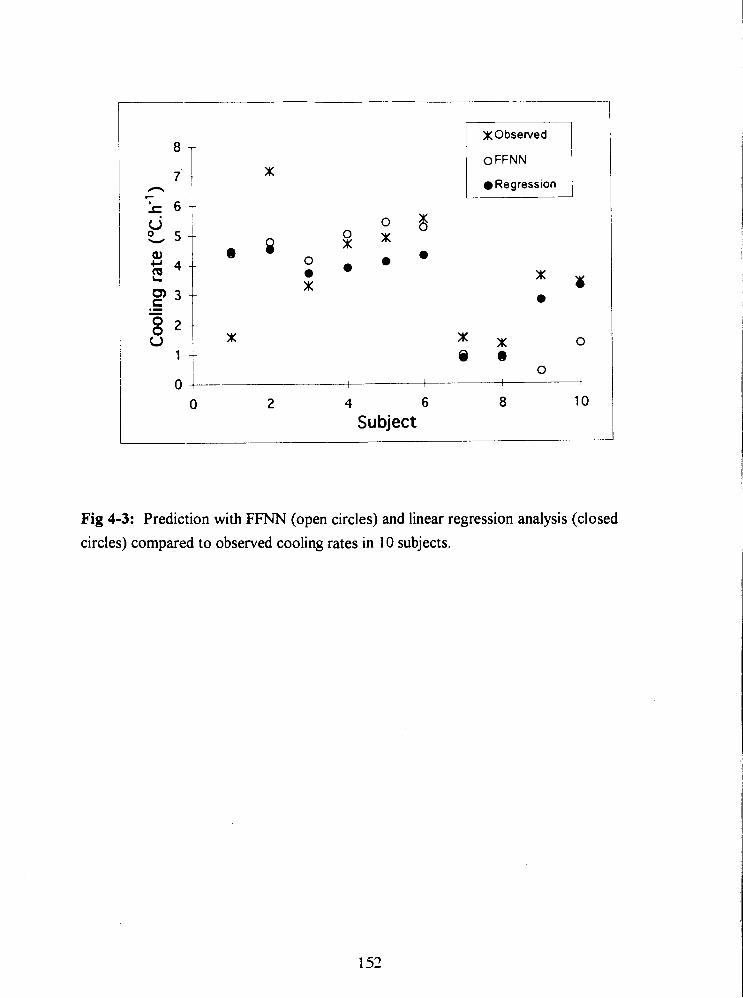
x Observed
o FFNN
Regression
0 2 4 6 8 10 Subject
Fig 4-3: Prediction with FFNN (open circles) and linear regression analysis (closed circles) compared to observed cooling rates in 10 subjects.
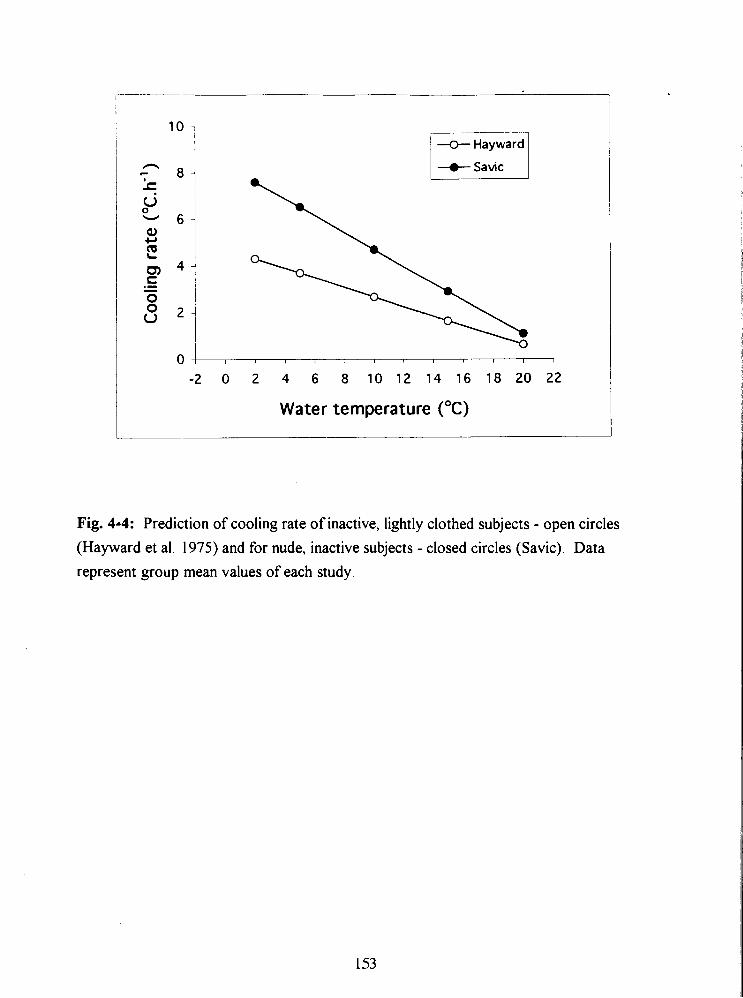
u Hayward
-a- Savic
-2 0 2 4 6 8 10 12 14 16 18 20 22
Water temperature ("C)
Fig. 4-4: Prediction of cooling rate of inactive, lightly clothed subjects - open circles
(Hayward et al. 1975) and for nude, inactive subjects - closed circles (Savic). Data
represent group mean values of each study.
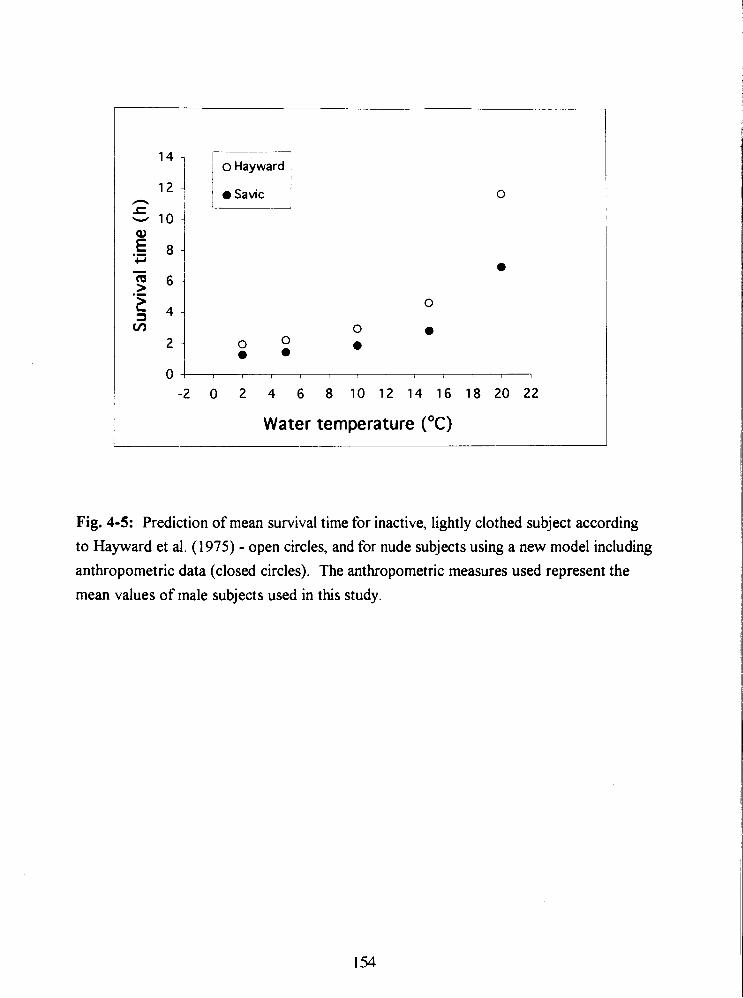
1 r7~ o Hayward
-2 0 2 4 6 8 10 12 14 16 18 20 22
Water temperature ("C)
Fig. 4-5: Prediction of mean survival time for inactive, lightly clothed subject according
to Hayward et al. (1975) - open circles, and for nude subjects using a new model including
anthropometric data (closed circles). The anthropometric measures used represent the
mean values of male subjects used in this study.
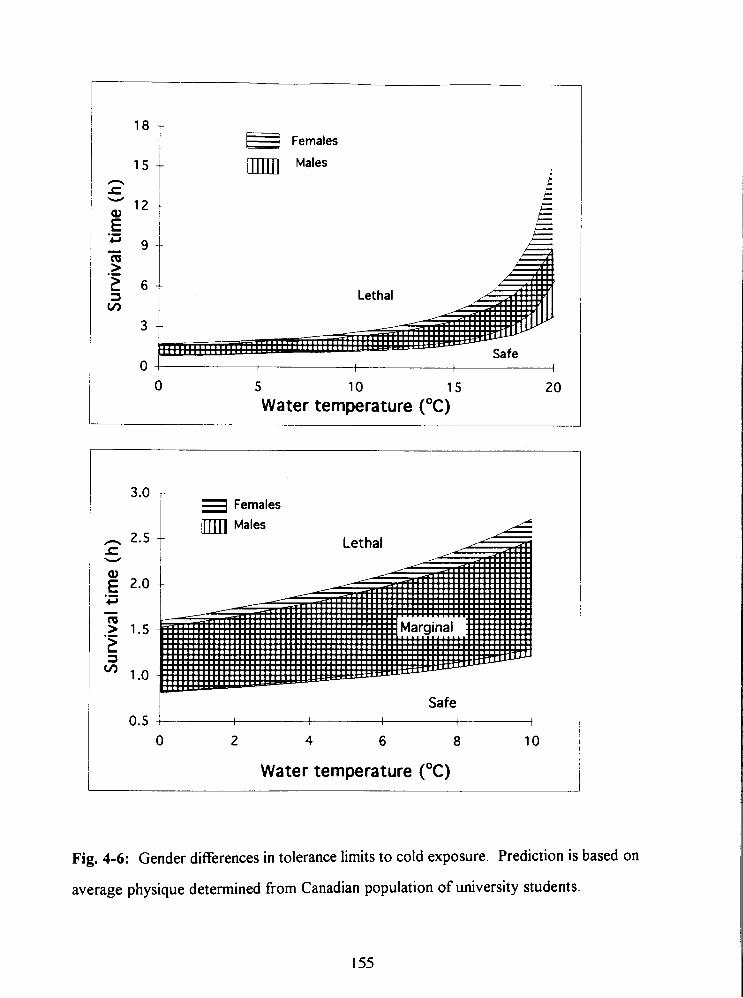
Females
Males
0 I 1 4 I 1
0 5 10 15 20
Water temperature ("C)
L Safe 6 0.5 1
1 I I I
0 2 4 6 8 10
Water temperature ("C)
Fig. 4-6: Gender differences in tolerance limits to cold exposure. Prediction is based on
average physique determined from Canadian population of university students.
GENERAL DISCUSSION
Despite recent improvements in diver thermal protection (Romet et al. 1991, Webb 1985,
Elliott 198 I), cold exposure during diving operations continues to be a problem affecting
both a diver's performance and safety and is not fully appreciated by either divers or
supervisory personnel. With the thermal conductivity of water 26 times greater than air,
hypothermia of the body core and extremities is a frequent problem. Divers complain of
overheating and fatigue due to having to dress in restrictive thermally protective wet or
dry suits and wait prior to cold water exposure. Later during the dive, excessive
perspiration during prolonged swimming and heavy underwater work decreases the
thermal insulation of divers undergarments exposing the diver to hypothermia. Repetitive
dives started before the diver is properly rewarmed, cause the depleted body heat stores
to be further eroded. Although hypothermia observed in divers has been attributed
primarily to the hostile physical conditions of the underwater environment, which
accelerate the heat loss from the skin surface and respiratory tract, the findings of this
thesis show that the contribution of inert gas narcosis to the development of hypothermia
during diving cannot be neglected.
Study I, undertaken to investigate human thermoregulatory responses to cold
water immersion (1 5•‹C) during compressed air breathing (6 ata) yielded several important
findings. The core cooling rate of immersed subjects was significantly greater and the
onset of continuous cooling was significantly faster at 6 ata than at 1 ata. This would
imply that either a subject's heat loss or heat production was altered due to compressed
air breathing. In addition, immersion at 6 ata was perceived as being significantly less
cold, despite a lower core temperature. This confirms the observation of other
researchers (Passias et al. 1992, White et al. 1980). It was suggested that faster cooling
and a blunted appreciation of cold are both due to the narcotic effect of N2 in compressed
air.
While N2 in compressed air has been widely appreciated to exert narcotic effects
when breathed at depths greater than 30 meters of sea water (Bennett 1993), and air
breathing not recommended for diving beyond 6 ata, the effect of increased PO2 and
pressure per se might also account for faster cooling or blunted cold perception. To
study the effect of pressure, N2 in compressed air would have to be replaced by a non
narcotic gas such as helium. Helium is commonly used in deep diving but has high
thermal conductivity requiring the use of heated diving suits and breathing gas. Oxygen,
on the other hand, is almost twice as potent an anesthetic as N2 according to the lipid
solubility theory but is usually recognized for its toxic effects, causing convulsions at a
PO2 greater than 2 atm. In order to eliminate the effects of pressure and N2 narcosis, the
hyperoxia present at 5 ata air breathing was investigated by requiring the subject to
breathe pure oxygen at 1 ata (PO2 = 1 atm; Study 11). Hyperoxia did not affect either core
cooling or perception of cold in subjects immersed in cold water. This is probably due to
respired O2 being used in metabolism and removed from solution rather than from blood
oxyhemoglobin which would tend to lower the actual tension of dissolved O2 in the brain
(Smith and Paton 1976). The lack of an effect of PO2 strengthened the hypothesis that
PN2 is the principal cause for increased core cooling and altered perception of thermal
state. Further experiments were carried out to quantiQ the effect of PN2 (Study 111).
An increased core cooling rates and an impaired perception of cold has been also
observed during 30% N20 breathing in subjects immersed in 15•‹C water (Passias et al.
1992). It was, therefore, hypothesized that increased PN2 would exert a similar effect on
thermoregulation as N20. Lipid solubility has been found to correlate well with the
narcotic effects of an inert gas (Bennett 1993). To quantitjl the effect of the inert gases,
N2 and N20, at various partial pressures. the narcotic potency (atm) of the breathing
mixture was calculated as the product of the Bunsen coefficient (cc-cc-') a measure of lipid
solubility, and the partial pressure of the inert gas (Study 111, IV). The effect of O2 was
not included in the calculations since PO2 of 1 atm did not impair the thermoregulatory
response in subjects exposed to cold (Study 11). Furthermore, the narcotic potency of a
gas is usually determined from experimental studies where the abolition of the righting
reflex in animals or patients is examined in the presence of 0.6 - 1.2 atm of O2 (Eger 1985,
Smith et al. 1979, Smith and Paton 1976). Results of Study 111 show that both shivering
threshold and perception of thermal comfort are linear fknctions of the narcotic potency
of N2 and N 2 0 (Fig. 3-9). The narcotic potency of a 30% N20 breathing mixture was
calculated as the sum of NP for PN2 = 0.5 atm and N20 = 0.3 atm. The results of Study I
are in agreement with those presented in Fig. 3-9. The average vote of -4 fiom the thermal
comfort scale at ATes = -0.5"C in 6 ata trial would lie almost exactly on the linear
regression line.
Comparison of results from Studies I, I1 and I11 with other studies using
hyperbaric N2 or anesthetic agents is difficult due to the fact that the definition of
"anesthesia" and "narcotic potency" varies with investigator and the species used in the
study. Winter et al. (1975) demonstrated anesthetic properties of N2 in air even at normal
atmospheric pressure. They showed a 9.3 % decrease in response time to audiovisual
stimulus in 20 subjects when N2 in the air was replaced with He. Fowler et al. (1980) and
Biersner (1972) have demonstrated that N20 and hyperbaric N2 exert an identical narcotic
effect on memory, auditory perception and other fknctions involved in skilled
performance. Comparative behavioral studies by Biersner (1987) have shown that 30%
N 2 0 induces psycho-motor impairment similar to compressed air at 6.7 ata (PN2 = 5.36
atm).
For comparison of results one of the few accepted definitions of anesthetic
potency in clinical practice using general anesthetics was used - MAC. MAC (minimum
alveolar concentration of anesthetic) is expressed as the pressure of a gas in atmospheres
of, that produces abolition of movement in 50% of the subjects exposed to a noxious
stimulus and is based on lipid solubility (Eger 1974). For humans this relationship is
described by: MAC . oiVgas partition coefficient = 1.4 (Hornbein et al. 1982, Eger 1969).
The oiVgas partition coefficient for N2 (0.067) gives a predicted MAC of 21 atmospheres,
and MAC of N20 determined in humans is 1 .O4 (Eger 1985, Hornbein et al. 1982). The
oiVgas partition coefficient describes the relative capacity per unit volume of two solvents
such as lipid and gas for particular anesthetic and is equivalent to lipid solubility
coefficient. Therefore the PN2 of 6.5 atm (8.13 ata air) would have similar narcotic
potency (0.3 1 MAC) as 30% N20 (0.3 1 MAC). The predicted anesthetic potency of
30% N20 according to MAC value is approximately 10% lower than the prediction for
30% N20 alone using the Bunsen coefficient (PN2 = 7.16 atm). This difference could be
due to the different techniques and species in determining MAC and EDSo, differences in
lipid solubility coefficient (Oswald opposed to Bunsen coefficient) or a pressure reversal
of anesthesia. Although Eger et al. (1969) showed an excellent correlation between the
anesthetic potency measured in MAC (atm) and lipid solubility, which supports the
method used to calculate narcotic potency in this thesis, the authors could not
experimentally determine MAC for N2 at high pressure. Two dogs tested with N2 in that
study continued to respond to a noxious stimulus at PN2 = 43.5 atm, which was the limit
of the pressure chamber. Smith et al. (1979) later demonstrated that anesthesia in mice
can be reversed by pressure. Their EDSo values for nitrogen and argon, which abolished
the righting reflex in animals, were considerably higher (38.3 and 16.7 ata for N2 and Ar,
respectively) than predictions based on olive oil solubility. Although the antagonism of
anesthesia as shown in rats (Halsey et al. 1978), newts and mice (Lever et al. 1971) and
tadpoles (Johnson and Flagler 1950) required higher hydrostatic pressures, its
confounding effect at pressures as low as 5 and 6 ata cannot be excluded. Therefore the
anesthetic effect of increased PN2 on the VO? response in the present studies (I, 111) was
possibly opposed bv the hydrostatic pressure.
The increase in body core cooling observed in Studies I and 111, and decrease in
core temperature for the initiation of shivering with increased narcosis (Study 111) are
supported by the results from cold water immersions of subjects breathing 30% N 2 0
(Passias et al. 1992 and Mekjavic and Sundberg 1992) and other anesthetics (Kurz et al.
1993, Sessler 1991). The ways that inert gas narcosis can affect the thermoregulatory
responses is either through an increase in heat loss or decrease in heat production. It is
possible that the increased core cooling rates measured in the 5 ata and 30% N20
conditions are also a result of increased heat loss from the periphery. However, the data
fiom Cheung (1993) and Passias et al. (1992) did not reveal any change in skin heat flux
during immersion with N20, which indicates that the amount of heat loss is similar during
N20 and air breathing.
From the results of present studies (I and 111) it is evident that the relation
between v O2 and core cooling was different for different levels of narcotic potency.
While compressed air at 3 ata did not influence VO*, 5 ata caused an increase in ~0~ in 5
subjects while 30% N20 attenuated the VO? response in all 9 subjects. The higher ~0~
during the 5 ata air trial, where only the 5 subjects with the fastest core cooling were
analyzed (III), was probably due to the greater cooling rate observed in immersion at 5
ata. The gain of the shivering response A V O ~ I A T ~ ~ , at 5 ata did not change compared to
1 ata. These findings agree with the results of Cheung (1993), who showed that low
doses of N20 (10% NzO) significantly increased the rate of core cooling and increased the
V 0 2 response over time, but did not affect the gain of the shivering response. This effect
of PN2 up to 4 atm and low doses of N20 (low NP) is schematically presented in Fig. 5.
With an increase in narcotic potency the shivering threshold is shifted to lower core
temperatures but the gain of the shivering response is not affected. However, when the
narcotic potency of the breathing mixture is higher, such as with 30% N20, the ~0~
respmse is suppressed (Study 111, Cheung 1993). The gain of the shiverin? response
A V O ~ I A T ~ ~ , is also reduced, while the threshold for the onset of shivering is
progressively shifted to lower Tes (Study 111). This effect of 30% N20 on
thermoregulatory responses is schematically presented in Fig. 5 with the dashed line
marked "high NP".
The amount of heat loss does not depend only on the temperature gradient
between the skin and environment and the composition and thickness of the peripheral
layers of the tissue, but also on the geometric shape and surface area across which heat is
dissipated. It is therefore understandable that the inclusion of morphology in the
predictive models would improve the prediction of cooling rates. This agrees with the
predictive model developed in this thesis, where cooling rate depends on the shape of the
lower body (CG and TBHT) and its insulative layer (MCSF). This would imply that
most of the body heat was lost through the lower extremities due to their greater surface
arealmass ratio compared to the trunk area. More recent evidence shows that during
periods of rest in cold water, unperfbed muscle can contribute more than a half of the
total insulation, however, during exercise that insulation can be totally lost (Park et al.
1982, Veicsteinas et al. 1982).
Some examples of cooling rates using a predictive model from Study IV are
summarized in Table 1. The data are taken from an average Canadian male student
population and the alterations made were one standard deviation from the mean. A
healthy male of average built and unprotected in 10•‹C water would cool according to the
prediction approximately 12.5% faster at 6 ata compared to 1 ata (Table 1). However,
when a male with a higher mean calf skinfold thickness (MCSF) is compared to an average
male at the same water temperature (1 O•‹C), he would cool 13.3 % slower. If MCSF and
calf girth (CG) are both greater, then a person would cool 3 1 8% slower than an average
individual. Also, the cooling rate of a tall person (with greater ACHT and TBHT) is
4.3% greater when compared to a person of average build. When a tall, thin person
(smaller MCSF and CG) is comnared to an average one, cooling rate is 36% faster.
Although the model developed for prediction of cooling rates accounts for body
physique, it is limited to healthy individuals, inactive and unprotected, immersed in cold
water. However, even with the use of a wet suit the insulation decreases with depth as
the gas trapped in the closed-cell neoprene becomes compressed. Park et al. (1984) have
demonstrated that workload also reduces overall insulation during cold water swimming
due to an increase in blood flow to working muscle.
Similarly, a limitation of the model for prediction of survival times during head out
immersion is that the prediction is based on an average healthy population (Canadian
student population). It was also assumed that hypothermia will generally precipitate
death in humans at 30•‹C due to loss of consciousness and drowning. The lower margin
for survival was assumed to be 27•‹C although there are reports of victims surviving with a
core temperature below 25•‹C (Hervey 1973).
In order to test the hypothesis that experimentation carried out with N20 is
applicable to diving applications, experiments were conducted to find the parallels
between the narcotic effect of PN2 and N20. Clinical studies have reported that body
core temperature decreases during prolonged anesthesia. Though this finding has been
attributed primarily to increased heat loss resulting from exposure of body cavities and
infkion of cold solutions, low temperature of operating rooms and ventilation with cold
gases, it is now generally recognized, that anesthesia interferes with the thermoregulatory
system. The finding that N20 in relatively low concentrations diminishes an individual's
ability to maintain thermal balance should be considered in clinical practice, for instance
when delivered to women during parturition.
Although the confounding effect of hydrostatic pressure can not be excluded, it
seems that in compressed air diving the levels of N2 are below the narcotic level that
would seriously affect the gain of shivering thermogenesis. However, the increased PN2
seems to have stronper effect on diver's appreciation of cold, which may ultimatelv lead
to hypothermia by influencing behavioral responses (Studies I-IV). The duration of a
dive and safety of the diver is normally determined by the subjective sensations of cold.
The blunted appreciation of cold at depths, together with a faster onset of cooling and
greater cooling rate as observed at 6 ata (Study I), will speed the progression of
hypothermia. Therefore, in deeper and more prolonged dives in cold water, the continued
reliance on a purely subjective assessment of thermal status must be considered
questionable.
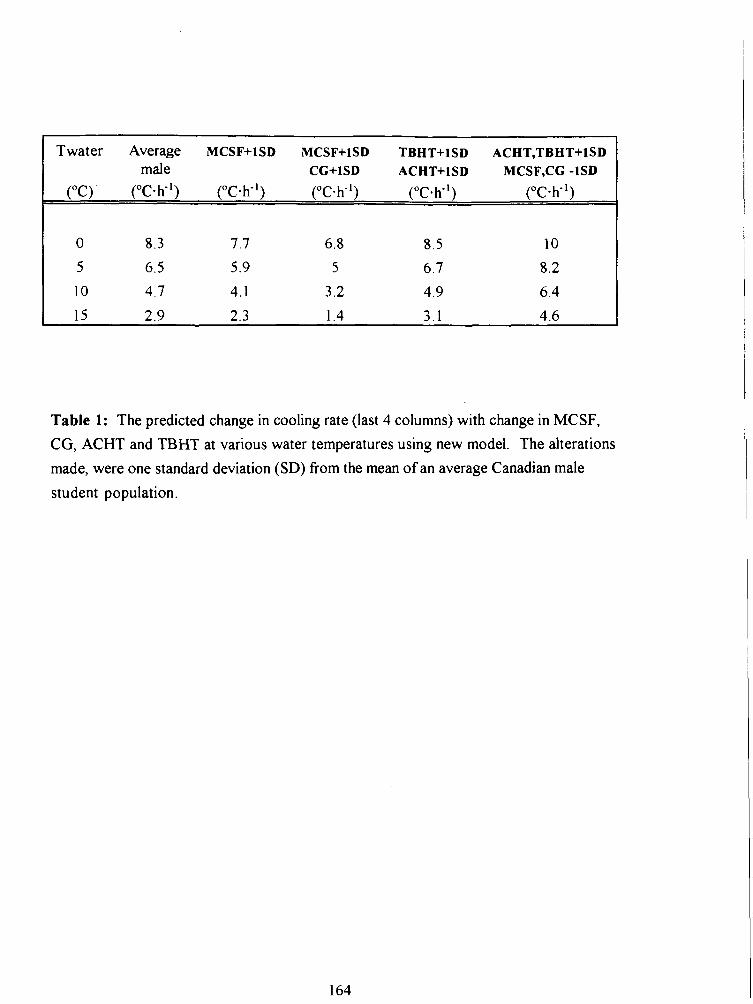
Twater Average MCSF+lSD MCSF+lSD TBHT+lSD ACHT,TBHT+lSD male CG+lSD ACHT+lSD MCSF,CG -1SD
("C) ( " ~ s h - ' ) ("C-h-') ("c-K') ("c.K1) ("c-K')
Table 1: The predicted change in cooling rate (last 4 columns) with change in MCSF,
CG, ACHT and TBHT at various water temperatures using new model. The alterations
made, were one standard deviation (SD) from the mean of an average Canadian male
student population.
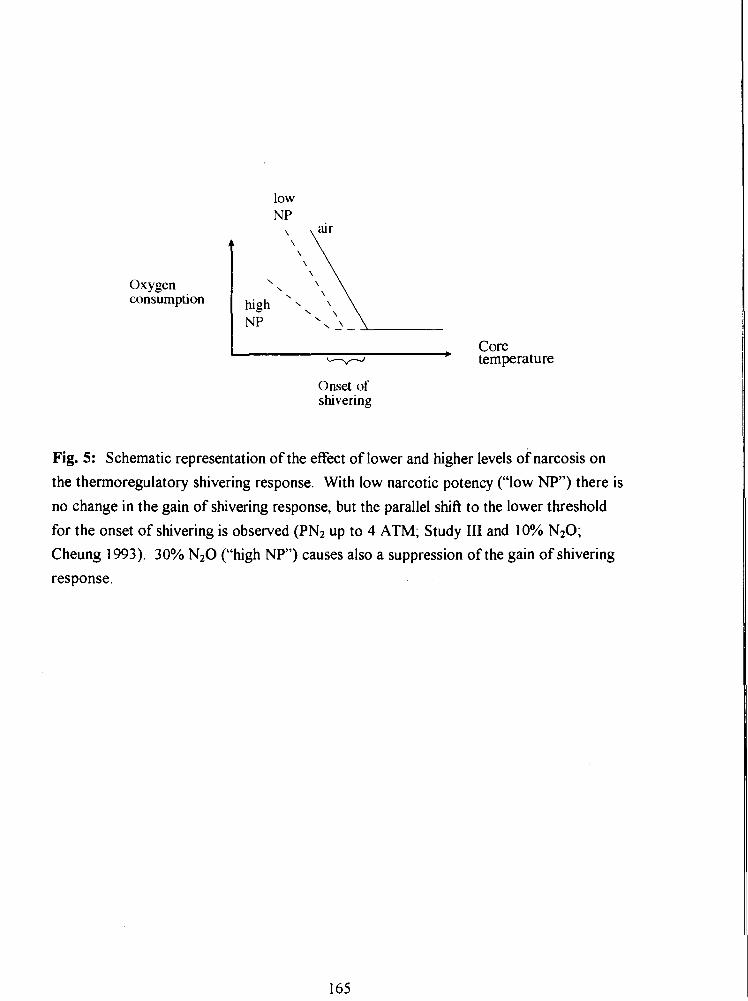
Oxygen consumption
core temperature
Onset of shwering
Fig. 5: Schematic representation of the effect of lower and higher levels of narcosis on
the thermoregulatory shivering response. With low narcotic potency ("low NP") there is
no change in the gain of shivering response, but the parallel shift to the lower threshold
for the onset of shivering is observed (PN2 up to 4 ATM; Study 111 and 10% N20; Cheung 1993). 30% N20 ("high NP") causes also a suppression of the gain of shivering
response.
SUMMARY
To date, the narcotic effects of hyperbaric environments have been based on the observed
decrements in psychomotor performance (Hesser et al. 1978) but its effect on autonomic
function such as thermoregulation have not been investigated thoroughly. Clinical studies
have shown, however, that anesthetic agents inhibit thermoregulatory responses in
animals (Hammel 1988) and humans (Sessler et al. l988a,b, Sessler 199 1). It was
therefore hypothesized that observed progressive hypothermia in divers could be due to
not only increased heat loss but also decreased heat production due to narcosis induced
by elevated PO2 and/or PN2 associated with compressed air diving. It was hrther
hypothesized that blunted appreciation of cold reported in divers (Winter et al. 1980,
Hayward and Keatinge 1979) could be also due to narcotic effect of compressed air and
would be similar to observed altered perception of thermal comfort in subjects breathing
30% N 2 0 while immersed in cold water (Passias et al. 1992, Mekjavic and Sundberg
1992).
In Study I subjects immersed in cold water at 6 ATA showed greater rates of core
cooling than at 1 ATA. Despite the greater cooling rates, subjects perceived the
immersions at 6 ATA as less cold than at 1 ATA. Due to problem with V O Z
measurements it is difficult to conclude from Study I whether there is any difference in
oxygen consumption between the 1 and 6 ATA immersion, but results from three
subjects do not show an effect of N2 narcosis on shivering thermogenesis at 6 ATA.
Study I1 demonstrated that 100% OZ breathing does not significantly affect core
cooling rates nor thermoregulatory shivering or perception of thermal comfort in subjects
immersed in 20•‹C water. Therefore increased core cooling at 5 and 6 ATA and altered
perception of thermal comfort observed at 6 ATA (I, HI), can be attributed to increased
PN2. The results however do not exclude the possibility of O2 exerting a significant
inhibitory influence on shivering at higher levels of POz.
Results from Study I11 demonstrate that during cold water immersions the gain of
the thermoregulatory heat production response does not depend on the PN2 within the
normal range of air diving. However, the core temperature threshold for the onset of
shivering is related to the narcotic potency of the inhalate and the relationship is linear.
Perception of thermal comfort is progressively improved with increased narcotic potency
of the breathing mixture, and the effect is also linear. Lower esophageal temperature
threshold for the onset of shivering thermogenesis, greater Tes cooling rate and attenuated
perception of cold with an increase in PN2, suggest that compressed air environments
contribute to delayed thermoregulatory and behavioral responses and faster development
of hypothermia. Breathing 30% N20 causes a greater effect on core cooling rates,
shivering response and perception of thermal comfort than increased PN2, which is in
accordance with its higher solubility in lipids and calculated narcotic potency. 30% N20
breathing causes a significant decrease in oxygen uptake despite increased core cooling.
When 5 subjects with highest cooling rates were analyzed, there was also evidence of
attenuated gain of shivering response.
From complete kinanthropometric assessments of body measures, derived
somatotype and other anthropometric variables a linear regression model was developed
for prediction of cooling rates in divers in waters up to 20•‹C. The model is based on four
anthropometric measures (mean calf skinfold thickness, mean calf girth, acrornial height
and tibia1 height), water temperature and narcosis level. The results show that the rate of
core cooling is strongly affected by body shape and composition. The developed model
derived from a data base of 79 immersions, breathing gases of 6 different narcotic
potencies at 3 water temperatures. provides a good indication of situations that can occur
during div;n- ;q m l d w3tF.r A model, based on body physique and water temperature,
was developed for prediction of survival time during head out immersion in cold water.
Although both models have the advantage that they are simple and account for individual
variations in body physique, they do not account for insulation provided with clothing,
activity level or variations in physiological responses such as shivering, vasoconstriction
and vasodilation.
CONCLUSIONS
A compressed air environment increases the core cooling rate and alters thermal
perception in humans immersed in 15•‹C water.
Thermal balance and perception of thermal comfort are not affected by hyperoxia
associated with compressed air breathing. Therefore, the effect of an altered
responses in cold may be attributed to hyperbaric N2.
The core temperature threshold for the onset of shivering is related to the narcotic
potency of the gas breathed and hence to the increase in PN2 of compressed air. The
relationship between the shivering threshold and narcotic potency (N2 and N20 gas
mixtures) is linear.
The gain of shivering thermogenesis (A v O * / A T ~ ~ ) in humans is not altered during
cold water immersion while breathing compressed air up to 5 ATA.
Perception of thermal comfort during cold water immersion in humans is
progressively improved by an increase in narcotic potency of the breathing mixture,
and the effect is linear.
There is no gender difference in the core cooling rate of humans immersed in 1 1.2"C
water.
The best anthropometric variables for predicting the core cooling rate in humans are
medial calf skinfold thickness, medial calf girth, acrornial height and tibia1 height.
REFERENCES
Abraini JH, Joulia F: Psycho - sensorymotor performance in divers exposed to 6 and 7 ATA of compressed air, Eur J Appl Physiol, 65: 84-87, 1992.
Adolfson J: Deterioration of mental and motor hnctions in hyperbaric air, ScandJ Phy~iol, 6126-32, 1965.
Atkins AR, Wyndham CH: A study of temperature regulation in the human body with the aid of an analog computer, Pfugers Arch 307: 104-1 19, 1969.
Bean JW: Tensional changes of alveolar gas in reactions to rapid compression and decompression and question of nitrogen narcosis, Am J Physiol, 16 1 :417-425, 1950.
Behnke AR, Thomson RM, Motley EP: The psychologic effects from breathing air at 4 atmospheres pressure, Amer JPhysiol, 1 12:554-558, 193 5.
Behnke AR, Yarbrough OD: Respiratory resistance, oil-water solubility, and mental effects of argon, compared with helium and nitrogen, Am J Physiol, l26:409-4 15, 1939.
Bennett PB: Inert gas narcosis, In: The physiology and medicine of diving,' 3rd Ed., Bennett PB and Elliott DH (Ed.), Best Publishing Co., San Pedro, CA, pp: 239-261, 1982.
Bennett PB : Inert gas narcosis, In: The physiology and medicine of diving, 4th Ed., Bennett PB and Elliott DH (Ed.), Best Publishing Co (Publ.), San Pedro, CA, pp: 170- 193, 1993.
Bennett PB, Ackles KN: The narcotic effects of hyperbaric oxygen, 4th Int Con Hyperbaric Me4 Sapporo, Japan, pp: 74-79, 1969.
Bennett PB, Blenkarn DG, Youngblood D: Supression of the high pressure nervous syndrome in human deep dives by He-N2-02, Undersea Biomed Res, l(3):22 1-237, 1974.
Bennett PB, Papahadjopoulos D, Bangham AD: The effects of raised pressure of inert gas on phospholipid membranes, Life Sci, 6:2527-2533, 1967.
Bennett PB: Cortical C02 and O2 at high pressures of argon, nitrogen, helium and oxygen, JAppl Physiol, 20(6): 1249-1252, 1965.
Biersner RJ: Emotional and physiological effects of nitrous oxide and hyperbaric air narcosis, Aviat Space Environ Med, 58:34-3 8, 1978.
Biersner RJ: Selective performance effects of of nitrous oxide, Hum Factors, 14: 187- 194, 1972.
Biersner RJ, Hall DA, Neurnrnan TS, Linaweaver PG: Learning rate equivalency of two narcotic gases App ' py 3' Am 9747-50, 1977.
Bligh J: Temperature regulation in mammals and other vertebrates, Neuberger A and Tatum EL (Eds.), North Holland, Amsterdam, 1973.
Bligh J: Engineering models of mammalian thermoregulation, In: Temperature regulation in mammals and other vertebrates, Neuberger A and Tatum EL (Eds.), North Holland, Amsterdam, pp: 153- 173, 1973a.
Bligh J: Neuronal models of temperature regulation, In: Temperature regulation in mammals and other vertebrates, Neuberger A and Tatum EL (Eds.), North Holland, Amsterdam, pp: 174- 19 1, 1973 b.
Bligh J: Temperature regulation: A theoretical consideration incorporating Sherringtonian principles of central neurology, (Review), J 7herm Biol, 9(l/2): 3-6, 1984.
Brauer RW, Johnsen DO, Pessotti RL, Redding RW: Effects of hydrogen and helium at pressures to 67 atmospheres on mice and monkeys, FedProc, 25:202, 1966.
Carpenter FG: Anesthetic action of inert and unreactive gases on intact animals and isolated tissues, Am JPhysiol, 178:505-509, 1954.
Case EM, Haldane JBS: Human physiology under high pressure I. Effects of nitrogen, carbon dioxide and cold, JHyg, 4 1 (3):225-249, 194 1.
Chattonet J, CabanacM: The perception of thermal comfort, Int JBiometeor, 9: 183- 193, 1965.
Cheung SS: Dose-dependent effects of sub-anesthetic levels of nitrous oxide on thermal balance in humans, M.Sc. nesis , School of Kinesiology, Simon Fraser University, 1993.
Coleshaw SRK, Johnston G, MacDonald AG, Pertwee RG: Effects of subanesthetic doses of of nitrous oxide on thermal perception in man, J Physiol (Lon4.427: 14P, 1990.
Cooper KE, Kenyon JR: A comparison of temperatures measured in the rectum, oesophagus, and on the surface of the aorta during hypothermia in man, Br JSurg, 44:616-19, 1957.
Cooper KE, Martin S, Riben P: Respiratory and other responses in subjects immersed in cold water, JAppl Physiol, 40(6):903-9 10, 1976.
Cranston WI, Gerbrandy J, Snell ES: Oral, rectal and oesophageal temperatures and some factors affecting them in man, JPhysiol, 126:347-358, 1954.
Cremer JE, Bligh J: Body temperature and responses to drugs, BrMed Bull, 25:299-306, 1969.
Crosbie RJ, Hardy JD, Fessenden E: Electrical analog simulation of temperature regulation in man, IRE Trans. biomed. Electron, BME, 8(4), 1 96 1 .
Damant GLC: Physiological efect of work in compressed air, Nature, l26:3 181, 1930.
Davis H, Collins W, Randt C, Dillon W: Effects of anesthetic agents on evoked central nervous system responses gaseous agents, At P "-:~iology, 18,634-642, 1957.
Diji A: Local vasodilator action of carbon dioxide on blood vessels of the hand, JAppl Physiol, 14(3):414-416, 1959.
DuBois D, DuBois EF: Clinical calorimetry: A formula to estimate the approximate surface area if height and weight be known, Archives of internal medicine, 17:863-87 1, 19 16.
Eger EI: Anesthetic uptake andaction, Publ: The Williams and Wilkins Company, Baltimore, Maryland, 1974.
Eger EI: Nitrous oxide N20, Elsevier Science Publishing Comparison. Inc., New York, 1985.
Eger EI, Lundgren C, Miller SL, Stevens WC: Anesthetic potencies of sulfbr hexafluoride, carbon tetrafluoride, chloroform and ethrane in dogs, Anesthesiology, 30(2): 129- 13 5, 1969.
Elliott DH: Thermal stress in relation to diving, A workshop of the Diving Medical Advisory Committee, The Institute of Naval Medicine Gosport Hants, Publ. Undersea Medical Society Inc., Bethesda, 198 1.
Enander A, Ljungberg AS, Holmer I: Effect of work in cold stores of man, Scand J Work Environ Health, 5: 195-204, 1979.
Fanger PO: Thermal comfort: Analysis and application in environmental engineering, Danish Technical Press, Copenhagen, 1970.
Ferguson J, Epstein F, Van De Leuv J: Accidental hypotherrnia, EmergMed Clin Nth Am, 1 :6 19-637, 1983.
Fowler B, Ackles KN, Porlier G: Effect of inert gas narcosis on behavior - a critical review, Undersea Biomed Res, l2(4): 369-402, 1 985.
Fowler B, White PL, Wright GR, Ackles KN: Narcotic effects of nitrous oxide and compressed air on memory and auditory perception, Undersea Biomed Res, 7:3 5-46, 1980.
Frankenhaeuser M, GrafF-Lonnevig V, Hesser CM: Effects on psychomotor fbnctions of different nitrogen-oxygen gas mixtures at increased gas pressures, Acta Physiol Scm~d, 59:400-409, 1963.
Franks NP, Lieb WR: Molecular mechanisms of general anasthesia, Nature, Vol. 300, Dec. 1982.
Fukunaga AF, Epstein RM: Sympathetic excitation during nitrous oxide - halothane anesthesia in the cat, Anesthesiology, 39:23-36, 1973.
Gale EAM, Bennett T, Green HJ, MacDonald IA. Hypoglycaemia, hypothermia and shivering ' r.7 c- f ' 41;3-'$69, 190'
Gerbrandy J, Snell ES, Cranston WI: Oral, rectal and oesophageal temperatures in relation to central temperature control in man, Clin. Sci., 13:615-624, 1954.
Giesbrecht GG: Human thermoregulatory inhibition by regional anesthesia, Editorial views, Atlaesthesiology, 8 1 : 277-28 1, 1994.
Halsey M, Wardley-Smith B, Green C: Pressure reversal of general anesthesia: A multisite expansion hypothesis, Brit MedJ, 50: 109 1 - 1097, 1978.
Harnmel HT: Anesthetics and body temperature regulation, (Editorial views), Anesthesiology, 68(6):833-835, 1988.
Hanna JM, Hong SK: Critical water temperature and effective insulation in SCUBA divers in Hawaii, JAppl Physiol, 33 :770-773, 1972.
Hayward JS, Eckerson JD, Collis ML: Thermoregulatory heat production in man: prediction equation based on skin and core temperatures, JAppl Physiol: Respiral Etlvirorz Exercise Physiol, 42(3):377-3 84, 1977.
Hayward JS, Keatinge WR: Progressive symptomless hypotherrnia in water: Possible cause of diving accidents, Brit MedJ, 1 : 1 182, 1979.
Hemingway A: Shivering, Phys Rev, 43 : 397-422, 1963.
Hesser CM, Adolfson J, Fagraeus L: Role of C02 in compressed air narcosis, Aerospace Med, 42(2): 163- 8, 1971.
Hesser CM, Fagraeus L, Adolfson J,: Roles of nitrogen, oxygen and C02 in compressed air narcosis, Undersea Biomed Res, 5(4): 39 1 -400, 1978.
Hong S, Nadel ER: Thennogenic control during exercise in a cold environment, JAppl Physiol, 47(5): 1084- 1089, 1979.
Hornbein TF, Eger EI, Winter PM, Smith G, Wetstone D, Smith KH: The minimum alveolar concentration of nitrous oxide in man, Anesth Analg, 6 1 : 553-556, 1982.
Hsiao CF, Huang RH, Huang CM: Electrophysiology of nitrous oxide on cerebellar granule cells: A single cell study, Brain Res, 589: 149-1 53, 1992.
Hynson JM, DI, Moayeri A, McGuire J: Absence of nonshivering thermogenesis in anesthetized adult humans, Anesthesiology, 79: 695-703, 1993.
Jessen K, Rabol A, Winkler K: Total body and splachnic thermogenesis in curarized man during a short exposure to cold, Acta Amesth Scavld, 24:239-344, 1980.
Johnson JH, Flagler EA: Hydrostatic pressure reversal of narcosis in tadpoles, Science, 112, 91, 1950. (33)
Jong R, Nace R: Nerve impulse conduction and cutaneous receptor responses during general anesthesia, Atiesthesiology, 28: 85 1-855, 1967.
Keatinge WR, Hayward MG, McIver N k l : Hypvthermia durmg saturation diving in the North Sea, Brit MedJ, 29 1, 1980.
Khosla SS, Dubois AB: Fluid shifts during initial phase of immersion diuresis in man, J Appl Physiol, 46(4): 703 -708, 1979.
Khosla SS, Dubois AB: Osmoregulation and interstitial fluid pressure in humans during water immersion, JAppl Physiol, 5 1 (3):686-692, 198 1.
Kurz A, Sessler DI, Schroeder M, Kurz M: Thermoregulatory response thresholds during spinal anesthesia; Anesth Analg, 77: 72 1-6, 1993.
Lever MJ, Miller KW, Paton WDM: Pressure reversal of anaesthesia, Nature, 23 1 :368- 371, 1971.
Lopez M, Sessler DI, Walter K, Emerick T, Ozaki M: Rate and gender dependence of the sweating, vasoconstriction, and shivering thresholds in humans, Anesthesiology, 80: 780- 788, 1994.
Lun V: M. Sc. Thesis, Simon Fraser University, Burnaby, B.C., 1992.
Martin S, Cooper KE: Factors which affect shivering in man during cold water immersion, Pfugers Arch, 391 :8 1-83,198 1.
Mather GW, Nahas GG, Herningway A: Temperature changes of pulmonary blood during exposure to cold, Am J Physiol, 173:390-392, 1953.
Mekjavic IB, Morrison JB: A model of shivering thermogenesis based on the neurophysiology of thermoreception, IEEE Trans or1 Biomed Eng. Vol. BME-32, No. 6, June 1985.
Mekjavic IB, Rempel ME: Determination of esophageal probe insertion length based on standing and sitting height, JAppl Physiol, 69(1):376-379, 1990.
Mekjavic IB, Sundberg CJ: Human temperature regulation during narcosis induced by inhalation of 30% nitrous oxide, JAppl Physiol73(6):2246-2254, 1992.
Meyer H: Zur theorie der alkoholnarkose, Arch Exp Path Pharm, 42: 109- 1 18, 1899.
Miller KW, Paton WDM, Smith RA, Smith EB: The pressure reversal of general anesthesia and the critical volume hypothesis, Molecular Pharmacology, 9: 13 1-143, 1973.
Molnar GW, Read RC: Studies during open-heart surgery on the special characteristics of rectal temperature, JAppl Physiol, 36(3):333-336, 1974.
Montgomery LD: A model of heat transfer in immersed man, Ann Biomed End, 2: 19-46, 1974.
Nadel ER, Horvath SM, Dawson CA: Sensitivity to central and peripheral thermal stimulation in man; JAppl Physiol, 29(5):603-609, 1970.
Naito H, Gillis CN: Effects of halothane and nitrous oxide on removal of norepinephrine l i ~ , 1 tilt: puhnonar, L.ic;ulacioil, t l t w d w ~ o l o g y , 39575-580, 1973
Nunneley S, Troutman S, Webb P: Heat cooling in work and heat stress, Aerospace Medicine, 42:64-68, 197 1.
Ohlson KBE, Mohell N, Cannon B, Lindahl SGE, Nedergaard J: Thermogenesis in brown adipocytes is inhibited by volatile anesthetic agents, Anesthesiology, 8 1 : 176- 183, 1994
Ozaki M, Sessler DI, Cheng C, Matsukawa T: Cutaneous contribution to control of thermoregulatory vasoconstriction and shivering, Anesthesiology, 81(3A):A252, 1994.
Padbury E, Ronnestad I, Hope A, Knudsen G, Myrseth E, Varnes R: Undetected hypothermia: Further indications, Proc. IX Intervals. Symp. Underw. Hyperb. Phys., Eds. Bethesda, Maryland: Undersea Medical Society Inc., 1987.
Park YS, Hong SK: Physiology of cold water diving, Undersea Biomed Res, 18:229-24 1, 1991.
Park YS, Pendergast DR, Rennie DW: Decrease in body insulation with exercise in cool water, Undersea Biomedical Research, 1 l(2): 159- 168, 1984.
Passias TC, Mekjavic IB, Eiken 0 : The effect of 30% nitrous oxide on thermoregulatory responses in humans during hypothermia, Anesthesiology, 76(4): 5 50-5 59, 1992.
Passias TC: Effects of hypoglycemia on human therrnoregulation, Ph. D. Thesis, School of Kinesiology, Simon Fraser University,' 1993.
Perot PL, Stein SN: Conduction block in peripheral nerve produced by oxygen at high pressure, Science, 123:802, 1956.
Piantadosi CA, Thalmam ED, Spaur WH: Metabolic response to respiratory heat-loss induced core cooling, J Appl Physiol: Respirat. Environ. Exercise Physiol., 50(4): 829-83 4, 1981.
Raymond LW, Bell WH, Bondi KR, Lindberg CR: Body temperature and metabolism in hyperbaric helium atmospheres, JAppl Physiol, 24(5):678-684, 1968.
Rochelle RD, Horvath SM: Thermoregulation in surfers & nonsurfers immersed in cold water, Undersea Biomed Res, 5(4): 3 77-390, 1978.
Romet TT, Sterba JA, Nishi RY (Eds.): Diver thermalprotection Workshop, Downsview, ON, Defence and Civil Institute of Environmental Medicine (DCIEM) Report, 1991.
Rowell L: Human circulation regulation during physical stress, New York, Oxford University Press, 1986.
Schvartz E: Effect of a cooling hood on physiological responses to work in a hot environment, J Appl Physiol, 29:36-39, 1970.
Sessler DI, Moayeri A, Stoen R, Glosten B, Hynson J, McGuire J: Thermoregulatory vasoconstriction decreases cutaneous heat loss, Anesthesiology, 73: 656-660, 1990.
~essler L)I, b ~ o i a w n LI, ~ L I U , I A J L C I I I ti: I he thermoreg~latv~~ ~leshold In humans during nitrous oxide-fentanyl anesthesia, Anesthesiology, 69:357-364, 1988a.
Sessler DI, Olofsson CI, Rubinstein EH: The thermoregulatory treshold in humans during halothane anesthesia, Anesthesiology, 68: 836-842, 1988b.
Sessler DI: Central thermoregulatory inhibition by general anesthesia, Anesthesiology, 75:557-559, 1991.
Sherrington CS: In: The integrative action of a nervous .system, Yale, New Haven, Conn., 1906.
Shilling CW: Quantitative study of mental and neuro-muscular reactions as influenced by increased air pressure, US. Nav Med Bull, 3 5(4): 3 73-380, 193 7.
Sloan REG, Keatinge WR: Cooling rates of young people swimming in cold water JAppl Physiol, 35(3):371-5, 1973.
Somjen G: Effects of anesthetics on spinal cord mammals, Anesthesiology, 28: 135-143, 1967.
Stjernstrom H, Henneberg S, Eklund A, Tabow F, Arturson G, Wiklund L: Thermal balance during transurethral resection on the prostate, Acta Arlaesth Scand, 29:743-749, 1985.
Stolwijk JAJ, Hardy JD: Temperature regulation in man - A theoretical study, PfIugers Arch, 29 1 : 129- 162, 1966.
Thesleff S: The effect of anesthetic agents on skeletal muscle membrane, Acta Physiol Scand 37:335- 349, 1956.
Tikuisis P, Gonzalez RR, Pandolf KB: Thermoregulatory model for immersion of humans in cold water, JAppl Physiol : 64(2):719-727, 1988.
Vassilieff N, Rosencher N, Sessler DI, Conseiller C: The shivering threshold during spinal anesthesia is reduced in the elderly, Abstract, Anesthesiology, 81(3A): A1 1, 1994.
Washington DE, Sessler DI, Moayeri A, Merrifield B, McGuire J, Prager M, Belani K, Hudson S, Schroeder M: Thermoregulatory responses to hypertherrnia during isoflurane anesthesia in humans, J Appl Physiol, 74(1): 82-87, 1993.
Webb P: Body heat loss in undersea gaseous environments, Aerospace Med, 41(11): 1282-1288, 1970.
Webb P: Heat storage and body temperature during cooling and rewarming, EurJAppl Physiol, 66(1): 18-24, 1993.
Webb P (Ed.): Prolonged and repeated work in cold water, The 32nd Undersea Medical Society Workshop, Catalina Island, CA, Publ. Undersea Medical Society Inc., Bethesda, 1985.
Webb P: Thermal problems, In: The physiology and medicine of diving, Bennett PB and Elliot DH (Ed ), Best PI-^';@' ' "n (Pub1 ), q. *. "0dr0, C A, pp.297-3 18, 1982
Winter PM, Bruce DL, Bach MJ, Jay GW, Eger EI: The anesthetic effect of air at atmospheric pressure, Arlesthesiology, 42(6): 658-66 1, 1975.
Wissler EH: A mathematical model of the human thermal system, BullMath Biophys, 26: 147, 1964.
Wissler EH: Mathematical simulation of human thermal behavior using whole body models, In: Heat Transfer in Medicine and Biology, Vol. 1, Ch. 13, Shitzer A and Eberhart RC (Ed.), Plenum Press (Pub.), 1985.
Wyndham CH, Atkins AR: A physiological scheme and mathematical model of temperature regulation in man, Pflugers Arch 303: 14-30, 1968.