thermal liquid biopsy (tlb) of blood plasma as a potential
TRANSCRIPT

Journal of
Personalized
Medicine
Article
Thermal Liquid Biopsy (TLB) of Blood Plasma as a PotentialTool to Help in the Early Diagnosis of Multiple Sclerosis
Ferdinanda Annesi 1,†, Sonia Hermoso-Durán 2,3,† , Bruno Rizzuti 1,2 , Rosalinda Bruno 4, Domenico Pirritano 5,Alfredo Petrone 5, Francesco Del Giudice 5, Jorge Ojeda 6, Sonia Vega 2, Oscar Sanchez-Gracia 7,Adrian Velazquez-Campoy 2,3,8,9,10 , Olga Abian 2,3,8,9,11,* and Rita Guzzi 1,12,*
�����������������
Citation: Annesi, F.;
Hermoso-Durán, S.; Rizzuti, B.;
Bruno, R.; Pirritano, D.; Petrone, A.;
Del Giudice, F.; Ojeda, J.; Vega, S.;
Sanchez-Gracia, O.; et al. Thermal
Liquid Biopsy (TLB) of Blood Plasma
as a Potential Tool to Help in the
Early Diagnosis of Multiple Sclerosis.
J. Pers. Med. 2021, 11, 295.
https://doi.org/
10.3390/jpm11040295
Academic Editor:
Massimiliano Mirabella
Received: 25 January 2021
Accepted: 9 April 2021
Published: 13 April 2021
Publisher’s Note: MDPI stays neutral
with regard to jurisdictional claims in
published maps and institutional affil-
iations.
Copyright: © 2021 by the authors.
Licensee MDPI, Basel, Switzerland.
This article is an open access article
distributed under the terms and
conditions of the Creative Commons
Attribution (CC BY) license (https://
creativecommons.org/licenses/by/
4.0/).
1 CNR-NANOTEC, Licryl-UOS Cosenza and CEMIF.Cal, Department of Physics, University of Calabria,87036 Rende, Italy; [email protected] (F.A.); [email protected] (B.R.)
2 Institute of Biocomputation and Physics of Complex Systems (BIFI), Joint Units IQFR-CSIC-BIFI, andGBsC-CSIC-BIFI, Universidad de Zaragoza, 50018 Zaragoza, Spain; [email protected] (S.H.-D.);[email protected] (S.V.); [email protected] (A.V.-C.)
3 Instituto de Investigación Sanitaria Aragón (IIS Aragón), 50009 Zaragoza, Spain4 Department of Pharmacy, Health and Nutritional Sciences, University of Calabria, 87036 Rende, Italy;
[email protected] Neurological and Stroke Unit, Multiple Sclerosis Clinic, Annunziata Hospital, 87100 Cosenza, Italy;
[email protected] (D.P.); [email protected] (A.P.); [email protected] (F.D.G.)6 Department of Statistical Methods, Universidad de Zaragoza, 50009 Zaragoza, Spain; [email protected] SOTER BioAnalytics, Enrique Val, 50011 Zaragoza, Spain; [email protected] Departamento de Bioquímica y Biología Molecular y Celular, Universidad de Zaragoza,
50009 Zaragoza, Spain9 Centro de Investigación Biomédica en Red en el Área Temática de Enfermedades Hepáticas y
Digestivas (CIBERehd), 28029 Madrid, Spain10 Fundación ARAID, Gobierno de Aragón, 50009 Zaragoza, Spain11 Instituto Aragonés de Ciencias de la Salud (IACS), 50009 Zaragoza, Spain12 Department of Physics, Molecular Biophysics Laboratory, University of Calabria, 87036 Rende, Italy* Correspondence: [email protected] (O.A.); [email protected] (R.G.); Tel.: +34-876-555417 (O.A.);
+39-0984-406077 (R.G.)† Co-first authors of the manuscript.
Abstract: Background: Multiple sclerosis (MS) is frequently characterized by a variety of clinicalsigns, often exhibiting little specificity. The diagnosis requires a combination of medical observationsand instrumental tests, and any support for its objective assessment is helpful. Objective: Herein, wedescribe the application of thermal liquid biopsy (TLB) of blood plasma samples, a methodologyfor predicting the occurrence of MS with a noninvasive, quick blood test. Methods: TLB allows oneto define an index (TLB score), which provides information about overall real-time alterations inplasma proteome that may be indicative of MS. Results: This pilot study, based on 85 subjects (45 MSpatients and 40 controls), showed good performance indexes (sensitivity and specificity both around70%). The diagnostic methods better discriminate between early stage and low-burden MS patients,and it is not influenced by gender, age, or assumption of therapeutic drugs. TLB is more accurate forpatients having low disability level (≤3.0, measured by the expanded disability status scale, EDSS)and a relapsing–remitting diagnosis. Conclusion: Our results suggest that TLB can be applied toMS, especially in an initial phase of the disease when diagnosis is difficult and yet more important(in such cases, accuracy of prediction is close to 80%), as well as in personalized patient periodicmonitoring. The next step will be determining its utility in differentiating between MS and otherdisorders, in particular in inflammatory diseases.
Keywords: multiple sclerosis; thermal liquid biopsy; plasma proteome profile; differential scanningcalorimetry; multivariate analysis
J. Pers. Med. 2021, 11, 295. https://doi.org/10.3390/jpm11040295 https://www.mdpi.com/journal/jpm

J. Pers. Med. 2021, 11, 295 2 of 16
1. Introduction
Multiple sclerosis (MS) is the most common neurodegenerative disease of the centralnervous system (CNS) in young adults, ultimately leading to long term disability [1]. It ischaracterized by a chronic inflammatory status causing demyelination of neurons and ax-onal loss. MS incidence is increasing worldwide (more than 2.8 million people are believedto be currently affected), prevailing in more-developed countries, high-income people,and with women showing a greater propensity (female to male ratio is 3 to 1) to developthe disease [2,3]. On a clinical basis, a variety of neurological signs and symptoms mayoccur, including sensory disturbances, motor weakness, visual complaints, incoordination,fatigue, sphincteric, and sexual dysfunction [4].
Due to the variety of potential indicators, MS diagnosis is very challenging. Itsidentification is primarily clinical and relies on the documentation of symptoms and signsattributable to white matter lesions, along with the exclusion of other conditions that maymimic MS. There is no single pathognomonic clinical feature or diagnostic test of MS,and its detection is based on the integration of clinical, imaging, and laboratory findings.Diagnosis can be supported by cerebrospinal fluid (CSF) analysis, whereas blood testsare commonly used only to rule out other diseases. In such a complex picture, physicaldisability is commonly quantified by the expanded disability status scale (EDSS), whichintegrates neurological findings concerning eight functional systems and mainly relies onthe assessment of the patient walking ability. The EDSS score ranges from 0 (completelynormal neurological examination) to 10 (death due to MS), with values >7 indicating a verycompromised clinical picture.
The rate of MS misdiagnosis is about 10% and represents an issue in the clinicalpractice [5]. The risk of misdiagnosis is particularly present in the early stages of thedisease, when symptoms are often mild, generic, or common to other different disorders.Moreover, there is a high interest in attaining a timely diagnosis to allow the patient tobenefit of an early treatment, which may further increase misdiagnosis risks based on suchmild symptoms. In order to make a diagnosis of MS, the 2017 McDonald criteria stressthe need for no better explanation to account for the variety of symptoms observed [6].In this framework, it would be very desirable to combine current diagnostic methodswith innovative complementary biomarkers able to identify new indicative parameters,especially in the early stage of the disease, when the current methods may not fully capturethe pathological signs.
In the latest years, a new area of interest is the search of novel biomarkers to helpdiagnosis and to monitor ongoing disease activity. CSF represents the ideal source ofbiomarkers, but lumbar puncture is a high-risk relatively invasive procedure and unpleas-ant for the patients; therefore, it is not an optimal tool. In contrast, easily collected bloodsamples may reflect the status of both peripheral immune system and, indirectly, of CNSfunctioning mechanisms [7–10]. In fact, about 0.5 L of CSF is adsorbed into the bloodevery day, suggesting that plasma may be a source of disease biomarkers originating fromCSF [11].
To detect and quantify biological materials ranging from proteins to disease-specificbiomarkers, high-sensitivity biophysical techniques are available [12–15]. These methodsinclude differential scanning calorimetry (DSC), a thermoanalytical technique widely ap-plied in life science to measure the thermal denaturation profiles of biomolecules and theirinteraction with various metabolites [16–20]. More recently, this method is expanding inthe biomedical area to monitor the thermal behavior of complex biological fluids, such asplasma, CSF, or other extracts obtained from homogenates tissue [21–25]. The plasma ther-mal profile (thermogram) reflects the thermal denaturation of the major plasma proteins,revealing changes in composition and the presence of post-translational modificationsand/or interacting metabolites in a global way. Interestingly, comparison of the thermalprofiles of biological samples among healthy and pathologic individuals has revealeddistinctive alteration, contributing to validate DSC as a complementary noninvasive toolfor the diagnosis and discrimination of several autoimmune diseases and malignancies,
J. Pers. Med. 2021, 11, 295 3 of 16
including gastric adenocarcinoma [24], lupus [26], glioblastoma [25], lung cancer [27], andmelanoma [28].
A further and more ambitious step in this direction is the clinical implementation ofthe thermal liquid biopsy (TLB), which combines the extraction of physical parametersderived from the experimental DSC thermograms of blood samples with a multiparametricmathematical analysis [27,28]. The aim of TLB is to obtain a score value representing asingle diagnostic indicator able to predict the occurrence of a disease, to be easily comparedwith a control reference value. The TLB has already been applied to study lung cancer,providing a prediction score that strongly correlates with the presence of disease, with highaccuracy, sensitivity, and specificity [27].
In the present work, we apply TLB to discriminate MS patients from healthy individ-uals by analyzing their plasma thermograms. The plasma thermal profile (thermogram)reflects the thermal denaturation of the major plasma proteins, revealing changes in compo-sition, and the presence of post-translational modifications and/or interacting metabolitesin a global way. The results show clear statistical differences between the two groupsof individuals. The TLB score is able to capture, with a good reliability, thermal profilealterations of plasma of MS patients. Thus, we suggest that TLB can help to improve MSdiagnostic and monitoring, in combination with other tests, and constitutes a noninvasive,low-risk, quick diagnostic tool.
2. Materials and Methods2.1. Subjects
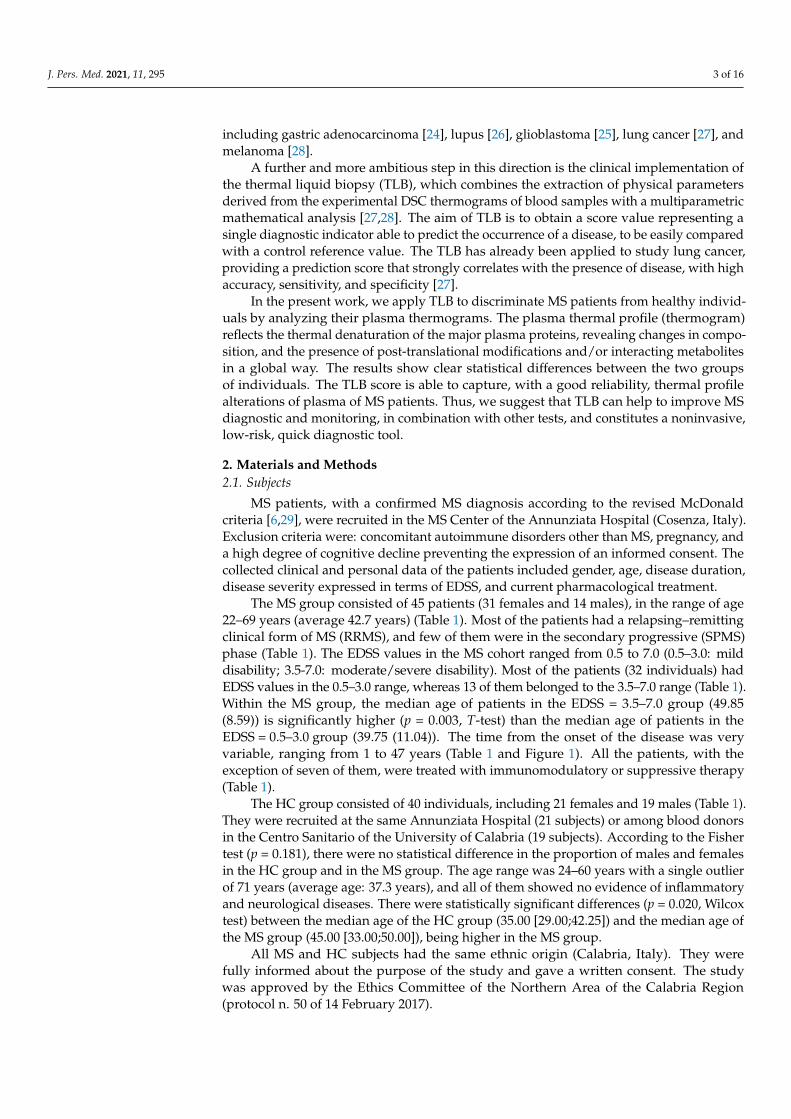
MS patients, with a confirmed MS diagnosis according to the revised McDonaldcriteria [6,29], were recruited in the MS Center of the Annunziata Hospital (Cosenza, Italy).Exclusion criteria were: concomitant autoimmune disorders other than MS, pregnancy, anda high degree of cognitive decline preventing the expression of an informed consent. Thecollected clinical and personal data of the patients included gender, age, disease duration,disease severity expressed in terms of EDSS, and current pharmacological treatment.
The MS group consisted of 45 patients (31 females and 14 males), in the range of age22–69 years (average 42.7 years) (Table 1). Most of the patients had a relapsing–remittingclinical form of MS (RRMS), and few of them were in the secondary progressive (SPMS)phase (Table 1). The EDSS values in the MS cohort ranged from 0.5 to 7.0 (0.5–3.0: milddisability; 3.5-7.0: moderate/severe disability). Most of the patients (32 individuals) hadEDSS values in the 0.5–3.0 range, whereas 13 of them belonged to the 3.5–7.0 range (Table 1).Within the MS group, the median age of patients in the EDSS = 3.5–7.0 group (49.85(8.59)) is significantly higher (p = 0.003, T-test) than the median age of patients in theEDSS = 0.5–3.0 group (39.75 (11.04)). The time from the onset of the disease was veryvariable, ranging from 1 to 47 years (Table 1 and Figure 1). All the patients, with theexception of seven of them, were treated with immunomodulatory or suppressive therapy(Table 1).
The HC group consisted of 40 individuals, including 21 females and 19 males (Table 1).They were recruited at the same Annunziata Hospital (21 subjects) or among blood donorsin the Centro Sanitario of the University of Calabria (19 subjects). According to the Fishertest (p = 0.181), there were no statistical difference in the proportion of males and femalesin the HC group and in the MS group. The age range was 24–60 years with a single outlierof 71 years (average age: 37.3 years), and all of them showed no evidence of inflammatoryand neurological diseases. There were statistically significant differences (p = 0.020, Wilcoxtest) between the median age of the HC group (35.00 [29.00;42.25]) and the median age ofthe MS group (45.00 [33.00;50.00]), being higher in the MS group.
All MS and HC subjects had the same ethnic origin (Calabria, Italy). They werefully informed about the purpose of the study and gave a written consent. The studywas approved by the Ethics Committee of the Northern Area of the Calabria Region(protocol n. 50 of 14 February 2017).

J. Pers. Med. 2021, 11, 295 4 of 16
Table 1. Age distribution and boundaries (Q1 to Q3) for its partition in quartiles.
Groups (1) Gender N (%) Minimum Q1 Q2 Mean Q3 Maximum
HCMale 19 (47.50%) 24.00 26.00 32.00 36.58 40.50 71.00
Female 21 (52.50%) 27.00 30.00 38.00 37.95 43.00 52.00Total 40 24.00 29.00 35.00 37.30 42.25 71.00
MSMale 14 (31.11%) 24.00 31.25 39.00 41.21 49.50 63.00
Female 31 (68.89%) 22.00 34.50 45.00 43.32 50.50 69.00Total 45 22.00 33.00 45.00 42.67 50.00 69.00
Diagnosis (2) Gender N (%) Minimum Q1 Q2 Mean Q3 Maximum
RRMSMale 12 (31.58%) 24.00 31.00 33.50 38.42 47.25 58.00
Female 26 (68.42%) 22.00 33.75 45.00 43.23 50.75 69.00Total 38 22.00 32.25 43.50 41.71 50.00 69.00
SPMSMale 2 (28.57%) 53.00 55.50 58.00 58.00 60.50 63.00
Female 5 (71.43%) 30.00 43.00 46.00 43.80 48.00 52.00Total 7 30.00 44.50 48.00 47.86 52.50 63.00
EDSS (3) Gender N (%) Minimum Q1 Q2 Mean Q3 Maximum
0.5–3.0Male 10 (31.25%) 24.00 31.00 32.50 35.90 43.75 50.00
Female 22 (68.75%) 22.00 33.00 42.00 41.50 50.00 69.00Total 32 22.00 31.00 38.00 39.75 49.25 69.00
3.5–7.0Male 4 (30.77%) 44.00 50.75 55.50 54.50 59.25 63.00
Female 9 (69.23%) 30.00 45.00 48.00 47.78 52.00 59.00Total 13 30.00 45.00 52.00 49.85 55.00 63.00
Disease onset (4) Gender N (%) Minimum Q1 Q2 Mean Q3 Maximum
≤10 yearsMale 10 (37.04%) 29.00 31.25 33.50 39.30 47.75 58.00
Female 17 (62.96%) 22.00 30.00 39.00 40.59 52.00 59.00Total 27 22.00 30.50 37.00 40.11 50.50 59.00
>10 yearsMale 4 (22.22%) 24.00 39.00 48.50 46.00 55.50 63.00
Female 14 (77.78%) 33.00 43.50 46.00 46.64 49.75 69.00Total 18 24.00 43.25 46.00 46.50 50.00 69.00
Therapy (5) Gender N (%) Minimum Q1 Q2 Mean Q3 Maximum
NoMale 2 (28.57%) 32.00 39.75 47.50 47.50 55.25 63.00
Female 5 (71.43%) 30.00 36.00 39.00 43.80 45.00 69.00Total 7 30.00 34.00 39.00 44.86 54.00 69.00
YesMale 12 (31.58%) 24.00 31.00 39.00 40.17 48.50 58.00
Female 26 (68.42%) 22.00 34.00 46.00 43.23 50.75 59.00Total 38 22.00 33.00 45.50 42.26 50.00 59.00
(1): Healthy control (HC) or multiple sclerosis (MS). (2): MS patients with relapsing–remitting clinical form of MS (RRMS) and secondaryprogressive (SPMS) diagnosis. (3): MS patients, either with mild (expanded disability status scale (EDSS) = 0.5–3.0) or moderate/severedisability (EDSS = 3.5–7.0). (4): MS patients with short (≤10 years) and long (>10 years) time from the onset of the disease. (5): MS patientswith (Yes) and without (No) therapy.

J. Pers. Med. 2021, 11, 295 5 of 16
J. Pers. Med. 2021, 11, x FOR PEER REVIEW 4 of 16
SPMS
Male 2 (28.57%) 53.00 55.50 58.00 58.00 60.50 63.00
Female 5 (71.43%) 30.00 43.00 46.00 43.80 48.00 52.00
Total 7 30.00 44.50 48.00 47.86 52.50 63.00
EDSS (3) Gender N (%) Minimum Q1 Q2 Mean Q3 Maximum
0.5–3.0
Male 10 (31.25%) 24.00 31.00 32.50 35.90 43.75 50.00
Female 22 (68.75%) 22.00 33.00 42.00 41.50 50.00 69.00
Total 32 22.00 31.00 38.00 39.75 49.25 69.00
3.5–7.0
Male 4 (30.77%) 44.00 50.75 55.50 54.50 59.25 63.00
Female 9 (69.23%) 30.00 45.00 48.00 47.78 52.00 59.00
Total 13 30.00 45.00 52.00 49.85 55.00 63.00
Disease
onset (4) Gender N (%) Minimum Q1 Q2 Mean Q3 Maximum
≤ 10 years
Male 10 (37.04%) 29.00 31.25 33.50 39.30 47.75 58.00
Female 17 (62.96%) 22.00 30.00 39.00 40.59 52.00 59.00
Total 27 22.00 30.50 37.00 40.11 50.50 59.00
>10 years
Male 4 (22.22%) 24.00 39.00 48.50 46.00 55.50 63.00
Female 14 (77.78%) 33.00 43.50 46.00 46.64 49.75 69.00
Total 18 24.00 43.25 46.00 46.50 50.00 69.00
Therapy (5) Gender N (%) Minimum Q1 Q2 Mean Q3 Maximum
No
Male 2 (28.57%) 32.00 39.75 47.50 47.50 55.25 63.00
Female 5 (71.43%) 30.00 36.00 39.00 43.80 45.00 69.00
Total 7 30.00 34.00 39.00 44.86 54.00 69.00
Yes
Male 12 (31.58%) 24.00 31.00 39.00 40.17 48.50 58.00
Female 26 (68.42%) 22.00 34.00 46.00 43.23 50.75 59.00
Total 38 22.00 33.00 45.50 42.26 50.00 59.00 (1): Healthy control (HC) or multiple sclerosis (MS). (2): MS patients with relapsing–remitting clini-
cal form of MS (RRMS) and secondary progressive (SPMS) diagnosis. (3): MS patients, either with
mild (expanded disability status scale (EDSS) = 0.5–3.0) or moderate/severe disability (EDSS = 3.5–
7.0). (4): MS patients with short (≤ 10 years) and long (>10 years) time from the onset of the disease. (5): MS patients with (Yes) and without (No) therapy.
Figure 1. Distribution of disease onset time for MS patients.
The HC group consisted of 40 individuals, including 21 females and 19 males (Table
1). They were recruited at the same Annunziata Hospital (21 subjects) or among blood
Figure 1. Distribution of disease onset time for MS patients.
2.2. Blood Sample Processing
Samples (3 mL) of peripheral venous blood of the subjects were collected in EDTAtubes, and plasma was separated by centrifugation at 1500 rpm for 15 min. Processedplasma was dispensed in 0.1 mL aliquots and stored at −20 ◦C until use. Total proteinconcentration was measured before freezing, by using the Biuret method [30].
2.3. Sample Preparation and DSC Measurements
After thawing, plasma samples were diluted 1:20 (v/v) with Dulbecco phosphatebuffer saline (DPBS) solution (Sigma Aldrich, St. Louis, MO, USA), 10 mM at pH 7.4,and properly degassed before being loaded into the cell. Thermograms were registeredwith a high-sensitivity VP-DSC microcalorimeter (MicroCal, Northampton, MA, USA)at a scan rate of 1 ◦C/min between 10 and 100 ◦C, after 20 min of equilibration timeat the starting temperature. Solvent–solvent baselines acquisition followed the sameexperimental conditions. Samples were given a code, and lab technicians (performing thethermal denaturation experiments and analyzing the experimental data) did not know thenature of each sample, ensuring that this study was conducted in a blind manner.
2.4. Thermogram Analysis and Deconvolution
Correction and processing of the raw data was performed using Origin software(OriginLab, Northampton, MA) as previously described [24]. In brief, a multiparametricprocedure was applied, based on a deconvolution analysis of each thermogram with sixindividual components. The mathematical model for each of the individual transitions isthe logistic peak function:
Cp(T) = Cp,0 +i=6
∑i=1
4Aiexp(−(T−Tc,i)
wi
)(
1 + exp(−(T−Tc,i)
wi
))2 (1)
where each peak is characterized by three parameters: the height, Ai, the center temperature,Tc,i, and the width, wi. Moreover, Cp,0 is an adjustable parameter to offset the baselinecorrection. The deconvolution analysis provides parameters describing phenomenologicalphysical features for each experimental thermogram. Observed thermogram alterations

J. Pers. Med. 2021, 11, 295 6 of 16
due to up- or down-regulation of proteins/components in plasma or due to interactionsamong proteins and metabolites would be reflected in such parameters. These eighteenparameters represent the primary set of the transition parameters for the subsequentmathematical processing.
2.5. Multiparametric Data Analysis
The 18 primary parameters obtained directly from the thermogram deconvolutionwere combined to define a new final set of 14 parameters, {pk}, more convenient forextracting and summarizing the essential geometric thermogram features to be used forcalculating the TLB score and comparing thermograms, as defined in [24]. The finalparameters obtained from the calorimetric curves were defined as follows:
The average temperature, Tav, describes the average temperature of the thermogramCp(T) when considered as a density distribution function:
Tav =∑j Cp
(Tj)Tj
∑j Cp(Tj) (2)
with j running over the entire range of the experimental points in the thermogram.The skewness, G1, describes the asymmetry of the thermogram:
G1 = m3m3/2
2
mk =∑j Cp(Tj)(Tj−Tav)
k
∑j Cp(Tj)
(3)
The normalized area under the curve, AUCni, provides an Ai-normalized area underthe thermogram:
AUCni =∑j Cp
(Tj)
Ai(4)
The normalized area of the height polygon, APni, provides the Ai-normalized area ofthe irregular hexagonal plot constructed with the heights of the six individual components:
APni =s=6
∑s=1
√3
4As As+1
A2i
(5)
In addition, finally, the normalized distance value, Dvi, provides the Euclidean dis-tance, using Tav, G1, and APni, as Cartesian coordinates, from the center of the HC groupellipsoid (geometric point with coordinates equal to the average values for those parameterswithin the set of the healthy individuals):
Dvi =
√√√√(Tav − Tav
Tav
)2
+
(G1 − G1
G1
)2
+
(APni − APni
APni
)2
(6)
2.6. Statistical Model
The final set of parameters {pk} obtained in the multiparametric data analysis wereused to derive the TLB score by using a generalized linear model (GLM), which representsthe probability, P, of an individual to show plasma alterations in the thermogram accordingto its plasma thermogram characterized by {pk}, which could be associated to disease:
TLB score = P(alterations|{pk} ) =e(µ({pk}))
1 + e(µ({pk}))(7)
where µ({pk}) is a linear combination of the final parameters derived in the previous section(see Equations (2)–(6)).
µ({pk}) = a0 + ∑k=1
ak pk (8)

J. Pers. Med. 2021, 11, 295 7 of 16
The coefficients optimal ak are estimated by means of a maximum likelihood estimator(binomial GLM with logit link model). Because the purpose is predicting a binary variable(healthy vs. diseased), the binomial GLM becomes a suitable tool to estimate a logisticregression with the outcome being the probability plasma alteration (i.e., disease) accordingto a given TLB thermogram. Such a TLB score is the single value employed for classifyinga given subject as healthy or diseased (diagnostic test). As any probability, the TLB scoreranges between 0 and 1: the model classifies the subjects as having plasma alterations(diseased) for TLB score values >0.5 and lacking relevant plasma alterations (healthy) forvalues <0.5.
The performance of the diagnostic test was evaluated by calculating common perfor-mance indexes (sensitivity, specificity, positive predictive value, and negative predictivevalue) and the receiver operating characteristic (ROC) curve.
Sensitivity = TPTP+FN
Speci f icity = TNTN+FP
PPV = TPTP+FP
NPV = TNTN+FN
(9)
where TP, TN, FP, and FN refer to true positives, true negatives, false positives, and falsenegatives, respectively.
Previously, we employed the TLB score for lung cancer patient classification, andthree closely related predictive models were constructed using the complete set or partialmultiparametric sets of parameters mentioned above: model 1 based on Tav, G1, AUCni,and APni (10 parameters); model 2 based on Dvi (4 parameters); and model 3 based on allthe 14 parameters [27]. In this work, we have applied the same methodology to MS fordesigning a model useful for patient diagnosis and monitoring.
3. Results3.1. Thermograms of Plasma Samples for Subjects from HC and MS Groups
Thermograms reflecting the thermal behavior of the plasma proteins against thermaldenaturation were acquired for all the subjects. Figure 2 shows some representative exam-ples. The thermograms from the 40 HC individuals are very similar, providing a robustreference group for identifying differential features in MS patients. Visual inspection ofthermograms from patients with EDSS ≤ 3 and EDSS > 3.5 did not provide any hints aboutkey specific features of MS at any stage. Apart from individual variability, profile patternsseemed to be quite similar at a first glance.
J. Pers. Med. 2021, 11, x FOR PEER REVIEW 7 of 16
The coefficients optimal ak are estimated by means of a maximum likelihood estima-
tor (binomial GLM with logit link model). Because the purpose is predicting a binary var-
iable (healthy vs. diseased), the binomial GLM becomes a suitable tool to estimate a lo-
gistic regression with the outcome being the probability plasma alteration (i.e., disease)
according to a given TLB thermogram. Such a TLB score is the single value employed for
classifying a given subject as healthy or diseased (diagnostic test). As any probability, the
TLB score ranges between 0 and 1: the model classifies the subjects as having plasma al-
terations (diseased) for TLB score values > 0.5 and lacking relevant plasma alterations
(healthy) for values < 0.5.
The performance of the diagnostic test was evaluated by calculating common perfor-
mance indexes (sensitivity, specificity, positive predictive value, and negative predictive
value) and the receiver operating characteristic (ROC) curve.
𝑆𝑒𝑛𝑠𝑖𝑡𝑖𝑣𝑖𝑡𝑦 =𝑇𝑃
𝑇𝑃 + 𝐹𝑁
𝑆𝑝𝑒𝑐𝑖𝑓𝑖𝑐𝑖𝑡𝑦 =𝑇𝑁
𝑇𝑁 + 𝐹𝑃
𝑃𝑃𝑉 =𝑇𝑃
𝑇𝑃 + 𝐹𝑃
𝑁𝑃𝑉 =𝑇𝑁
𝑇𝑁 + 𝐹𝑁
(9)
where TP, TN, FP, and FN refer to true positives, true negatives, false positives, and false
negatives, respectively.
Previously, we employed the TLB score for lung cancer patient classification, and
three closely related predictive models were constructed using the complete set or partial
multiparametric sets of parameters mentioned above: model 1 based on Tav, G1, AUCni,
and APni (10 parameters); model 2 based on Dvi (4 parameters); and model 3 based on all
the 14 parameters [27]. In this work, we have applied the same methodology to MS for
designing a model useful for patient diagnosis and monitoring.
3. Results
3.1. Thermograms of Plasma Samples for Subjects from HC and MS Groups
Thermograms reflecting the thermal behavior of the plasma proteins against thermal
denaturation were acquired for all the subjects. Figure 2 shows some representative ex-
amples. The thermograms from the 40 HC individuals are very similar, providing a robust
reference group for identifying differential features in MS patients. Visual inspection of
thermograms from patients with EDSS ≤ 3 and EDSS > 3.5 did not provide any hints about
key specific features of MS at any stage. Apart from individual variability, profile patterns
seemed to be quite similar at a first glance.
Figure 2. Thermogram comparison. (A) Average and standard deviation of the 40 thermograms from the HC group; (B)thermograms from 20 MS patients with EDSS ≤ 3.0; and (C) thermograms from 20 MS patients with EDSS > 3.5.
3.2. Analysis of Individual TLB-Derived Parameters
There were no statistically significant differences (p > 0.05, ANOVA test/Kruskal–Wallis test) of the mean/median of each TLB parameter as a function of group age (Table S1included in the Supplementary Material). Within the MS group, there are no statistically

J. Pers. Med. 2021, 11, 295 8 of 16
significant differences (p > 0.05, ANOVA/Kruskal–Wallis test) of the mean/median of eachTLB parameter as a function of the EDSS group, except for the parameter Tav (p = 0.011)(Table S2 included in the Supplementary Material). The thermograms for each individualwere analyzed with the phenomenological six-component deconvolution curve, and thefinal set of fourteen TLB-associated parameters were calculated. As a preliminary statisticalevaluation of the ability of each parameter to classify subjects into HC and MS groups, wedetermined the three boundaries (Q1, Q2, Q3) between the four quartiles for the distributionof each TLB-associated parameter within the two groups (Figure 3; Tables S3 and S4).According to Wilcoxon and t-Student tests, only Tav, AUCn4 and APn4 showed statisticallysignificant differences between HC and MS groups (p-value < 0.05) (Table S4).
J. Pers. Med. 2021, 11, x FOR PEER REVIEW 8 of 16
Figure 2. Thermogram comparison. (A) Average and standard deviation of the 40 thermograms
from the HC group; (B) thermograms from 20 MS patients with EDSS ≤ 3.0; and (C) thermograms
from 20 MS patients with EDSS > 3.5.
3.2. Analysis of Individual TLB-Derived Parameters
There were no statistically significant differences (p > 0.05, ANOVA test/Kruskal–
Wallis test) of the mean/median of each TLB parameter as a function of group age (Table
S1 included in the Supplementary Material). Within the MS group, there are no statisti-
cally significant differences (p > 0.05, ANOVA/Kruskal–Wallis test) of the mean/median
of each TLB parameter as a function of the EDSS group, except for the parameter Tav (p =
0.011) (Table S2 included in the Supplementary Material). The thermograms for each in-
dividual were analyzed with the phenomenological six-component deconvolution curve,
and the final set of fourteen TLB-associated parameters were calculated. As a preliminary
statistical evaluation of the ability of each parameter to classify subjects into HC and MS
groups, we determined the three boundaries (Q1, Q2, Q3) between the four quartiles for
the distribution of each TLB-associated parameter within the two groups (Figure 3; Tables
S3 and S4). According to Wilcoxon and t-Student tests, only Tav, AUCn4 and APn4 showed
statistically significant differences between HC and MS groups (p-value < 0.05) (Table S4).
Figure 3. Box-plot for each individual parameter, derived from the deconvolution analysis of thethermograms, illustrating the distribution of their values in each group.
Subsequently, to further evaluate the predictive capabilities of each single TLB-associated parameter, we performed an individual ROC curve analysis. The idea behindsuch analysis is the identification of an optimal cut-off value for each parameter that mightbe employed for classifying subjects as either healthy or diseased (Table S5). The Youdenmethod was employed [31]. It is evident that AUCn3, AUCn4, APn4, AUCn5, APn5, and Dv5

J. Pers. Med. 2021, 11, 295 9 of 16
are the most successful individual parameters (high success rate, sensitivity, and specificityvalues) in correctly classifying the subjects.
3.3. TLB Score: A Classifying Predictor for MS
Because individual parameters are not able to discriminate efficiently between HCand MS groups, a multivariant logistic regression approach was applied employing thegeneralized linear model [27]. Three models were considered depending on the set of TLB-associated parameters included in this analysis (Supplementary Material, Table S6). Eachmodel provided a TLB score for classifying subjects as healthy or diseased (<0.5 or >0.5,respectively). Model 3 (including all fourteen TLB-associated parameters) performed bettercompared to the other two models (Table 2 and Table S7), with a 68.24% success rate incorrectly classifying individuals, 32.50% false positive rate (i.e., classifying a healthy subjectas diseased), and 31.11% false negatives (i.e., classifying a diseased subject as healthy). Nosingle parameter exhibited a statistical significance in the discrimination between HC andMS groups (Table S6); the combination of all parameters provided a TLB score with thehighest ability to distinguish between HC and MS groups.
Table 2. Model comparison based on the ability to classify subjects.
Model Success Rate Sensitivity Specificity PPV NPV
1 63.53% 64.44% 62.50% 65.91% 60.98%2 56.47% 64.44% 47.50% 58.00% 54.29%3 68.24% 68.89% 67.50% 70.45% 65.85%
The ability to discriminate between the two groups of subjects also reflected in theglobal ROC curve (Figure 4). The area under such curve was 0.79, indicating good accuracyof the methodology in terms of predictive power.
J. Pers. Med. 2021, 11, x FOR PEER REVIEW 9 of 16
Figure 3. Box-plot for each individual parameter, derived from the deconvolution analysis of the
thermograms, illustrating the distribution of their values in each group.
Subsequently, to further evaluate the predictive capabilities of each single TLB-asso-
ciated parameter, we performed an individual ROC curve analysis. The idea behind such
analysis is the identification of an optimal cut-off value for each parameter that might be
employed for classifying subjects as either healthy or diseased (Table S5). The Youden
method was employed [31]. It is evident that AUCn3, AUCn4, APn4, AUCn5, APn5, and Dv5
are the most successful individual parameters (high success rate, sensitivity, and specific-
ity values) in correctly classifying the subjects.
3.3. TLB Score: A Classifying Predictor for MS
Because individual parameters are not able to discriminate efficiently between HC
and MS groups, a multivariant logistic regression approach was applied employing the
generalized linear model [27]. Three models were considered depending on the set of TLB-
associated parameters included in this analysis (Supplementary Material, Table S6). Each
model provided a TLB score for classifying subjects as healthy or diseased (<0.5 or >0.5,
respectively). Model 3 (including all fourteen TLB-associated parameters) performed bet-
ter compared to the other two models (Table 2 and Table S7), with a 68.24% success rate
in correctly classifying individuals, 32.50% false positive rate (i.e., classifying a healthy
subject as diseased), and 31.11% false negatives (i.e., classifying a diseased subject as
healthy). No single parameter exhibited a statistical significance in the discrimination be-
tween HC and MS groups (Table S6); the combination of all parameters provided a TLB
score with the highest ability to distinguish between HC and MS groups.
Table 2. Model comparison based on the ability to classify subjects.
Model Success Rate Sensitivity Specificity PPV NPV
1 63.53% 64.44% 62.50% 65.91% 60.98%
2 56.47% 64.44% 47.50% 58.00% 54.29%
3 68.24% 68.89% 67.50% 70.45% 65.85%
The ability to discriminate between the two groups of subjects also reflected in the
global ROC curve (Figure 4). The area under such curve was 0.79, indicating good accu-
racy of the methodology in terms of predictive power.
Figure 4. Receiver operating characteristic (ROC) curve illustrating the statistical performance ofmodel 3 for calculating the thermal liquid biopsy (TLB) score.
Figure 5 shows the distribution of the TLB score calculated with model 3. The TLBscore is a continuous variable taking values between 0 and 1; the closer to 1, the higherthe probability of plasma alterations. HC and MS groups showed markedly differentdistribution in the TLB score: Q1 = 0.22, Q2 = 0.37 and Q3 = 0.55 for HC group, andQ1 = 0.45, Q2 = 0.64 and Q3 = 0.89 for MS group. The difference in the medians of thetwo groups is statistically significant (p-value < 0.001). This provides a visual assessment

J. Pers. Med. 2021, 11, 295 10 of 16
for the correlation between the TLB score and the absence or presence of MS. As the TLBscore increases, the percentage of subjects predicted to be MS patients increases and thepercentage of controls decreases: below a predicted TLB score of 0.25, all individuals areHC subjects, whereas above a TLB score of 0.75, all individual are patients diagnosed fromMS (Figure 6).
J. Pers. Med. 2021, 11, x FOR PEER REVIEW 10 of 16
Figure 4. Receiver operating characteristic (ROC) curve illustrating the statistical performance of
model 3 for calculating the thermal liquid biopsy (TLB) score.
Figure 5 shows the distribution of the TLB score calculated with model 3. The TLB
score is a continuous variable taking values between 0 and 1; the closer to 1, the higher
the probability of plasma alterations. HC and MS groups showed markedly different dis-
tribution in the TLB score: Q1 = 0.22, Q2 = 0.37 and Q3 = 0.55 for HC group, and Q1 = 0.45,
Q2 = 0.64 and Q3 = 0.89 for MS group. The difference in the medians of the two groups is
statistically significant (p-value < 0.001). This provides a visual assessment for the correla-
tion between the TLB score and the absence or presence of MS. As the TLB score increases,
the percentage of subjects predicted to be MS patients increases and the percentage of con-
trols decreases: below a predicted TLB score of 0.25, all individuals are HC subjects, whereas
above a TLB score of 0.75, all individual are patients diagnosed from MS (Figure 6).
Figure 5. Distribution of the TLB score within healthy individuals (HC group) and mul-
tiple sclerosis patients (MS group). The lines represent an equivalent Gaussian d
istribution. The TLB score threshold for discriminating between an unaltered and altered
thermal liquid biopsy (TLB) thermogram is 0.5. There are 13 HC subjects with TLB score
> 0.5 (32.50% false positive rate) and 14 MS patients with TLB score < 0.5 (31.11% false
negative rate).
Figure 5. Distribution of the TLB score within healthy individuals (HC group) and multiple sclerosispatients (MS group). The lines represent an equivalent Gaussian distribution. The TLB score thresholdfor discriminating between an unaltered and altered thermal liquid biopsy (TLB) thermogram is 0.5.There are 13 HC subjects with TLB score > 0.5 (32.50% false positive rate) and 14 MS patients withTLB score < 0.5 (31.11% false negative rate).
J. Pers. Med. 2021, 11, x FOR PEER REVIEW 10 of 16
Figure 4. Receiver operating characteristic (ROC) curve illustrating the statistical performance of
model 3 for calculating the thermal liquid biopsy (TLB) score.
Figure 5 shows the distribution of the TLB score calculated with model 3. The TLB
score is a continuous variable taking values between 0 and 1; the closer to 1, the higher
the probability of plasma alterations. HC and MS groups showed markedly different dis-
tribution in the TLB score: Q1 = 0.22, Q2 = 0.37 and Q3 = 0.55 for HC group, and Q1 = 0.45,
Q2 = 0.64 and Q3 = 0.89 for MS group. The difference in the medians of the two groups is
statistically significant (p-value < 0.001). This provides a visual assessment for the correla-
tion between the TLB score and the absence or presence of MS. As the TLB score increases,
the percentage of subjects predicted to be MS patients increases and the percentage of con-
trols decreases: below a predicted TLB score of 0.25, all individuals are HC subjects, whereas
above a TLB score of 0.75, all individual are patients diagnosed from MS (Figure 6).
Figure 5. Distribution of the TLB score within healthy individuals (HC group) and mul-
tiple sclerosis patients (MS group). The lines represent an equivalent Gaussian d
istribution. The TLB score threshold for discriminating between an unaltered and altered
thermal liquid biopsy (TLB) thermogram is 0.5. There are 13 HC subjects with TLB score
> 0.5 (32.50% false positive rate) and 14 MS patients with TLB score < 0.5 (31.11% false
negative rate).
Figure 6. Proportion of subjects from HC subjects (dark grey) and MS patients (light grey) accordingto the TLB score.
3.4. Distinctive Features of MS Patients versus HC Individuals according to TLB Values
To study the performance of the proposed TLB score for detecting MS, we carriedout a descriptive analysis using the data distribution in quartiles and the rank-basedt-Student/Wilcoxon test or ANOVA/Kruskal–Wallis test, depending on the normalitycharacter of the parameter distribution, to address whether the distribution by group issimilar or not. It can be observed (Figure 7, Table 3; Table S8) that there are no significantdifferences in the distribution of TLB score in the HC group according to gender and ageof the individuals (p-value > 0.05; Table S8). Thus, in healthy individuals, the probability

J. Pers. Med. 2021, 11, 295 11 of 16
of having a normal/altered TLB thermogram does not depend on either gender or age.When looking at the behavior of the classification established by the TLB score, a numberof subjects (13 individuals) are classified as having an altered TLB thermogram (32.50%false positives) (Table 3). There is no significant departure from independence between thevariables involved (age, gender, etc.).
J. Pers. Med. 2021, 11, x FOR PEER REVIEW 11 of 16
Figure 6. Proportion of subjects from HC subjects (dark grey) and MS patients (light grey) accord-
ing to the TLB score.
3.4. Distinctive Features of MS Patients versus HC Individuals according to TLB Values
To study the performance of the proposed TLB score for detecting MS, we carried
out a descriptive analysis using the data distribution in quartiles and the rank-based t-
Student/Wilcoxon test or ANOVA/Kruskal–Wallis test, depending on the normality char-
acter of the parameter distribution, to address whether the distribution by group is similar
or not. It can be observed (Figure 7, Table 3; Table S8) that there are no significant differ-
ences in the distribution of TLB score in the HC group according to gender and age of the
individuals (p-value > 0.05; Table S8). Thus, in healthy individuals, the probability of hav-
ing a normal/altered TLB thermogram does not depend on either gender or age. When
looking at the behavior of the classification established by the TLB score, a number of
subjects (13 individuals) are classified as having an altered TLB thermogram (32.50% false
positives) (Table 3). There is no significant departure from independence between the var-
iables involved (age, gender, etc.).
Figure 7. Distribution of the probability score (TLB score) within healthy individuals (HC group, black) and multiple
sclerosis patients (MS group, red) according to gender (left) and age (right). The p-value (t-Student and ANOVA test in
HC group; Wilcoxon test and Kruskal–Wallis test in MS group) indicates there is no statistically significant difference
between subcategories (gender and age) within HC and MS groups (p-value > 0.05).
Table 3. Contingency table for gender and age for model 3.
Group Gender TLB Score < 0.5 TLB SCORE > 0.5 p-Value
HC Male (n = 19) 14 (73.68%) 5 (26.32%)
0.511 Female (n = 21) 13 (61.90%) 8 (38.10%)
MS Male (n = 14) 2 (14.29%) 12 (85.71%)
0.165 Female (n = 31) 12 (38.71%) 19 (61.29%)
Age TLB Score < 0.5 TLB score > 0.5 p-Value
HC
< 35 (n = 22) 17 (77.27%) 5 (22.73%)
0.315 35–45 (n = 10) 6 (60.00%) 4 (40.00%)
> 45 (n = 8) 4 (50.00%) 4 (50.00%)
MS
< 35 (n = 15) 3 (20.00%) 12 (80.00%)
0.444 35–45 (n = 9) 4 (44.44%) 5 (55.56%)
> 45 (n = 21) 7 (33.33%) 14 (66.67%)
Note: p-values were calculated according to Fisher’s independence test.
It is evident that the TLB score for individuals with MS is considerably higher than
for HC subjects (Figure 5). As it occurred in the HC group, there are no significant differ-
ences in the TLB score according to gender or age (p-value > 0.05; Table 3, Table S8 and
Figure 7. Distribution of the probability score (TLB score) within healthy individuals (HC group, black) and multiplesclerosis patients (MS group, red) according to gender (left) and age (right). The p-value (t-Student and ANOVA test in HCgroup; Wilcoxon test and Kruskal–Wallis test in MS group) indicates there is no statistically significant difference betweensubcategories (gender and age) within HC and MS groups (p-value > 0.05).
Table 3. Contingency table for gender and age for model 3.
Group Gender TLB Score < 0.5 TLB Score > 0.5 p-Value
HCMale (n = 19) 14 (73.68%) 5 (26.32%)
0.511Female (n = 21) 13 (61.90%) 8 (38.10%)
MSMale (n = 14) 2 (14.29%) 12 (85.71%)
0.165Female (n = 31) 12 (38.71%) 19 (61.29%)
Age TLB Score < 0.5 TLB Score > 0.5 p-Value
HC<35 (n = 22) 17 (77.27%) 5 (22.73%)
0.31535–45 (n = 10) 6 (60.00%) 4 (40.00%)>45 (n = 8) 4 (50.00%) 4 (50.00%)
MS<35 (n = 15) 3 (20.00%) 12 (80.00%)
0.44435–45 (n = 9) 4 (44.44%) 5 (55.56%)>45 (n = 21) 7 (33.33%) 14 (66.67%)
Note: p-values were calculated according to Fisher’s independence test.
It is evident that the TLB score for individuals with MS is considerably higher than forHC subjects (Figure 5). As it occurred in the HC group, there are no significant differencesin the TLB score according to gender or age (p-value > 0.05; Table 3, Table S8 and Figure 7).However, when looking at the behavior of the classification established by the TLB score,some subjects (14 patients) had an unaltered thermogram (31.11% false negatives) (Table 3).Again, in this case, there is no significant departure from independence between thevariables involved.
A statistically significant relationship was observed between the TLB score and thelevel of disability and diagnosis stage (p-value < 0.05) (Figure 8, Table S9). Moderate/severedisability (EDSS = 3.5–7.0) and advanced stage (SPMS) are characterized by small TLBscores, which would conspire to misclassify these subjects as healthy, compared to mild dis-ability and early stage (RRMS) with higher TLB scores, which would help in identificationas diseased subjects (Figure 8, Table S9). In this case, not only a significant departure fromindependence was observed between the variables involved, but this effect was peculiar
J. Pers. Med. 2021, 11, 295 12 of 16
of this analysis model and did not appear when models 1 and 2 were applied (Tables S10and S11).
J. Pers. Med. 2021, 11, x FOR PEER REVIEW 12 of 16
Figure 7). However, when looking at the behavior of the classification established by the
TLB score, some subjects (14 patients) had an unaltered thermogram (31.11% false nega-
tives) (Table 3). Again, in this case, there is no significant departure from independence
between the variables involved.
A statistically significant relationship was observed between the TLB score and the
level of disability and diagnosis stage (p-value < 0.05) (Figure 8, Table S9). Moderate/se-
vere disability (EDSS = 3.5–7.0) and advanced stage (SPMS) are characterized by small
TLB scores, which would conspire to misclassify these subjects as healthy, compared to
mild disability and early stage (RRMS) with higher TLB scores, which would help in iden-
tification as diseased subjects (Figure 8, Table S9). In this case, not only a significant de-
parture from independence was observed between the variables involved, but this effect
was peculiar of this analysis model and did not appear when models 1 and 2 were applied
(Tables S10 and S11).
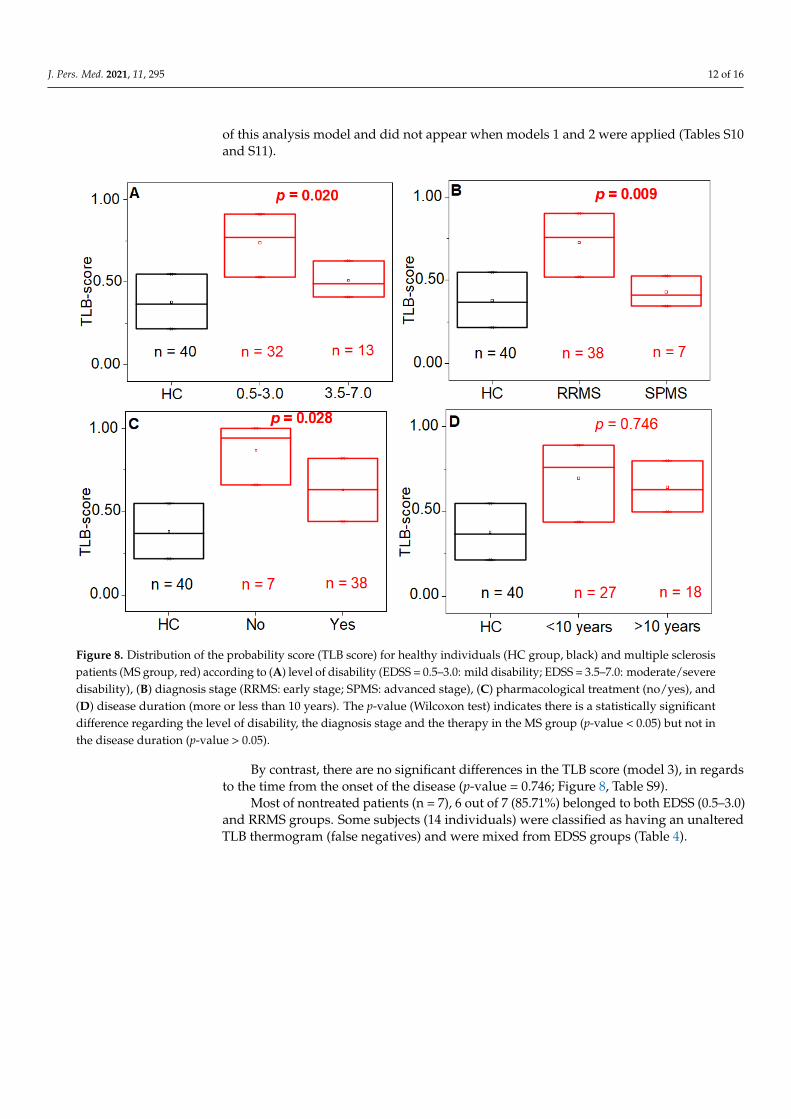
Figure 8. Distribution of the probability score (TLB score) for healthy individuals (HC group, black) and multiple sclerosis
patients (MS group, red) according to (A) level of disability (EDSS = 0.5–3.0: mild disability; EDSS = 3.5–7.0: moderate/se-
vere disability), (B) diagnosis stage (RRMS: early stage; SPMS: advanced stage), (C) pharmacological treatment (no/yes),
and (D) disease duration (more or less than 10 years). The p-value (Wilcoxon test) indicates there is a statistically significant
difference regarding the level of disability, the diagnosis stage and the therapy in the MS group (p-value < 0.05) but not in
the disease duration (p-value > 0.05).
By contrast, there are no significant differences in the TLB score (model 3), in regards
to the time from the onset of the disease (p-value = 0.746; Figure 8, Table S9).
Most of nontreated patients (n = 7), 6 out of 7 (85.71%) belonged to both EDSS (0.5–
3.0) and RRMS groups. Some subjects (14 individuals) were classified as having an unal-
tered TLB thermogram (false negatives) and were mixed from EDSS groups (Table 4).
Figure 8. Distribution of the probability score (TLB score) for healthy individuals (HC group, black) and multiple sclerosispatients (MS group, red) according to (A) level of disability (EDSS = 0.5–3.0: mild disability; EDSS = 3.5–7.0: moderate/severedisability), (B) diagnosis stage (RRMS: early stage; SPMS: advanced stage), (C) pharmacological treatment (no/yes), and(D) disease duration (more or less than 10 years). The p-value (Wilcoxon test) indicates there is a statistically significantdifference regarding the level of disability, the diagnosis stage and the therapy in the MS group (p-value < 0.05) but not inthe disease duration (p-value > 0.05).
By contrast, there are no significant differences in the TLB score (model 3), in regardsto the time from the onset of the disease (p-value = 0.746; Figure 8, Table S9).
Most of nontreated patients (n = 7), 6 out of 7 (85.71%) belonged to both EDSS (0.5–3.0)and RRMS groups. Some subjects (14 individuals) were classified as having an unalteredTLB thermogram (false negatives) and were mixed from EDSS groups (Table 4).
J. Pers. Med. 2021, 11, 295 13 of 16
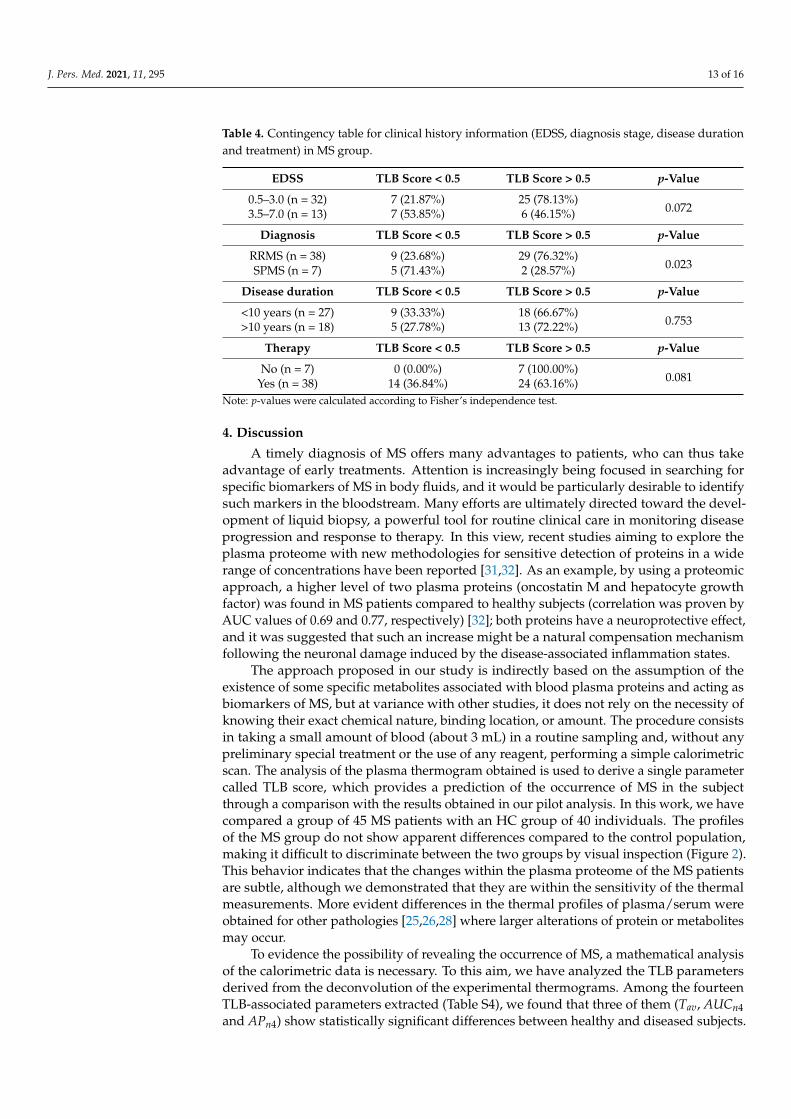
Table 4. Contingency table for clinical history information (EDSS, diagnosis stage, disease durationand treatment) in MS group.
EDSS TLB Score < 0.5 TLB Score > 0.5 p-Value
0.5–3.0 (n = 32) 7 (21.87%) 25 (78.13%)0.0723.5–7.0 (n = 13) 7 (53.85%) 6 (46.15%)
Diagnosis TLB Score < 0.5 TLB Score > 0.5 p-Value
RRMS (n = 38) 9 (23.68%) 29 (76.32%)0.023SPMS (n = 7) 5 (71.43%) 2 (28.57%)
Disease duration TLB Score < 0.5 TLB Score > 0.5 p-Value
<10 years (n = 27) 9 (33.33%) 18 (66.67%)0.753>10 years (n = 18) 5 (27.78%) 13 (72.22%)
Therapy TLB Score < 0.5 TLB Score > 0.5 p-Value
No (n = 7) 0 (0.00%) 7 (100.00%)0.081Yes (n = 38) 14 (36.84%) 24 (63.16%)
Note: p-values were calculated according to Fisher’s independence test.
4. Discussion
A timely diagnosis of MS offers many advantages to patients, who can thus takeadvantage of early treatments. Attention is increasingly being focused in searching forspecific biomarkers of MS in body fluids, and it would be particularly desirable to identifysuch markers in the bloodstream. Many efforts are ultimately directed toward the devel-opment of liquid biopsy, a powerful tool for routine clinical care in monitoring diseaseprogression and response to therapy. In this view, recent studies aiming to explore theplasma proteome with new methodologies for sensitive detection of proteins in a widerange of concentrations have been reported [31,32]. As an example, by using a proteomicapproach, a higher level of two plasma proteins (oncostatin M and hepatocyte growthfactor) was found in MS patients compared to healthy subjects (correlation was proven byAUC values of 0.69 and 0.77, respectively) [32]; both proteins have a neuroprotective effect,and it was suggested that such an increase might be a natural compensation mechanismfollowing the neuronal damage induced by the disease-associated inflammation states.
The approach proposed in our study is indirectly based on the assumption of theexistence of some specific metabolites associated with blood plasma proteins and acting asbiomarkers of MS, but at variance with other studies, it does not rely on the necessity ofknowing their exact chemical nature, binding location, or amount. The procedure consistsin taking a small amount of blood (about 3 mL) in a routine sampling and, without anypreliminary special treatment or the use of any reagent, performing a simple calorimetricscan. The analysis of the plasma thermogram obtained is used to derive a single parametercalled TLB score, which provides a prediction of the occurrence of MS in the subjectthrough a comparison with the results obtained in our pilot analysis. In this work, we havecompared a group of 45 MS patients with an HC group of 40 individuals. The profilesof the MS group do not show apparent differences compared to the control population,making it difficult to discriminate between the two groups by visual inspection (Figure 2).This behavior indicates that the changes within the plasma proteome of the MS patientsare subtle, although we demonstrated that they are within the sensitivity of the thermalmeasurements. More evident differences in the thermal profiles of plasma/serum wereobtained for other pathologies [25,26,28] where larger alterations of protein or metabolitesmay occur.
To evidence the possibility of revealing the occurrence of MS, a mathematical analysisof the calorimetric data is necessary. To this aim, we have analyzed the TLB parametersderived from the deconvolution of the experimental thermograms. Among the fourteenTLB-associated parameters extracted (Table S4), we found that three of them (Tav, AUCn4and APn4) show statistically significant differences between healthy and diseased subjects.

J. Pers. Med. 2021, 11, 295 14 of 16
Based on previous studies where different algorithms were compared [27], here we selectedthe generalized linear model as a predictive tool that provides a TLB score which correlateswith the plasma profile features. Three models were investigated (Table 2) based on theexamination of data for either subgroups separately (models 1 and 2) or the complete set ofthe TLB-parameters (model 3). The best performance was obtained with model 3, whichprovided a sensitivity of 68.89% (i.e., correct classification of a diseased individual) and aspecificity of 67.50% (i.e., correct classification of a healthy individual). This model, whichwe finally adopted for our TLB methodology, gives an area under the ROC curve value of0.79, demonstrating a good accuracy to identify MS subjects. This finding is remarkableconsidering not only the similarity of the thermograms obtained for our cohort of subjects(Figure 2) but also the peculiarity of MS, which is characterized by a heterogeneous clinicalpresentation and disease course. The sensitivity and specificity from the model werenot optimal; nevertheless, results are particularly encouraging, because (1) the visualdifferences between HC and MS thermograms are subtle (Figure 2); and (2) MS is a diseaseaffecting mainly the CNS, and little is known about its reflection in blood plasma. In fact,the changes in the biochemical composition of blood plasma are relatively minor comparedto changes in CSF, and they do not necessary reflect all possible alteration occurring in theCNS during the progression of the MS disease. A number of molecular biomarkers for MSdisease identified in both plasma and CSF were proposed [32,33].
The distribution of the TLB score (Figures 5 and 6) shows that values ≥ 0.75 are foundonly for MS patients, whereas TLB score ≤ 0.25 was found only for HC individuals. Withinthese two values, there is a partial overlap determining a 32.50% rate of false positives (HCwith TLB score > 0.5) and a 31.11% rate of false negatives (MS with TLB score < 0.5). Thus,it is clear that extreme values of the TLB score are highly indicative of the presence/absenceof the pathology, although we do not claim a perfect sensitivity and specificity of ourmethodology in such cases.
According to the results, the TLB score is not affected by gender or age in both HC andMS groups (Table 3, p > 0.05). When the distinctive classification features of the MS group(such as the disease stage, EDSS, and duration) are taken into account, the predictive powerof the model provides better outcome for MS patients having a mild disability (EDSS ≤ 3.0,p = 0.020) and an early stage of the disease (RRMS, p = 0.009). For these patients the successrate of the TLB score is near 80% (Table 4).
These rather surprising observations seem to concur in indicating that the TLB scoreworks best for patients with a mild form of MS and with a more recent onset. Thisfinding mirrors the one observed when applying TLB to cancer patients [27]. A plausibleexplanation (and an intriguing hypothesis) is that at earlier stages of MS the metabolicdisorders caused by inflammation in the CNS are considerable and they reflect in largeprotein-related blood plasma alterations (high TLB score), whereas when MS is at a latestage the organism has already reached a status of adaptation and compensation of themetabolic changes induced by the disease, with much less reflection in blood plasmaalterations (low TLB score) [34–36]. Whether this hypothesis is true or not, it is interestingto note that this finding suggests a higher likelihood of success when using the TLB scorefor patients at an early stage of the disease, when the diagnosis is both more importantand difficult.
Overall, although applied to a limited number of cases, the methodology described inthis study demonstrates a good level of classification. The next steps will include deter-mining the utility of TLB for differentiating between MS and other disorders, particularlyinflammatory diseases. Further studies including more (or only) patients with both lowEDSS and short onset time of the disease could give more insight on the TLB applicationfor the decision making on MS diagnosis and follow-up in the clinical practice.
Supplementary Materials: The following are available online at https://www.mdpi.com/article/10.3390/jpm11040295/s1, Table S1: monovariant analysis of TLB parameters of age groups; Table S2:monovariant analysis of TLB parameters of MS group according to EDSS; Table S3: main descriptiveindexes for the fourteen TLB-associated parameters; Table S4: monovariant analysis of TLB parame-

J. Pers. Med. 2021, 11, 295 15 of 16
ters of HC and MS groups; Table S5: ROC analysis for individual TLB-associated parameters; TableS6: Summary of the application of binomial generalized linear model with logistic regression (GLM)to the three models; Table S7: model comparison based on the likelihood ratio test; Table S8: TLBscore (model 3) vs. gender and age; Table S9: TLB score (model 3) vs. clinical history information(EDSS, diagnosis stage, disease duration and therapy) for MS group. Table S10: Contingency tablefor clinical history information (EDSS, diagnosis stage, disease duration, and therapy) for MS group(using TLB score from model 1); Table S11: contingency table for clinical history information (EDSS,diagnosis stage, disease duration, and therapy) for MS group (using TLB score from model 2).
Author Contributions: Conceptualization, R.G., F.A., R.B. and S.H.-D.; clinical evaluation, D.P., F.D.G.and A.P.; samples acquisition and processing, D.P., F.D.G., F.A. and R.B.; calorimetric experiments,F.A. and R.G.; fitting curve process: S.V., O.S.-G. and S.H.-D.; multiparametric analysis, O.S.-G. andS.V.; statistical analysis, J.O. and S.H.-D.; validation, S.H.-D., J.O., O.A. and A.V.-C.; data curation,R.G., B.R., O.A. and A.V.-C.; writing—original draft preparation, R.G. and B.R.; writing—review andediting, R.G., B.R., S.H.-D., D.P. and O.A.; A.V.-C.; supervision, R.G. and O.A.; project administration,R.G. and F.A.; funding acquisition, O.A. and A.V.-C. All authors have read and agreed to the publishedversion of the manuscript.
Funding: This research was funded by the Spanish Ministry of Economy and Competitiveness andEuropean ERDF Funds (MCIU/AEI/FEDER, EU) (BFU2016-78232-P to A.V.C.); Projects funded byInstituto de Salud Carlos III and co-funded by European Union (ESF, “Investing in your future”):“PI15/00663 (FIS project to O.A)”, “PI18/00349 (FIS project to O.A.)”, “FI19/00146 (PFIS contract forSHD)”; Diputación General de Aragón (Protein Targets and Bioactive Compounds Group E45_20R toA.V.C. and Digestive Pathology Group B25_20R to O.A.); and the Centro de Investigación Biomédicaen Red en Enfermedades Hepáticas y Digestivas (CIBERehd).
Institutional Review Board Statement: The study was approved by the Ethics Committee of theNorthern Area of the Calabria Region (protocol n. 50 of 14 February 2017).
Informed Consent Statement: Informed consent was obtained from all subjects involved in the study.
Data Availability Statement: The data presented in this study are available from the correspondingauthors upon reasonable request.
Conflicts of Interest: The authors declare no conflict of interest.
References1. Reich, D.S.; Lucchinetti, C.F.; Calabresi, P.A. Multiple Sclerosis. N. Engl. J. Med. 2018, 378, 169–180. [CrossRef] [PubMed]2. Walton, C.; King, R.; Rechtman, L.; Kaye, W.; Leray, E.; Marrie, R.A.; Robertson, N.; La Rocca, N.; Uitdehaag, B.;
van der Mei, I.; et al. Rising prevalence of multiple sclerosis worldwide: Insights from the Atlas of MS, third edition.Mult. Scler. 2020, 26, 1816–1821. [CrossRef] [PubMed]
3. Collaborators, G.M.S. Global, regional, and national burden of multiple sclerosis 1990–2016: A systematic analysis for the GlobalBurden of Disease Study 2016. Lancet Neurol. 2019, 18, 269–285.
4. Milo, R. Effectiveness of multiple sclerosis treatment with current immunomodulatory drugs. Expert Opin. Pharmacother. 2015,16, 659–673. [CrossRef] [PubMed]
5. Brownlee, W.J.; Hardy, T.A.; Fazekas, F.; Miller, D.H. Diagnosis of multiple sclerosis: Progress and challenges. Lancet 2017,389, 1336–1346. [CrossRef]
6. Thompson, A.J.; Banwell, B.L.; Barkhof, F.; Carroll, W.M.; Coetzee, T.; Comi, G.; Correale, J.; Fazekas, F.; Filippi, M.; Freedman,M.S.; et al. Diagnosis of multiple sclerosis: 2017 revisions of the McDonald criteria. Lancet Neurol. 2018, 17, 162–173. [CrossRef]
7. Burman, J.; Zetterberg, H.; Fransson, M.; Loskog, A.S.; Raininko, R.; Fagius, J. Assessing tissue damage in multiple sclerosis:A biomarker approach. Acta Neurol. Scand. 2014, 130, 81–89. [CrossRef] [PubMed]
8. Harris, V.K.; Tuddenham, J.F.; Sadiq, S.A. Biomarkers of multiple sclerosis: Current findings. Degener. Neurol. Neuromuscul. Dis.2017, 7, 19–29. [CrossRef]
9. Kivisakk, P.; Healy, B.C.; Francois, K.; Gandhi, R.; Gholipour, T.; Egorova, S.; Sevdalinova, V.; Quintana, F.; Chitnis, T.;Weiner, H.L.; et al. Evaluation of circulating osteopontin levels in an unselected cohort of patients with multiple sclerosis:Relevance for biomarker development. Mult. Scler. 2014, 20, 438–444. [CrossRef]
10. Liguori, M.; Qualtieri, A.; Tortorella, C.; Direnzo, V.; Bagala, A.; Mastrapasqua, M.; Spadafora, P.; Trojano, M. Proteomic profilingin multiple sclerosis clinical courses reveals potential biomarkers of neurodegeneration. PLoS ONE 2014, 9, e103984. [CrossRef]
11. Hye, A.; Lynham, S.; Thambisetty, M.; Causevic, M.; Campbell, J.; Byers, H.L.; Hooper, C.; Rijsdijk, F.; Tabrizi, S.J.; Banner, S.; et al.Proteome-based plasma biomarkers for Alzheimer’s disease. Brain 2006, 129, 3042–3050. [CrossRef]

J. Pers. Med. 2021, 11, 295 16 of 16
12. Mordechai, S.; Shufan, E.; Porat Katz, B.S.; Salman, A. Early diagnosis of Alzheimer’s disease using infrared spectroscopy ofisolated blood samples followed by multivariate analyses. Analyst 2017, 142, 1276–1284. [CrossRef]
13. Elshemey, W.M.; Ismail, A.M.; Elbialy, N.S. Molecular-Level Characterization of Normal, Benign, and Malignant Breast TissuesUsing FTIR Spectroscopy. J. Med. Biol. Eng. 2016, 36, 369–378. [CrossRef]
14. Garbett, N.C.; Miller, J.J.; Jenson, A.B.; Chaires, J.B. Calorimetry Outside the Box: A New Window into the Plasma Proteome.Biophys. J. 2008, 94, 1377–1383. [CrossRef] [PubMed]
15. Crutchfield, C.A.; Thomas, S.N.; Sokoll, L.J.; Chan, D.W. Advances in mass spectrometry-based clinical biomarker discovery. Clin.Proteomics 2016, 13, 1–12. [CrossRef] [PubMed]
16. Cooper, A. Differential scanning microcalorimetry. In Protein-Ligand Interactions: Hydrodynamics and Calorimetry; Oxford UniversityPress: Oxford, UK, 2000.
17. Privalov, G.; Kavina, V.; Freire, E.; Privalov, P.L. Precise scanning calorimeter for studying thermal properties of biologicalmacromolecules in dilute solution. Anal. Biochem. 1995, 232, 79–85. [CrossRef] [PubMed]
18. Guglielmelli, A.; Rizzuti, B.; Guzzi, R. Stereoselective and domain-specific effects of ibuprofen on the thermal stability of humanserum albumin. Eur. J. Pharm. Sci. 2018, 112, 122–131. [CrossRef] [PubMed]
19. Rizzuti, B.; Bartucci, R.; Pey, A.L.; Guzzi, R. Warfarin increases thermal resistance of albumin through stabilization of the proteinlobe that includes its binding site. Arch. Biochem. Biophys. 2019, 676, 108123. [CrossRef]
20. Guzzi, R.; Sportelli, L.; Yanagisawa, S.; Li, C.; Kostrz, D.; Dennison, C. The influence of active site loop mutations on the thermalstability of azurin from Pseudomonas aeruginosa. Arch. Biochem. Biophys. 2012, 521, 18–23. [CrossRef]
21. Chagovetz, A.A.; Jensen, R.L.; Recht, L.; Glantz, M.; Chagovetz, A.M. Preliminary use of differential scanning calorimetry ofcerebrospinal fluid for the diagnosis of glioblastoma multiforme. J. Neurooncol. 2011, 105, 499–506. [CrossRef]
22. Garbett, N.C.; Mekmaysy, C.S.; DeLeeuw, L.; Chaires, J.B. Clinical application of plasma thermograms. Utility, practicalapproaches and considerations. Methods 2015, 76, 41–50. [CrossRef]
23. Krumova, S.; Rukova, B.; Todinova, S.; Gartcheva, L.; Milanova, V.; Toncheva, D.; Taneva, S.G. Calorimetric monitoring of theserum proteome in schizophrenia patients. Thermochim. Acta 2013, 572, 59–64. [CrossRef]
24. Vega, S.; Garcia-Gonzalez, M.A.; Lanas, A.; Velazquez-Campoy, A.; Abian, O. Deconvolution analysis for classifying gastricadenocarcinoma patients based on differential scanning calorimetry serum thermograms. Sci. Rep. 2015, 5, 7988. [CrossRef][PubMed]
25. Tsvetkov, P.O.; Tabouret, E.; Roman, A.Y.; Romain, S.; Bequet, C.; Ishimbaeva, O.; Honore, S.; Figarella-Branger, D.; Chinot, O.;Devred, F. Differential scanning calorimetry of plasma in glioblastoma: Toward a new prognostic/monitoring tool. Oncotarget2018, 9, 9391–9399. [CrossRef] [PubMed]
26. Garbett, N.C.; Brock, G.N.; Chaires, J.B.; Mekmaysy, C.S.; DeLeeuw, L.; Sivils, K.L.; Harley, J.B.; Rovin, B.H.; Kulasekera, K.B.;Jarjour, W.N. Characterization and classification of lupus patients based on plasma thermograms. PLoS ONE 2017, 12, e0186398.[CrossRef] [PubMed]
27. Rodrigo, A.; Ojeda, J.L.; Vega, S.; Sanchez-Gracia, O.; Lanas, A.; Isla, D.; Velazquez-Campoy, A.; Abian, O. Thermal Liquid Biopsy(TLB): A Predictive Score Derived from Serum Thermograms as a Clinical Tool for Screening Lung Cancer Patients. Cancers 2019,11, 1012. [CrossRef]
28. Velazquez-Campoy, A.; Vega, S.; Sanchez-Gracia, O.; Lanas, A.; Rodrigo, A.; Kaliappan, A.; Hall, M.B.; Nguyen, T.Q.; Brock, G.N.;Chesney, J.A.; et al. Thermal liquid biopsy for monitoring melanoma patients under surveillance during treatment: A pilot study.Biochim. Biophys. Acta Gen. Subj. 2018, 1862, 1701–1710. [CrossRef] [PubMed]
29. Polman, C.H.; Reingold, S.C.; Banwell, B.; Clanet, M.; Cohen, J.A.; Filippi, M.; Fujihara, K.; Havrdova, E.; Hutchinson, M.;Kappos, L.; et al. Diagnostic criteria for multiple sclerosis: 2010 revisions to the McDonald criteria. Ann. Neurol. 2011, 69, 292–302.[CrossRef]
30. Gornall, A.G.; Bardawill, C.J.; David, M.M. Determination of serum proteins by means of the biuret reaction. J. Biol. Chem. 1949,177, 751–766. [CrossRef]
31. Fluss, R.; Faraggi, D.; Reiser, B. Estimation of the Youden Index and its associated cutoff point. Biom. J. 2005, 47, 458–472.[CrossRef]
32. Huang, J.; Khademi, M.; Fugger, L.; Lindhe, Ö.; Novakova, L.; Axelsson, M.; Malmeström, C.; Constantinescu, C.; Lycke, J.;Piehl, F.; et al. Inflammation-related plasma and CSF biomarkers for multiple sclerosis. Proc. Natl. Acad. Sci. USA 2020, 117,12952–12960. [CrossRef] [PubMed]
33. Malekzadeh, A.; Leurs, C.; van Wieringen, W.; Steenwijk, M.D.; Schoonheim, M.M.; Amann, M.; Naegelin, Y.; Kuhle, J.;Killestein, J.; Teunissen, C.E. Plasma proteome in multiple sclerosis disease progression. Ann. Clin. Transl. Neurol. 2019, 6,1582–1594. [CrossRef] [PubMed]
34. Bhargava, P.; Anthony, D.C. Metabolomics in multiple sclerosis disease course and progression. Mult. Scler. J. 2020, 26, 591–598.[CrossRef]
35. Porter, L.; Shoushtarizadeh, A.; Jelinek, G.A.; Brown, C.R.; Lim, C.K.; de Livera, A.M.; Jacobs, K.R.; Weiland, T.J. MetabolomicBiomarkers of Multiple Sclerosis: A Systematic Review. Front. Mol. Biosci. 2020, 7, 591–598. [CrossRef]
36. Andersen, S.L.; Briggsb, F.B.S.; Winnikec, J.H.; Natanzonb, Y.; Maichled, S.; Knaggec, K.J.; Newbye, L.K.; Gregorya, S.G.Metabolome-based signature of disease pathology in MS. Mult. Scler. Relat. Disord. 2019, 31, 12–21. [CrossRef] [PubMed]