thermal barrier coatings for efficient combustion diego ...759397/attachment01.pdf · thermal...
TRANSCRIPT

i
Thermal barrier coatings for efficient
combustion
Diego Daniel Vargas Carmona
Degree project in
Materials Science and Engineering
Second Cycle
Stockholm, Sweden 2014

ii
Abstract
A reduction of the Greenhouse Gases (GHG) emissions is of highest importance in all industrial
sectors around the world in order to prevent unwanted climate changes. Among EU countries in the
last years, a number of international and national procedures and commitments have already been
implemented in different sectors. However, in the transport sector however, due to its rapid growth,
the overall GHG emission is still increasing. In the IEA technology roadmap for transportation it is
stated that today over 50% of oil use is for transportation, three-fourths of it is consumed on the roads .
If no preventative steps are taken, the total oil consumption in this sector will double by 2050. The
most cost effective way to reduce the oil consumption is to develop more efficient combustion
engines. Today, about 40-45% of fuel energy is converted into a useful work, while remaining fuel
energy in form of heat losses is transferred to environment. One of the possible solutions of decreasing
heat losses from the engine is by insulation of combustion chamber walls with the Thermal Barrier
Coating (TBC). For Scania, as a leader in fuel efficiency, all possible measures of improvements are in
the scope of interest. Therefore this master thesis was carried out. The theoretical study was focused
on about appropriate materials, industrial applications and the state of the art research in the area of
combustion chamber insulation. For the experimental studies three materials with documented
performance in the engine and turbine industry were chosen. Piston prototypes and samples for
material study were coated using two thicknesses 500 µm and 1000 µm and a coating of Metco 143
ZrO218TiO210Y2O3, Metco 204C-XCL ZrO28Y2O3 (porous) and Metco 204F ZrO28Y2O3 (segmented)
powders. The heat capacity, apparent thermal diffusivity and microhardness were measured for each
coating. The durability under high temperature variation was tested in a specially designed rig for
thermal cycling. Coated pistons were tested in a single cylinder research engine, to verify the
insulation potential. TBC samples were investigated with light optical (LOM) and scanning electron
microscopy (SEM), both before and after tests. Experiments showed that there was a reduced heat
transfer during engine testing with TBC. However, due to negative influence of insulation on the
combustion process and lower overall engine efficiency, it was hard to quantify the results. A trend
showing decreased heat losses with increased insulation thickness was noticed. During both engine
and thermal cycling tests the Metco 143 coating failed mechanically. LOM observations revealed
cracks on the top coat/bond coat interface for all the samples after engine testing. Only the Metco
204C-XCL coating showed no changes after a thermal cycling test. Also the porosity proved to be an
effective factor decreasing thermal diffusivity as well as to improve the coating tolerance for residual
stress. The SEM study revealed cracks in the samples after engine testing in Metco 143 and Metco
204F materials.

iii
Acknowledgments
I would like to express my deepest appreciation to my direct supervisor Michal Gramatyka, who has
shown the attitude and the substance of a leader. Surpassing his quality of supervisor, his
extraordinary close support and joyful disposition have facilitated my apprenticeship through my path
in Scania. The healthy discussions in the master thesis have benefited me directly in my personal
improvement as a professional and as a person.
I would like to thank Jessica Elfsberg for her outstanding support and advice. Her comments and
remarks from materials science have increased my understanding on the field and motivated to pursue
a deep explanation of the phenomena.
Furthermore I would like to thank Daniel Norling and NMP groups for their useful comments and
enlightenment into the combustion phenomena. Their smart interpretation and discussion of results
have allowed me to experience a nurturing atmosphere of professional growth.
I would also like to express my gratitude to NMPF and UTMB for offering a dream of a thesis by
creating a symbiosis between materials research in real engine conditions, merging exquisitely two
fields of my professional background.
Extra thanks for Bernt Nensén and Christian Vogelgsang for their close collaboration in the single
cylinder cell and proposal of ideas for the test running. Likewise I thank Taishi Matsushita for his kind
and thorough support during the thermal cycling testing.
Finally I will be forever grateful to my beloved ones for the valuable moments of conversation even if
the time difference made it inadequate.

iv
Table of Contents
Introduction ............................................................................................................................................. 1
1 Diesel Engines ................................................................................................................................. 2
1.1 Classification ........................................................................................................................... 2
1.2 Four-stroke cycle ..................................................................................................................... 2
1.3 Diesel engine combustion........................................................................................................ 4
1.4 Emission formation ................................................................................................................. 6
1.4.1 Nitrogen Oxides (NOX) .................................................................................................... 8
1.4.2 Particulate Matter (PM) .................................................................................................. 8
1.4.3 Relation between NOX and PM formation ....................................................................... 9
2 Heat Transfer ................................................................................................................................. 11
2.1 Heat transfer in the internal combustion engine .................................................................... 11
2.2 Heat transfer .......................................................................................................................... 11
2.2.1 Convection ..................................................................................................................... 11
2.2.2 Conduction .................................................................................................................... 12
2.2.3 Radiation ....................................................................................................................... 12
2.3 Heat losses from the combustion chambers .......................................................................... 13
2.3.1 Heat transfer breakdown ............................................................................................... 13
2.3.2 Model of the heat transfer from the combustion chamber ............................................. 15
3 Purpose of a Thermal Barrier Coating ........................................................................................... 16
3.1 Insulation concept .................................................................................................................. 16
3.2 Structure of TBC ................................................................................................................... 16
3.3 TBC for turbine engines applications .................................................................................... 16
3.4 State of the art in the field of TBC in the diesel engine ........................................................ 17
3.4.1 Temperature swing heat insulation ............................................................................... 17
3.4.2 Influence of optical properties of TBC .......................................................................... 21
3.5 Conclusions ........................................................................................................................... 22
4 Types of Coatings Materials .......................................................................................................... 23
4.1 Properties of a TBC ............................................................................................................... 23
4.2 Types of coatings ................................................................................................................... 25
4.2.1 Metals ............................................................................................................................ 25
4.2.1.1 Hot-dip galvanizing ....................................................................................................... 26
4.2.1.2 Metal spraying ............................................................................................................... 27

v
4.2.1.3 Electrochemical deposition ........................................................................................... 27
4.2.1.4 Sherardizing .................................................................................................................. 27
4.2.2 Polymers ........................................................................................................................ 27
4.2.3 Aerogels ......................................................................................................................... 28
4.2.4 Ceramics ........................................................................................................................ 29
4.3 Ceramic materials .................................................................................................................. 29
4.3.1 Zirconium dioxide – ZrO2 .............................................................................................. 29
4.3.2 Alumina – Al2O3............................................................................................................. 31
4.3.3 Chromia – Cr2O3 ........................................................................................................... 31
4.3.4 Lanthanum – La ............................................................................................................. 32
4.3.5 Titanium dioxide – TiO2 ................................................................................................ 32
4.4 Coating methods .................................................................................................................... 32
4.4.1 Thermal spraying (TS) ................................................................................................... 33
4.4.2 High velocity oxygen fuel spray - Liquid and Gas (HVOF) .......................................... 35
4.4.3 Physical vapour deposition (PVD) ................................................................................ 35
4.4.4 Chemical vapour deposition (CVD) .............................................................................. 36
4.4.5 Sol-gel ............................................................................................................................ 38
4.5 Structure of a TBC ................................................................................................................ 38
4.6 Failure mechanism ................................................................................................................ 40
4.6.1 Crack propagation......................................................................................................... 40
4.6.2 Failure by stresses and oxidation layers ....................................................................... 42
4.6.3 Failure prevention ......................................................................................................... 43
5 Sample preparation ........................................................................................................................ 44
5.1 TBC Powders ........................................................................................................................ 44
5.2 Sample preparation ................................................................................................................ 44
5.2.1 Pistons ........................................................................................................................... 44
5.2.2 Coin samples ................................................................................................................. 45
5.3 Sample coating ...................................................................................................................... 45
5.3.1 Pre-treatment ................................................................................................................. 45
5.3.2 Coating process ............................................................................................................. 45
5.3.3 Coating results .............................................................................................................. 46
6 Engine Testing with TBC .............................................................................................................. 48
6.1 Surface identification ............................................................................................................ 48
6.2 Test Engine ............................................................................................................................ 49
vi
6.3 Test bench setup .................................................................................................................... 49
6.4 Test program .......................................................................................................................... 51
6.5 Test results ............................................................................................................................. 52
7 Material Results ............................................................................................................................. 60
7.1 Light optical microscopy (LOM) .......................................................................................... 60
7.1.1 Coins samples before thermal cycling test - LOM ........................................................ 60
7.1.2 Coin samples after thermal cycling test – LOM ............................................................ 62
7.1.3 Pistons after engine testing - LOM ................................................................................ 63
7.2 Hardness (Microhardness) ..................................................................................................... 65
7.2.1 Coin samples before thermal cycling - Microhardness ................................................. 66
7.2.2 Coin samples after thermal cycling test - Microhardness ............................................. 67
7.2.3 Pistons after engine testing - Microhardness ................................................................ 67
7.3 Scanning Electron Microscope (SEM) .................................................................................. 68
7.3.1 Coin samples before thermal cycling test - SEM ........................................................... 69
7.3.2 Coin samples after thermal cycling test - SEM ............................................................. 71
7.3.3 Pistons after engine testing - SEM ................................................................................ 74
7.4 Differential Scanning Calorimetry (DSC) ............................................................................. 78
7.5 Thermal diffusivity (Laser Flash) .......................................................................................... 80
7.6 Thermal Cyclic Loading ........................................................................................................ 83
8 Discussion of Results .................................................................................................................... 85
9 Conclusion ..................................................................................................................................... 88
10 Further work .............................................................................................................................. 89
11 References ................................................................................................................................. 90
12 Appendixes .................................................................................................................................. A

vii
Nomenclature
APS Atmospheric Plasma Spray
BDC Bottom Dead Center
CAD Crank angle degree
CI Compression-Ignited
CVD Chemical Vapour Deposition
DSC Differential Scanning Calorimetry
EB-PVD Electron Beam Physical Vapour Deposition
EGR Exhaust Gas Recirculation
GHG Greenhouse Gas
HC Hydrocarbons
HVOF High Velocity Oxy-Fuel
IC Internal Combustion
IEA International Energy Agency
NOX Nitrogen Oxides
PM Particulate Matter
PVD Physical Vapour Deposition
SGE Single Cylinder Engine
SI Spark-Ignited
SOI Start of Injection
TBC Thermal Barrier Coating
TDC Top Dead Center
TGO Thermally Grown Oxide
YSZ Yttria Stabilized Zirconia

viii

1
Introduction
Reduction of Greenhouse Gases (GHG) emission is of highest importance in all industrial sectors
around the world in order to prevent the unwanted climate changes. According to International Energy
Agency (IEA), without preventing actions the energy related CO2 emission will be more than double
by 2050 and increased oil demand will create more concerns about supplies. Among EU countries a
number of international and national procedures and commitments were already implemented in the
last years. In the transport sector however, due to its rapid growth the overall GHG emission is still
increasing. In the IEA technology roadmap for transportation it is stated that today over 50% of oil use
is for transportation and three-fourths of it is consumed on the roads. If nothing is done on the matter,
the total oil consumption in this sector will double by 2050. Nevertheless, by further development,
improvements and commercialisation of available technologies, the achievement of 30% to 50%
reduction of fuel consumption per kilometre from new light and heavy duty vehicles is possible before
2030; and from all light and heavy duty vehicles by 2050. The most cost effective way to reduce the
oil consumption is to develop more efficient combustion engines. Today about 40-45% of fuel energy
is converted into a useful work, and remaining fuel energy in form of heat losses is transferred to
environment, with the coolant ~25-30% and with the exhaust gas ~25-30%. Reduction of heat losses
would have a direct impact on engine efficiency and fuel economy. As heat energy from the exhaust
gas can be partially recovered and converted into work if using a Waste Heat Recovery (WHR)
system, the heat from the coolant is a waste. Because of this, reduction of heat transfer from the
combustion chamber through the walls is in focus of this Masterwork. The attempt is by application of
different ceramic material as Thermal Barrier Coatings (TBC) and verification of its performance both
from engine and material point of view [0].

2
Chapter
1 Diesel Engines
1.1 Classification
Heat engines are energy conversion machines which transform the heat energy, generated during
combustion of fuel in air, into mechanical work. The conversion is made by the reciprocating piston
movement linked to a crankshaft with a connecting rod. Engines with integrated combustion chamber
are classified as internal combustion (IC) engines. The characteristic feature of diesel engines is the
utilisation of working fluid temperature and pressure increase during compression for ignition of the
fuel. This differs them from the spark ignition engines, where the ignition is initiated by the sparkplug.
IC engines, depending on working principle, can work as two-stroke or four-stroke engines with one
combustion per crankshaft revolution and one combustion per two crankshaft revolutions,
respectively. However, engines which operate in two-stroke cycle, are not within the subject of this
master thesis work since they are not used nowadays in heavy duty truck application [1].
1.2 Four-stroke cycle
In order to complete the thermodynamic cycle in the IC four-stroke engine, the pistons have to
complete four movements along the cylinder which correspond to intake, compression, power and
exhaust strokes.
At first, in the intake stage the piston moves downwards from top dead center (TDC) to bottom dead
center (BDC) increasing the working volume of the chamber. The pressure is reduced inside the
cylinder and a charge of fresh air is loaded into the chamber through the open intake valves during
piston movement. When the piston reaches the BDC, the intake valves close. In the compression
stroke all the valves are closed and the piston moves upwards compressing the air charge that was
loaded in the previous stage. Diesel injection takes place as the piston achieves the TDC and is
followed almost immediately by ignition. In the third stage, power stroke, the crankshaft starts its
second revolution in the cycle. The combustion spreads rapidly along the chamber rising the
temperature and pressure of the mixture. As the piston moves downward it transfers mechanical
energy to the crankshaft. At the end of this stroke, shortly before BDC, exhaust valves open and
irreversible expansion of exhaust gases takes place. Finally, the piston moves upwards again in the
fourth stage pushing the remaining exhaust gases out of the chamber through the open exhaust valves.
Additionally shortly before TDC, intake valves open. The period in which all valves are open is called
overlap and aims to improve the removing of residual exhaust gases from the chamber. While piston is
passing TDC exhaust valves close [2]. Figure 0:1 presents the overview of the four stroke process.

3
Figure 0:1. Stages in a four-stroke engine [3]
Figure 0:2 (left side picture) shows pressure-volume diagram which presents an idealised complete
thermodynamic cycle off a four-stroke engine. Each stroke of the cycle corresponds to different
thermodynamic process. Intake 0-1 is assumed to be isobaric (no pressure change), compression 1-2 is
assumed to be isentropic process (reversible, with no heat exchange), combustion 2-3 is assumed to be
isochoric (addition of heat at constant volume), expansion 3-4 is assumed to be isentropic process
(reversible, with no heat exchange), exhaust blow down 4-1 is assumed to be isochoric process
(rejection of heat at constant volume) and exhaust 1-0 is assumed to be isobaric (no pressure change).
In reality however, a four-stroke engine operates as mechanical engine and thus processes do not
proceed thermodynamically as ideal. A more realistic cycle model of a four-stroke engine is presented
in Figure 0:2 (right side picture). In the induction stage when the piston moves downwards and the
volume expands it is not possible to maintain isobaric conditions during the movement. The difference
in pressure causes air inflow into the chamber from the intake ports. In the compression stage the
cylinder volume is reduced, temperature and pressure increase, however the process is not isentropic
as heat losses from the gas to cylinder walls are observed as well as friction losses between piston
rings and liners. When the piston is about to reach TDC the fuel is injected and ignition is triggered.
Combustion stage determined by the moment of ignition marks a further increase in pressure and
temperature. Diesel combustion is a very complex process which can be controlled by adjustment of
many parameters and therefore it is not an isochoric process. Further on, in the power stroke when the
energy of combustion is converted into mechanical work during piston movement both heat and
friction losses are present. The process is thus not isentropic under this stage. In the exhaust blow-
down stage when the exhaust valves open, rapid pressure drop is observed, however the process is not
isochoric as the volume of the chamber slightly changes. Soon after, when the piston moves upwards
to the TDC position pushing the remaining exhaust gas away from the chamber, a pressure change
occurs due to flow restriction in the exhaust valve. The process is not isobaric at this stage and friction
and other sources will cause heat loss [4].

4
Figure 0:2. Idealised indicator diagram for four-stroke engine (left side picture) [4]. Real indicator diagram for four-stroke
diesel engine (right side picture) [4]
1.3 Diesel engine combustion
The key characteristic of the Diesel engine is spontaneous auto-ignition of the mixture utilizing the
heat of compression instead for external source of ignition. Through high compression ratio of the air
normally 16-20:1, temperature and pressure in the combustion chamber exceed respectively 600 °C
and 100 bar at the moment of ignition. Diesel fuel is injected in the final stage of compression stroke,
a couple of crank angle degrees before the TDC. In order to ensure fast fuel-air mixture formation the
fuel is injected at very high pressures up to 2500 bar. Multi-hole injectors are used to inject a large
mass of fuel in very short time. Generally larger holes allow faster fuel injection. Injection pressure
however, has the greatest importance and has to be optimized in view that low pressure promotes soot
formation while too high promotes NOX formation. To control the combustion process, injection is
usually divided into a series of pre, main and post injections. When fuel spray leaves the nozzle hole,
it breaks up into droplets which penetrate the combustion chamber absorbing heat from the
surrounding compressed air and vaporize. Among the most important factors accelerating fuel
vaporisation are turbulences generated during injection and charge movements like squish and swirl.
Squish air movement is created by the piston reaching TDC. The air located between cylinder head
and piston’s squish area is pressed into the piston bowl. Swirl is a rotary movement around the center
axis of the cylinder caused by being accelerated at the intake valves with a particular inclination. The
swirl number is a dimensionless factor directly proportional to the engine speed. Diesel combustion
can be described by 3 stages, which characterize the compression-ignition behaviour and differs it
from the Otto engine process. Those are: ignition delay, premixed combustion and mixture diffused
combustion. Different time intervals correspond to each stage depending on current operating point in
the engine map. Figure 0:3 presents all three stages as a function of crank angle [5].

5
Figure 0:3. Diesel-engine combustion [5]
The ignition lag (delay) indicates the time between the start of injection and the start of combustion.
The ignition lag is dependent on several factors, like cylinder temperature and pressure, fuel cetane
number and local vapour concentration. Low temperature during the cold start, as well as low quality
of fuel, extends the ignition lag. Increase in cylinder pressure shortens the ignition lag instead.
Duration of the ignition delay determines the amount of fuel which burns in the premix combustion
phase, as extended time allows greater amount of fuel to mixed with air. The combustion starts in the
place where fuel and air have mixed creating most favourable thermodynamical conditions (relatively
low λ). Exothermal reactions rise the local temperature above 2300 K and start the chain reactions
which convert rapidly the not yet combusted premixed fuel increasing rapidly the pressure. The
combustion here is limited by the reaction speed. A rapid pressure gradient increase causes the noises
and it can lead to the engine damage. Thus premixed combustion phase must be limited by additional
pilot injections. Less than 1% of fuel burns as premixed at full load, while almost 100% burns as
premixed at lowest loads.
Remaining fuel burns in the mixture controlled combustion where the speed is limited by the diffusion
of fuel and oxygen into the reaction zone and the products of combustion from the reaction zone. For
this reason it is also known as diffusion combustion. The range of λ that characterizes this regime is
between 0.8 and 1.4 and appears at the edges of the spray. The factors which influence majorly the
combustion here are mixture formation and high local turbulences. Increase of injection pressure and
in-cylinder charge movements rise the kinetic energy which accelerates the oxygen transfer in the
local reaction zones resulting in faster desirable combustion. Diffusion combustion prevails in the
wide load range where large amount of fuel is injected.
Figure 0:4 presents the structure of the flame during the diffusion combustion. Several areas are
determined. The lift-off length sets the distance from the injector to the first sign of combustion. The
area where fuel undergoes evaporation and where the concentration of oxygen is too low for ignition is

6
marked in beige. The narrow light blue band surrounding beige area is the premixed combustion zone.
Due to a lack of oxygen and rich combustion in the light blue region, the first soot formation appears
in the area indicated in grey. Further downstream inside the flame plume indicated in dark blue and
maroon-yellow colour, the formation of soot particles continues. The hot-soot contributes to the heat
transfer to the combustion chamber walls in form of black-body radiation and is essential to diesel
combustion. By decreasing soot amount, the radiation is also decreased. Further on, on the edges of
the flame plume marked in green, where temperature is high and more oxygen is available, thermal
NOX is created. In the same area previously discussed soot undergoes oxidation [6] [7].
Figure 0:4. Conceptual model of a diesel flame [8]
1.4 Emission formation
A diesel engine converts chemical energy from the fuel and generates mechanical power and other
combustion products. Ideally exhaust gases after diesel combustion are of the type CO2, H2O and the
unused portion of engine air in the form of O2 and N2. However, under non-ideal conditions other
pollutants are produced as a result of incomplete combustion of fuel and of reactions between mixture
components at high temperature and pressure, among others. Common pollutants include unburned
hydrocarbons (HC), carbon monoxide (CO), nitrogen oxides (NOX) and soot or other particulate
matters (PM). These emission products can adversely affect human health and/or have environmental
impacts. Reducing the level of pollutants is in a great interest due to the previous reasons and for its
relation to fuel consumption. The total cost of ownership for heavy-duty vehicles is less if the fuel
consumption is improved.
In Figure 0:5 it is shown a schematic representation for the concentration of pollutants in diesel
exhaust gases. The total concentration of pollutant emissions before after-treatment devices is in the
order of few tenths of one percent.

7
Figure 0:5. Relative concentration of pollutant in engine-out emissions, before after treatment system [1]
Table 0-1 and Table 0-2 present the admissible levels for CO, HC, NOX, PM and smoke according to
the European regulations along the years.
Table 0-1. EU emission standards for heavy-duty diesel engines: Steady-State Testing [9]
Stage Date Test CO HC NOX PM PN Smoke
g/kWh 1/kWh 1/m
Euro I 1992, ≤ 85 kW
ECE R-49
4.5 1.1 8.0 0.612
1992, > 85 kW 4.5 1.1 8.0 0.36
Euro II 1996.10 4.0 1.1 7.0 0.25
1998.10 4.0 1.1 7.0 0.15
Euro III 1999.10 EEV only
ESC & ELR
1.5 0.25 2.0 0.02
0.15
2000.10 2.1 0.66 5.0 0.10a
0.8
Euro IV 2005.10 1.5 0.46 3.5 0.02
0.5
Euro V 2008.10 1.5 0.46 2.0 0.02
0.5
Euro VI 2013.01 WHSC 1.5 0.13 0.40 0.01 8.0×10¹¹
a - PM = 0.13 g/kWh for engines < 0.75 dm3 swept volume per cylinder and a rated power speed
> 3000 min-1
Table 0-2. EU Emission Standards for Heavy-Duty Diesel and Gas Engines: Transient Testing [9]
Stage Date Test CO NMHC CH4
a NOX PMb PNe
g/kWh 1/kWh
Euro III 1999.10 EEV only
ETC
3.0 0.40 0.65 2.0 0.02
2000.10 5.45 0.78 1.6 5.0 0.16c
Euro IV 2005.10 4.0 0.55 1.1 3.5 0.03
Euro V 2008.10 4.0 0.55 1.1 2.0 0.03
Euro VI 2013.01 WHTC 4.0 0.16
d 0.5 0.46 0.01 6.0×10
11
a - for gas engines only (Euro III-V: NG only; Euro VI: NG + LPG)
b - not applicable for gas fueled engines at the Euro III-IV stages
c - PM = 0.21 g/kWh for engines < 0.75 dm3 swept volume per cylinder and a rated power speed > 3000 min
-1
d - THC for diesel engines
e - for diesel engines; PN limit for positive ignition engines TBD

8
1.4.1 Nitrogen Oxides (NOX)
As mentioned before, nitrogen oxides (NOX) have been identified as one of the major pollutants which
contribute to the formation of photochemical smog. The term NOX comprises two nitrogen oxides, NO
and NO2. At combustion temperatures ~2500 K the kinetic reaction promotes NO formation, keeping
the NO2 on very low levels. Thus the NO2 content in NOX leaving the combustion chamber is below
5%. In ambient conditions however the NO converts slowly into NO2 and further reacts with unburned
non-methane hydrocarbons in ultra-violet light creating photochemical smog. There are three main
mechanisms of NOX-formation in diesel combustion. The first is by the oxidation of nitrogen
containing fuel molecules, called fuel-NOX. Secondly, NOX can be formed in rich mixtures in reaction
of atmospheric N2 with fuel radical according to the so-called prompt mechanism. Thirdly, NOX may
be formed in reactions between N2 and O2 in the air. This reaction is strongly temperature and
residence time dependent and therefore is called thermal NOX. High reaction rates are obtained above
1900 K where N2 and O2 molecules undergo dissociation. The reactions mechanism of thermal NOX is
explained by the Zeldovich-mechanism [6].
2 𝑂 ⟷ 𝑂2 (1)
𝑂 + 𝑁2 ↔ 𝑁𝑂 + 𝑁 (2)
𝑁 + 𝑂2 ↔ 𝑁𝑂 + 𝑂 (3)
𝑁 + 𝑂𝐻 ↔ 𝑁𝑂 + 𝐻 (4)
At initial conditions in the Zeldovich-mechanism, the oxygen molecule undergoes thermal dissociation
forming oxygen radicals shown in equation (1). Equation (2) describes the reaction of oxygen radicals
with N2 forming NO and atomic N. In this reaction triple bond in N2 molecule must be broken,
something which requires very high energy and thus limits the whole NOX formation process. In
reaction (3) nitrogen radical and O2 molecule forms NO and O radical. The cycle is completed and the
reaction chain starts from the beginning. The last equation describes the formation of NO in fuel rich
zones (4).
1.4.2 Particulate Matter (PM)
Diesel particulate matter are the combination of soot and other solid and liquid phase materials that are
adsorbed on the surface. In general it can be said that about 60% of the particle matter is carbon and
ash and the remaining 40% is composed of soluble organic fractions. The formation process of the
particle matter is presented on Figure 0:6. In the first step injected fuel in the reaction of pyrolysis
undergoes thermal decomposition in the absence of oxygen. Created in this way acetylene is a
precursor for further formation of polycyclic aromatic hydrocarbons by first polymerisation and
cyclization. In the next step graphite-like sheets stack together building nuclei. In coalescence and

9
surface growth phase these particles increase their size through collisions with smaller molecules.
Through agglomeration primary particles build chain-like aggregates.
Figure 0:6. Schematic diagram of the steps in the soot formation process from gas phase to solid agglomerated particles [11]
At any step of the soot formation process, the obtained molecules can undergo oxidation when leaving
the fuel rich area and getting to the edges of the flame plume as presented on Figure 0:7. Depending
on the amount of oxygen soot can be converted into CO or CO2. In modern diesel engines over 90% of
created soot is oxidized before leaving combustion chamber. Soot oxidation process is strongly
temperature and mixing dependent. Glassman [10] stated that soot oxidation occurs in temperatures
above 1300 K. Oxidation rate increases with swirl number and higher injection pressure. Particle
formation is related to injected fuel mass, thus the highest concentrations are obtained at high loads.
Figure 0:7. Schematic plot of soot formation in a diesel flame [12]
1.4.3 Relation between NOX and PM formation
After summarizing information about both NOX and PM formation, the conclusion about the
conditions in which both emission simultaneously can be reduced is made. Figure 0:8 illustrates the
complexity of the problem. If setting the limits for emissions 1- upper limit (starting point) and 2-
lower limit (possible improvement) the improvement in three directions can be made according to
arrows A, B, C.
Arrow A indicates simultaneous reduction in soot and NOX which can be achieved by exhaust-gas
recirculation (EGR) and increase of injection-pressure. The usage of EGR substitutes charge air with
inert exhaust gas. However, the emission of CO and HC will increase as there is less oxygen available
for complete combustion, which also leads to increase in fuel consumption.
On the other hand, the B arrow indicates the direction for increase in soot and simultaneous decrease
in NOX emissions. It comes as a result of ignition retardation, reduction of injection-pressure,
10
reduction of oxygen concentration and the Miller process. The soot formation is increased because of
locally fuel rich zones with λ<<1. In the Miller process the effective compression stroke can be made
shorter by modifying the intake valve timing. As a result, the pressure and temperature in the cylinders
is lower when engine output and boost pressure are kept constant. The main drawback is the need of
increased boost pressures for a constant engine output. This compromises the turbo charging system,
requiring a higher performance from it.
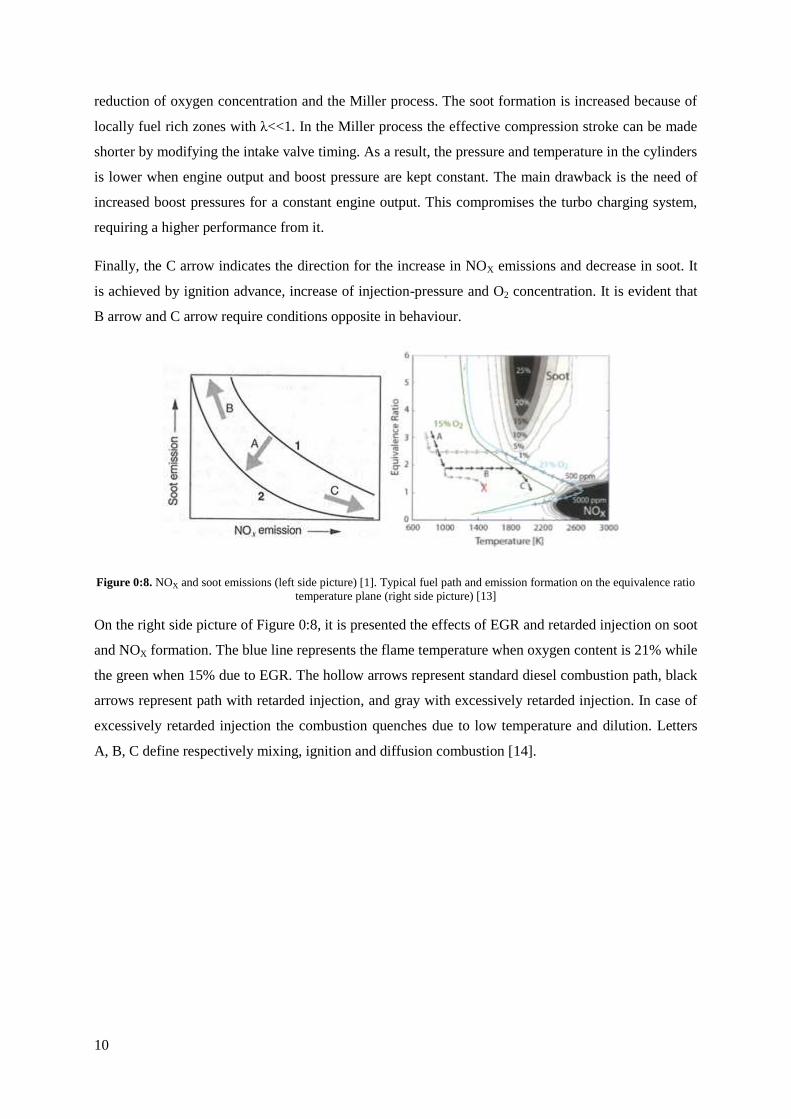
Finally, the C arrow indicates the direction for the increase in NOX emissions and decrease in soot. It
is achieved by ignition advance, increase of injection-pressure and O2 concentration. It is evident that
B arrow and C arrow require conditions opposite in behaviour.
Figure 0:8. NOX and soot emissions (left side picture) [1]. Typical fuel path and emission formation on the equivalence ratio
temperature plane (right side picture) [13]
On the right side picture of Figure 0:8, it is presented the effects of EGR and retarded injection on soot
and NOX formation. The blue line represents the flame temperature when oxygen content is 21% while
the green when 15% due to EGR. The hollow arrows represent standard diesel combustion path, black
arrows represent path with retarded injection, and gray with excessively retarded injection. In case of
excessively retarded injection the combustion quenches due to low temperature and dilution. Letters
A, B, C define respectively mixing, ignition and diffusion combustion [14].

11
Chapter
2 Heat Transfer
2.1 Heat transfer in the internal combustion engine
In case of internal combustion engine, two aspects of heat transfer can be considered. The first is in-
cylinder heat transfer – heat, originating from combustion products, which spreads in the chamber by
convection and radiation. The second is the heat transfer from the combustion chamber, which spreads
through the walls by conduction, aided by the cooling fluids - oil and cooling liquid. In every cycle,
all mechanisms of heat transfer are present. Engine efficiency and power output are strongly
dependent on the amount of heat transferred through the combustion chamber walls. The heat fluxes to
the chamber walls can reach up to 10 MW/m2 during combustion [15].
2.2 Heat transfer
2.2.1 Convection
Convective heat transfer is present when heat is transported through fluids in motion or between a
fluid and a solid surface in relative motion. There are two energy transfer mechanisms; one is driven
by random molecular motion called diffusion and the second by the macroscopic motion of the bulk in
the fluid. The fluid motion can be naturally induced or forced and is caused by the collective molecule
movements due to the presence of a temperature gradient. Natural convection is induced by buoyancy
forces and thermal expansion. In contrast, forced convection is caused by external forces, such as
pumps or fans, modifying the convection directions [16]. The resultant heat transfer is an effect from
both simultaneous bulk motions and random molecular movements. However, the contribution of
diffusion motions dominates near the surface where the fluid velocities are low.
The heat transferred by convection can be described by the Newton’s law of cooling (5):
�̇� = ℎ ∙ 𝐴 ∙ (𝑇1 − 𝑇2) (5)
Where: �̇� is the convective heat transfer rate, h is the convection heat transfer coefficient, A is the
surface area of the heat transfer. When the heat is transferred to a solid surface, 𝑇1 is the temperature
of the fluid and 𝑇2 is the temperature of the surface.

12
The heat transfer coefficient depends on physical properties of the fluid such as dynamic viscosity (μ),
density (ρ), specific heat capacity (𝑐𝑝), thermal conductivity (k) and flow characteristics. Whether it is
flow over a plate or through a pipe, the expression is presented in equation (6):
(h∙L
k) = constant ∙ (
ρ∙v∙L
μ)
m∙ (
cp∙μ
k)
n (6)
Where: L is the characteristic length and v is the characteristic velocity. Extensive tests have shown
that the values m=0.78 and n=0.33 for the exponents known from the turbulent pipe flow are valid for
combustion engines [15].
2.2.2 Conduction
Conductive heat transfer is a molecular activity in which more energetic molecules transfer the energy
to less energetic through collisions (the direct contact of molecules must take place). In solid materials
the heat is transferred through the lattice vibration. The expression that describes this phenomenon is
given by the Fourier’s law in equation (7).
�̇� =𝑘 ∙ 𝐴∙(𝑇1−𝑇2)
𝐿 (7)
Where: �̇� is the heat-transfer rate, k is the thermal conductivity of the material, A is the surface area of
the heat transfer, L is the wall thickness, T1 is the temperature of the hotter side of the wall and T2 is
the temperature of the colder side of wall [16].
2.2.3 Radiation
Thermal radiation is energy emitted from the matter in form of electromagnetic waves (photons). It
originates from the changes in the electron configurations of constituent atoms or molecules. The
typical wavelength where radiation takes place is in the range of 0.1-100μm [15]. Emissive power Eb
is the rate at which energy is released from the surface, per unit surface area W/m2. The upper limit of
the emissive power from the ideal radiator called black body (the body which absorbs all incoming
radiation and reflects none of them) is defined by the Stefan-Boltzmann law in equation (8) [16].
𝐸𝑏 = 𝜎𝑇𝑠4 (8)
Where 𝑇𝑠 is the absolute temperature of the surface in K, and 𝜎 is the Stefan-Boltzmann constant
(𝜎 = 5.67𝑥10−8 𝑊/𝑚2 ∙ 𝐾4).
The real surfaces however absorb less radiation than the perfect black bodies as some of the incoming
radiation is reflected. The reflectivity is dependent on material and finishing of the surface. For
example a smooth polished surface will reflect more radiation than another with small cavities. The
ratio between the emissive power of real body (E) and the corresponding black body ( 𝐸𝑏 ) is

13
denominated emissivity (𝜀) of the surface (9). 𝜀 ranges in values that go from 0 for black bodies and 1
for white bodies.
𝜀 =𝐸
𝐸𝑏 (9)
The heat absorbed by a non-black body in an enclosure at constant temperature (𝑇∞) can be calculated
using equation (10).
𝐸 = 𝜀 ∙ 𝜎 ∙ 𝐴 ∙ 𝑇∞4 (10)
The heat radiated to the same black enclosure is (11):
𝐸 = 𝜀 ∙ 𝜎 ∙ 𝐴 ∙ 𝑇𝑤4 (11)
Where 𝑇𝑤 is the wall temperature at the combustion side.
It is then possible to express the net radiation heat exchange �̇� between a surface and a black body in
an enclosure by equation (12).
�̇� = 𝜀 ∙ 𝜎 ∙ 𝐴 ∙ (𝑇𝑤4 − 𝑇∞
4 ) (12)
The additional effect of radiation into calculations increases the level of complexity and time when
modelling in multi-dimension. For this reason, radiant heat transfer is often omitted in multi-
dimensional heat transfer analysis of IC engine cylinders [15].
When accounting for the heat flux events that an object experiences, some properties should be named.
Reflectance is the amount of flux reflected by a surface, denoted by 𝜌 in a normalized value.
Transmittance is the amount of flux transmitted by a surface, denoted by 𝜏 in a normalized value.
Equation (13) shows the relation by conservation of energy between the aforementioned terms and to
the amount that is neither reflected nor transmitted denominated absorption 𝛼 [17]:
𝜌 + 𝜏 + 𝛼 = 1 (13)
Kirchhoff’s radiation law stipulates that the flux emitted by a hot object must be equal to the amount
absorbed by it; therefore the emission of an object ε must be equal to α [17].
2.3 Heat losses from the combustion chambers
2.3.1 Heat transfer breakdown
The heat transfer in an Internal Combustion (IC) engine is directed from the combustion chamber into
engine components. The cooling system supported by lubrication system is responsible for removing
the excess heat from the engine. Significant amount of heat is also removed with exhaust gases.

14
Figure 2:1. Breakdown of efficiency in the engine.
From theoretical calculations it is known that up to 40-45% of fuel energy is converted into useful
work as shown in Figure 2:1. 25-30% of remaining energy in form of heat is transferred through the
combustion chamber walls to the coolant. The next 25-30% of heat energy leaves the chamber with
hot exhaust gases. Finally, 5% is used to overcome friction losses. If using a waste heat recovery
system up to 10% of exhaust energy which represents 2.5% of fuel energy can be recovered and
converted into work.
Figure 2:2. Heat transferred to the piston and the liner [18].
From the combustion chamber the heat is transferred through the piston, liner and cylinder head as
presented in Figure 2:2. It was discussed previously that the heat losses to coolants are of about 25-
30%. Then if this amount is taken as 100% of heat losses from the combustion chamber, it can be
estimated that 50% of this heat will be transferred through the piston. From the remaining losses, 40%
will be transferred through the cylinder head and 10% through the liner.

15
2.3.2 Model of the heat transfer from the combustion chamber
The simplest way of modelling heat losses from the combustion chamber is to assume that the heat
transfer takes place through the single dimensional wall. Hot combustion gases in the chamber transfer
the heat to the wall by thermal convection. Further, the heat is transported through the wall (or
multilayer wall) by thermal conduction due to the temperature gradient between the combustion gas
and the coolant side. Finally, the heat is removed convectively from the wall by the cooling oil or
liquid. The heat transfer mechanism is shown schematically in Figure 2:3. When approaching the wall,
the heat is removed rapidly from the gas due to the high thermal diffusivity of the material. By
application of thermal barrier coating the heat diffusivity might be decreased and thus the wall
temperature increased. A higher wall temperature would reduce the heat flux, as T from the gas
temperature to the wall in Newton’s expression (5) would be lower.
Figure 2:3. Schematic heat transfer in the piston with insulation [15].

16
Chapter
3 Purpose of a Thermal Barrier Coating
3.1 Insulation concept
Thermal Barrier Coatings (TBC’s) are refractory-oxide ceramic coatings usually applied to metallic
surfaces with the purpose of protecting the components against high temperature conditions. By
insulating the components from high heat loads, the coatings allow higher operating temperature of the
device, protecting at the same time the structural components and extending its life time. In some
applications the operating fluid temperature can exceed melting point temperature of the component
material if the part is protected with TBC. Protection is however not the only purpose of TBC
application, the physical properties of the TBC material like low thermal conductivity and heat
capacity make it a suitable candidate for insulation with aim of decreased heat losses from the process.
In the industry, thermal barrier coatings are commonly used in gas turbines and jet engines to protect
the turbine components. In automotive, they are used in exhaust system components, turbochargers or
combustion chambers to decrease the heat losses [19] [20].
3.2 Structure of TBC
In order to ensure a good performance of a TBC in different applications the different types of ceramic
materials are used. A structure of a coating however is quite similar for all applications. The typical
TBC is built of several material layers where each has a different function. There are three main layers
in a TBC. The first is the top coat which is a ceramic layer. Depending on the working condition and
temperature profile different thickness of the top coat is used. Under it a thin metallic alloy layer of
bond coat is imposed. The main functions of this layer are contact improvement between substrate and
top coat, reduction in thermal expansion differences and protection from oxidation. Substrate is
assumed to be the third part of the TBC as all materials have to be matched by their physical
properties to create robust TBC. Over time during service, the fourth, additional layer of thermal
growth oxides (TGO) occurs between the top and bond coat.
3.3 TBC for turbine engines applications
In the gas-turbine engines (Carnot engines) used to propel aircraft or to generate electricity the
efficiency and power are directly related to the gas temperature entering the turbine section.
Application of ceramic TBC in the hottest part of the gas turbine enables a modern engine to operate at
significantly higher gas temperature than its predecessors. TBC’s made of refractory oxide ceramic,
typically ~7% YSZ, insulate the metallic and superalloy parts of engine like combustor, stationary

17
guide vanes, rotating blades, blade outer air-seals, shrouds and afterburners. In Figure 3:1 it is seen the
TBC’s coated on rotating blades. In the protective system that the TBC and underlying parts conform,
the temperatures managed are often higher than the underlying parts and therefore any failure in the
TBC to withstand the conditions can lead to the engine damage. TBC’s also must comply with
superalloy parts to minimize thermal expansion mismatch stress during heating and cooling and reflect
the radiant heat from the hot gas. Jet engine coatings have to withstand thousands of hours under
numerous cycles given by the temperature gradient between room temperature and ~1300 °C, while
coatings in power generating engines have to withstand ten thousands of hours with much less cycles.
Typically used TBC’s consist of a thick ceramic top coat and a thin metallic bond coat. The metallic
bond coat brings oxidation protection for the underlying superalloy part. In service as a result of bond
coat oxidation additional layer of TGO forms below the top coat (α-Al2O3). Ongoing research on TBC
for turbine engines are focused on further increase of engine efficiency (increase of gas temperature),
life time, durability and trust-to-weight ratio (jet engines). Reducing the TBC thickness while keeping
the durability, contributes to lower engine weight and improved performance. The TBC’s temperature
stability is also crucial as temperatures during turbine operations can surpass the material sintering
temperature resulting in increased thermal conductivity.
Figure 3:1. Thermal Barrier Coatings (TBC) slow heat transfer and insulate the substrate [21].
There are many similarities in the requirements for TBC material for turbine components and
automotive parts, such as resistance to fatigue, creep or resistance to high temperatures [22] [23] [24]
[25] [26] [27]. Despite similarities, there are specific requirements for TBC materials in the diesel
combustion chamber which are discussed in the next chapter.
3.4 State of the art in the field of TBC in the diesel engine
3.4.1 Temperature swing heat insulation
The large interest in studying the concept of adiabatic insulation in internal combustion engines was
noticed during 1980s. The goal was to reduce heat flow from the working gas to the combustion

18
chamber wall by using materials with low heat conductivity and high heat capacity. Saved energy in
the combustion chamber could be recovered from the exhaust gas. Many studies were made in which a
thick ceramic coating was applied on the piston surface or a ceramic insert was mounted in the piston
bowl or even the whole piston crown was manufactured from ceramic material.
Nevertheless, performed studies uncovered several drawbacks of the insulation concept. Elevated
combustion chamber temperature resulted in a slower combustion process and thus increased fuel
consumption. Simultaneously higher NOX emission was noticed. The hot walls of the combustion
chamber negatively influenced engine volumetric efficiency through less efficient refilling of the
combustion chamber with the fresh charged air during intake stroke. The durability and reliability of
the heat insulation coating was not as well good enough to withstand the engine life time under
working conditions. In contrast to the requirements discussed for turbine components it was seen after
the studies that the diesel engines were needed to counterbalance the rapid changes in temperature and
the presence of contaminants.
Some experiments on gasoline and diesel engines showed, however an improvement in thermal
efficiency. Similar results were suggested from the simulations. The most promising results were
obtained for thin, low heat conductivity and low heat capacity coatings. This concept of thin, fast
responding TBC was recently recalled in SAE publication by Toyota Motor Company and is shortly
described below.
Figure 3:2 shows a diesel combustion chamber wall temperature during operation cycle for three
different wall materials. The first line is commonly used materials like steel or aluminium (blue line),
the second is traditional thick insulation (purple line) and the third is thin “Temperature Swing”
insulation (red line). The combustion gas temperature over the cycle is marked by the black line.
It can be observed that while the gas temperature increases rapidly having its maximum above
2000 °C, the wall temperature remains almost constant at 300 °C during the whole cycle for common
materials. This transient boundary condition results in cyclic variations at the surfaces and gives rise to
periodic temperature waves that propagate into the wall [28]. The traditional insulations allow
obtaining higher wall temperature in a range of 800 °C however this temperature remains constant
during the whole cycle and thus negatively influence volumetric efficiency. Thin “Temperature
Swing” insulation however to some extent follows the gas temperature, reducing heat losses without
deteriorating the engine breathing system.

19
Figure 3:2. Combustion gas and combustion chamber wall temperature profiles [29]
The air-fuel mixture during the combustion stroke experiences a rapid increase of temperature (red
line). When the gas becomes hot in the chamber, it transfers heat energy to the wall. Due to high heat
conductivity and large heat capacity of the common materials, the wall temperature is substantially
lower and the ΔT is high, enabling fast heat transfer from the chamber. On the contrary, during the
intake stroke the air enters to the chamber with a lower temperature (blue line) but is heated in small
amount at the regions approaching the wall. The wall temperature has much less variation throughout
the thermodynamic cycle if compared to the gas temperature. A schematic representation can be seen
in Figure 3:3.
Figure 3:3. Combustion gas and common material wall temperature profiles [29]
The effect of traditional insulation on the wall temperature can be seen in Figure 3:4. The smaller
temperature difference is caused due to a low heat conduction of the insulation material and thus high
average wall temperature along the thermodynamic cycle. Furthermore inside the insulation coat a big
temperature gradient can be observed. This results in lower heat losses to the cooling water. The major
drawback however, is seen during the intake stroke since the hot inner wall raises the charged air
temperature. This reduces the volumetric efficiency of the engine since a hotter air occupies more
volume than colder and thus less air is available for combustion.

20
Figure 3:4. Combustion gas and traditionally insulated wall temperature profiles [29]
Figure 3:5 presents the case for the “Temperature Swing” type of insulations. It is a thin layer of
insulation characterised by the low heat conductivity and low heat capacity. Due to the low thermal
conductivity and low heat capacity the inner surface temperature can quickly follow the gas. Small
amount of heat energy makes rapid temperature increase, while low conductivity does not allow for
deeper penetration into the wall. As only inner surface has very high temperature and low amount of
heat energy is accumulated in the wall, rapid heat release back into the combustion chamber is
possible during the exhaust stroke. In this way fast surface temperature changes are possible and the
volumetric efficiency should not be deteriorated. As a result, the interface between gas and insulation
will have a low temperature gradient throughout the whole thermodynamic cycle, so a low heat flux
will be transferred from the gas.
Figure 3:5. Combustion gas and “Temperature Swing” insulated wall temperature profiles [29]
The extreme case would be seen at ideal conditions under truly adiabatic engine operation, in which
the coating possessed zero conductivity and zero thermal capacity. The gas-side surface temperature
would exactly follow the gas temperature. Such combination is not possible to be obtained by current
materials. In the theoretical simulations, however the parameters of heat capacity and heat conduction
coefficient can be set, and the optimal thickness of “Temperature Swing” insulation for certain engine

21
operating condition can be obtained. Results show that too thin coatings would have too low insulation
capacity. Too thick coatings would have a high steady state surface temperature, being the cause of
volumetric efficiency drop.
3.4.2 Influence of optical properties of TBC
Most of the ceramic materials in the pure state are classified as electrical insulators. The characteristic
feature of insulators is the large energy gap (>3eV) between the valence and conduction bands
according to band gap theory. Valence electrons of insulators fill fully the valence band, leaving the
conduction band almost completely empty. This makes the material’s electrical conduction close to
zero. However, if the electromagnetic radiation wave strikes the ceramic molecule it can be absorbed,
transmitted or reflected. If the band gap is larger or smaller than light (radiation energy) then the
material allows free pass of light without any interaction and the material is called to be transparent. If
the structure of the material is imperfect and in some way it interacts with the passing waves (scatters
or reflects some radiation) the material is called translucent. If the material is neither translucent nor
transparent and light does not go through then the material is called opaque. This happens when the
band gap is in the same range as the phonons in the visible light and does not go through the material
but rather absorbs, scatters or reflects all of it.
In experiments from Wahiduzzaman and Morel [30] [31] it was proved that thick (though <1.5 mm)
zirconia-based ceramics are optically opaque, but thin ceramics are partially transparent to thermal
radiation in wavelengths between 0.5 and 5.0 µm distinctive of diesel combustion. 30% transmittance
was observed for 1 mm thickness and 40% for 0.5 mm, in a wavelength of 2.5 µm. Such translucency
can worsen the effectiveness of the heat barrier coatings under realistic diesel engine conditions.
In diesel combustion, created soot has a significant impact on the radiative heat transfer from the
engine. Soot particles make the flame luminous and opaque. It is estimated that radiation from soot is
about 5 times the radiation from gaseous combustion products [32]. When soot accumulates on
combustion chamber walls it can change the temperature distribution and influence the heat flux
through the TBC material on the wall.
Different studies suggest different mechanisms of how the radiation during engine combustion raises
the heat flux from the chamber. Borman suggested that the radiation will not increase the wall
temperature but will cause a “deep heating” of the transparent ceramics. Siegel et. al. [33] stated that
the radiation is absorbed by external metal surface under the TBC coating as coating is translucent for
thermal radiation.
Subsequently Mendera [34] stated that the YSZ ceramic layer is an effective heat barrier for
convective heat transfer, however it is no longer effective for combined heat transfer with a large
radiant component. Due to YSZ translucency, heat in form of radiation penetrates the coating and

22
increases the temperature at the ceramic/metal interface. It was found that this effect is even raised
when the surface is covered with soot deposit. Soot absorbs almost all incident radiation from diesel
combustion and further reradiates it through the translucent ceramic, heating the metal surface
beneath. This phenomenon is referred as greenhouse effect because the transmission of radiant energy
through the ceramic barrier and subsequent “trapping” by the ceramic layer causes an increase of
TBC/metal interface temperature in comparison to an uninsulated surface.
3.5 Conclusions
Summarizing the literature study in the field of TBC application in diesel engine it can be concluded
that there is no consistent opinion about the coating’s influence on heat losses from the combustion
chamber. Because of that in the present master thesis it was decided to perform basic engine test with
the TBC coated pistons to verify numerous phenomena described in literature. The thesis focuses as
well on the material properties of coatings along with the durability at test conditions and other
thermodynamic factors.

23
Chapter
4 Types of Coatings Materials
4.1 Properties of a TBC
Heat capacity, thermal conductivity and thermal expansion are the three main thermophysical
parameters of interest in a TBC.
Heat capacity c is the energy required to raise the temperature of a material by one degree. Three
parameters determine the heat capacity of a material: the vibrational and rotational energies of the
atoms, the change in energy levels of electrons in the structure and the changes in atomic positions
with reorientations. In Figure 4:1 the response of the heat capacity of several polycrystalline ceramics
is plotted in a function of temperature. Heat capacity of porous materials has a different response in
comparison to non-porous of the same composition. The main reason is that the porous material
contains less solid material per unit volume and can be heated or cooled much more rapidly than its
non-porous counterpart. As explained in the previous chapter, the desired parameter of the temperature
swing insulation is a low heat capacity.
The heat capacity of most systems is not constant but depends on temperature, pressure and volume.
Two parameters are often calculated, heat capacity at constant pressure or at constant volume (mostly
for gases and liquids). Change of internal energy with the change of temperature at constant volume is
called - CV, while change of internal energy with the change of temperature at constant pressure is
called - CP [35].
Figure 4:1. Several polycrystalline ceramics of the heat capacity as a function of temperature [36].

24
Thermal conductivity k is the rate of heat flow through a material. The units are W/(m∙K). The amount
of heat is controlled by the amount of energy present, the heat carrier in the material and the amount of
dissipation. The heat present is a function of the volumetric heat capacity (C). The carriers units are
electrons or phonons (quantized lattice vibrations). The amount of dissipation is related to the
attenuation distance for the lattice waves or mean free path. Thermal conductivity will decrease if the
heat capacity (C), the velocity of the carrier (v) and the mean free path (𝜆) are decreased too, given by
the following proportionality: 𝑘 ∝ 𝐶 ∙ 𝑣 ∙ 𝜆 [36].
Thermal conductivity in ceramics is found within many values. It is wrong to assume that all kinds of
ceramics are less conductive than metals. Figure 4:2 presents thermal conductivity in function of
temperature. It is shown that the thermal conductivity of ceramics can have similar values to some
metallic and organic materials. The primary carriers of thermal energy in ceramics are photons and
phonons. The highest conductivities are observed in compact highly organized structures and
decreased by the introduction of foreign atoms i. e. single element structures, structures of similar
atomic weight or without extraneous atoms in solid solution [36].
Figure 4:2. Thermal conductivity of different metallic, ceramics and organic materials along a variation in temperature [36].

25
In crystalline ceramics the lattice vibrations are the primary mean of heat conduction. The mean free
path 𝜆 is inversely proportional to the temperature; which means that the thermal conductivity
increases when the temperature decreases. For glasses on the other hand, the structure is more
disordered and 𝜆 is much less dependent on the temperature increase. Therefore, the temperature has
an opposite effect as on the crystalline ceramics. Heat capacity has a greater participation and thermal
conductivity typically increases with a temperature raise [36].
The effect of thermal radiation influences the heat transfer and increases it at elevated temperatures.
Klemens and Gell [37] estimated that 75% of the radiation occurs at frequencies higher than 3.1 kT/h
and at 1300 K it is emitted 8.1x10¹³
Hz. Furthermore, it has been investigated the influence on
inclusions and porosity on the absorption of radiation. Point defects and oxygen vacancies reduce the
lattice thermal conductivity by scattering high-frequency lattice waves. When studied the contrast in
the index of refraction, porosity presented better results than inclusion size due to its relative easiness
in implementation of the desired size. The frequency varies inversely with pore radius R and below the
critical frequency scattering becomes negligible. They concluded that in order to scatter 8.1x10¹³
Hz,
for a spherical pore, the radius has to be of at least 0.45 µm for porosity of 12%. There might be
additional porosity in a nanometre scale grain structure which also impacts the thermal conductivity;
however it does not affect the radiative component [37].
The desired properties in thermal barrier coatings of ceramics are low thermal conductivity and low
heat capacity in regards of thermophysical properties. Good cohesion to the substrate material as well
as high temperature stability and oxidation resistance is needed.
4.2 Types of coatings
Coatings are covering layers applied to a surface, in order to protect the underlying material. Although
the intention of the present chapter is to explain more in detail the ceramic coatings, other coatings are
discussed as well. Metals, polymers, aerogels and finally ceramics as coatings will be mentioned. All
of them share certain properties, but each type has also its application limitations due to characteristic
material properties.
4.2.1 Metals
Metals are solid materials typically possessing good electrical and thermal conductivity. Atoms of
metallic substances are closely packed. In some cases their structure is temperature dependent. Atoms
of metals easily release its outer shell electrons, resulting in free electron flow. This is a characteristic
feature of metals which is responsible for good electric and heat is transfer. The solid structure of the
metal will have a metallic-type bond between atoms.
Metal coatings are used in very diverse application areas that include construction, transport, consumer
goods and electrical appliances. The greatest benefits obtained from them are corrosion protection of
26
the substrate material, temperature protection, chemical protection, increase of surface hardness,
increase of durability and decrease of friction [38]. Metals have typically high thermal conductivity
which is based on the large number of free electrons and a large mean free path for them. Due to good
conductivity, metals rarely act as thermal barrier coatings and cannot be considered for the same
applications as ceramics for this purpose.
When it comes to applying them to coat steel surfaces, four commonly used methods can be
distinguished: hot-dip galvanizing, metal spraying, electrochemical deposition and sherardizing.
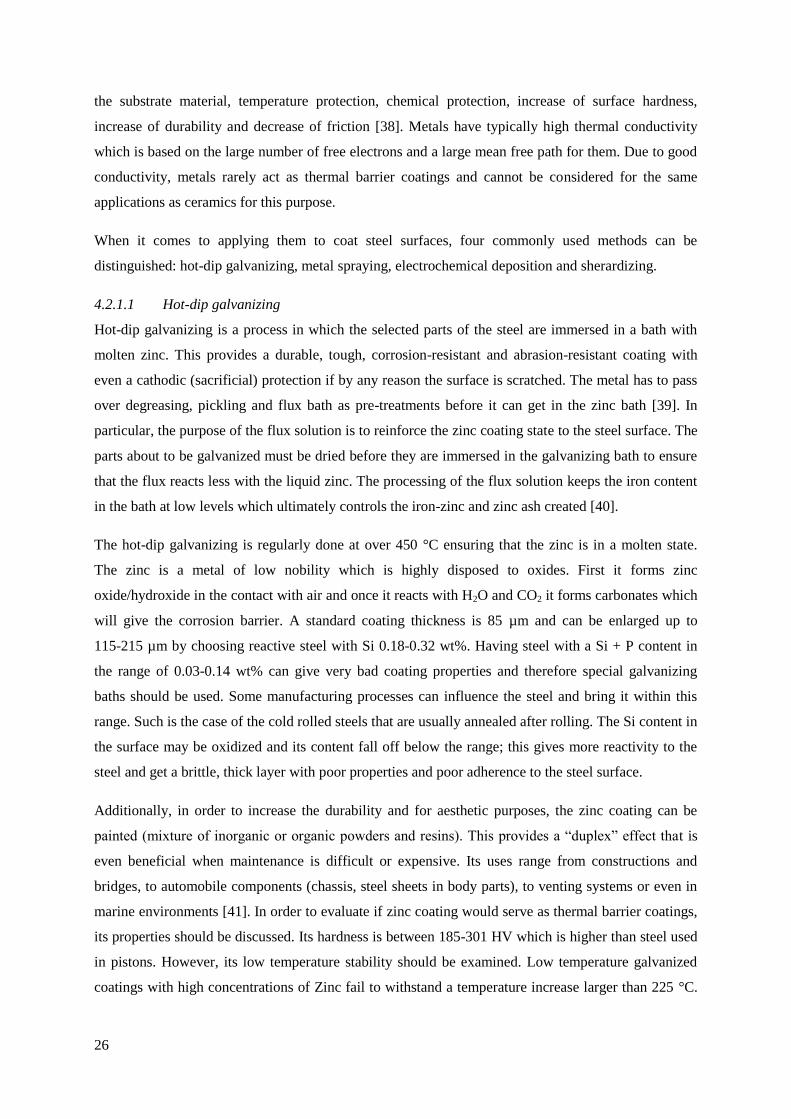
4.2.1.1 Hot-dip galvanizing
Hot-dip galvanizing is a process in which the selected parts of the steel are immersed in a bath with
molten zinc. This provides a durable, tough, corrosion-resistant and abrasion-resistant coating with
even a cathodic (sacrificial) protection if by any reason the surface is scratched. The metal has to pass
over degreasing, pickling and flux bath as pre-treatments before it can get in the zinc bath [39]. In
particular, the purpose of the flux solution is to reinforce the zinc coating state to the steel surface. The
parts about to be galvanized must be dried before they are immersed in the galvanizing bath to ensure
that the flux reacts less with the liquid zinc. The processing of the flux solution keeps the iron content
in the bath at low levels which ultimately controls the iron-zinc and zinc ash created [40].
The hot-dip galvanizing is regularly done at over 450 °C ensuring that the zinc is in a molten state.
The zinc is a metal of low nobility which is highly disposed to oxides. First it forms zinc
oxide/hydroxide in the contact with air and once it reacts with H2O and CO2 it forms carbonates which
will give the corrosion barrier. A standard coating thickness is 85 µm and can be enlarged up to
115-215 µm by choosing reactive steel with Si 0.18-0.32 wt%. Having steel with a Si + P content in
the range of 0.03-0.14 wt% can give very bad coating properties and therefore special galvanizing
baths should be used. Some manufacturing processes can influence the steel and bring it within this
range. Such is the case of the cold rolled steels that are usually annealed after rolling. The Si content in
the surface may be oxidized and its content fall off below the range; this gives more reactivity to the
steel and get a brittle, thick layer with poor properties and poor adherence to the steel surface.
Additionally, in order to increase the durability and for aesthetic purposes, the zinc coating can be
painted (mixture of inorganic or organic powders and resins). This provides a “duplex” effect that is
even beneficial when maintenance is difficult or expensive. Its uses range from constructions and
bridges, to automobile components (chassis, steel sheets in body parts), to venting systems or even in
marine environments [41]. In order to evaluate if zinc coating would serve as thermal barrier coatings,
its properties should be discussed. Its hardness is between 185-301 HV which is higher than steel used
in pistons. However, its low temperature stability should be examined. Low temperature galvanized
coatings with high concentrations of Zinc fail to withstand a temperature increase larger than 225 °C.

27
Exposure to extended periods of time at high temperatures causes solid phase transformations in the
coatings transforming to an intermetallic iron-zinc phase [41].
4.2.1.2 Metal spraying
Thermally sprayed coatings of zinc, aluminium and more recently zinc-aluminium alloys are a way to
increase the corrosion protection of the structural materials that later on will be subjected to aggressive
environments. While the aluminium acts as a barrier, the zinc acts as a sacrificial anode to the
structural component. Also, the thermally sprayed metal coating can be over-coated with paints to
form a “duplex” coating system. The combined action of the paint and the metal gives a higher
protection and adds aesthetic value to the structure. Common minimum thicknesses should be of
100 µm. The metal is molten by either a gas flame or an electric flame and is compressed and
projected towards the surface to be coated. While the gas flame is a more flexible process, the electric
flame brings improved adhesion to the steel substrates and good results on large flat areas. Some
applications can be seen on steel bridges [39].
4.2.1.3 Electrochemical deposition
Electrochemical deposition or electroplating is a process that makes use of an electrical current in a
liquid medium to generate metal cations that later on are going to be deposited on an electrode using
an electrolyte medium. It works under the principle of a galvanic cell acting in reverse in which the
rate of dissolution of the anode is equal to the rate at which the cathode is plated. Electrochemical
deposition can be used to change the surface properties of an object and modify its lubrication,
abrasion or wear resistance, etc. For example, in this way it is possible to have the electrochemical
deposition of a subnanometre film of Nickel (Ni) on top of Titanium Nitride (TiN). Additionally, the
lowering of H3BO3 contributes to the high particle densities of Ni [42]. It is even possible to change
the potential in a surface to passivate it and form a protection against oxidation.
4.2.1.4 Sherardizing
Sherardizing is a thermal diffusion process that allows for the coating of the metallic components with
zinc powder as it evaporates and diffuses into the target forming Zn-Fe phases. The coatings can be in
the range of 15 to 80 µm. The great benefits of the sherardized coating against other zinc finishes are
its great hardness and wear resistance, which gives its high capacity to withstand mechanical damage
without loss of performance. The alloying adhesion is such that the coating does not lift nor peel and
can only be removed by chemical or mechanical (shot blasting) processes. Common applications can
be seen in washers, bolts, nuts, springs, castings, etc [43].
4.2.2 Polymers
Polymers are substances composed of repeated monomers forming macromolecules that due to its
versatility can be coated in tough, flexible and adhesive films to protect surfaces [44]. As an example
it is presented in Figure 4:3 the polymerization of polyethylene from ethylene. Polyethylene is the

28
most common plastic produced nowadays. Polymers are attractive to the coating industry because of
the highly tailored production, cost-effectiveness and low thermal conductivities than can be achieved.
Their low conductivity is based on the covalent bonding, a large molecule size and lack of
crystallinity. By adding conductive filters such as metals or graphite the conductivity of solid
polymers can be increased, however other properties are also compromised [36]. Its implementation
can even extend to corrosion protection. Its application is distinguished in a broad range of
applications; from tanks, vessels and ducts to hopper cars, coal chutes, legs of oil platforms and even
packaging [45].
Figure 4:3. Polyethylene after polymerization of ethylene [70].
There have been researches on polymeric coatings that are able to repair autonomically and prevent
further corrosion of the underlying substrate. This mechanism aids against the contamination by
environmental conditions that continuously degrade the polymer. The coatings use a self-healing
chemistry, based on the di-n-butyltin dilaurate catalysed polycondensation of hydroxyl end-
functionalized polydimethylsiloxane (HOPDMS) and polydiethoxysiloxane (PDES), which meets this
important requirement [46]. The siloxane exhibits exceptional performance in the chemical stability
and passivating ability; however the mechanical strength is not so much a strong attribute. The self-
repairing ability of the coating is done when an external agent damages the surface of the catalyst
which is encapsulating the siloxanes. The siloxanes then react with healing droplets that are phase-
separated. The polymer is “healed” and its life is majorly extended by this mechanism [47].
4.2.3 Aerogels
In applications requiring high level of thermal insulation it has been considered the possibility of
including aerogels instead of conventional ceramic coatings for the same kind of applications.
Aerogels are synthetic porous ultra-light materials in which the liquid contained in the gel has been
replaced with a gas allowing them to have extremely low density and low thermal conductivity.
However when thinking to consider them for coating applications, several factors should be in
consideration:
A typical silica aerogel monolith has a density of around 0.1 g/cc and a thermal conductivity of around
10-20 mW/m-1
K-1
which is about two to three times more insulating per unit thickness than
polyurethane foam (PUF) or expanded polystyrene (Styrofoam). The limit in their utilization lies in
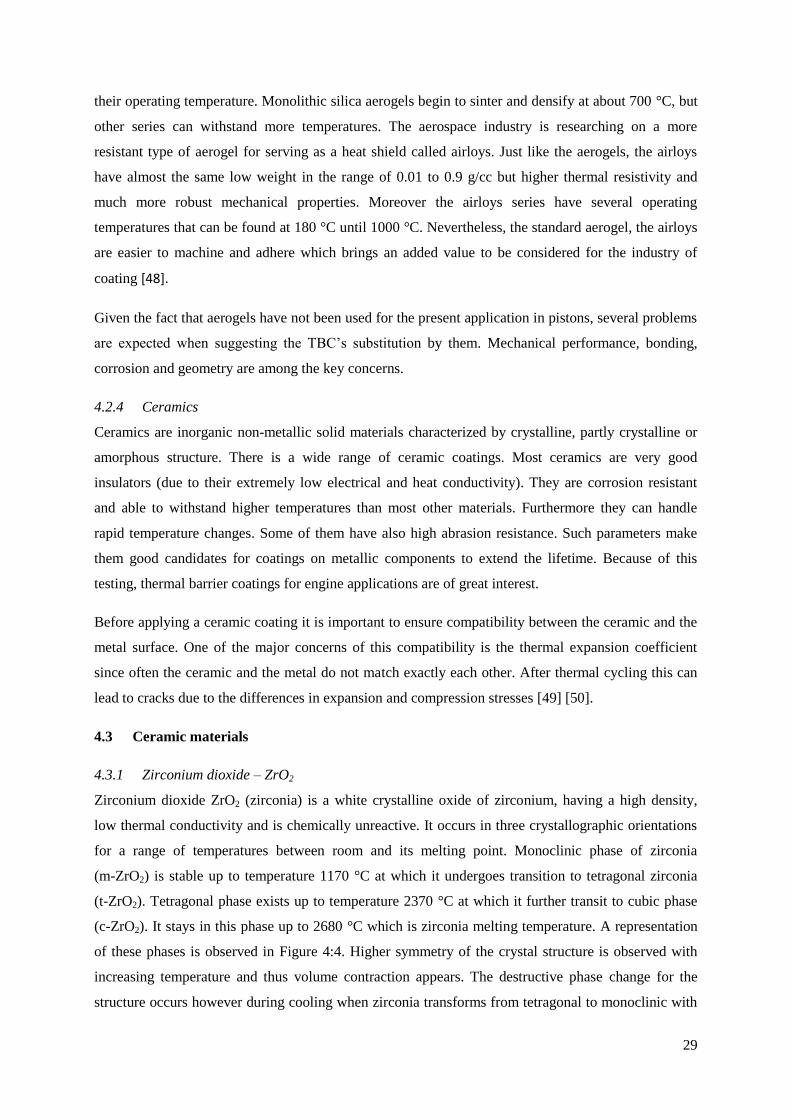
29
their operating temperature. Monolithic silica aerogels begin to sinter and densify at about 700 °C, but
other series can withstand more temperatures. The aerospace industry is researching on a more
resistant type of aerogel for serving as a heat shield called airloys. Just like the aerogels, the airloys
have almost the same low weight in the range of 0.01 to 0.9 g/cc but higher thermal resistivity and
much more robust mechanical properties. Moreover the airloys series have several operating
temperatures that can be found at 180 °C until 1000 °C. Nevertheless, the standard aerogel, the airloys
are easier to machine and adhere which brings an added value to be considered for the industry of
coating [48].
Given the fact that aerogels have not been used for the present application in pistons, several problems
are expected when suggesting the TBC’s substitution by them. Mechanical performance, bonding,
corrosion and geometry are among the key concerns.
4.2.4 Ceramics
Ceramics are inorganic non-metallic solid materials characterized by crystalline, partly crystalline or
amorphous structure. There is a wide range of ceramic coatings. Most ceramics are very good
insulators (due to their extremely low electrical and heat conductivity). They are corrosion resistant
and able to withstand higher temperatures than most other materials. Furthermore they can handle
rapid temperature changes. Some of them have also high abrasion resistance. Such parameters make
them good candidates for coatings on metallic components to extend the lifetime. Because of this
testing, thermal barrier coatings for engine applications are of great interest.
Before applying a ceramic coating it is important to ensure compatibility between the ceramic and the
metal surface. One of the major concerns of this compatibility is the thermal expansion coefficient
since often the ceramic and the metal do not match exactly each other. After thermal cycling this can
lead to cracks due to the differences in expansion and compression stresses [49] [50].
4.3 Ceramic materials
4.3.1 Zirconium dioxide – ZrO2
Zirconium dioxide ZrO2 (zirconia) is a white crystalline oxide of zirconium, having a high density,
low thermal conductivity and is chemically unreactive. It occurs in three crystallographic orientations
for a range of temperatures between room and its melting point. Monoclinic phase of zirconia
(m-ZrO2) is stable up to temperature 1170 °C at which it undergoes transition to tetragonal zirconia
(t-ZrO2). Tetragonal phase exists up to temperature 2370 °C at which it further transit to cubic phase
(c-ZrO2). It stays in this phase up to 2680 °C which is zirconia melting temperature. A representation
of these phases is observed in Figure 4:4. Higher symmetry of the crystal structure is observed with
increasing temperature and thus volume contraction appears. The destructive phase change for the
structure occurs however during cooling when zirconia transforms from tetragonal to monoclinic with

30
the volume increase of about 4 – 5%. This is the type of martensitic transition, similar to steel
hardening mechanism.
Figure 4:4. Cubic, tetragonal and monoclinic representations of ZrO2 [49] [50].
The cubic structure can be preserved by doping and stabilizing the high temperature phases
(tetragonal, cubic or a mixture of both) of zirconia down to room temperature. By using an appropriate
dopant, a number of oxygen vacancies are created in the zirconia lattice and compensated with the
dopant cations in between. For the yttria-stabilized zirconia (ZrO2-Y2O3), every charge-compensating
oxygen vacancy is generated every two substitutional Y atoms. There is a wide variety of oxide
dopants stabilizing zirconia i.e. MgO, CaO, Y2O3, Ce2O3, Yb2O3, Nd2O3, Gd2O3. The purity of the
stabilizing material is important as the presence of impurities decrease coatings durability. Figure 4:5
presents the ZrO2-Y2O3 phase diagram [51]. The phase diagram determines the required Y2O3 content
and sintering temperature for obtaining adequate fraction. According to it, the composition in which
concentration of Y2O3 is equal or higher than 8mol% it keeps its cubic phase down to room
temperature. Such a structure is called fully stabilized. Partially stabilized zirconia consists of
nanosized tetragonal or monoclinic particles which are precipitated out in a cubic matrix. Tetragonal
phase only structure (TZP) is obtained when zirconia is doped with 3 mol% Y2O3 – ZrO2. Non-
transformable-zirconia (t´-ZnO2) is commonly used to describe plasma sprayed zirconia stabilized
with yttria. The stabilized phase is created in the flame when yttria content is 1.5-6 mol% Y2O3 –
ZrO2.

31
Figure 4:5. Phase diagram of the ZrO2-Y2O3 system [51].
As dopants are introduced to create partially or fully stabilized structure, substituting Zr ions by other,
the lattice is strained and a higher interaction is seen in the local structure. Because of this higher
phonon dispersion will occur. The addition of two or more dopants to stabilize zirconia improves the
source of scattering phonons. The increase in dispersion causes a reduction in the free path of the
phonon scattering and their transport. Consequently the thermal conductivity k is reduced [52].
Stabilization of ZrO2 with 20 mol% Y2O3 is seen in applications of rocket nozzles and missile nose
cones due to its resistance to particle erosion [53].
4.3.2 Alumina – Al2O3
Aluminium oxide, often referred as alumina (Al2O3), is one of the most commonly applied ceramic
materials in the coating industry. Among its properties of interest are its high hardness, chemical
inertness, wear resistance and a melting point at 2072 °C [54]. Its service temperature can be up to
1650 °C. It can be alloyed with TiO2 to increase its toughness, however simultaneously hardness is
reduced [55]. These properties allow its use in many applications. Alumina is utilized in heavy-duty
forming tools, resistor cores in electronic industry, tiles for wear protection and ballistics, thread
guides in textile engineering and even in protection tubes in thermal processes [56].
4.3.3 Chromia – Cr2O3
Chromium(III) oxide or chromia (Cr2O3) is a hard, wear resistant and chemically inert coating that has
a service temperature up to 540 °C. It is applied for making hard, wear and corrosion resistant coatings
for aggressive environments. Furthermore, it can be alloyed with SiO2 and TiO2 to prevent grain

32
loosening and enhance the resistance of the coating. Its typical uses are in air and gas cylinders
internals, mechanical seal applications and textile machinery parts [55].
4.3.4 Lanthanum – La
Lanthanum Strontium Manganite (LSM - (La0.8Sr0.2)0.98MnO3) is widely used for YSZ electrolyte-
based Solid Oxide Fuel cells. Its coefficient of thermal expansion is similar to that of doped zirconia
and has a service temperature up to 1500 °C. Its main uses are in the limitation on the evaporation of
chromite-based SOFC interconnectors, for catalysts and sensors [55].
4.3.5 Titanium dioxide – TiO2
Titanium dioxide (TiO2) is the naturally occurring oxide of titanium. It creates dense, smooth and
relatively ductile oxide ceramic coatings. Due to its electric conductivity, it can be applied as a
conductive coating. It is utilized on architectural and automotive glass. It is also possible to produce
either dense, hard coatings or more porous thick coatings by adjusting the spray parameters creating
neither cracking nor delamination. If Cr2O3 is added it provides hardness and enhancement of abrasion
wear and corrosion resistance for the coatings. The applications for such coatings include drum doctor
blades and machine tool chip breakers [55].
4.4 Coating methods
Coating process can be performed by many different techniques and a direct outcome is the range of
different thicknesses that can be achieved with each of them. The minimum thicknesses are achieved
by Physical Vapour Deposition (PVD), Chemical Vapour Deposition (CVD) and Ion Implantation as
illustrated in Figure 4:6. It follows in order the Chemically Formed Processes (CFP) and other
techniques e.g. High Velocity Oxy-Fuel (HVOF), Plasma and Flame Spraying and Plasma Transferred
Arc (PTA). Finally it is included Weld Over-Laying and Laser Cladding which are used for the
thickest coatings [57]. Further on in section 5.3 it is explained much more in detail the most desire
methods for the TBC applications.

33
Figure 4:6. Range of coating thicknesses for different methods [53].
4.4.1 Thermal spraying (TS)
Thermal spray techniques are processes in which powders heated to melting temperature are directed
in a fast flow towards the desired surface, and deposited on it. Electrical arc or thermal plasma is used
as a source of heat. Materials like metals, alloys, ceramics or plastics in a form of powder or wire can
be used. For the coating process to be effective the sprayed material cannot however decompose when
melted. Since the bonding of the coating to the substrate is mechanical the adhesion is dependent on
the cleanliness and pre-treatment of the substrate surface. The pre-treatment is often done by grit
blasting which aims to roughen the surface. There are many variants of thermal spraying methods like:
plasma spraying
− atmospheric plasma spray (APS) – used to obtain coating in this masterwork,
detonation spraying
wire arc spraying
flame spraying
high velocity oxy-fuel coating spraying (HVOF)
warm or cold spraying
APS is a method carried out in the atmospheric pressure. The high frequency strong electric arc is
ignited between an anode and a tungsten cathode. Gas flying through interelectrode space becomes
ionised and creates a plasma plume towards the substrate surface. The temperature in plasma can reach
6000-15000 °C. Powder material is fed in front of gas nozzle to the ionized plasma plume where it
melts and follows to the substrate surface. This process is shown schematically in Figure 4:7 [53].

34
Figure 4:7. Plasma spray in a schematic diagram [53].
The molten material which is deposited in the substrate surface has a lamellae pancake-like shape with
thicknesses in the micrometer range and lateral dimensions from several to hundreds of micrometers.
Solidification is a rapid process happening at rates of ~106
Ks-1
that determines the adherence of
adjacent disks between randomly stacked lamellae and their internal structure. The plasma-sprayed
coating may bring defects due to the combination of some factors like the powder feed rate, spraying
cross-head speed and spraying distance. Other defects may be related to the solidification processes
and their amount of splash when the droplets impinge the surface or by the incomplete melting of the
large particles in comparison to the small ones. These defects are presented as voids, inclusions and
poor adhesion of the lamellae [27]. A representation of this is seen in Figure 4:8. APS typically
produces TBC with laminar structures and high porosity up to 20% making it possible to have low
conductivity in the order below 1.5 W m−1 K−
1.
Figure 4:8. Building up a coating [58].
Spraying in a controlled atmosphere produces a thin, dense, oxide-free and very pure coating. The
method to achieve this is commonly known as controlled atmosphere plasma spray (ChamPro™) and
is applied in a chamber at near vacuum. Its usage is convenient in applications where full-coverage

35
coatings are needed. It is also capable of coating a wide range of materials including metals, ceramics
and cermets [53].
4.4.2 High velocity oxygen fuel spray - Liquid and Gas (HVOF)
There are methods using either liquids or gases to eject coating powder out of the nozzle. This method
produces thick, dense coatings with homogeneous structures and it is therefore a good solution for
machine parts. High Velocity Oxygen Liquid Fuel Spray (HVOF Liquid Fuel) uses an oxygen-
kerosene mixture that ignites and heats the powdered spray material as it exits the gun and deposits
tenaciously on the substrate material. On the other hand, the High Velocity Oxygen Gas Fuel (HVOF
Gas Fuel) can use for example propylene, propane or natural gas as a source for the mixture with the
oxygen. As a result of the high kinetic energy transferred to the particle in both processes, the coating
material does not need to be fully melted and consequently the particles will impact the workpiece
surface flattening plastically with a fine granular structure [53].
4.4.3 Physical vapour deposition (PVD)
The physical vapour deposition is a method used for depositing a thin film material by the
condensation of vaporised form onto various workpiece surfaces. There are several variants of PVD
method like:
cathode arc deposition,
electron beam physical vapour deposition,
evaporative deposition,
pulsed laser deposition,
sputter deposition.
Along with the plasma spray, the electron beam physical vapour deposition has become a popular
method of preparing thermal barrier coatings and therefore an extra attention will be taken to explain
it. One of the advantages of this method is a very high deposition rate.
The electron beam physical vapour deposition (EB-PVD) is a process in which an anode made of
coating material is bombarded by an electron beam created by a tungsten filament under high vacuum
conditions, causing vaporization of anode material. Later on, the vaporized atoms solidify, coating
everything in the vacuum chamber (within line-of-sight) with a thin layer of the anode material. The
line-of-sight is given by the pressure and source-to-substrate distance.
Three different arrangements can be differentiated from the effect of EB-PVD; the structures
denominated type 1, type 2 and type 3.
The type 1 is characterized by columns and inter-columnar gaps which are obtained by the rotation of
the parts during deposition and formed as the effect of vapour phase condensation and shadowing by

36
the curved column tips. This shadowing orients the columns wider in the direction parallel to the
rotation axis and narrower in the direction perpendicular to it. Therefore a great anisotropy is seen as
the effect of type 1. The type 2 globular and elongated spheroid type-like pores are also a consequence
of rotation. They are arranged in layers inward from the edge to the center of the columns parallel to
the individual column tip when their growth takes place. This type is thought of consisting purely of
closed porosity. The type 3 is often referred to as “feather arms” which is evident from Figure 4:9.
Due to shadowing reasons there is energetic favouring towards building facets of a column in {111}
planes. This will lead to show mostly opened porosity aligned under angles between 35-50° (often
45°) towards the main column axis.
To lower thermal conductivity, EB-PVD TBC’s rely mainly on type 2 and 3 intra-columnar porosity
while type 1 inter-columnar porosity is substantially less effective [59].
Figure 4:9. Morphology of EB-PVD P-YSZ TBC’s in polished (left) and fractured cross section (right) in as coated
condition [59].
It is the way in which the platelets are deposited on the substrate surface what gives the difference in
thermal conductivity between the two methods, the APS and the EB-PVD. On one hand the APS leads
to the pores between the splats to being oriented parallel to the substrate surface, exhibiting a thermal
conductivity in the range up to 1.5 W∙m−1 K−
1. A different case is seen in the EB-PVD that presents
channels between the columns and pores within the grains which are oriented perpendicular to the
substrate surface and exhibiting a higher thermal conductivity in the range of 1.5–1.9 W∙m−1 K−
1.
Conversely, the EB-PVD TBC’s present greater durability than the APS TBC’s due to their columnar
distribution that allows for an increase of strain tolerance.
4.4.4 Chemical vapour deposition (CVD)
Chemical vapour deposition (CVD) is a chemical method used to produce high-purity and high-
performance solid materials. Its biggest application is the semiconductor industry where it is used to
produce thin films. During CVD the substrate is exposed to one or more volatile precursors which
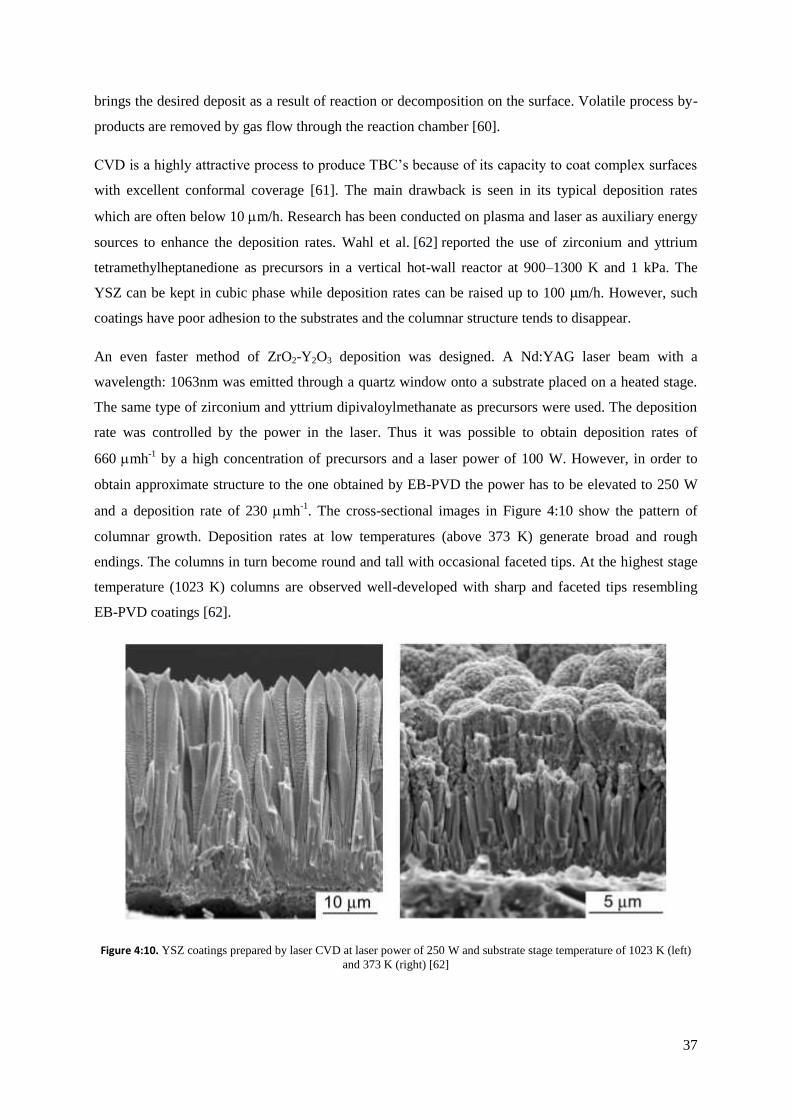
37
brings the desired deposit as a result of reaction or decomposition on the surface. Volatile process by-
products are removed by gas flow through the reaction chamber [60].
CVD is a highly attractive process to produce TBC’s because of its capacity to coat complex surfaces
with excellent conformal coverage [61]. The main drawback is seen in its typical deposition rates
which are often below 10 m/h. Research has been conducted on plasma and laser as auxiliary energy
sources to enhance the deposition rates. Wahl et al. [62] reported the use of zirconium and yttrium
tetramethylheptanedione as precursors in a vertical hot-wall reactor at 900–1300 K and 1 kPa. The
YSZ can be kept in cubic phase while deposition rates can be raised up to 100 µm/h. However, such
coatings have poor adhesion to the substrates and the columnar structure tends to disappear.
An even faster method of ZrO2-Y2O3 deposition was designed. A Nd:YAG laser beam with a
wavelength: 1063nm was emitted through a quartz window onto a substrate placed on a heated stage.
The same type of zirconium and yttrium dipivaloylmethanate as precursors were used. The deposition
rate was controlled by the power in the laser. Thus it was possible to obtain deposition rates of
660 mh-1
by a high concentration of precursors and a laser power of 100 W. However, in order to
obtain approximate structure to the one obtained by EB-PVD the power has to be elevated to 250 W
and a deposition rate of 230 mh-1
. The cross-sectional images in Figure 4:10 show the pattern of
columnar growth. Deposition rates at low temperatures (above 373 K) generate broad and rough
endings. The columns in turn become round and tall with occasional faceted tips. At the highest stage
temperature (1023 K) columns are observed well-developed with sharp and faceted tips resembling
EB-PVD coatings [62].
Figure 4:10. YSZ coatings prepared by laser CVD at laser power of 250 W and substrate stage temperature of 1023 K (left)
and 373 K (right) [62]

38
4.4.5 Sol-gel
The sol-gel process is a method for producing solid materials from small molecules by a series of
hydrolysis and condensation reactions. The preparation can be of thin films or bulk objects as well as
powders. It constitutes a versatile route to produce either thin ceramic coatings or thick deposits.
Along with the plasma spray and the EB-PVD, the sol-gel is an alternative method to generate thin
layers of ceramics because of its non-oriented microstructure; this gives randomly oriented pores.
Y2O3-stabilized ZrO2 is produced by 3.5 mol zirconia sol prepared by dispersing zirconium hydroxide
in a dilute acid and then yttrium salt solutions [63]. Barrow et. al. [64] has developed this technique to
prepare films thicker than 10 m and up to m by successive coatings. Xia et al. [65] have also
used the sol–gel route to develop sols for the colmatation of cracks generated by thermal treatment.
Coatings obtained by sol-gel technique have been tested against plasma sprayed and EB-PVD coatings
in erosion and oxidation tests [66]. The erodent used, projected with a 1.5 bar pressure, was alumina
particles with diameter comprised between 63 µm and 65 µm. Two bond coat systems were used to
coat the sol-gel, a plasma sprayed NiCrAlY bond coat and a NiAl. The samples were aged at 1100 °C
for 100 h and studied the effects of erosion. The erosion rate of the sol-gel TBC’s was found to
increase 30 - 40% in response to aging. Also, the samples of sol-gel were compared to the standard
EB-PVD and standard plasma sprayed TBC’s. It was seen an erosion rate 4-5 times higher than EB-
PVD and 2-3 times higher than plasma sprayed TBC’s. The highest erosion resistance was found to be
better for TBCs deposited onto the smoother (Pt, Ni)Al bond coat [66].
4.5 Structure of a TBC
In order to guarantee the good performance, TBC consists of several material layers where each has a
different function. When created, a TBC is typically composed of three layers. First is the top coat
which is a ceramic layer, under it there is the metallic alloy layer of bond coat which is directly coated
on the substrate. Substrate is assumed to be part of the TBC since all materials have to be matched by
their physical properties to create robust TBC’s. Over time during service, a fourth additional layer of
thermal growth oxides (TGO) is generated between the top and bond coat.
As commented, the innermost layer of the coating is the substrate material itself. It is necessary to
choose a material that gives good values of surface roughness so the upcoming layers of the coating
can deposit easily on it. The surface roughness can be artificially modified using abrasive grit blasting
which can mould the shape and make it rougher and easier for the mechanical adhesion of the bond
coat. In Figure 4:11 it is seen the location of the substrate material as well as the layers conforming the
coating [23].
The second layer is the bond coat. It is a metallic layer made of nano-structured metallic composite
(including Ni or Cr for example) which has several functions. It helps to reduce the mismatch in
thermal expansion coefficients between the ceramic coating and metal substrate; it improves the
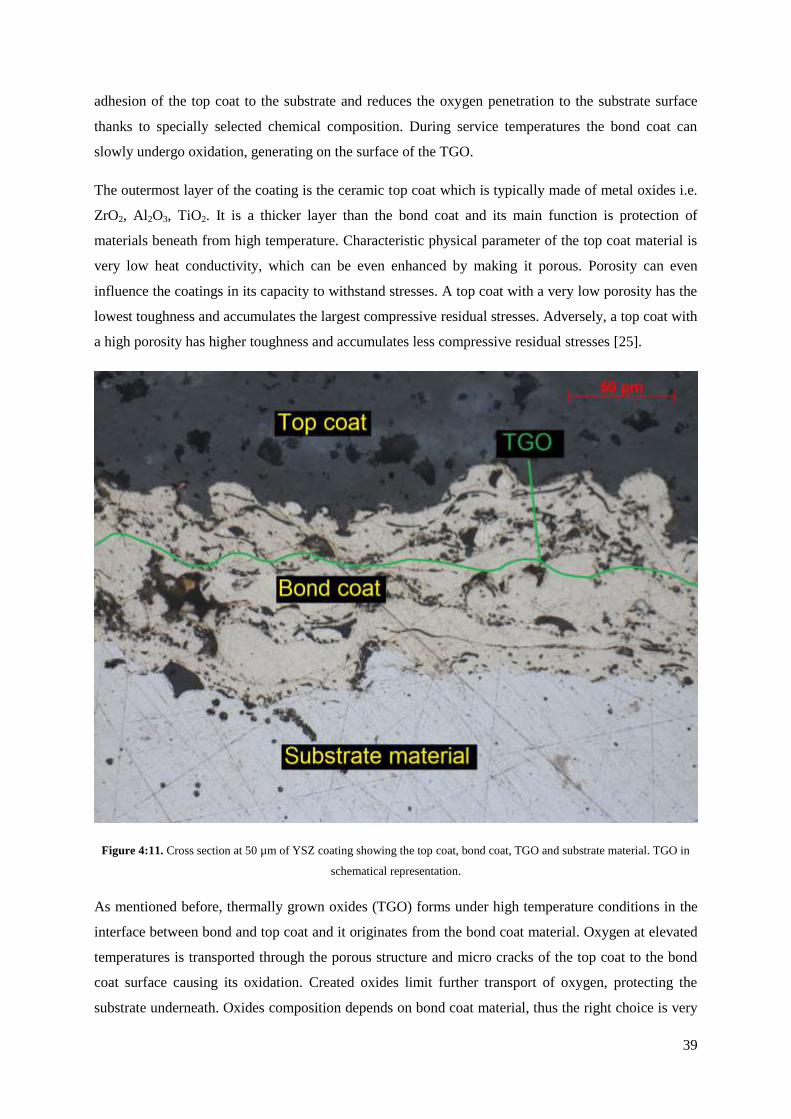
39
adhesion of the top coat to the substrate and reduces the oxygen penetration to the substrate surface
thanks to specially selected chemical composition. During service temperatures the bond coat can
slowly undergo oxidation, generating on the surface of the TGO.
The outermost layer of the coating is the ceramic top coat which is typically made of metal oxides i.e.
ZrO2, Al2O3, TiO2. It is a thicker layer than the bond coat and its main function is protection of
materials beneath from high temperature. Characteristic physical parameter of the top coat material is
very low heat conductivity, which can be even enhanced by making it porous. Porosity can even
influence the coatings in its capacity to withstand stresses. A top coat with a very low porosity has the
lowest toughness and accumulates the largest compressive residual stresses. Adversely, a top coat with
a high porosity has higher toughness and accumulates less compressive residual stresses [25].
Figure 4:11. Cross section at 50 µm of YSZ coating showing the top coat, bond coat, TGO and substrate material. TGO in
schematical representation.
As mentioned before, thermally grown oxides (TGO) forms under high temperature conditions in the
interface between bond and top coat and it originates from the bond coat material. Oxygen at elevated
temperatures is transported through the porous structure and micro cracks of the top coat to the bond
coat surface causing its oxidation. Created oxides limit further transport of oxygen, protecting the
substrate underneath. Oxides composition depends on bond coat material, thus the right choice is very

40
important. Al-containing bond coat oxides have low growth rate, uniformity and high density. In
particular, it is desired the so-called α-Al2O3 for presenting the best aforementioned properties. The
continuity of formed layer is critical for further growth of TGO. Cr2O3 creates at higher oxygen partial
pressures and protects from oxidation to the substrate only at lower temperatures. It has also weaker
adhesion to the TBC. NiO forms easily in reaction of Ni and O2 having the growth rate three orders of
magnitude higher than α-Al2O3 and by this introducing high level of stress. The most unwanted oxide
is a spinel (Ni, Co) (Cr, Al)2O4 whose growth undergoes with high volume increase introducing a
tensile stress. The depletion of -Al2O3 layer is often caused by the spinel oxides. Azadi et. al. [25] via
their study of coating parameters differentiates two zones in the TGO layer after an EDX analysis. The
first zone, the outermost, is lighter and is firstly composed by Cr oxides and then Co, Ni, Al and Y.
The second zone is darker and has primarily Cr, Al oxides and Co and then Ni, Al Y and Al.
4.6 Failure mechanism
The TBC’s can present several modes of failure depending on the state of the coating or the conditions
under which they are subjected to. The multilayered structure in a TBC is subjected to elastic, thermal
expansion and fracture forces which make it sensitive to thermal cycling and impact loads. It is known
that the TGO generally has bad adhesion properties and introduces internal stresses by volume
increase. The probability of failure then becomes stronger after a long time high-temperature exposure
and oxidation.
4.6.1 Crack propagation
Cracks will usually be present in the coatings from the manufacturing process. Their growth can be
predicted by Griffith’s criterion. Griffith in 1921 was the first to study propagations on already
existing cracks. The criterion studies the energy balance; a crack is prone to grow when energy release
rate equals the crack resistance force. In other words, the crack will grow when the energy available to
generate new crack surface surpasses the minimum limit [67].
Surface energy is given as a function of available external and internal energy. For the crack to grow
the increase of surface energy must equal the decrease of internal energy. If the increment in surface
energy is kept higher than the available internal energy, the crack will not grow [68].
At least four failure mechanisms are distinguished in APS TBC’s driven by the out-of-plane stresses.
In Figure 4:12 they have numbers from I to IV. The first type, type I, appears from the tensile stresses
in the TGO/bond coat as the TGO layer thickens. Cracks will run from the crests in the interface
TGO/bond coat. Type II comes from the thermal expansion mismatch between top coat and bond coat.
Top coat is subjected to compression at room temperature. Out-of-plane stresses are intensified by the
undulating pattern in the interface TGO/top coat, causing tension in the crests and compression in the
troughs. Type III is due to the brittleness at the crests increasing the likelihood of crack propagation.
Finally type IV evidences a change in thermal expansion coefficient of the TGO/bond coat interface in

41
relation to the TGO thickness. The compression forces in the troughs are converted into tension forces
causing cracking in the valleys between the crests.
Figure 4:12. Schematic diagram showing the four cracking mechanisms in APS TBC (upper picture). Cross-sectional SEM
of a failed APS TBC (lower picture) showing the various cracking mechanisms illustrated in the upper picture [69].
In particular, Sjöström and Brodin [71] assembled a FM model for APS TBC that considers crack
growth based on the energetic mechanisms of propagation. In the model it is included the spallation on
convex surfaces, on flat surfaces and on sharp edges and estimated an own criteria of failure. It also
accounts for a thermal expansion of the TGO of 8.0∙10-6
K-1
and identical thicknesses, mechanical and
thermal properties of the other layers. In the sketch from Figure 4:13 it is presented the length of the
crack, L the total length and h the height of it. D is a parameter that measures the failure mode. D<1.0
will indicate a full failure and it is considered that buckling and spalling starts after D=0.85. The
energy release has also been considered for a range of damage from 0 to 1. It is seen a major
disappearance in the energy release after D>0.75 for h/L=30/70 indicating a period of slow growth.
However, for an even more representative model, D must be adjusted to parameters such as top coat
thickness, oxide growth behaviour, oxide composition and also interface roughness.

42
Figure 4:13. Idealized interface / crack geometry for the FM model [71].
4.6.2 Failure by stresses and oxidation layers
Theoretically three major patterns of stress generation exist during the spray operation process. The
first is related to the stress that originates from the contraction of the individual splats as they are
deposited on the surface. The second is related to the differences in temperature between the substrate
and the coating while cooling. It can be either tensile or compressive, coming from the mismatch in
thermal expansions. The third is related to the volume change associated with any solid state phase
transformation [72].
It is desired to have an expansion coefficient of the top coat and the bond coat identical to the substrate
and due to material availability and properties this is not always possible. Moreover, since the stresses
might be larger than the capacity of the top coat/bond coat and bond coat/substrate interfaces it causes
problematic situations. After a long high-temperature service, as it cools down the stresses might be
large enough to make the whole thermal coating to flow plastically in compression. This, added to the
higher thermal expansion in the substrate may generate buckles and break away at their edges causing
failure in the coating [71].
The thickness of the coating will also influence its resistance to thermal shocks. In general a thick
TBC provides a greater temperature drop across the coating. In addition, the stored elastic strain
energy is maximized for the case of the thick coatings and thus there is a higher likelihood of crack
release. A structure with a higher porosity can increase the overall thermal shock resistance. On the
contrary, the failure mechanisms for thin TBC’s will be related to the thermo-mechanical properties of
the coating and the substrate, and to the oxidation of the bond coat. Therefore, the failure caused by
the TGO is a very delicate factor that by no reason should be discarded. The continuous exposure of
the coating to elevated temperatures and oxygen rich atmosphere causes the growth of the TGO
between the bond coat and the top coat layers leading to residual stresses and the spallation of the

43
TBC. Additionally, the depletion of Al in the TGO may cause the formation of spinels between the
TGO/top coat or between the top coat/bond coat. Their brittleness results in delamination [73].
4.6.3 Failure prevention
Regarding the failure prevention it is also possible to soften the outcome of the harsh solidifying
conditions of the splats by stress relaxation processes. One of the most effective is segmentation which
can significantly contribute to reduce the quenching stress below its theoretical value. This type of
failure mechanism is however the most questionable of all three to be existent [72].

44
Chapter
5 Sample preparation
5.1 TBC Powders
Thermal barrier coatings which are in the interest of this master thesis studies are made of following
materials used as bond and top coats.
Bond coat:
NiCrAlY – Amdry 962 powder
Top coat:
ZrO218TiO210Y2O3 – Metco 143 powder
ZrO28Y2O3 – Metco 204C – XCL powder
ZrO28Y2O3 – Metco 204F powder
Ceramic powders were atmospheric plasma sprayed (APS) to obtain the desirable coatings on the
samples. Two types of samples were used for verification of TBC performance – engine pistons and
coin samples. Coated pistons were prepared for engine testing while coin samples for material
structure observation and physical parameters estimation. For all samples the same bond coat material
was used. Top coats of each material were obtained at two thicknesses 500 µm and 1000 µm. In total 6
pistons and 30 coins samples were coated (5 coins of each top coat at each thickness).
5.2 Sample preparation
5.2.1 Pistons
The chemical composition of the steel in the pistons is of the type 38 MnSiVS5 forged. In the first step
of sample preparation, each piston head surface was machined in order to remove corresponding to
TBC thickness layer of piston material. This practice was undertaken to preserve the same
compression ratio of the coated pistons to the uncoated reference. It has been estimated that the
additional 300 µm thick layer on the top surface of the piston would increase the compression ratio
about 0.6. Inaccurate compression data would lead to higher peak pressure at the TDC and thus more
complicated test results evaluation.
Two piston series were prepared, one with 500 µm and the second with 1000 µm reduced height.
Surface to be removed is presented schematically in Figure 5:1. The purple line shows the worn out
layer that was milled away from the piston inward to the surface.

45
Figure 5:1. Schematic representation of the worn out layer by milling to counterbalance the introduction of the TBC’s on the
piston top surface [74].
5.2.2 Coin samples
30 coin samples with the diameter of 12.5 mm and thickness of 4 mm have been machined from the
piston steel material. The objective is to coat each six samples with the same TBC material as the
piston and test the physical and mechanical properties of the coating.
5.3 Sample coating
5.3.1 Pre-treatment
Atmospheric plasma spraying process requires surface pre-treatment to ensure the adhesion of the
coating to the substrate. All samples were therefore degreased with isopropanol and then grit-blasted
with 99.9% corundum, fraction FEPA F22 (707-1000 µm). In the blasting process the injector was set
to 4 bar pressure and the distance of approximately 150 mm.
5.3.2 Coating process
Coating process was preceded by equipment calibration and optimisation. Coating parameters like gun
type, nozzle size, power, gas atmosphere, powder feeding rate, spraying parameters and cooling were
adjusted to obtain required coating thickness and structure. Calibration trials were performed both on
flat samples (coins, plates) as well as on additional pistons supplied by Scania. Figure 5:2 presents the
coating setup.

46
Figure 5:2. Sulzer Metco Coating system including 6 axis robot manipulator, F4 plasma torch mounted and 2 axis turn/tilt
table (left side picture). A close up to the Triplex Pro-210 plasma torch gun with triple injection (right side picture).
In the first step the bond coat powder is deposited on the previously prepared surface. The NiCrAlY
particles of the bond coat need to be in a molten state to achieve good coating structure. Therefore, it is
important to implement the powder to the hot regions of the plasma plume. During calibration trials
there were observed unmolten particles within the bond coat, thus the caring gas flow was increased to
inject the powder more to the centre of plasma and melt it more reliably.
On the other hand, when coating the TBC top layer with Metco 204C-XCL powder, the porosity
during calibration trials was below the desired range. That was caused by too high power of the spray
gun and implementation of the powder directly into the hottest spot of the plasma plume. Moving the
powder injection away from the centre of the hot plasma and reducing the power resulted in higher
porosity.
Another problem was encountered when spraying TBC top layer with Metco 204F powder by using
F4 spray gun. To achieve segmented structure of the coating a spray distance shall not exceed
70-80 mm. Due to the complexity in the geometry of Scania piston, the minimum spraying distance
was approximately 125 mm. Therefore the spraying gun was exchanged to TriplexPro 210 which can
deliver higher power and thus compensate 80% higher spray distance. After implementing the changes
the desired vertically cracked coating was obtained with the crack frequency of about 2 cracks/ mm.
As specified from the manufacturer, the service temperature of the Metco 143 is limited to 950°C
while Metco 204F and Metco 204-XCL is limited to 1250°C.
5.3.3 Coating results
After the coating process all samples were delivered to Scania for engine testing and material
investigation. Figure 5:3 shows the finishing of the piston and the coin samples in as-coated
conditions. It is observed a greyish colour for the Metco 143 type, a whitish colour for the Metco
204C-XCL and a yellowish colour for the Metco 204F.

47
The geometry from the piston and the differences in speed from gun and piston creates a build-up of
heat which can be one cause for decolouration. This effect is more noticeable on the Metco 143 type.
The Metco 204C-XCL contains a reduced amount of contaminating particles that can cause coloration
and this effect is not visible. Both the Metco 204F and Metco 143 present a brighter finish on the 1000
µm coating induced by increasing heat that the thicker version requires.
In Table 5-1 it is possible to see the coating’s density, porosity and density considering the porosity.
Table 5-1. Densities of the coatings
Coating Coating Density
[g/cm3]
Porosity [%] Density considering porosity
[g/cm3]
Metco 143 5.08 3.2 4.92
Metco 204C-XCL 5.60 10.6 5.01
Metco 204F 5.58 1 5.52
Figure 5:3. Pictures taken on piston and coin samples with Metco 143, Metco 204C-XCL and Metco 204F on their surface
on as-coated conditions.
Metco 143
Metco 204F
Metco 204C-XCL

48
Chapter
6 Engine Testing with TBC
6.1 Surface identification
Surface profiles of pistons were measured to determine the actual piston bowl volumes after coating
and thus calculate the compression ratio. Figure 6:1 shows a schematic overview of the surface profile,
measured in one direction across the squish area and the bowl. A second surface profile measurement
was taken perpendicularly to the first. Additionally the distance from the center of the piston pin to the
top squish area was measured to determine the height. This measurement was made on each side of the
piston to be sure that eventual irregularities were taken into account. The average value was used to
calculate the difference between measured and nominal piston height. Calculated compression ratios
are shown in Table 6-1 and were used when setting the engine [75].
Figure 6:1. Skis of piston, showing center of the piston pin and a surface profile across the bowl [74]
Table 6-1. Compression ratios for the coated pistons and the reference piston
Piston Coating Compression Ratio 1 Metco 143 20.16 2 Metco 204C-XCL 20.16 3 Metco204F 19.73 4 Metco 143 20.84 5 Metco 204C-XCL 21.04 6 Metco204F 19.94 7 Reference piston 19.90

49
Surface roughness was measured using MarTalk instrument from Mahr Group and the MarWin
software. The results are presented in Table 6-2. Almost 36000 points were checked in single
measurement with a speed of 0.20 mm/s for each profile. It can be seen that the average roughness –
Ra does not vary much for the same type of coating, regardless of the thickness. Maximum peak –
Rmax is within the initial tolerance established by Sulzer. Finally, it can be seen that the reference
piston has the lowest Ra and Rmax.
Table 6-2. Surface parameters evaluation obtained with a MarTalk equipment.
Piston Coating Thickness [mm] No. of Samples Ra [𝝁m] Rmax [𝝁m]
1 Metco 143 0.5 1 8.23 66.86
4 Metco 143 1.0 1 8.37 74.2
2 Metco 204C-XCL 0.5 1 12.85 100.47
5 Metco 204C-XCL 1.0 1 13.21 82.84
3 Metco 204F 0.5 1 8.40 70.87
6 Metco 204F 1.0 1 8.86 77.17
7 Reference piston -- 1 2.48 13.78
6.2 Test Engine
Engine tests were performed in single cylinder test bench, using engine which is based on Scania
DC13 Eu6, with a displacement of 2.123 dm3. The bore stroke relation is 130/260 mm, the nominal
cylinder compression ratio was 20:1. Engine was equipped with a common rail XPI injection system
with a maximum possible injection pressure of 2500 bar. A 9 hole injector was mounted centrally in a
4-valve cylinder head. All tests were performed without exhaust gas recirculation (EGR). Pistons were
cooled by gallery oil cooling. Table 6-3 provides technical information about the engine.
Table 6-3. Engine technical information
Engine technical information Displacement [cm
3] 2.123
Bore/Stroke [mm] 130/260
Compression ratio 20:1
Number of valves 4
Swirl number 1.7
Injection system Common rail XPI, max. pressure 2500bar
Injector 9 holes
Valves 4 valves
6.3 Test bench setup
Preparation of the research engine for measurements of the heat losses transferred from the
combustion chamber required a special arrangement of the sensors. At first, the changes for the piston
cooling oil measurement were implemented. Pressure and temperature of the inlet oil from the main
gallery to the piston were measured. Oil flow was also measured using a Kral OMG 20 flow meter

50
with an inductive BEG 44 sensor. This combination allows measuring a flow range in between 0.3 to
45 l/min and oil temperatures up to 150 °C. The complete oil circuit of the single cylinder test bench is
presented on the
Figure 6:2.
Figure 6:2. Test bench setup – oil circuit
Measurement of the return oil temperature required modifications of the piston, connecting rod and the
liner. The measurement was done using a thermocouple which was placed in a small cup-like
container fixed on the bottom of the liner, exactly below piston gallery outlet hole. The cup collected
the hot oil on its return flow to the engine sump. Thermocouple cable was directed out through the
hole drilled in the screw of the inspection hatch. Since the cup needed extra space, the connecting rod
and the piston were machined to remove material that would interfere with the cup on their motion.
The oil cup and its location in the engine are shown in Figure 6:3.
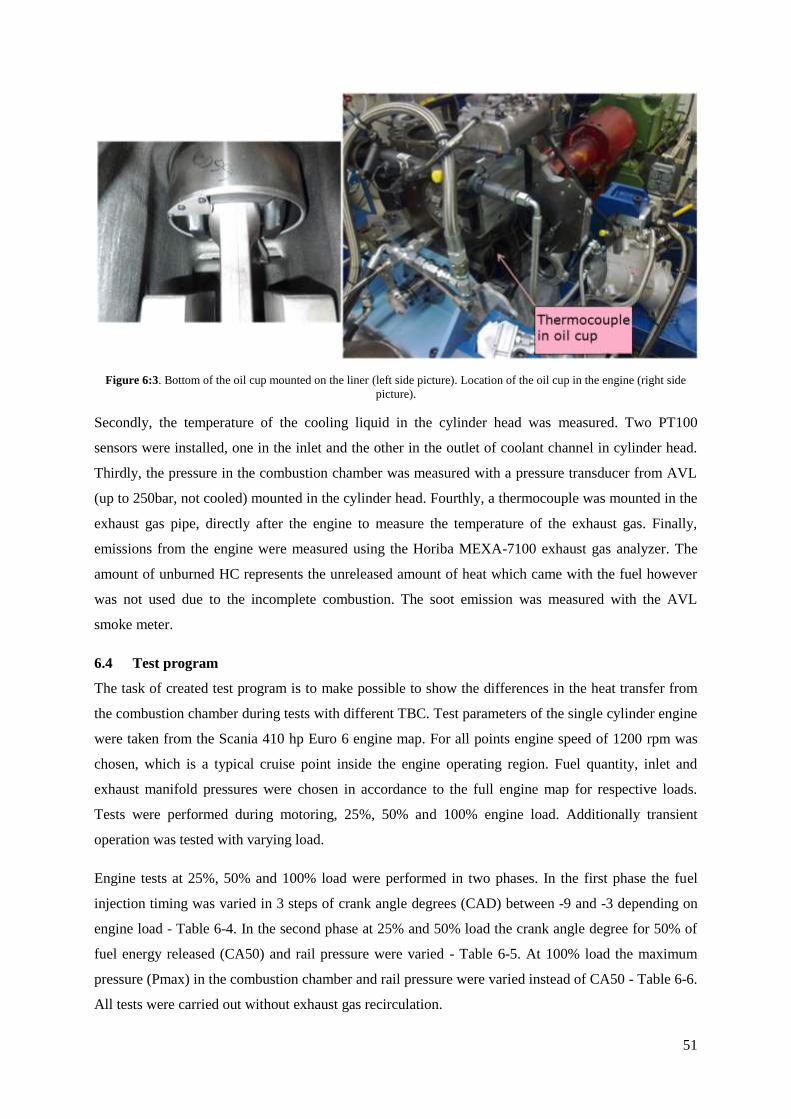
51
Figure 6:3. Bottom of the oil cup mounted on the liner (left side picture). Location of the oil cup in the engine (right side
picture).
Secondly, the temperature of the cooling liquid in the cylinder head was measured. Two PT100
sensors were installed, one in the inlet and the other in the outlet of coolant channel in cylinder head.
Thirdly, the pressure in the combustion chamber was measured with a pressure transducer from AVL
(up to 250bar, not cooled) mounted in the cylinder head. Fourthly, a thermocouple was mounted in the
exhaust gas pipe, directly after the engine to measure the temperature of the exhaust gas. Finally,
emissions from the engine were measured using the Horiba MEXA-7100 exhaust gas analyzer. The
amount of unburned HC represents the unreleased amount of heat which came with the fuel however
was not used due to the incomplete combustion. The soot emission was measured with the AVL
smoke meter.
6.4 Test program
The task of created test program is to make possible to show the differences in the heat transfer from
the combustion chamber during tests with different TBC. Test parameters of the single cylinder engine
were taken from the Scania 410 hp Euro 6 engine map. For all points engine speed of 1200 rpm was
chosen, which is a typical cruise point inside the engine operating region. Fuel quantity, inlet and
exhaust manifold pressures were chosen in accordance to the full engine map for respective loads.
Tests were performed during motoring, 25%, 50% and 100% engine load. Additionally transient
operation was tested with varying load.
Engine tests at 25%, 50% and 100% load were performed in two phases. In the first phase the fuel
injection timing was varied in 3 steps of crank angle degrees (CAD) between -9 and -3 depending on
engine load - Table 6-4. In the second phase at 25% and 50% load the crank angle degree for 50% of
fuel energy released (CA50) and rail pressure were varied - Table 6-5. At 100% load the maximum
pressure (Pmax) in the combustion chamber and rail pressure were varied instead of CA50 - Table 6-6.
All tests were carried out without exhaust gas recirculation.

52
Table 6-4. Test plan for SOI with sweep and repetition of 25%, 50% and 100% load
SOI [deg/ATDC]
Load [%] Speed [rpm]
Fuel [mg/inj]
Intake pressure [mbar]
Exhaust pressure [mbar]
Rail pressure
[bar]
-9, -6, -3 25 1200 58 200 200 1200
-12, -9, -6 50 1200 126 700 400 1050
-12, -9, -6 100 1200 240 1800 1300 1050
Table 6-5. Test plan for CA50 sweep of 25% and 50% load
CA50 [deg/ATDC]
Load [%] Speed [rpm]
Fuel [mg/inj]
Intake pressure [mbar]
Exhaust pressure [mbar]
Rail pressure [bar]
4, 8, 12 25 1200 58 200 200 800 1200 1600
6, 10, 14 50 1200 126 700 400 650 1050 1450
Table 6-6. Test plan for Pmax sweep of 100% load
Pmax [bar] Load [%]
Speed [rpm]
Fuel [mg/inj.]
Intake pressure [mbar]
Exhaust pressure [mbar]
Rail pressure [bar]
210, 220, 230 100 1200 240 1800 1300 625 1025 1425
The order in which the parts were tested is presented in Table 6-7. Test started and finished with a
reference piston in order to check the reliability of the engine. TBC 3 and TBC 6 were tested as the
last because of considered delamination. All tested TBC were compared with the results from
reference piston to check the potential improvements.
Table 6-7. Piston testing order
Test order 1 Reference piston
2 TBC 1 -
3 TBC 2 - Metco 204C-
4 TBC 4 -
5 TBC 5 - Metco 204C-
6 TBC 3 -
7 TBC 6 -
8 Reference piston
6.5 Test results
In the first step the TDC determination was performed with AVL 428 TDC sensor.
After accomplished tests, data were analysed in order to see the differences in the heat losses from the
combustion chamber. Results from tests in which the start of fuel injection SOI was varied show most
clearly the heat losses phenomena and are representative for all obtained results. As an example the
50% load SOI sweep results will be presented.

53
In the thermodynamic cycle of four stroke diesel engine, heat losses are present during compression,
combustion and expansion. Most heat losses are however observed around TDC piston position where
the combustion takes place. With the TBC on a piston a decreased heat transfer to the cooling oil is
expected and thus a lower cooling oil temperature. Test results are presented in Figure 6:4, on the X-
axis is SOI and Y-axis is cooling oil temperature.
Figure 6:4. Piston cooling oil temperature at 50%load
There is a constant ~1 CAD offset in the start of injection values due to the detection of the injector
current in the indicating system, e.g. the demand SOI in Figure 6:4 was -12, -9 and -6 CAD, while the
recorded SOI was ca. -11, -8 and -5 respectively.
Highest oil temperatures can be observed for uninsulated piston. Pistons with 500 µm thick TBC
decreased the temperature about 2-3 °C, while 1000µm thick TBC decreased it by about 4 °C. The
trend shows decrease in heat transfer to the cooling oil with increase of insulation thickness and was
observed for all tested loads.
As the heat losses to the cooling oil are lower, more heat energy should be stored in the exhaust gas.
Figure 6:5 presents the exhaust gas temperature for respective pistons.
-12.00 -11.25 -10.50 -9.75 -9.00 -8.25 -7.50 -6.75 -6.00 -5.25
Start of injection [deg]
Co
olin
g o
il te
mp
era
ture
[ce
l]
100
101
102
103
104
105
106
107
108
109
110REF
TBC 1
TBC 2
TBC 3
TBC 4 (1)
TBC 5 (2)
TBC 6 (3)
REF

54
Figure 6:5. Exhaust gas temperature at 50% load
Exhaust gas temperature is lowest for uninsulated piston, and rises with the insulation thickness, which
means that the additional heat is directed to the exhaust gases. The trend then, corresponds well with
the decreased heat losses through the piston, presented previously. Exhaust temperature of TBC 6
stands out from the rest of the results; this is probably a consequence of exchanged thermocouple and
inaccurate positioning in the exhaust pipe.
Hotter walls of insulated piston makes the risk of less effective gas exchange, thus the volumetric
efficiency of the engine was one of the primary concerns. Figure 6:6 presents the volumetric efficiency
at different injection timing for respective pistons. Slightly negative change of around 0.8% can be
observed for coated pistons. This change is however quiet small and should not significantly influence
the oxygen content in the combustion chamber.
-12.00 -11.25 -10.50 -9.75 -9.00 -8.25 -7.50 -6.75 -6.00 -5.25
Start of injection [deg]
Exh
au
st g
as te
mp
era
ture
[ce
l]
384
390
396
402
408
414
420
426
432
438
444REF
TBC 1
TBC 2
TBC 3
TBC 4 (1)
TBC 5 (2)
TBC 6 (3)
REF

55
Figure 6:6. Volumetric efficiency at 50% load
During tests, cooling liquid temperature was measured in the inlet and the outlet of the cylinder head.
From the obtained data it was not however possible to make any conclusion, as the inlet temperature
variation and high flow made temperature changes very small.
To be able to estimate the overall influence of TBC on engine efficiency, the combustion process
should be studied as well as the heat losses. A good indication of how the fuel burns is the cylinder
pressure curve and the rate of heat release curve. Both parameters deliver information about burning
duration if plotted in a function of crank angle degree. To simplify results presentation the peak
cylinder pressure and the CAD at which 50% of injected fuel energy is released are presented in
Figure 6:7 and Figure 6:8.
-12.00 -11.25 -10.50 -9.75 -9.00 -8.25 -7.50 -6.75 -6.00 -5.25
Start of injection [deg]
Vo
lum
etr
ic e
ffic
ien
cy [%
]
88.4
88.6
88.8
89.0
89.2
89.4
89.6
89.8
90.0
90.2
90.4REF
TBC 1
TBC 2
TBC 3
TBC 4 (1)
TBC 5 (2)
TBC 6 (3)
REF

56
Figure 6:7. Peak cylinder pressure at 50% load
In Figure 6:7 it can be observed that the highest cylinder pressure is measured always for reference
piston. Slightly lower maximal pressures are recorded for thin TBCs (500µm), and much lower for the
thick TBCs (1000 µm). Larger spread was observed for 100% load results and smaller for 25% load
results. There are two reasons why the maximum cylinder pressure might be lower, assuming that the
compression ratio is not decreased. The first reason might be an increase of heat losses from the
combustion chamber during compression of charged air load, before the fuel is injected. The other
reason might be a slower combustion process of the fuel. The consequence of this is more retarded
pressure curve with a lower maximum.
As it can be seen in Figure 6:8 for the same injection timing, 50% of fuel is burned fastest for the
uncoated reference piston. The duration of combustion increase with the TBC thickness, being longest
for thick insulations. The increase of about 4-5 CAD is significant and negatively influences the
overall efficiency of the engine.
-12.00 -11.25 -10.50 -9.75 -9.00 -8.25 -7.50 -6.75 -6.00 -5.25
Start of injection [deg]
Pe
ak c
ylin
de
r p
ressu
re [b
ar]
110
115
120
125
130
135
140
145
150
155
160REF
TBC 1
TBC 2
TBC 3
TBC 4 (1)
TBC 5 (2)
TBC 6 (3)
REF

57
Figure 6:8. 50% mass fraction burned at 50% load
Together with combustion investigation, exhaust emissions were measured. In Figure 6:9 the unburned
hydrocarbons engine out emission is presented. There are no significant changes in HC concentration
when using the TBC pistons. High values for TBC 6 are probably caused by impurities in
measurement equipment.
-12.00 -11.25 -10.50 -9.75 -9.00 -8.25 -7.50 -6.75 -6.00 -5.25
Start of injection [deg]
Cra
nk a
ng
le o
f 5
0%
ma
ss fra
ctio
n b
urn
ed
[d
eg
]
7
8
9
10
11
12
13
14
15
16
17REF
TBC 1
TBC 2
TBC 3
TBC 4 (1)
TBC 5 (2)
TBC 6 (3)
REF

58
Figure 6:9. HC concentration at 50% load
Figure 6:10 presents NOX concentration. It can be seen that the NOX concentration is lower for the
pistons coated with TBC in comparison to reference. These results are surprising, as it was expected to
have higher concentrations when using TBC. In theoretical part it was mentioned that the thermal NOX
forms in the reaction of N2 and O2 at temperatures above 1900 K. Application of TBC should
contribute to higher overall temperature in the combustion chamber and thus increase of NOX
production. Observed decrease of NOX can be however a result of slower combustion. Longer burning
duration results as lower maximum temperature and pressure and indirectly as lower NOX
concentration.
-12.00 -11.25 -10.50 -9.75 -9.00 -8.25 -7.50 -6.75 -6.00 -5.25
Start of injection [deg]
HC
co
nce
ntr
atio
n [p
pm
]
48
56
64
72
80
88
96
104
112
120
128REF
TBC 1
TBC 2
TBC 3
TBC 4 (1)
TBC 5 (2)
TBC 6 (3)
REF

59
Figure 6:10. NOX emission at 50% load
-12.00 -11.25 -10.50 -9.75 -9.00 -8.25 -7.50 -6.75 -6.00 -5.25
Start of injection [deg]
Sp
ecific
NO
x e
mis
sio
n [g
/kW
h]
8
9
10
11
12
13
14
15
16
17
18REF
TBC 1
TBC 2
TBC 3
TBC 4 (1)
TBC 5 (2)
TBC 6 (3)
REF

60
Chapter
7 Material Results
7.1 Light optical microscopy (LOM)
The light optical microscope (LOM) is a microscope which uses visible light and a system of lenses to
observe small samples. There are two configurations available. One is the simple microscope which
uses a set of lenses to magnify the object by angular magnification only and thus is limited; and the
second configuration, is compound microscope which uses lenses close to the object to focus the real
image inside the microscope and a second set of lenses to magnify the real image. It gives its enlarged
inverted virtual image to the viewer. The compound microscope achieves a much higher
magnification; however, the magnification of the optical microscopes is physically limited by the
wavelength of visible light. Also, modern microscopes are equipped in digital cameras which transfer
the image directly to the computer for further processing [76]. The microscope used in our tests was a
common LOM from Axiovision by Carl Zeiss.
7.1.1 Coins samples before thermal cycling test - LOM
It was of great interest to study the ceramic coatings using laboratory equipment for the determination
of their structural properties. Three different sets of samples were characterized: in as-coated
conditions, after the simulation of thermodynamical conditions with laboratory equipments and after
engine testing.
The material characterization for further evaluation in microscopes required a sample preparation with
a cutting disc to reveal their cross section and a subsequent bakelite preparation with EpoMet® F 20-
3381-400 moulding resin for over 7 minutes in samples of 50 mm of diameter. The six coins were
secured all together and ground in an ApraPlan-10 on stone for 40 seconds using water as a lubricant,
at 1450 rpm and a force of 480 N. Thereupon, the samples were polished using a MD Largo for steel
at 150 rpm and 510 N for 7 minutes. Then, they were polished with a MD DAC for steel at 150 rpm
and 420N for 4 minutes. The finishing in the steel part could be improved if an Allegro disc is used in
a step before the polishing with the MD Largo. However, the steel finishing is not in our interest in the
present research.
Figure 7:1 presents images of the cross-section of samples observed with the LOM coated with A –
Metco 143, B – Metco 204C-XCL and C – Metco 204F coatings, taken at a magnification of 100X.
The desired total thickness for those coatings was 500 µm.

61
The total thickness of the coating on the image A is about 750 µm. The bond coat thickness (yellow) is
about 50 µm, and the top coat (gray) is around 700 µm. It can be observed that the desired thickness of
the coating 500 µm was not achieved by the manufacturer. The black spots inside the coating
correspond to porosity, measured by the coating manufacturer to be 3.2%. A porosity gradient is
observed, and it decreases accordingly to the coating thickness. This gradient was only seen in the
sample A – Metco 143, which lead us to believe that it was caused by the lower melting temperature
of TiO2 with respect to ZrO2-8Y2O3. Changing the cooling time during the deposition of the layers
would possibly be one way to prevent it in the future.
The total thickness of the coating on the image B is about 500 µm, the bond and the top coats are
about 70 µm and 450 µm thick respectively. The porosity was estimated to be 10.6%.
The total thickness of the coating on the image C is about 500 µm, the bond and the top coats are
about 60 µm and 450 µm thick respectively. The porosity was estimated to be below 1%. Vertical and
horizontal cracks can be easily seen, which confirms the segmented structure of the coating.
Figure 7:1. Cross-sections of A – Metco 143, B – Metco 204C-XCL and C - Metco 204F coatings at magnification 100X.
Respective microscope observations were performed for the desired 1000 m thick coatings. No
differences in the structure were noticed in comparison to presented 500 m thick samples. The
thickness’ data are collected in Table 7-1.
74
4.3
m
69
5.2
m
51
.2
m 51
7.0
m
72
.7
m4
50
.5
m
58
.4
m4
44
.3
m
50
6.8
m
A B
C

62
Table 7-1. Thicknesses measurements of the three types of coatings on two different modes
Sample Total [m] Top coat [m] Bond coat [m]
Metco 143 1400 1330 80
Metco 204C-XCL 980 870 70
Metco 204F 1070 970 90
Figure 7:2 presents the cross-section of sample bond coat (middle layer) at magnification of 500X.
Several characteristic defects for the plasma sprayed bond coat can be noticed. Line defects marked
with red arrows are created when multiple layers deposit on the surface. Too many line defects across
the bond coat would lead to a weak binding; however, an acceptable number of spots was found along
the sample. An example of non-molten particle is marked in red rectangle. Too many non-molten
particles would indicate an insufficient temperature during deposition of the bond coat.
Figure 7:2. Image of the cross-section of sample bond coat at magnification of 500X.
7.1.2 Coin samples after thermal cycling test – LOM
After the thermal cycling test, the cross section of the coins was examined in the LOM to determine
the appearance of cracks or other structural changes. Figure 7:3 on the left side shows the cross-section
of Metco 143 in 500 µm at 500X. It is possible to distinguish a crack that runs along the bond coat/top
coat interface. This is a strong indicator that the coating was close to fail if the test had continued. The
coating Metco 143 in 1000 µm detached completely from the surface, leaving a clear surface of the
substrate material. A further evaluation is needed to determine the nature of the failure. The possible
presence of oxides may have made more significant the difference in thermal expansions to generate
stresses. It could also be caused by a poor sample preparation and low surface roughness conditions of
the substrate for the proper adhesion of the bond coat. The right side picture of Figure 7:3 shows the
metallography of Metco 204F (segmented YSZ) in 500 µm at 500X. Longer cracks have grown
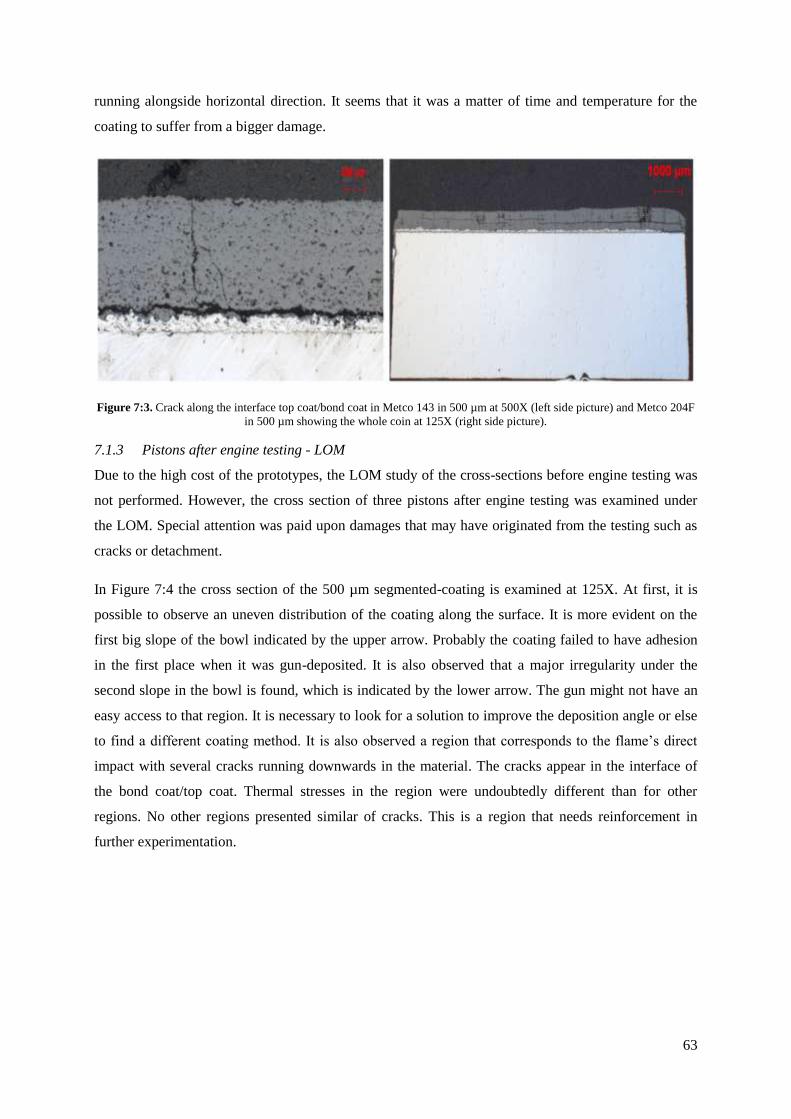
63
running alongside horizontal direction. It seems that it was a matter of time and temperature for the
coating to suffer from a bigger damage.
Figure 7:3. Crack along the interface top coat/bond coat in Metco 143 in 500 µm at 500X (left side picture) and Metco 204F
in 500 µm showing the whole coin at 125X (right side picture).
7.1.3 Pistons after engine testing - LOM
Due to the high cost of the prototypes, the LOM study of the cross-sections before engine testing was
not performed. However, the cross section of three pistons after engine testing was examined under
the LOM. Special attention was paid upon damages that may have originated from the testing such as
cracks or detachment.
In Figure 7:4 the cross section of the 500 µm segmented-coating is examined at 125X. At first, it is
possible to observe an uneven distribution of the coating along the surface. It is more evident on the
first big slope of the bowl indicated by the upper arrow. Probably the coating failed to have adhesion
in the first place when it was gun-deposited. It is also observed that a major irregularity under the
second slope in the bowl is found, which is indicated by the lower arrow. The gun might not have an
easy access to that region. It is necessary to look for a solution to improve the deposition angle or else
to find a different coating method. It is also observed a region that corresponds to the flame’s direct
impact with several cracks running downwards in the material. The cracks appear in the interface of
the bond coat/top coat. Thermal stresses in the region were undoubtedly different than for other
regions. No other regions presented similar of cracks. This is a region that needs reinforcement in
further experimentation.

64
Figure 7:4. LOM of cross section of Metco 204F in 500 µm taken at 125X.
Figure 7:5 shows the cross section of the TiO2-containing coating in 500 µm at 125X on the region of
the second slope in the bowl. It is evident the presence of cracks in the interface bond coat/top coat
due to the thermal stresses. It is also observed that radical difference in the total thickness of the
coating, ranging from 150 µm to more than 1150 µm, are present or can be found.
Figure 7:5. LOM of cross section of Metco 143 in 1000 µm taken at 125X.
After engine testing spallation mark was observed on the piston surface in the bowl, Figure 7:6
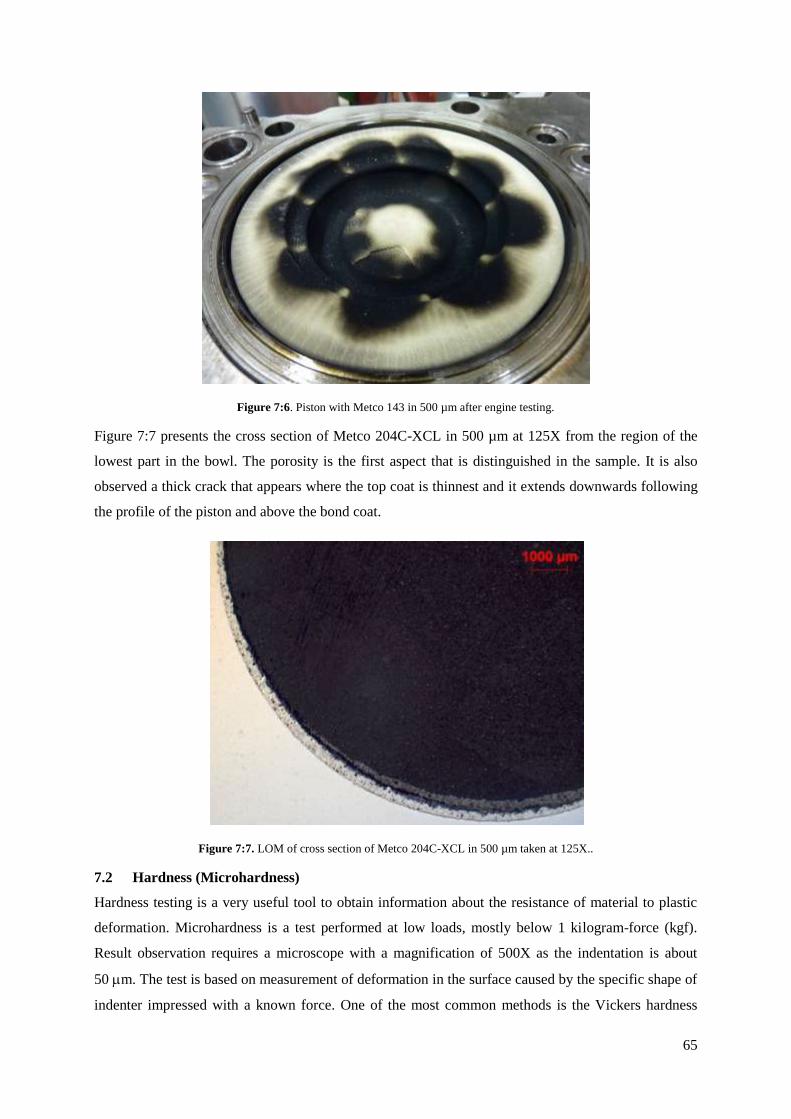
65
Figure 7:6. Piston with Metco 143 in 500 µm after engine testing.
Figure 7:7 presents the cross section of Metco 204C-XCL in 500 µm at 125X from the region of the
lowest part in the bowl. The porosity is the first aspect that is distinguished in the sample. It is also
observed a thick crack that appears where the top coat is thinnest and it extends downwards following
the profile of the piston and above the bond coat.
Figure 7:7. LOM of cross section of Metco 204C-XCL in 500 µm taken at 125X..
7.2 Hardness (Microhardness)
Hardness testing is a very useful tool to obtain information about the resistance of material to plastic
deformation. Microhardness is a test performed at low loads, mostly below 1 kilogram-force (kgf).
Result observation requires a microscope with a magnification of 500X as the indentation is about
50 m. The test is based on measurement of deformation in the surface caused by the specific shape of
indenter impressed with a known force. One of the most common methods is the Vickers hardness
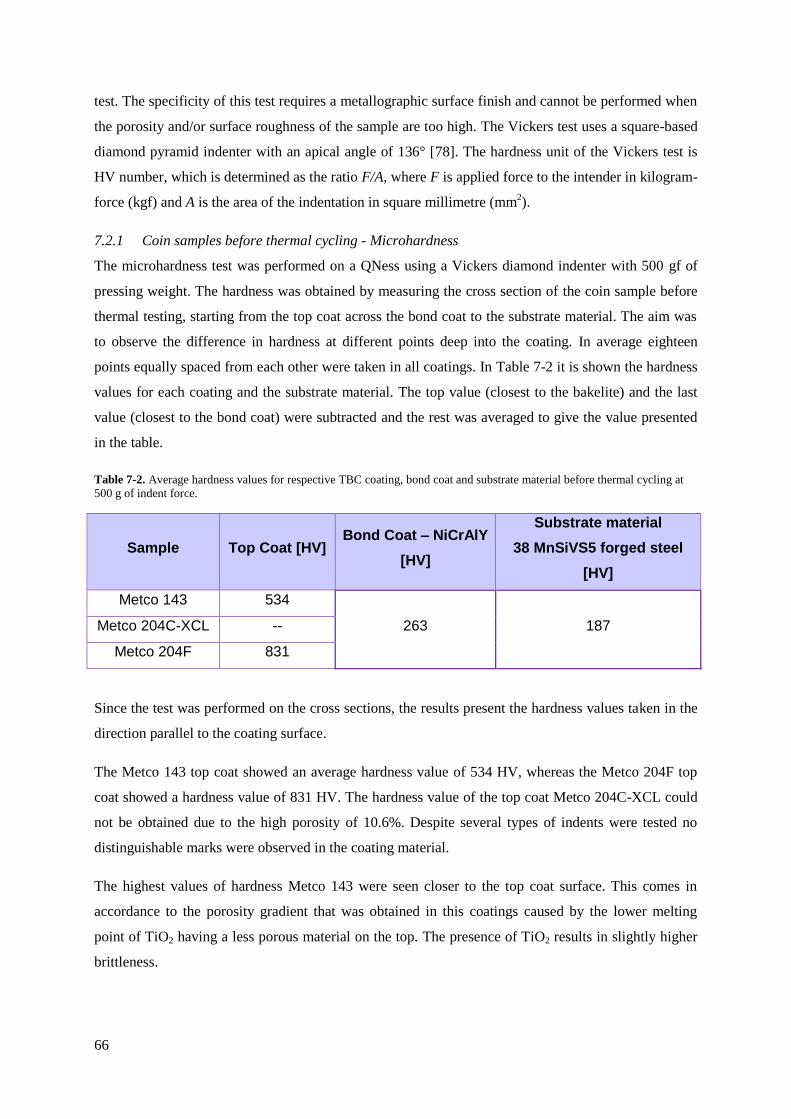
66
test. The specificity of this test requires a metallographic surface finish and cannot be performed when
the porosity and/or surface roughness of the sample are too high. The Vickers test uses a square-based
diamond pyramid indenter with an apical angle of 136° [78]. The hardness unit of the Vickers test is
HV number, which is determined as the ratio F/A, where F is applied force to the intender in kilogram-
force (kgf) and A is the area of the indentation in square millimetre (mm2).
7.2.1 Coin samples before thermal cycling - Microhardness
The microhardness test was performed on a QNess using a Vickers diamond indenter with 500 gf of
pressing weight. The hardness was obtained by measuring the cross section of the coin sample before
thermal testing, starting from the top coat across the bond coat to the substrate material. The aim was
to observe the difference in hardness at different points deep into the coating. In average eighteen
points equally spaced from each other were taken in all coatings. In Table 7-2 it is shown the hardness
values for each coating and the substrate material. The top value (closest to the bakelite) and the last
value (closest to the bond coat) were subtracted and the rest was averaged to give the value presented
in the table.
Table 7-2. Average hardness values for respective TBC coating, bond coat and substrate material before thermal cycling at
500 g of indent force.
Sample Top Coat [HV] Bond Coat – NiCrAlY
[HV]
Substrate material
38 MnSiVS5 forged steel
[HV]
Metco 143 534
Metco 204C-XCL -- 263 187
Metco 204F 831
Since the test was performed on the cross sections, the results present the hardness values taken in the
direction parallel to the coating surface.
The Metco 143 top coat showed an average hardness value of 534 HV, whereas the Metco 204F top
coat showed a hardness value of 831 HV. The hardness value of the top coat Metco 204C-XCL could
not be obtained due to the high porosity of 10.6%. Despite several types of indents were tested no
distinguishable marks were observed in the coating material.
The highest values of hardness Metco 143 were seen closer to the top coat surface. This comes in
accordance to the porosity gradient that was obtained in this coatings caused by the lower melting
point of TiO2 having a less porous material on the top. The presence of TiO2 results in slightly higher
brittleness.

67
7.2.2 Coin samples after thermal cycling test - Microhardness
The gradual hardness was measured in the coins after the thermal cycling test. The procedure was the
same as the microhardness test performed on the coin samples before testing. In the Table 7-3 it is
presented the hardness values for each coating and substrate material.
Table 7-3. Average hardness values for respective TBC top coat and bond coat after thermal cycling at 500 g of indent force.
Sample Top Coat [HV] Bond Coat – NiCrAlY
[HV]
Metco 143 556
Metco 204C-XCL -- 394
Metco 204F 654
Metco 143 exhibited an average hardness after thermal cycling test of 556 HV in comparison to 534
HV from the samples before testing. The test was performed at 500 g of indent force. Bharathesh et.
al. [79] concluded on the hardening after heat treating TiO2. The thermal cycling’s cycles may have
influenced on this. On the other hand Metco 204F exhibited an average hardness of 654 HV in contrast
to 831 HV from before testing. The lower hardness can be associated to the thermal effect from the
cycling test. It was not possible to measure the hardness of Metco 204C-XCL due to its porosity.
7.2.3 Pistons after engine testing - Microhardness
Due to the high cost of the prototypes, microhardness study of the cross-sections before engine testing
was not performed. The hardness of the pistons was measured after following the profile in the cross
sections. The aim was to identify differences in hardness according to the response to the thermal
conditions. The profile was divided in five sections for the hardness differentiation, see Figure 7:8. An
automatic following of the edge’s profile was attempted in the software without success. Then the
profile for the hardness measurements was done by a manually drawn pattern along the edge. Only the
top coat region was tested by the indents.

68
Figure 7:8. Sections in which the profile was divided for microhardness study.
The average hardness results are presented in Table 7-4.
Table 7-4. Average hardness values in HV for TBC top coating along the profile presented in five different sections.
Coating Sample Section 1 Section 2 Section 3 Section 4 Section 5
Metco 143 539 499 483 378 373
Top coat Metco 204C-XCL -- -- -- -- --
Metco 204F 721 629 425 341 531
Coating Metco 143 exhibits a decreasing trend in hardness from section 1 to section 5. Coating Metco
204F exhibits also a decreasing trend from section 1 to section 4. The first assumption to explain the
behaviour of Metco 143 is concerning the effect of the heat from the combustion as the flame impacts
more directly zones 3 and 4. The hardening effect from the TiO2 under heat treatment may be
overshadowed by the weakening effect in the YSZ. The second assumption is from the manufacturing
method. Depending on the position of the gun, the impact force of the coated particles could have been
less in lower regions since they might be more distant to the depositing surface. In the same way, a
longer distance means longer trajectories and hence the cooling might be slightly more significant for
them.
7.3 Scanning Electron Microscope (SEM)
A Scanning Electron Microscope produces images by the interaction of electrons with the atoms in the
sample, rather than photons (light) as in the case of the light optical microscopy. The most common
way of detection is by the secondary electrons that are excited as the electron beam impact the surface.
This method provides information from the sample’s surface topography. The SEM can work in either
vacuum, low vacuum or in wet conditions (in environmental SEM) and achieve resolutions better than

69
1 nanometre, much higher than the LOM. The images by the SEM are given in black/white by the
software, therefore a change in contrast and brightness or artificial colouring is needed to give a better
visual impression. The samples are required to be electrically conductive (at least the surface) and
electrically grounded to prevent the accumulation of electrostatic charge at the surface. Sputtering
electrically conductive materials on the surface solves this problem [77].
7.3.1 Coin samples before thermal cycling test - SEM
An SEM study of the samples was done to observe the surface properties in as-coated conditions
before and after thermal cycling test. In this section the procedure of the SEM sample observation
before thermal cycling is presented. 1000X magnification was used at 60 Pa (low vacuum) and the
VPSE G3 Zeiss detector due to the low-conductivity of the samples. The software from SEM by Carl
Zeiss was used for data interpretation. Previous tests were undertaken at high vacuum and SE2
detector with overmuch glow and brightness hindering a good quality of the pictures.
In Figure 7:9 (left side picture) it is presented a microstructure taken at 1000X magnification of
Metco 143 in as-coated conditions. The right side picture shows an enlargement of the original picture.
Several cracks oriented in multiple directions are distinguished in the melted parts of the surface. They
may indicate layer levels. Also molten particles with smooth appearance are distinguished in the right
upper corner which differs from non-molten particles with a rougher appearance located in the right
lower corner. The appearance of the overall surface is practically the same regardless of the thickness,
therefore only one picture is presented for both Metco 143 in 500 µm and 1000 µm.
Figure 7:9. SEM microstructure at 1000X of Metco 143 in as-coated conditions (left side picture). The right side picture
shows an enlargement of the original picture.
A spectrum identification of the elements present in the coating is shown in Figure 7:10. The study
shows majorly an atom concentration of Y and Zr with a minor concentration of Ti and O. This
confirms the manufacturer’s description of the coating elements.
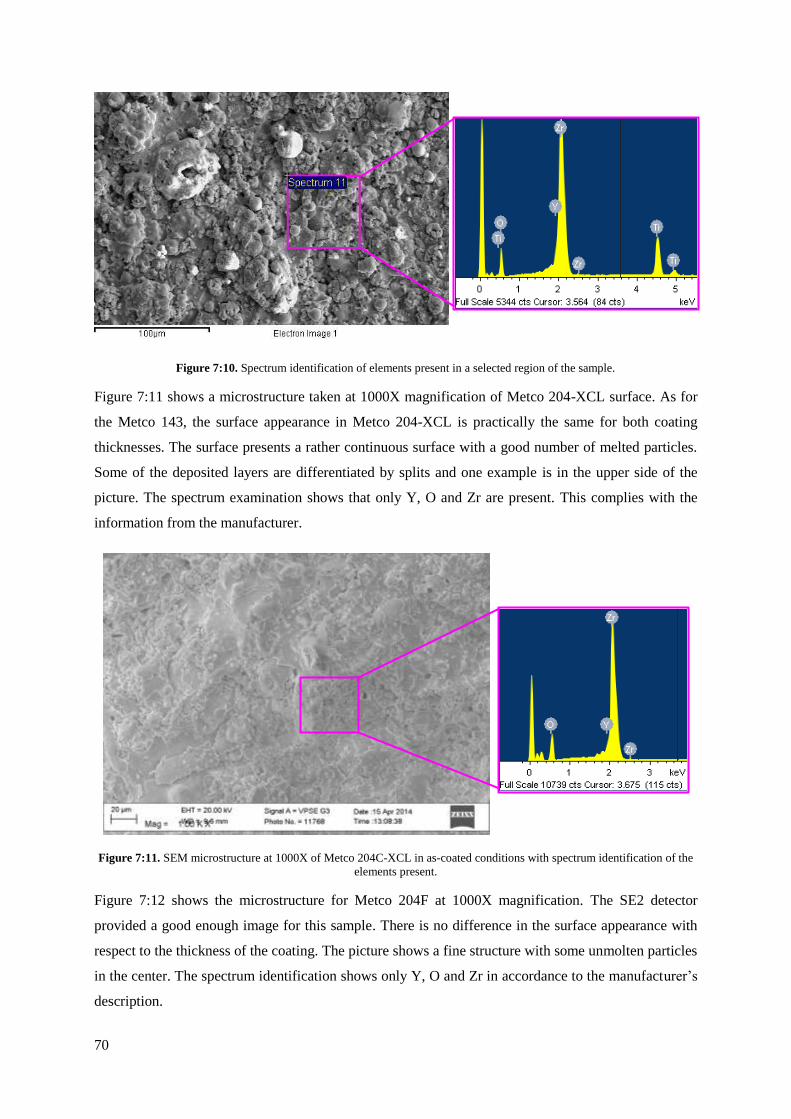
70
Figure 7:10. Spectrum identification of elements present in a selected region of the sample.
Figure 7:11 shows a microstructure taken at 1000X magnification of Metco 204-XCL surface. As for
the Metco 143, the surface appearance in Metco 204-XCL is practically the same for both coating
thicknesses. The surface presents a rather continuous surface with a good number of melted particles.
Some of the deposited layers are differentiated by splits and one example is in the upper side of the
picture. The spectrum examination shows that only Y, O and Zr are present. This complies with the
information from the manufacturer.
Figure 7:11. SEM microstructure at 1000X of Metco 204C-XCL in as-coated conditions with spectrum identification of the
elements present.
Figure 7:12 shows the microstructure for Metco 204F at 1000X magnification. The SE2 detector
provided a good enough image for this sample. There is no difference in the surface appearance with
respect to the thickness of the coating. The picture shows a fine structure with some unmolten particles
in the center. The spectrum identification shows only Y, O and Zr in accordance to the manufacturer’s
description.

71
Figure 7:12. SEM microstructure at 1000X of Metco 204F in as-coated conditions with spectrum identification of the
elements present
7.3.2 Coin samples after thermal cycling test - SEM
A SEM study was performed on the surfaces of the coins after the thermal cycling. It is distinguished
on Figure 7:13 two pictures from before and after testing of a sample of Metco 143 in 500 µm. A more
sintered resembling structure is seen in the sample after testing. Most of the particles in the sample
after testing exhibit a smoother appearance than in those before testing. Apart from that, no visible
changes are observed in the sample after testing. No cracks were found in the surface which indicates
that the thermal stresses might not have been strong enough to break the structure.

72
Figure 7:13. Microstructure of Metco 143 in 500 µm from before and after thermal cycling.
Figure 7:14 shows the surfaces of Metco 143 in 1000 µm at a magnification of 110x (left side picture)
and 1000X (right side picture). Two big cracks can be differentiated in the left side picture extending
across the microstructure. On the right side picture one of these cracks is enlarged. The crack may
have initiated from the thermal stresses but another suspicion is that the substrate material may have
included these cracks from the beginning. According to the theory, the surface of the material at
1000 µm would present a higher surface temperature than at 500 µm and the substrate temperature
would be the same for both cases. After the cooling cycle the thicker sample would experience a
bigger thermal gradient and thus thermal stresses. The micro-cracks originated in the surface may not
have a radical effect on the heat insulation to the substrate material.
Before Thermal Cycling
After Thermal Cycling

73
Figure 7:14. Microstructure of Metco 143 in 1000 µm from after thermal cycling. The left side picture shows the surface at
110x magnification and the right side picture at 1000X magnification.
The coating Metco 204C-XCL from after and before thermal cycling is shown below in Figure 7:15.
After the thermal cycling the deposited plaques testing have less defined edges. From a visual
observation it is seen from before and after the testing that the average number of splits (with the
appearance of big cracks) separating the outermost layers is kept. In Figure 7:16 it is shown an
enlargement from the previous figure after thermal cycling. On the left side there is a particle that
appears to be broken by the thermal effect. Open porosity on the surface is observed after the rupture.
It is also observed the splits that separate the top layers indicated by the green arrows. It is not possible
to observe any major difference from before and after the testing in the structure. The temperatures
achieved with the thermal cycling, along with the duration of the test may not have exceeded the
material’s service temperature.
Figure 7:15. Microstructure of Metco 204C-XCL in 500 µm from before and after thermal cycling.

74
Figure 7:16. Enlargement of microstructure of Metco 204C-XCL from after thermal cycling showing details in the surface
Finally, a microstructure of Metco 204F is shown in Figure 7:17. In the left side picture a
microstructure from before thermal cycling is shown while in the right side picture a microstructure
from after thermal cycling. In the sample after thermal cycling, it is shown a crack running along the
microstructure indicated by yellow arrows. The crack can be originated from the expansion of the
plaques from the segmented structure.
Figure 7:17. Enlargement of microstructure of Metco 204F in 500 µm from after thermal cycling showing details in the
surface
7.3.3 Pistons after engine testing - SEM
Due to the high cost of the prototypes, SEM study of the cross-sections before engine testing was not
performed. Figure 7:18 shows a metallography of Metco 143 in 1000 µm at 250X. This coating failed
to withstand the conditions in the engine, evidencing a major crack that penetrated through it. The
cracks were located in the center of the piston bowl. In the image a crack runs across the surface. The
crack is magnified in Figure 7:19 at 1000X. EDX chemical identification was performed and results
are presented in Figure 7:20. Point 1 was selected in a region covered by soot. The characteristic

75
elements from the study are C, Ca and Zr. Point 2 shows a majority of Zr and C, Ca and Ti. It is
possible to see that the soot content is spread on the surface.
Figure 7:18. Piston with Metco 143 in 1000 µm at 250X.
Figure 7:19. Piston with Metco 143 in 1000 µm at 1000X.
Figure 7:20. EDX chemical identification of Metco 143
Point 1 Point 2
Point 1
Point 2
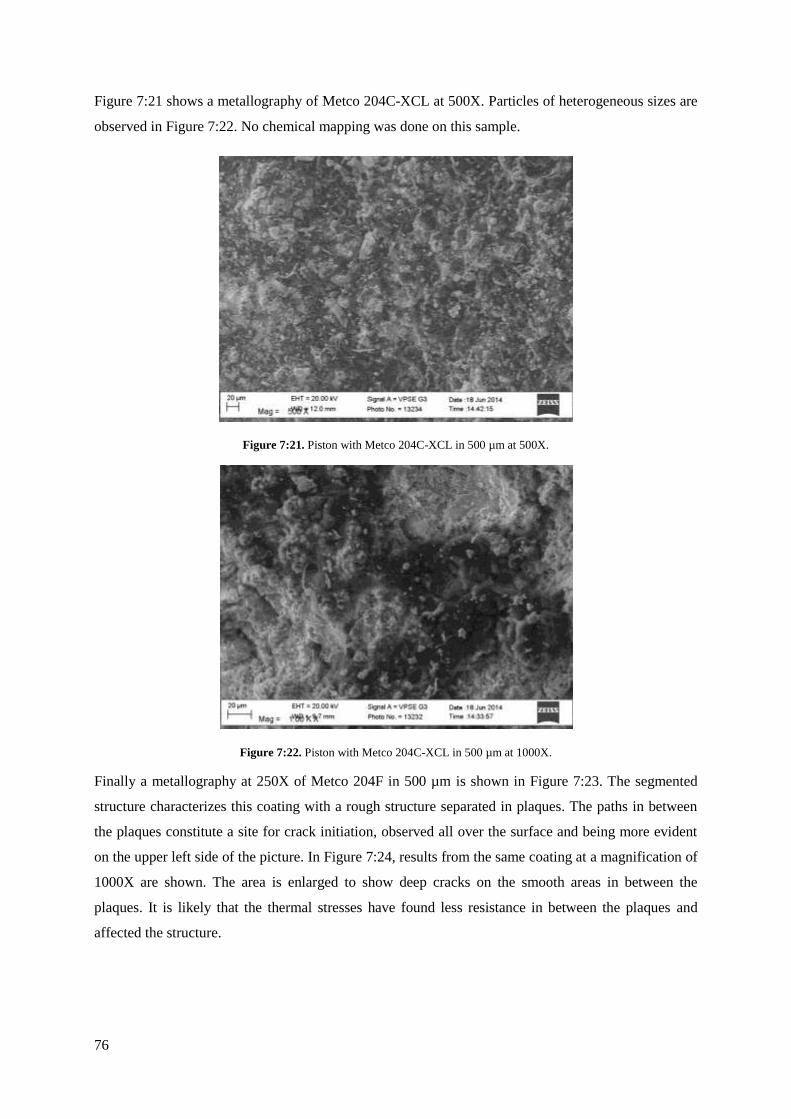
76
Figure 7:21 shows a metallography of Metco 204C-XCL at 500X. Particles of heterogeneous sizes are
observed in Figure 7:22. No chemical mapping was done on this sample.
Figure 7:21. Piston with Metco 204C-XCL in 500 µm at 500X.
Figure 7:22. Piston with Metco 204C-XCL in 500 µm at 1000X.
Finally a metallography at 250X of Metco 204F in 500 µm is shown in Figure 7:23. The segmented
structure characterizes this coating with a rough structure separated in plaques. The paths in between
the plaques constitute a site for crack initiation, observed all over the surface and being more evident
on the upper left side of the picture. In Figure 7:24, results from the same coating at a magnification of
1000X are shown. The area is enlarged to show deep cracks on the smooth areas in between the
plaques. It is likely that the thermal stresses have found less resistance in between the plaques and
affected the structure.

77
Figure 7:23. Piston with Metco 204F in 500 µm at 250X.
Figure 7:24. Piston with Metco 204F in 500 µm at 1000X.
A EDX chemical identification, shown in Figure 7:25, was done at two points on the piston surface to
check for the presence of oxides and other materials. The location of the points is shown in Figure
7:23. The analysis in Point 1 shows a place on the top of the surface in the centre of a plaque. The
identified elements are Zr, Ca, C and O. Point 2 was taken in a region where the segmented plaques
are separated and the identified elements are Ca, C, Zr, Na and O. Unlike the previous sample, the
appearance of soot is proven both in Point 1 and Point 2 from the appearance of C. Ash from
combustion is represented by Ca and Na.
Point 1
Point 2

78
Figure 7:25. EDX chemical identification of Metco 204F
7.4 Differential Scanning Calorimetry (DSC)
The Differential Scanning Calorimetry is a technique which measures the difference in heat amount
required to raise the temperature of the sample. This property of material is called the heat capacity
and is defined as the amount of heat required to raise the temperature of an object by one degree. The
unit is J/g·K [5]. The DSC allows even to notice the temperature of phase transition in materials that
exhibit one and determine the enthalpy associated with it. Depending on the type of transition more or
less energy might be required to rise the sample temperature. For example, as a solid melts to liquid it
requires more energy since the transition is endothermic interpreted as peaks in the DSC. On the
contrary, when the sample cools down and experiences phase change less energy is required since the
process is exothermic interpreted as valleys in the DSC. The required energies are compared with the
well-defined heating curve of a baseline reference material and the temperatures of transition can be
determined. The samples were analyzed using a Netzsch DSC 404C, Figure 7:26 and Proteus(R)
Netzsch software [78] [81]
Figure 7:26. Netzsch DSC 404C [84].
Point 1 Point 2

79
Figure 7:27 presents the specific heat capacity of the substrate steel in the temperature range between
45 °C and 1180 °C. At 758 °C a major increase in the heat capacity is observed, which is related to the
endothermic phase transition from/to pearlite in the material.
Figure 7:27. Heat capacity of the substrate steel over a range of temperatures 45 °C – 1180 °C.
Figure 7:28 shows the specific heat capacity of the three coatings over the temperature range 45 °C to
1180 °C. The Metco 143 exhibits a negative slope after 292 °C. The TiO2 content in the coating
influences this behaviour. It will also show a lower service temperature in comparison to the other two
coatings. A low heat capacity is desired for fast response insulation in the combustion chamber in the
wall side in contact with the gas. A small amount of heat results in a high temperature change. The
Metco 204C-XCL continuously raises in the whole temperature range. Metco 204F continuously
exhibits a slightly positive slope until 755 °C where it levers outs reaching its maximum, and then
slightly decrease until end of the measurement range.
0
0,5
1
1,5
2
2,5
0 200 400 600 800 1000 1200
Spec
ific
hea
t, c
p /
J∙g
-1∙K
-1
Temperature, T/°C
Substrate steel

80
Figure 7:28. Heat capacity of the Metco 204F over a range of temperatures 45 °C – 1180 °C.
7.5 Thermal diffusivity (Laser Flash)
A laser flash analysis determines the thermal diffusivity of a material by measuring the thermal
response with time. An energy input heats one side of the sample and the temperature rise on the
opposite parallel side. The temperature increase is time dependent and thus is used to determine the
speed of the heat propagation. The thermal diffusivity is calculated using equation (14),
∝=0.1388 L2
t1/2 (14)
where is the thermal diffusivity, L is the thickness of the sample, t1/2 is the time to reach half of the
maximum temperature on the opposite side of the sample. The higher the thermal diffusivity, the faster
the energy reaches the backside of the sample. Preferably fully dense samples are to be measured, but
a low porosity is acceptable. This test method is applicable to homogeneous and isotropic solid
materials that are opaque to the applied energy pulse. Moreover, the samples should be covered by a
graphite layer, to reduce the glossy effect, which efficiently converts the laser pulse into heat energy.
An illustration of the Laser Flash Apparatus Netzsch LFA 427 is shown in Figure 7:29 [52] [82]
0,2
0,3
0,4
0,5
0,6
0,7
0,8
0 200 400 600 800 1000 1200
Spec
ific
hea
t, c
p /
J∙g
-1∙K
-1
Temperature, T/°C
Specific Heat Study
Metco 204C-XCL
Metco 204F
Metco 143

81
Figure 7:29. Laser Flash Apparatus Netzsch LFA 427 [83].
During the measurement the sample is positioned inside the cylinder container on top of the
instrument. Adiabatic conditions are assumed to be present inside the container. The heat is supplied
through a laser emitter from the bottom of the sample and then it gets irradiated. A photovoltaic
infrared detector monitors the temperature on the other side of the sample. To avoid oxidation, high
purity argon gas (99.99%, AGA, Sweden) is used as ambience at the flow rate 100 ml/min.
Thermal diffusivity was measured using reference steel coin samples and steel coin samples with
TBC. Ideally, a single layer material of thermal barrier coating was supposed to be tested. However,
we did not have such a sample. Because of that, results represent the thermal diffusivity for composite
material, made of piston steel coin coated with a bond coat and respective TBC coating. Therefore,
only an apparent thermal diffusivity value was obtained. A zero contact resistance was assumed
between the ceramic and substrate layers.
The heating rate was 10 K/min and the temperature stability 0.3 K/30 s. Measurements were done in
the temperature range between room temperature and 600 °C with a step of 200 °C. At each
temperature, five measurements were taken (ten at room temperature).
Figure 7:30 shows thermal diffusivity as a function of temperature for all coatings with a 500 µm
thickness. Metco 204F exhibits the highest thermal diffusivity followed by Metco 204C-XCL and
lastly Metco 143. Higher thermal diffusivity is caused by low porosity and dense structure of the
coating. The real thickness of Metco 143 of more than 700 µm has definitely influenced the results,
decreasing the values for this coating.

82
Figure 7:30. Thermal diffusivity in a function of temperature for Metco 143, Metco 204C and Metco 204C-XCL in 500 µm.
Figure 7:31 shows the thermal diffusivity as a function of temperature for all coatings of a 1000 µm
thickness. The trend is kept and Metco 204F exhibits the highest thermal diffusivity followed by
Metco 204C-XCL and lastly Metco 143. Overall, the Metco 204C-XCL and Metco 143 samples show
quite similar results. The thermal diffusivity of Metco 204F decreases around 30% in comparison to
the 500 µm coating. The values of Metco 204C-XCL and Metco 143 decrease with about 50%. The
real thickness of Metco 143 is about 1400 µm.
Figure 7:31. Thermal diffusivity in a function of temperature for Metco 143, Metco 204C and Metco 204C-XCL in
1000 µm.
0
2
4
6
8
10
12
0 100 200 300 400 500 600 700
Ther
mal
dif
fusi
vity
, α /
mm
2∙s
-1
Temperature T/°C
Apparent thermal diffusivity
Metco 143
Metco204C-XCL
Metco 204F
0
2
4
6
8
10
12
0 100 200 300 400 500 600 700
Ther
mal
dif
fusi
vity
, α /
mm
2∙s
-1
Temperature T/°C
Apparent thermal diffusivity
Metco 143
Metco204C-XCL
Metco 204F

83
7.6 Thermal Cyclic Loading
Thermal cycling is a process of high temperature variations at high rates of change. It aims to test the
endurance and reliability of the product over time when stress cyclic conditions induce failure through
thermal fatigue. The thermal cycling tests were carried out on a specifically designed rig for this
application. The test rig can be observed in Figure 7:32 (left side picture). A focus on the mounted
coin is seen in the right side picture. The rig is conformed of the heating medium, cooling medium and
the mobile elements. The heat is provided by a flame of oxy-acetylene using a nozzle commonly used
to heat aluminium and with a material thickness of 0.2-0.5 mm. The nozzle was located approximately
14 cm above the sample’s top surface at a constant distance. Cooling was performed using compressed
air flowing at 7-8 m/s.
Two coin samples (12.5 mm) can be tested simultaneously in the rig due to double cooling locations
and automatic sideways movement. While one sample is being heated in the centre position in the rig,
the second is positioned below the cooling flow either on the left or the right side. Afterwards the
samples move to the side and change their positions. A single cycle consists of one heating and one
cooling phase and it takes 30s. For the TBC testing the interval of 15s heating time and 15s of cooling
was chosen. The surface temperature is measured on both sides of the sample. The top surface
temperature is measured with a pyrometer while the bottom surface temperature is measured with the
thermocouple attached to it. The gradient between the top and bottom surface temperature could be
used to estimate the heat flow. To prevent the flame to heat up the side walls of the sample or to burn
the thermocouple below, ab alumina fibre insulation is used to wrap the sample while testing. In
Table 7-5 the number of cycles to which each sample was subjected is presented.
Figure 7:32. Thermal cycling fixture showing a flame from oxy-acetylene (left hand side picture) and the cooling stage (right
hand side picture)

84
Table 7-5. Number of cycles in the thermal cycling testing for all samples
Thickness
[µm] Type of coating Number of cycles Endurance
Metco 143 595 cycles OK
500 Metco 204C-XCL 270 cycles OK
Metco 204F 300 cycles FAILED
Metco 143 595 cycles FAILED
1000 Metco 204C-XCL 250 cycles OK
Metco 204F 250 cycles OK
A bigger temperature difference between the top surface and the bottom surface of the coin samples
was observed for the thick coatings. The thick samples exhibited a higher surface temperature. This is
probably due to the thermal conductivity, which has a larger influence on the thick samples, allowing
them to transfer less energy. For all samples, when they were put directly below the cooling air, the
response in the bottom layer was not immediate. It needs a few seconds before its temperature starts to
decrease. The thicker the coating, the longer the time is needed to transfer all energy in the form of
lattice vibrations. More accurate values for the emissivities for the samples, considering their surface
roughness, would give the information needed to conclude upon the exact transfer of heat through
them.
Two coin samples showed failure to withstand thermal cycling test at the given cycles, Metco 204F at
500 µm and Metco 143 at 1000 µm. Presumably it would have taken several more cycles for the other
samples to fail. The coating from Metco 143 detached completely from the substrate surface. Its
pictures can be observed in the section “Coin samples after thermal cycling test – SEM”. Metco 204F
presented small cracks running along the surface. Its pictures can be observed in the sections “Coin
samples after thermal cycling test – LOM” and in “Coin samples after thermal cycling test – SEM”.

85
8 Discussion of Results
This study aimed to prove the behaviour of thermal barrier coatings under real conditions in the engine
and study the engine performance. It also strove to study the effect from the thermodynamics of
combustion and products in the thermal barrier coatings performance and integrity as insulators.
The nominal thickness of all ordered TBC was 500 µm and 1000 µm respectively. During coin sample
examinations with the LOM, described in section 7.1.1, it was observed that only coatings of Metco
204F and Metco 204C-XCL were within the requested thickness range. However, the coating of
Metco 143 was delivered with a thickness of 750 µm and 1500 µm. Additionally, during piston cross-
sections examination, large differences in the local coating thicknesses were observed inside the piston
bowl. These values were in the range between 100 µm and 1000 µm. Besides, a porosity gradient was
observed for the Metco 143 coating. An EDX mapping confirmed the appearance of the chemical
elements in accordance to the specification for each coating. Cross-section microhardness
measurements revealed a higher hardness of Metco 204F coating than for the Metco 143 coating. The
high porosity of Metco 204C-XCL coating made hardness determination impossible with the applied
method.
As presented in section 7.4, DSC measurements indicated the decrease of the heat capacity as a
function of temperature for Metco 143, while two other materials exhibited a positive slope with
temperature. At about 750 °C, the Metco 204F curve levered out to reach its maximum, whereas the
Metco 204C-XCL curve continued to increase until the end of measurement range. The inflection
points evidenced a phase change of the coatings. A laser flash measurement showed a lower apparent
thermal diffusivity for thick rather than for thin coatings. For each material thickness, the apparent
thermal diffusivity decreased inversely with the porosity.
During the thermal cycling test discussed in section 7.6, Metco 143 coating failed mechanically by
spallation after 595 cycles. Other defects however could not be observed for any coating with a visual
observation. Also, the LOM analysis illustrated that extensive horizontal cracks running along the
coating were revealed for Metco 204F sample. Additional minor cracks on the surface were found
under SEM observation for the same material. No noticeable changes were observed for the 204C-
XCL coating after thermal cycling test.
One of the initial purposes of the master thesis was fulfilled during engine testing and the results from
the TBC coated pistons in comparison to the uncoated reference pistons. The principle was first
commented in section 2.3. The results can be combined with the tests performed by Vogelsang [15] on
the spare of energy at the piston and efficient cooling. For all TBC coated pistons lower heat transfer

86
to the cooling oil was observed. As expected, thicker coatings provided better insulation than the thin
coatings. Among the thick coatings, Metco 204C-XCL (porous) and Metco 204F (segmented)
performed best. Decreased heat transfer to the cooling oil resulted in an increased exhaust gas
temperature. The negative trend in volumetric efficiency was noticed with improved insulation in
accordance to the theories deviced by Hosaka et. al. [29]. However, the absolute values changes were
not significant. TBC influence on combustion process was also of interest. During all tests with TBC
pistons, lower peak cylinder pressure and slower combustion was measured in comparison to an
uncoated reference piston. Highest differences were found for thick Metco 204C-XCL (porous) and
Metco 204F (segmented) coatings. A slower combustion process resulted in overall lower engine
efficiency. Thus improvements due to a decreased heat transfer were hard to quantify. The results
evidenced surprisingly an opposite behaviour to the basics of combustion discussed in the automotive
handbook of combustion [5] and a mutual correlation of hydrocarbons and NOX was not observed.
Hydrocarbons emission did not change significantly, NOX emission however was lower. An
explanation for this is an effect of slower combustion, lower peak cylinder temperature and thereby a
lower peak temperature. The first to discuss this was Mendera [28] and secondly Kosaka et. al [29]. A
deeper explanation of this phenomenon is not fully understood at the moment of writing this master
thesis.
During engine testing of a Metco 143 thick coating failed exhibiting an extensive spallation mark on
the surface. Other coating survived the engine testing without showing any significant changes. The
possible higher depletion of Al in Metco 143 (Gioli [73]) and the major effect of TiO2 in its brittle-
hardening behaviour towards heating (Bharatesh et. al. [79]) may have contributed to the spallation
after the engine testing. Moreover, during the LOM observation, big cracks on the interface top
coat/bond coat were observed for all the samples. These originate from a thin section of the coating
inside the piston bowl in the region where the flame impacts more directly to the surface. It is assumed
that the rest of the coatings would withstand more hours in service without presenting similar
spallation marks.
For the Metco 143 coating a spallation was also observed after the thermal cycling test. From the DSC
study in section 7.4, if taking into the consideration that a decrease of the heat capacity with the
temperature occurs, it might be assumed that the surface temperature of this coating experiences a
greater temperature variation than the other two coatings. Additionally, as commented in section 5.3.2,
the specified service temperature of this coating is limited to 950 °C, while in the other tested coatings
are limited to 1250 °C. All this together with too large thickness and big thickness variation along the
piston profile suggests that the choice of Metco 143 for TBC material as a coating is not recommended
in the future.

87
LOM observations of Metco 204F coatings after engine testing revealed that cracks could be found on
the top coat/bond coat interface. Long cracks parallel to the surface were also found in the samples
from the thermal cycling test. However, those cracks were inside the top coat, not on the interface. As
observed in section 7.3.3, an SEM analysis of the piston samples after engine test, showed spacing
between plaques which origins from the thermal stress, additionally cracks were observed in the
spacing. EDX examination proved the existence of soot in the spacing. As commented in the
introductory part 1.3 this is unwanted for its influence on an increased radiation. The hardness of the
material was reduced after testing, which results in weakening of the intermolecular bonds. Dense
structure of the coating and low porosity resulted in higher apparent thermal diffusivity which is
unwanted for thermal barrier coatings.
Metco 204C-XCL coating with a porosity of 10.6% withstood better than the other two tested coatings
the conditions in the engine testing and the thermal cycling. No major changes were observed in the
surface in the SEM study. However, the after thermal cycling surface fracture was spotted, which
exposed an open porosity (section 7.3.2). Shulz et. al. [59] commented on the relatively lower
durability of the APS based coatings in comparison to other methods. LOM observations evidenced
the appearance of cracks after the engine testing in the regions with direct impact of the flame. Along
with its low conductivity, this material possesses also a low apparent thermal diffusivity. This results
in a good thermal protection and the best thermo-physical properties from all tested coatings. This
goes in along with the theoretical background presented in section 4.1.

88
9 Conclusion
Based on the results from this master thesis, the most relevant results can be summarized as follows:
Engine tests
+ Decreased heat transfer to the cooling oil
+ Increased exhaust gas temperature
+ No significant changes in volumetric efficiency
- Decreased overall engine efficiency due to a slower combustion
Material examination
+ Coating thickness and porosity improve thermal insulation and decrease thermal diffusivity
+ No TGO created under testing conditions
- Uneven coating distribution with current coating method (pistons, TiO2)
- After engine testing, cracks (inside the coating) were observed for all materials, surface
cracks in TiO2 containing TBC and segmented
- TiO2 containing TBC failed during rig and engine testing

89
10 Further work
In the further work with the thermal barrier coating the most important is to understand why the
decreased heat transfer deteriorates the combustion and thus reduces engine efficiency. This problem
has to be solved in the first place, before any improvements from the TBC can be achieved. To be able
to do that, the parameters which were changed with TBC implementation should be listed and tested
separately. Such parameters are e. g. surface roughness, porosity, increased gas viscosity, changed heat
convection or radiation. Such predictions were first commented by Wahiduzzaman and Morel [30]
[31]. It would also be interesting to investigate TBC on other components of combustion chamber like
cylinder head or liners.
In the material field of research, the coating process should be improved at first to be able to achieve
equally thick layers even on the curved surfaces e.g. inside the piston bowl.
As the theoretically possible low heat conductivity and heat capacity is not yet achieved with today
available materials, further development should take place. An interesting solution would be to test
aero-gel coating types which can withstand high temperature and pressure conditions.
In the further studies it is also recommended to use laser flash test to estimate the apparent thermal
diffusivity of each material separately, instead of a component, consisting of substrate, bond coat and
top coat in one. This would make possible the calculation of heat conductivity coefficient for each
material much easier.
A study of a coating emissivity at defined surface roughness can improve the accuracy of the surface
temperature measurement and estimate the actual heat transfer through the coating in thermal cycling
experiment.
In this master thesis the microhardness was evaluated on the cross-sections of the coatings, hence in a
parallel direction to the surfaces. Additional perpendicular to-the-surface measurements are
recommended.
All the attempts to calculate the hardness of Metco 204C-XCL were unsuccessful. A gradual testing of
hardness until the mark of the indent is seen in a function of force could be a feasible solution to
determine the hardness in the porous coating.
90
11 References
0. International Energy Agency. Technology Roadmap. Fuel Economy of Road Vehicles.
www.iea.org. OECD/IEA, 2012. Consulted on June 26th, 2014.
1. DieselNet Technology Guide. Copyright © 1997-2014 ECOpoint Inc. Available at:
http://www.dieselnet.com/tg.php#basics
2. Autoevolution. © 2008-2014 SoftNews NET. http://www.autoevolution.com/news/two-stroke-vs-
four-stroke-motorcycle-engines-19664.html
3. 2-Stroke Engine Applications & Lubrication. BesetSyntheticOil.
http://bestsyntheticoil.com/amsoil-synthetic-motor-oil-filter-info/synthetic-petroleum-motor-oil-
info/2-stroke-engine-applications-lubrication/. Consulted on June 27th, 2014.
4. R. Stone. Introduction to Internal Combustion Engines. Palgrave Macmillan. 4th Edition. (2012)
5. Automotive Handbook. BOSCH Invented for live. Ed. Wiley. 8th Edition. (2011)
6. C. Chartier. Spray Processes In Optical Diesel Engines. Doctoral thesis. Lund University (2012)
7. O.I. Smith. Fundamentals of Soot Formation in Flames with Application to Diesel Engine
Particulate Emissions. Prog Energy Combust Sci, 7(1981), pp. 275-291
8. J. Dec. A Conceptual Model of DI Diesel Combustion Based on Laser-Sheet Imaging. SAE
Technical Paper 970873, 1997. Doi:10.4271/970873
9. European emission standards. Available at: https://www.dieselnet.com/standards/eu/hd.php
10. Combustion. Academic Press, San Diego (1996)
11. Tree, D.R., Svensson, K.I., Soot processes in compression ignition engines, Progress in energy
and Science 33 (2007) pp. 272-309.
12. H. Dembinski. In-cylinder Flow Characterisation of Heavy Duty Diesel Engines Using
Combustion Image Velocimetry. Doctoral thesis in Machine Design. The Royal Institute of
Technology (2014)
13. Platinum Metals Review. Published by Johnson Mathey Pic. Available at:
http://www.platinummetalsreview.com/article/52/1/23-37/
14. Thermo-and Fluid dynamic processes in Diesel Engines. Universidad Politécnica de Valencia.
September 7th-10
th, 2004.
15. C. Vogelgsang. Influence of Piston Cooling on BTE and Emissions. Master thesis. Clausthal
University of Technology (2013)
16. F. Incropera, D. De Witt. Fundamentals of Heat and Mass Transfer. John Wiley and Sons. Fourth
Edition (21996).
17. Absorption, Emission, Reflection and Scattering. http://www.ssec.wisc.edu/
library/coursefiles/03_abs_emiss_ref.pdf. Consulted on May 11th, 2014.
18. Google search: Cross section combustion chamber with piston. Consulted on June 19th, 2014.

91
19. F.Yu and T.D.Bennett. A nondestructive technique for determining thermal properties of thermal
barrier coatings. J. Appl. Phys. (2005).
20. K. Mendera. Effectiveness of Plasma Sprayed Coatings for Engine Combustion Chamber. SAE
Technical Paper Series. (2013).
21. Thermal protection. Oerlikon metco. http://www.oerlikon.com/metco/en/products-
services/coating-services/customer-support/surface-functionalities/surface-functionalities-thermal-
protection/. Consulted on June 19th, 2014.
22. D. Clarke, M. Oechsner, N. Padture, Thermal-barrier coatings for more efficient. Materials
Research Society. Cambridge University Press. October 2012.
23. Thermal Barrier Coating. Thomasl.net. http://www.thomasnet.com/articles/chemicals/coating-
thermal-barrier. Copyright© 2014
24. E. Jarvis, E. Carter. The Role of Reactive Elements in Thermal Barrier Coatings. HPC and
National Security. (2002)
25. M. Azadi, G.H. Farrahi, A. Moridi. Optimization of Air Plasma Sprayed Thermal Barrier Coating
Parameters in Diesel Engine Appplications. Journal of Materials Engineering and Performance. (c)
ASM International. (2013)
26. D. Clarke, S. Phillpot. Thermal barrier coating materials. Materialstoday. Elsevier Ltd (2005)
27. Xu, Huibin Guo, Hongbo (2011). Thermal Barrier Coatings. Woodhead Publishing. Nanyang
Technological University, Singapore.
28. K. Mendera. Conduction of Heat in Thermal Barrier Coatings. Archives of Thermodynamics. Vol
17 (1996).
29. H. Kosaka et. al, Concept of “Temperature Swing Heat Insulation” in Combustion Chamber Walls
and Appropriate Thermo-physical Properties for Heat Insulation Coat. Toyota Motor Group. SAE
International. Copyright (c) 2013.
30. Wahiduzzaman S., Morel T.: Effect of Translucence of Engineering Ceramics on Heat transfer in
Diesel Engines. Report DE92-041384, 1922 (abstract)
31. Wahiduzzaman S., Morel T.: Effects of Ceramic Translucence on Heat Barrier Effectiveness in
Diesel Engines. SAE Paper 890569..
32. K. Mendera. Effectiveness of Plasma Sprayed Coatings for Engine Combustion Chamber. SAE
Technical Paper Series. (2000).
33. Siegel R. Spuckler CH.: Anallysis of Thermal Radiation Effects on Temperatures in Turbine
Engine Thermal Barrier Coatings. Material Science and Engineering A245 (1998), 150-159
34. K. Mendera. Effects of Plasma Sprayed Zirconia Coatings on Diesel Engine Heat Release. Journal
of KONES. Internal Combustion Engines. Vol. 7, No -2, (2000).
35. Specific heats: the relation between temperature change and heat.
http://web.mit.edu/16.unified/www/FALL/thermodynamics/notes/node18.html. Consulted on June
15th, 2014.
92
36. D. W. Richerson, Modern Ceramic Engineering. Dekker. Second Edition. (1992). p.p. 135-143.
37. P.G. Klemens, M. Gell. Thermal Conductivity of Thermal Barrier Coatings. Materials Science and
Engineering. ElSEVIER. (1998)
38. International Zinc Association. Copyright ©2011 International Zinc Association
http://www.zinc.org/basics/zinc_uses. Consulted on May 5th, 20
39. Hendy, C.R.; Iles, D.C. (2010) Steel Bridge Group: Guidance Notes on best practice in steel
bridge construction (5th Issue). (P185). SCI
40. Act Clean. The way to Cleaner Production. http://act-clean.eu/index.php/Reduction-of-zinc-
consumption-in-the-hot-dip-;100.315/1. Consulted on May 5th, 2014.
41. Nordic Galvanizers. Steels Suitable for Galvanizing.
http://www.nordicgalvanizers.com/narvar/Steelssuitableforgalvanizing.htm. Consulted on April
10th, 2014.
42. J. Vanpaemel et. al. Electrochemical Deposition of Subnanometer Ni Films on TiN. Langmuir.
ACS Publications. pubs.acs.org. (2014) American Chemical Society.
43. Sherardize UK Ltd. http://www.sherardize.co.uk/products-sherdardize-introducton.html.
Consulted on April 11th, 2014.
44. Surface Coating. Encyclopædia Britannica. (2014)
45. Advanced Polymer Coatings. High Performance Protective Coatings For Industry.
http://www.adv-polymer.com/index.asp. Consulted on May 2014.
46. S. H. Cho, H. M. Andersson, S. R. White, N. R. Sottos, P. V. Braun, Adv. Mater. 2006, 18, 997.
47. S. Hyoun Cho, S. White, P. Braun. Self-Healing Polymer Coatings. Advanced Materials. Wiley
InterScience. WILEY-VCH (2009).
48. Aerogel Technologies, LLC. Copyright © 2011-2014, All Rights Reserved. www.airloy.com.
Consulted on February 2014.
49. Thomasnet.com. Copyright© 2014 Thomas Publishing Company. All Rights Reserved.
http://www.thomasnet.com/articles/chemicals/ceramic-coating-metals. Consulted on April 11th,
2014.
50. F. Gallino, C. Di Valentin, G. Pacchioni. Band gap engineering of bulk ZrO2 by Ti doping. The
Royal Society of Chemistry. Published September 2011
51. Cubic zirconia single crystals. sundoc.bibliothek.uni-halle.de/diss-online/01/01H078/t4.pdf.
Consulted on April 13th, 2014.
52. Sathis, Jojo (2013). Thermophysical and mechanical properties of TBC. Master thesis 2013.
Tekniska Högskolan i Jönköping.
53. Sulzer Metco. An introduction to plasma spray, Sulzer Manual. www.sulzer.com.
54. N. Hegazy, et. al. Effect of Plasma Sprayed Alumina Coating on Corrosion Resistance. Aerospace
Sciences & Aviation Technology. ASAT-13. May 2009.

93
55. Thermal Spray Materials Guide. Technical guide. Sulzer Metco.
http://www.oerlikon.com/metco/en/products-services/coating-materials/coating-materials-thermal-
spray/. DSMTS-0071.0 Chromium Oxide 40% Titanium Oxide Powder. June 2014
56. CeramTec. The Ceramic Experts. http://www.ceramtec.com/ceramic-materials/aluminum-oxide/.
Consulted on May 7th, 2014.
57. Coors Tek. Amazing Solutions. Coatings. ©2013 CoorsTek, Inc.
http://www.dynacer.com/materials/coatings/ Consulted on April 11th, 2014.
58. Xu, Huibin Guo, Hongbo (2011). Thermal Barrier Coatings. Woodhead Publishing. Nanyang
Technological University, Singapore.
59. U. Schulz, B. Saruhan, K. Fritscher, C. Leyens. Review on Advanced EB-PVD Ceramic Topcoats
for TBC Applications. Applied Ceramic Technology, German Aerospace Center (DLR), Institute
of Materials Research, 2004.
60. R.E.I. Schropp, B. Stannowski, A.M. Brockhoff, P.A.T.T. van Veenendaal and J.K. Rath. Hot
Wire CVD of Heterogeneous and Polycrystalline Silicon Semiconducting Thin Films.
Mater.Phys.Mech.1 (2000).
61. J. R. Vargas, T. Goto. Thermal Barrier Coatings Produced by Chemical Vapor Deposition.
ELSEVIER. Science and Technology of Advanced Materials. Volume 4, Issue 4, 1 July 2003.
62. G. Whal, W. Nemetz, M. Giannozzi, S. Rushworth, D. Baxter, N. Archer, F. Cernuschi and N.
Boyle 2001 Chemical vapor deposition of TBG: an alternative process for gas turbine
components Trans. ASME 123 520-524.
63. D. W. Johnson. Inorganic Reactions and Methods: Formation Ceramics, Volume 18. Chapter
17.2.2.3.1. Sol-Gel p.p. 9-10. (1999).
64. Barrow et al, US patent n° 005585136A, (1996).
65. C.R. Xia, et al., Solid State Ionics 133 (2000) 287.
66. C. Viazzi, R. Wellman, D. Oquab, J. Nicholls, D. Monceau, J.P. Bonino, F. Ansart, Mater. Sci.
Forum 595–598 (2008) 3.
67. M. Patrício, R. Mattheij. Crack Propagation Analysis.
http://www.win.tue.nl/analysis/reports/rana07-23.pdf Consulted on June 17th, 2014
68. Dr.ir. P.J.G. Schreurs. Fracture Mechanics. Materials Technology.
http://www.mate.tue.nl/~piet/edu/frm/pdf/frmsyl1112.pdf Consulted on June 17th, 2014.
69. Zou and Song. 10. Oxidation and hot corrosion of thermal barrier coatings (TBCs). Thermal
barrier coatings. Woodhead Publishing. 2011. ISBN 978-1-84-569-658-0. pp. 200-202.
70. Cole-Parmer. Chemical Resistance of Fluoropolymers.
http://www.masterflex.com/TechLibraryArticle/827. Consulted on June 15th
, 2014.
71. S. Sjöström, H. Brodin. Thermomechanical Fatigue Life of TBCS - Experimental and Modeling
Aspects. Advanced Ceramic Coatings and Interfaces V. Edited by Dongming Zhu and Hua-Tay
Lin. Copyright © 2010 The American Ceramic Society.

94
72. S. Kuroda and T.W. Clyne, The Quenching Stress in Thermally Sprayed Coatings, Thin Solid
Films, 1991, 200(1), p 49-66
73. C. Giolli, et al. Failure Mechanism for Thermal Fatigue of Thermal Barrier Coating Systems.
Journal of Thermal Spray Technology. ASM International. June 2009
74. Sand Casting An Aluminum Diesel Piston With An As-Cast, Reentrant Combustion Bowl For
Light Or Medium Duty Diesel Engines. US 20130000482 A1. Data provided by IFI CLAIMS
Patent Services ©2012 Google. http://www.google.com/patents/US20130000482
75. Rapp Industrial Sales Surface Finish Equipment. Consulted on March 11th, 2014.
http://surfacefinishequipment.com/mahr%20M1.htm
76. [Ian M. Watt, The Principles and Practice of Electron Microscopy, Cambridge University Press,
second edition, (2003) page 6.
77. Electron Microscopes vs Optical (light) Microscopes. MicrobeHunter Microscopy Magazine.
http://www.microbehunter.com/electron-microscopes-vs-optical-light-microscopes/. Consulted on
April 28th, 2014.
78. Vickers Hardness Testing. MatWeb, LLC. http://www.matweb.com/reference/vickers-
hardness.aspx. Consulted on April 28th, 2014.
79. T.P. Bharathesh, et. al. Influence of Heat Treatment on Tribological Properties of Hot Forged
Al6061-TiO2 Composites. IJETAE. International Journal of Emerging Technology and Advanced
Engineering. Volume 3, Issue 6, June 2013.
80. Differential Scanning Calorimetry. PerkinElmer. Copyright © 2013. www.perkinelmer.com.
Consulted on April 30th, 2014
81. [Chapter8sixth] P. Gill, T. Moghadam, B. Ranjbar. Differential Scanning Calorimetry Techniques:
Applications in Biology and Nanoscience. Journal of Biomolecular Techniques. December (2010)
p.p. 167-193.
82. ASTM E1461-13. Standard Test Method for Thermal Diffusivity by the Flash Method.
http://www.astm.org/Standards/E1461.htm. Consulted on April 28th, 2014.
83. LFA 427. Laser Flash Apparatus / Pyrometer from Netzsch. http://www.azom.com/equipment-
details.aspx?EquipID=415. Consulted on April 28th, 2014.
84. Netzsch Instruments. http://www.hellopro.co.uk/Netzsch_Instruments-17839-noprofil-1000512-
62877-0-1-1-fr-societe.html. © 2014 Hellopro - All rights reserved. Consulted on April 30th, 2014.

A
12 Appendixes
Appendix 1. Plate mounting for rotational coating
Appendix 2. Sulzer Metco Coating system including 6 axis robot manipulator, F4 plasma torch mounted and 2 axis turn/tilt
table.

B
Appendix 3. TriplexPro-210 plasma torch with triple injection.
Appendix 4. Fixture & Masking (Piston shown not yet grit blasted)