therapeutic drug monitoring scheme guide - divc.rodivc.ro/wp-content/uploads/2016/03/ghid_tdm.pdfthe...
TRANSCRIPT

Maintaining
Quality in
Laboratory
Medicine
Therapeutic Drug Monitoring Scheme Guide

Filename: SP-QL1-TDMGUIDE1014
Approved by: A Thomas
Version 1.2 Date of Revision: 01/10/2014 Page 2 of 16
Contents
1. Scheme details and repertoire
1.1 List of Analytes and frequency of Distribution
2. Source Material and Sample Handling
2.1 Sterility
2.2 Sample stability
2.2.1 Long-term stability 2.2.2 Short-term stability
3. Statistical Analysis
3.1 Performance Criteria
3.1.1 Precision Profiles

Filename: SP-QL1-TDMGUIDE1014
Approved by: A Thomas
Version 1.2 Date of Revision: 01/10/2014 Page 3 of 16
1. Scheme Details and Repertoire
1.1 List of Analytes and Frequency of Distribution Three or four samples covering an appropriate physiological range are distributed every month. The following analytes are included in each distribution. Main TDM Scheme
ANALYTE UNITS Range
covered Amikacin mg/L 0 - 35
Carbamazepine mg/L 0 - 20
Digoxin ug/L 0 - 6 Gentamicin mg/L 0 - 20
Lithium mmol/L 0 – 2 Methotrexate umol/L 0 -1.5 Phenobarbital mg/L 0 - 60
Phenytoin mg/L 0 - 30 Teicoplanin mg/L 0 - 70 Theophylline mg/L 0 - 30 Tobramycin mg/L 0 - 12 Valproic acid mg/L 0 - 175 Vancomycin mg/L 0 - 50
Immunosuppressants –Sub Scheme
ANALYTE UNITS Range
covered Ciclosporin ug/L 0 - 400 Sirolimus ug/L 0 - 20
Tacrolimus ug/L 0 - 15 2. Source Material and Sample handling For the TDM Main Scheme, the base material is “off the clot” sterile human serum whilst sterile whole blood is used for the Immuosuppresant Scheme. All blood products are tested negative for HIV and Hepatitis B and C at donor level. The donations are collected from normal volunteers, polycaethaemic, haemachromatosis and renal patients. The base material is also screened for the presence of any therapeutic drug. Each drug is gravimetrically added to the base material to a target concentration to produce a number of pools. The “weighed-in” value of the spiked drug and its purity is used to calculate the target value. All microbalances are calibrated using certified weights allowing full gravimetric traceability. Although every effort is made to ensure that the material is free from any known infectious agent, the samples should be handled as for clinical specimens.

2.1 Sterility The serum base is filtered aseptically down to a 0.20μm, to ensure sterility. Preservatives such as sodium azide are not added as these are known to inhibit certain immuno enzymatic methods. Great care is taken to ensure that aseptic techniques are used throughout all procedures to maintain sterility. The samples are dispensed aseptically into 1ml aliquots and stored at -20°C until dispatched. The samples are dispatched by first class mail packaged in containers conforming to Post Office guidelines.
2.2 Sample Stability
2.2.1 Short- term stability Participants are advised to analyse the samples on the day of receipt.
In case of delay in analysis samples should be stored at 4°C and assayed within 3 days For samples stored at +4°C, ensure that the samples are brought to room temperature and mix well before analysis. 2.2.2 Long Term Stability - The “in house” liquid samples were prepared, aliquotted and stored at +4°C until dispatch. The overall mean of the participants’ data for four of the samples covering the therapeutic range was used to monitor stability over a 63 day period. The following figures show that there was no significant change in the overall mean during this period.
Amikacin - Long term stability
0
5
10
15
20
25
30
27/11/2013 07/12/2013 17/12/2013 27/12/2013 06/01/2014 16/01/2014 26/01/2014
Date
Ove
rall
mea
n m
g/l
141113 / 23141113 / 24141113/ 21141113/ 22
Filename: SP-QL1-TDMGUIDE1014
Approved by: A Thomas
Version 1.2 Date of Revision: 01/10/2014 Page 4 of 16
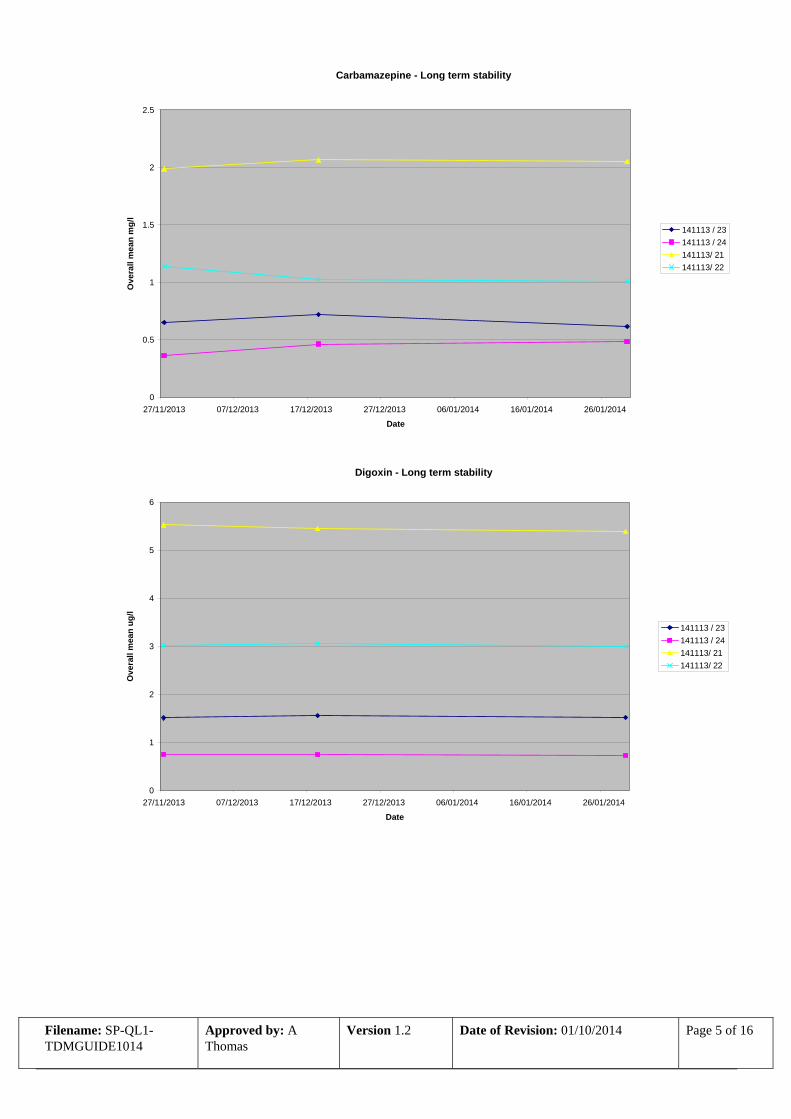
Carbamazepine - Long term stability
0
0.5
1
1.5
2
2.5
27/11/2013 07/12/2013 17/12/2013 27/12/2013 06/01/2014 16/01/2014 26/01/2014
Date
Ove
rall
mea
n m
g/l
141113 / 23141113 / 24141113/ 21141113/ 22
Digoxin - Long term stability
0
1
2
3
4
5
6
27/11/2013 07/12/2013 17/12/2013 27/12/2013 06/01/2014 16/01/2014 26/01/2014
Date
Ove
rall
mea
n ug
/l
141113 / 23141113 / 24141113/ 21141113/ 22
Filename: SP-QL1-TDMGUIDE1014
Approved by: A Thomas
Version 1.2 Date of Revision: 01/10/2014 Page 5 of 16
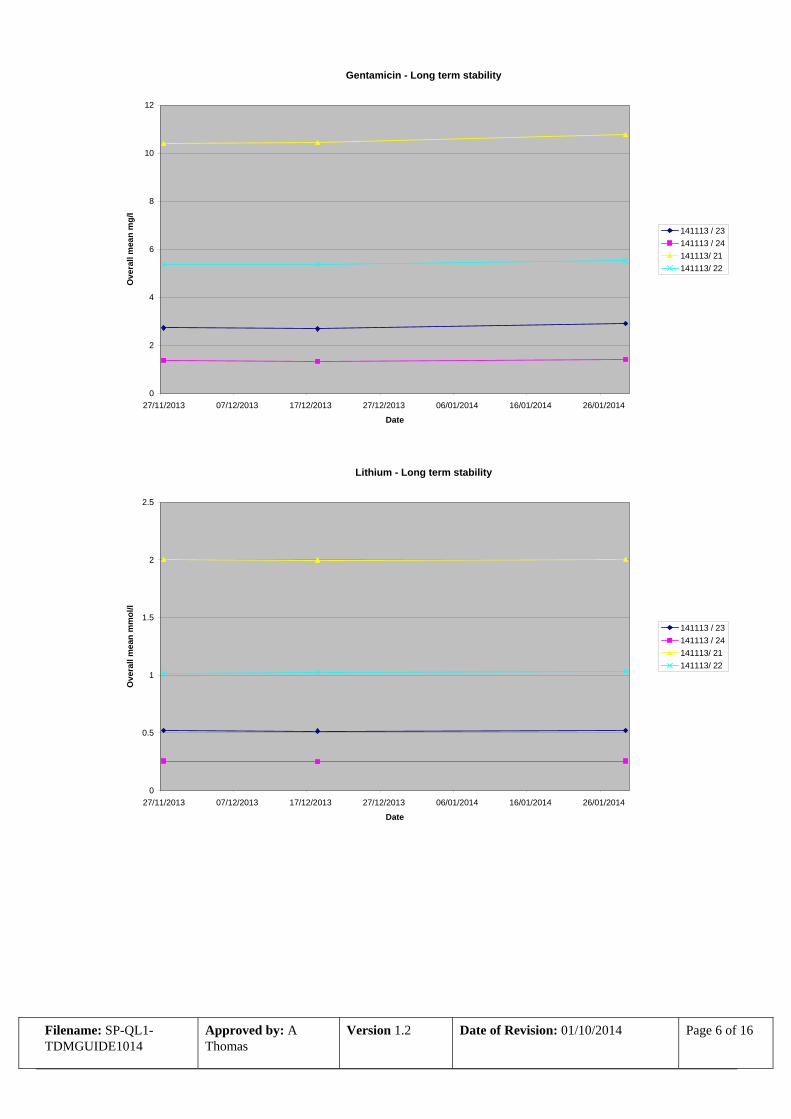
Gentamicin - Long term stability
0
2
4
6
8
10
12
27/11/2013 07/12/2013 17/12/2013 27/12/2013 06/01/2014 16/01/2014 26/01/2014
Date
Ove
rall
mea
n m
g/l
141113 / 23141113 / 24141113/ 21141113/ 22
Lithium - Long term stability
0
0.5
1
1.5
2
2.5
27/11/2013 07/12/2013 17/12/2013 27/12/2013 06/01/2014 16/01/2014 26/01/2014
Date
Ove
rall
mea
n m
mol
/l
141113 / 23141113 / 24141113/ 21141113/ 22
Filename: SP-QL1-TDMGUIDE1014
Approved by: A Thomas
Version 1.2 Date of Revision: 01/10/2014 Page 6 of 16

Methotrexate - Long term stability
0
0.2
0.4
0.6
0.8
1
1.2
1.4
1.6
27/11/2013 07/12/2013 17/12/2013 27/12/2013 06/01/2014 16/01/2014 26/01/2014
Date
Ove
rall
mea
n um
ol/l
141113 / 23141113 / 24141113/ 21141113/ 22
Phenorbarbital - Long term stability
0
5
10
15
20
25
30
35
40
45
50
27/11/2013 07/12/2013 17/12/2013 27/12/2013 06/01/2014 16/01/2014 26/01/2014
Date
Ove
rall
mea
n m
g/l
141113 / 23141113 / 24141113/ 21141113/ 22
Filename: SP-QL1-TDMGUIDE1014
Approved by: A Thomas
Version 1.2 Date of Revision: 01/10/2014 Page 7 of 16

Phenytoin - Long term stability
0
5
10
15
20
25
30
35
27/11/2013 07/12/2013 17/12/2013 27/12/2013 06/01/2014 16/01/2014 26/01/2014
Date
Ove
rall
mea
n m
g/l
141113 / 23141113 / 24141113/ 21141113/ 22
Theophylline - Long term stability
0
2
4
6
8
10
12
14
16
18
20
27/11/2013 07/12/2013 17/12/2013 27/12/2013 06/01/2014 16/01/2014 26/01/2014
Date
Ove
rall
mea
n m
g/l
141113 / 23141113 / 24141113/ 21141113/ 22
Filename: SP-QL1-TDMGUIDE1014
Approved by: A Thomas
Version 1.2 Date of Revision: 01/10/2014 Page 8 of 16

Tobramycin - Long term stability
0
2
4
6
8
10
12
14
16
27/11/2013 07/12/2013 17/12/2013 27/12/2013 06/01/2014 16/01/2014 26/01/2014
Date
Ove
rall
mea
n m
g/l
141113 / 23141113 / 24141113/ 21141113/ 22
Valproate - Long term stability
0
20
40
60
80
100
120
27/11/2013 07/12/2013 17/12/2013 27/12/2013 06/01/2014 16/01/2014 26/01/2014
Date
Ove
rall
mea
n m
g/l
141113 / 23141113 / 24141113/ 21141113/ 22
Filename: SP-QL1-TDMGUIDE1014
Approved by: A Thomas
Version 1.2 Date of Revision: 01/10/2014 Page 9 of 16

Vancomycin - Long term stability (New stock prepared March 2014)
0
5
10
15
20
25
30
35
40
45
50
30/04/2014 10/05/2014 20/05/2014 30/05/2014 09/06/2014 19/06/2014 29/06/2014 09/07/2014 19/07/2014
Date
Ove
rall
mea
n m
g/l
040414/31040414/32040414/33040414/34
Filename: SP-QL1-TDMGUIDE1014
Approved by: A Thomas
Version 1.2 Date of Revision: 01/10/2014 Page 10 of 16

3. Statistical Analysis
Please refer to the accompanying Participants Manual for full details on statistical analysis and interpretation of results. Where possible, the gravimetric “weighed in” value is used as the target value, however the method and overall mean is also included on the reports. For Lithium, the flame emission reference method is also provided.
3.1 Performance Criteria
Standard deviation limits used in the report are based on precision profiles calculated over several batches and are fixed for a given level of analyte. They are reviewed bi-annually by the Steering Committee and reflect the state of the art of the methods used.
3.1.1 Precision profiles
The following figures reflect the state of the art of the therapeutic drug monitoring methods. The data reflects both the interlaboratory variation and the bias between the methods currently in use. Each data point represents the CV at a given concentration for each distribution. Where available, the data is presented for both commercial lyophilised QC material evaluated during the pilot and the “in house” liquid samples. For gentamicin, theophylline and tobramycin there was a significant improvement in interlaboratory variation for the “in house” liquid samples compared with commercial material. Precision Profiles - Antibiotics
Amikacin Precision Profile
R2 = 0.4418
0
2
4
6
8
10
12
14
16
18
20
0 5 10 15 20 25 30
Overall mean mg/l
CV
%
Liquid samples
Filename: SP-QL1-TDMGUIDE1014
Approved by: A Thomas
Version 1.2 Date of Revision: 01/10/2014 Page 11 of 16

Tobramycin Precision Profile
R2 = 0.0317
0
5
10
15
20
25
30
0 2 4 6 8 10 12 14 16
Overall mean mg/l
CV
% All samplesLiquid
Vancomycin Precision Profile
R2 = 0.0032
0
2
4
6
8
10
12
14
16
18
20
0 5 10 15 20 25 30 35 40 45 50
Overall mean mg/l
CV
% All samplesLiquid
Filename: SP-QL1-TDMGUIDE1014
Approved by: A Thomas
Version 1.2 Date of Revision: 01/10/2014 Page 12 of 16

Gentamicin Precision Profile
R2 = 0.4063
0
5
10
15
20
25
30
35
40
45
0 2 4 6 8 10 12 14 16 18 20
Overall mean
CV
% All samplesLiquid
Precision Profiles - Antiepileptics
Carbamazepine Precision profile
R2 = 0.8137
0
5
10
15
20
25
0 2 4 6 8 10 12 14 16 18 20
Overall mean mg/l
CV
% All samplesLiquid
Filename: SP-QL1-TDMGUIDE1014
Approved by: A Thomas
Version 1.2 Date of Revision: 01/10/2014 Page 13 of 16

Phenobarbital Precision Profile
R2 = 0.5394
0
2
4
6
8
10
12
14
16
18
20
0 10 20 30 40 50 60 70
Overall mean mg/l
CV
% All samplesLiquid
Phenytoin Precision Profile
R2 = 0.3939
0
2
4
6
8
10
12
14
16
18
20
0 5 10 15 20 25 30 35
Overall mean mg/l
CV
% All samplesLiquid
Filename: SP-QL1-TDMGUIDE1014
Approved by: A Thomas
Version 1.2 Date of Revision: 01/10/2014 Page 14 of 16

Valproate Precision Profile
R2 = 0.5354
0
5
10
15
20
25
0 20 40 60 80 100 120 140 160 180
Overall mean mg/l
CV
% All samplesLiquid
Precision Profiles – other TDM
Theophylline Precision Profile
R2 = 0.8042
0
2
4
6
8
10
12
14
16
18
20
0 5 10 15 20 25 30 35
Overall mean mg/l
CV
% All samplesLiquid
Filename: SP-QL1-TDMGUIDE1014
Approved by: A Thomas
Version 1.2 Date of Revision: 01/10/2014 Page 15 of 16

Lithium Precision Profile
0
2
4
6
8
10
12
14
16
18
0 0.5 1 1.5 2 2.5 3
Overall mean mmol/l
CV
% All samplesLiquid
Digoxin Precision Profile
R2 = 0.6219
0
2
4
6
8
10
12
14
16
18
20
0 1 2 3 4 5 6
Overall mean ug/l
CV
(%)
All samplesLiquid
Filename: SP-QL1-TDMGUIDE1014
Approved by: A Thomas
Version 1.2 Date of Revision: 01/10/2014 Page 16 of 16