theoretical study of the photophysical processes of a
TRANSCRIPT

F U L L P A P E R
Theoretical study of the photophysical processes of astyryl-bodipy derivative eliciting an AND molecularlogic gate response
Demeter Tzeli | Ioannis D. Petsalakis | Giannoula Theodorakopoulos
Theoretical and Physical Chemistry Institute,
National Hellenic Research Foundation,
Athens, Greece
Correspondence
Demeter Tzeli and Ioannis D. Petsalakis,
Theoretical and Physical Chemistry Institute,
National Hellenic Research Foundation,
48 Vassileos Constantinou Ave., Athens
11635, Greece.
Emails: [email protected] (D. T.) and
[email protected] (I. D. P.)
Funding information
European Regional Development Fund, Grant/
Award Numbers: NSRF 2014-2020, MIS
5002409
Abstract
We study, via density functional theory and time dependent DFT calculations, the
photophysical processes of a styryl-bodipy derivative, which acts as a three metal-
cation-receptor fluorophore and as an AND molecular logic gate in order to (a) gain
information on the appropriate computational approach for successful prediction of
molecular logic gate candidates, (b) rationalize the available experimental data and
(c) understand how the given combination of three different receptors with the
BODIPY fluorophore presents such interesting optoelectronic responses. The fluo-
rophore (1), its monometallic complexes (1-Ca2+, 1-Zn2+, and 1-Hg2+), and its trimetallic
complex (2) are studied. The calculated λmax values for absorption and emission are in
excellent agreement with experimental data. It was found that the observed quenching
of emission of 1 and of the monometallic complexes is attributed to the fact that their
first excited state is a charge-transfer state whereas this does not happen for the com-
plex 2. It should be noted that for the correct ordering of the excited states, the inclusion
of corrections to the excitation energies for nonequilibrium solvent effects is required;
while in the case of 1-Ca2+, the additional explicit inclusion of the solvent is necessary
for the quenching of the emission spectra.
K E YWORD S
charge-transfer, DFT calculations, molecular logic gate, spectra, Styryl-Bodipy
1 | INTRODUCTION
Molecules can undergo changes in their ground or excited states, in response to modulators that can be other molecules, ions, or light of a certain
wavelength.[1–8] In most cases, these changes could then be signaled by changes in the absorption or emission intensity and/or in the wavelength,
and can be related to the operation of logic gates, via the familiar Boolean logic,[9] where the modulators correspond to the inputs and the
observed changes correspond to the outputs.[8–14] The field of molecular logical gates (MLG) is a subject of research in many laboratories
worldwide,[5,15–26] and while a great deal of the groundwork has been accomplished,[15] the field is still at an early stage in terms of practical
applications.[5,15–26] However, a significant rise of information processing molecular devices is expected in the forthcoming years.[15] Theoretical
studies aiming to provide experimentalists with information regarding a potential MLG candidate or to gain insight into experimental findings can
play a significant role in the field of MLG.[27–31]
Photoinduced electron transfer (PET) is particularly useful, as the signal, depending on the special circumstances, is either an “on-off” or “off-
on” type,[32] resulting in a well-defined “digital” response: PET produces very sharp changes in the signal intensity, while keeping the emission
wavelength unchanged.[9] Internal charge transfer (ICT)[33,34] on the other hand can be modulated in such a way as to generate changes in the
Received: 9 November 2018 Revised: 1 April 2019 Accepted: 3 April 2019
DOI: 10.1002/qua.25958
Int J Quantum Chem. 2019;e25958. http://q-chem.org © 2019 Wiley Periodicals, Inc. 1 of 13
https://doi.org/10.1002/qua.25958

absorption or emission wavelengths, which proved to be very useful for superposed logic gates, sometimes referred to as wavelength-
reconfigurable logic gates.[9]
Charge-transfer states pose significant challenges to theoretical treatments. For most systems of interest, their size makes impractical the use
of large-scale configuration interaction calculations and density functional theory (DFT) and time dependent DFT (TDDFT) methods are more of
use, in which case care must be exercised on the particular functional employed.[35–39] For PET systems, geometry optimization of the excited
state is required in order to reach the emission geometry, which is often very difficult to achieve due to interactions with other close-lying excited
electronic states. Furthermore, the effect of the environment, such as the solvent, needs to be accounted for: state-specific treatment of the sol-
vent is required for the excited states while explicit inclusion of solvent molecules in addition to the implicit methods might be necessary.[40,41]
In the present article, we study theoretically the photophysical processes of a three-receptor fluorophore that has been characterized as a
three input AND MLG candidate.[9] In the literature, other molecules have also been characterized as candidates for a three input AND
MLG.[19,20] Here, we study the photophysical processes of the three-receptor fluorophore that is a styryl-bodipy derivative of its monometallic
complexes, and of its trimetallic complex. Their ground state and their lowest in energy-excited states are calculated. Our results reveal the mech-
anism of quenching of the emission of the single fluorophore and of the monometallic complexes, while the emission of the trimetallic complex of
fluorophore is retained. The main purpose of the present work is to gain information on the appropriate computational approach for successful
prediction of molecular logic gate candidates, to interpret the experimental data and to explain why the given combination of three different
receptors with the BODIPY fluorophore has such optoelectronic responses. As will be discussed, the present study is rather challenging, and the
inclusion of the corrected linear response (cLR) correction to the energies for nonequilibrium solvent effects is necessary while the explicit addi-
tion of the solvent in the case of the monometallic complex of Ca2+ is also required.
2 | METHODOLOGY
In the present work we study theoretically the electronic structure of 1 and the complexes of 1 with each one of the three metal cations M = Ca2+,
Zn2+, and Hg2+, 1-M2+, that is, 1-Ca2+, 1-Zn2+, and 1-Hg2+, and the complex of 1 with all three cations, that is, 2, see Scheme 1 and Figure 1. 1 is com-
prised from a central group of boron-dipyrromethene (BODIPY), that is, dipyrromethene complexed with a disubstituted boron atom typically a BF2
unit, which is a fluorescent dye. Three groups are attached to BODIPY, that is, an azacrown ether (AC), a dithia-azacrown ether (DSC), and a
dipicolylamine (DPA) units, see Scheme 1. Ca2+ is complexed to the AC ligand, Hg2+ to the DSC ligand, and Zn2+ to the DPA ligand (see Scheme 1 and
Figure 1).
DFT and TDDFT calculations were carried out using the B3LYP[42] and PBE0[43] functionals in conjunction with the 6-31G(d,p)[44] for H, C, O,
N, S, Ca, Zn and LANL2TZ[45] basis sets for Hg in acetonitrile solvent. The applicability of the used PBE0/6-31G(d,p) method employed here has
been tested previously on calculations of the absorption and emission spectra in similar systems, including complexes of crown ethers and we
found that it works well, see Tzeli et al.[27] B3LYP is a widely used functional and generally works well, except for calculations on charge-
separated states. In our previous studies on complexes we had contradictory conclusions about the use of the B3LYP/6-31G(d,p) method on com-
plexes of crown ethers, see Tzeli et al.[39,46] Thus, we employed the PBE0 functional mainly, with some additional calculations employing the com-
monly used B3LYP functional, which is particularly good for ground-state geometry optimizations.
At first conformational analyses have been carried out using the B3LYP functional in order to calculate the most stable minimum structure for
each 1, 1-Ca2+, 1-Zn2+, 1-Hg2+, and 2 species. For the lowest in-energy structure, all species were fully geometry optimized in the ground state
(S0) and in the first in-energy excited singlet state (S1) in acetonitrile (ε = 35.688) solvent employing the polarizable continuum model (PCM) [47]
SCHEME 1 Calculated structures ofthe 1 and 2 molecule
2 of 13 TZELI ET AL.
using both B3LYP and PBE0 functionals. We found that both functionals employed predict similar geometries for both S0 and S1 states (see later).
However, we choose the PBE0 functional as the most appropriate one for the present study, because it predicts better the charge-transfer states
and the correct ordering of the excited states (see later). Thus, using the PBE0 all species were fully geometry optimized in the first, second, and
third lowest in-energy excited singlet states, that is, S1, S2, and S3, in acetonitrile solvent.
The acetonitrile was used as a solvent in order to reproduce the experimental conditions.[9] The PCM model is divided into a solute part lying
inside a cavity, surrounded by the solvent part represented as a structureless material characterized by its macroscopic properties, that is, dielec-
tric constants and solvent radius. This method reproduces solvent effects generally well,[48] however, corrections to the calculated excitation
energies for nonequilibrium solvent effects are required and for this purpose the state-specific cLR approach,[49] is employed. It might be noted
that generally the geometry optimization calculations using the cLR approach are time-consuming procedures. Moreover, when the procedure
included cLR approach, mainly for the charge-transfer (CT) states of the given systems, did not reach full convergence. It should be noted that our
results on geometry optimization using the cLR approach for the S1 excited state of 2 shows that the geometry of the S1 state remains almost the
same after the application of the cLR approach. Thus, we carried out optimization of the excited state geometries without cLR and then we con-
ducted single point calculations with the cLR approach.
In addition to the inclusion of the solvent via the PCM method and the inclusion of the nonequilibrium solvent effects via the cLR approach,
we include the solvent explicitly in order to estimate its effect on the spectra on the calculated molecular systems. The inclusion of coordinating
solvent molecules explicitly has been done in accordance with the usual coordination number for each cation. The main coordination number of
Ca2+ is 6, of Hg2+ is 2 and 3, and of Zn2+ is 4. The Ca2+ cation interacts with five atoms of AC, one nitrogen and four oxygen atoms, Hg2+ interacts
with five atoms of DSC but mainly with two, and Zn2+ interacts with three atoms of DPA. Thus, for all three metal cations one ACN molecule is
needed, attached to the metal, and it has been added explicitly in the calculations, (Figure 2).
It should be noted that while for the calculation of the absorption peaks the number of calculated singlet states do not affect them, on the
contrary for the calculation of the emission maxima the number of calculated singlet states affects them. Note that, the data obtained by the
application of the cLR approach are not affected significantly by the number of the calculated singlet states. Emission maxima values obtained
when 20 singlet states or more are included in the calculation are in better agreement with the cLR corrected values that are unaffected by the
number of the calculated singlet states (see emission part of Results and Discussion). So, the absorption and the emission spectra of the studied
systems were calculated including up to 30 singlet-spin excited electronic states.
All calculations were performed using the Gaussian 09 program package.[50] The coordinates of all the optimum structures are included in
Supporting Information, Tables 1S, 2S and 5S.
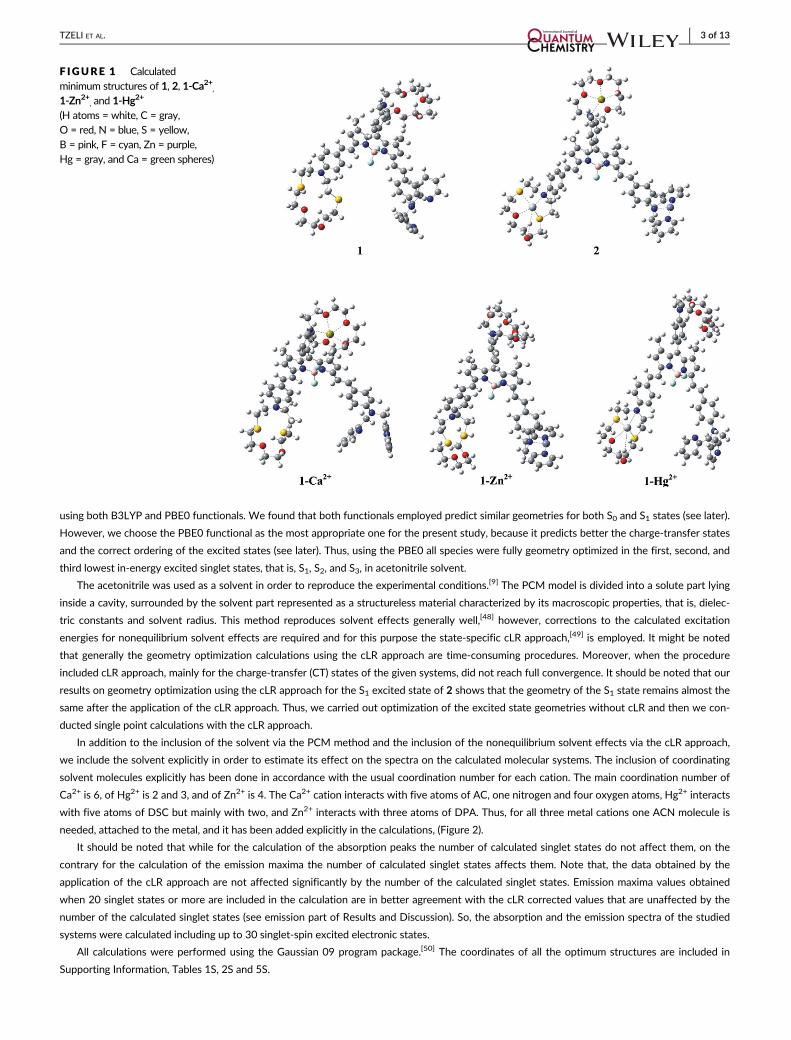
F IGURE 1 Calculatedminimum structures of 1, 2, 1-Ca2+,1-Zn2+, and 1-Hg2+
(H atoms = white, C = gray,O = red, N = blue, S = yellow,B = pink, F = cyan, Zn = purple,Hg = gray, and Ca = green spheres)
TZELI ET AL. 3 of 13

3 | RESULTS AND DISCUSSION
The calculated structures of the lowest minima of 1 and of the complexes 1-Ca2+, 1-Zn2+, 1-Hg2+, and 2 are shown in Figure 1. All three metal cat-
ions selectively interact with a specific ligation site of 1. Ca2+ prefers to interact with the AC ligand, Hg2+ prefers to interact with the DSC ligand,
while Zn2+ prefers to interact with the DPA ligand, see Scheme 1.
3.1 | Geometry
Complexation of the three metals with 1 results in some geometry changes of its structure in the ground (as it is shown in Figure 1) and in the
excited states. Selected geometries along with the Cartesian coordinates are given in Data S1. Both functionals employed predict similar geome-
tries. We choose the PBE0 functional as the most appropriate for the present study, because it predicts better the charge-transfer states and the
correct ordering of the excited states (see below). It should be noted the two lowest excited states S1 and S2 of all calculated species are an emit-
ting state and a CT state; their position in the spectra and their ordering in some cases is altered by inclusion of the cLR process, thus they are
named as Sem and SCT according to their character.
As shown in Table S1, in the ground (S0) state, the range of the calculated bond distances between the metals and the ligating atoms in 2 is
2.4-2.7 Å for Ca2+, 2.1-2.3 Å for Zn2+, and 2.8-4.7 Å for Hg2+ as obtained by both functionals. In 1-M2+ the corresponding distances are similar.
Note that, there is only one large bond distance between Hg2+ and ligating atoms of about 4.7 Å in both 2 and 1-Hg2+ complexes, while the other
four distances range from 2.8 to 3.4 Å (cf. Table S1). In 2(1-M2+) the metals lie above the plane of three ligating atoms at 0.86(1.02) Å for Ca2+,
0.13(0.01) Å for Zn2+, and 1.74(2.19) Å for Hg2+. Thus, the Zn2+ cation almost lies in the plane of three ligating atoms and especially so in the
1-Zn2+ complex.
It is of interest to consider the geometry at the N atoms of the ligands and, in particular, whether a tetrahedral or a planar N atom approaching the
geometry of quaternary N cation is calculated. It is well established that electron-donation by N leads to a quasi-planar geometry at N.[51–53] In the un-
complexed fluorophore, system 1, the optimum geometry of the ground state but also the corresponding geometries of the two lowest excited states,
Sem (S1) and SCT (S2), show the geometry at N of the DPA ligand is nearly tetrahedral while the geometry at N of the other two ligands, that is, AC and
DSC, is nearly planar, see Table 1. Upon complexation by metal dications, the geometry at N changes: For all calculated states, the N atom in the AC
ligand is tetrahedral in 1-Ca2+ and 2, that is, the dihedral C1NC2C3 angle is about 125�, while in 1-Zn2+ and 1-Hg2+, it is quasi-planar (cf. also in 1) with
a dihedral C1NC2C3 angle which ranges from 160 to 174�. In the DSC ligand, the N atom is quasi-planar in 1-Ca2+, 1-Zn2+
, as in 1, with a C4NC5C6
dihedral angle of about 170�; while in 2 and 1-Hg2+ it is 134 and 145�, respectively in S0, and it ranges from 134 to 154� for all excited states. Finally,
in the DPA ligand, the N atom is planar in 1-Ca2+ and 1-Hg2+ with a C7NC8C9 dihedral angle of about 178�, while in 2 and 1-Zn2+, as also in 1, it is tet-
rahedral with a dihedral angle of about 127�. Thus, in 1 only the N in DPA ligand is tetrahedral and the N atoms in the other two ligands are quasi-
planar, in 2 all N atoms of the three ligands are nearly tetrahedral.
Complexation of one metal dication may affect the geometry not only of the corresponding ligand but the other two as well. For example,
complexation of Hg2+ at DSC leads to a more tetrahedral N at that ligand, while N of DPA becomes planar, cf. Table 1. Similarly, complexation of
Ca2+ at the AC ligand, affects as well, the geometry at N of DPA that also becomes planar compared to its tetrahedral geometry in 1.
The fact that the N atoms of the ligands change from tetrahedral to quasi-planar, that is, toward the geometry of quaternary N cation, shows
that complexation of the ligands changes their electron-donating ability within the complex. Thus, it is very interesting that addition of the Ca2+
or Hg2+ in one ligand affects the property of the other ligands to act as electron donors. As mentioned earlier, the complexation of Zn2+ does not
affect the properties of the other ligands. All the earlier observations are also shown at the counters and the surfaces using the electrostatic
potential computed of the calculated structures of 1, 2, 1-Ca2+, 1-Zn2+, and 1-Hg2+ which are depicted in Figure S1.
3.2 | Spectra, energetics, and molecular orbitals
The vertical excitation energies for the S0 ! Sx absorption and for the emission maxima of the three lowest excited states, their f-values, their
main excitations, and corresponding coefficients for the 1, 1-M2+, and 2 species in acetonitrile solvent are collected in Tables S3 and S4 and in
Figures 3–5. The absorption and emission spectra are depicted in Figure 6 and Figures S3 and S4. It should be noted that the absorption and emis-
sion spectra of solvent acetonitrile itself is found at 110 and 133 nm, respectively, that is, far away from the main peaks of the studied species.
In Figures 3–5 and Figures S5-S7 are depicted electron density plots of the HOMO (H), HOMO-1 (H-1), HOMO-2 (H-2), LUMO (L), and
LUMO+1 (L + 1) molecular orbitals (MO) involved in the main singlet excitations from the ground state (S0) to the three lowest excited states, at
the S0 geometry for absorption and at the corresponding optimized geometry of the excited states for emission. The H and L MO are the same
for all five species and for all their three excited states, that is, they are located on dipyrromethene and on two styrenes, with the exception of
the S0, S1 states of 1-Hg2+ complex, where the L orbital is located mainly to Hg2+. For the H-2, H-1, and L + 1 MO, there are differences among
all calculated species and different states.
4 of 13 TZELI ET AL.

TABLE1
Dihed
ralang
les(deg
rees)a
ttheN
atomsofthethreeligan
dsa,o
fthetw
olowestex
citedstates
(Seman
dS C
T)a
tthePBE0leve
loftheo
ryin
acetonitrile
solven
tof1,1
-M2+,and2
11-C
a2+
1-C
a2+b
1-Zn2+
1-H
g2+
2
S 0S e
mS C
TS 0
S em
S emc
S 0S e
mS C
TS 0
S em
S CT
S 0S e
mS C
TS 0
S em
S CT
C1NC2C3
161.9
161.0
174.2
124.0
127.5
127.7
128.9
128.0
176.0
160.9
160.2
174.1
162.3
162.0
162.0
124.0
124.0
125.1
C4NC5C6
170.2
172.5
168.6
169.2
171.0
173.0
168.9
171.4
168.1
170.5
172.7
168.7
145.3
154.9
147.1
134.4
147.0
154.4
C7NC8C9
128.4
128.4
128.4
177.4
178.8
179.0
134.6
179.6
128.5
125.8
126.3
129.0
177.7
177.5
176.8
126.9
128.2
127.4
aSc
heme1.
bAnACN
molecu
leinteractswithco
mplex
withinacetonitrile
solven
t,1-C
a2+-A
CN,see
Figure2.
c The
seco
ndex
citedstatealso
emits,itisno
taCTstate.
TZELI ET AL. 5 of 13

3.2.1 | Energetics
The vertical and adiabatic excitation energies with respect to the ground state and the corresponding corrected values with respect to the cLR
approach are shown in Table 2. The correct ordering of the two lowest excited states, named as Sem, which is a state that emits and as SCT which
is a CT state, is shown in Table 2, under the adiabatic excitation. It is observed that the inclusion of cLR methodology changes the ordering of the
two states in all cases except of 1-Hg2+; while for 1-Ca2+, the inclusion of the interaction of a molecule of the solvent with the Ca2+ cation (see
Figure 2) is crucial not only for the change of the ordering of the two states but also for the prediction of the CT state. Note that without the addi-
tion of the interacting acetonitrile molecule, the CT state was not found. So, after the inclusion of the cLR process, the CT state is lower than the emit-
ting state by about 0.2 eV for 1, 1-Ca2+, and 1-Zn2+ and 0.5 eV for 1-Hg2+, which is a much larger energy difference compared to 1, 1-Ca2+, and
1-Zn2+. Finally, for 2 the emitting state is the lowest one by 0.1 eV.
Thus, we conclude that the lowest excited state is a CT state for 1, 1-Ca2+, 1-Zn2+, and 1-Hg2+ resulting in quenching of their emission spec-
tra, while for 2 the lowest excited state is an emitting state resulting in retaining of the emission spectrum. This conclusion explains the experi-
mental findings where no emission spectra are observed for the species 1, 1-Ca2, and1-Zn2+, a weak peak is observed for the 1-Hg2+, while an
intense emission peak is observed only for 2. More details about the excitations and their character are given later.
3.2.2 | Absorption spectra
The B3LYP and PBE0 results on the absorption spectra are similar and they are in good agreement with the experimental values, see Table S3.
The calculated absorption λmax PBE0(B3LYP) values of 1, 2, 1-Ca2+, 1-Zn2+, and 1-Hg2+ are 624(646), 577(623), 678(700), 629(651), and
643 (666) nm, while the corresponding experimental values[9] are 692, 626, 672, 668, and 630 nm. The inclusion of the cLR approach leads only
to small changes of the PBE0(B3LYP) absorption λmax values. The shifts of the main PBE0(B3LYP) absorption peaks with respect to the experi-
mental values range from 0.02 to 0.20 (0.01-0.13) eV, while including the cLR approach, the corresponding shifts range from 0.03 to 0.27
(0.04-0.20) eV. The largest deviation of the calculated absorption peak is observed for 1. It seems that B3LYP presents slightly smaller deviation
from experiment than PBE0, however, PBE0 predicts better CT the states and the correct ordering of the excited states. Generally, shifts of about
0.2 eV are considered as showing very good agreement between experiment and theory.[54,55]
3.2.3 | Emission
For the calculation of the emission maxima, it should be noted that the number of calculated singlet states affects the calculated emission maxima.
Note, that this phenomenon was not observed in the absorption spectra. Thus, in the calculation of the emission maxima, when a small number of
singlets is included, up to 10 states, the resulting λmax values are smaller than the λmax values when more than 20 singlet states are calculated. The
difference between the two λmax values is up to 91 nm. Note, that the λ values remain the same when 20 or more singlet states are calculated.
This shows that the interaction of a large number of states, namely 20 singlet states or more, needs to be included in order to obtain convergence.
Moreover, these values are in better agreement with the cLR corrected values than the ones obtained when a small number of singlet states is
included. Note, that the cLR corrected values are unaffected by the number of the calculated singlet states. Finally, it might be noted as a techni-
cal detail of the calculations, while the optimization of the first excited state of 2 resulted in an emitting state, when the complex was optimized
with respect to the second excited state, which was a CT state, it was located energetically after conducting the geometry optimization below the
emitting state. However, the inclusion of the cLR process results in being the CT state the second excited state and the emitting state the first
excited state.
F IGURE 2 Calculated minimum structure of 1-Ca2+ interacting with one acetonitrilemolecule (H atoms = white, C = gray, O = red, N = blue, S = yellow, B = pink, F = cyan, andCa = green spheres)
6 of 13 TZELI ET AL.

Theoretically, in the case of 1 without the inclusion of the cLR correction, the emission from the first excited state is an intense peak at
676 nm and a second excited state, which is a CT state observed at 675 nm (see Figure 3). However, the inclusion of the cLR process results in
the CT state being the lowest one at 801 nm, that is, first excited, and the emitting state is the second one at 650 nm. Similarly, for the 1-Zn2+
species the first excited state and the first CT state are energetically degenerate and the inclusion of the cLR process results in lowering the CT
state at 701 nm, with the emitting state at 661 nm. In both 1 and 1-Zn2+, their first excited state, after cLR, is a CT excitation that corresponds to
excitation from benzoazacrown ether to dipyrromethene-styrenes group (see Figure 3). Their second excited state corresponds to excitations
within the dipyrromethene and styrene groups. It should be noted that while for 1 the third excited state is an emitting state, for 1-Zn2+ the third
excited state is a second CT state that corresponds to excitations from dipyrromethene/styrene groups to Zn2+-DPA unit.
In the case of 1-Ca2+, CT states are not found close to the first excited state, and the N atom of the AC ligand is tetrahedral in the lowest
energy structure in S0, S1, and S2. However, there are local minima in these three states when the N atom obtains a quasi-planar geometry, that
is, similar to the geometry of quaternary N cation. Thus, we try to find out if the explicit inclusion of a solvent molecule in addition to the PCM
model will change the ordering of the excited emitting and CT states. We found that the explicit addition of one acetonitrile molecule that
F IGURE 3 Electron densityplots of the molecular orbitalsinvolved in the excitationscorresponding to the major peaksfor transitions from the ground(S0) to the three lowest excitedstates (S1, S2, and S3) of 1 and1-Zn2+. The S0 geometry(absorption) and the optimizedgeometry of the correspondingexcited state (emission) areemployed. Relative energies ofMO, f-values, and λmax in nm ofthe singlet (black solid arrows)and charge-transfer excitations(blue dash arrows) are givenwithout and (with) inclusion ofthe cLR correction
TZELI ET AL. 7 of 13

interacts with Ca2+ cation (Figure 2) in the calculation, denoted by 1-Ca2+-ACN, followed by the cLR correction, leads to results in accord with the
experimental findings, that is, suppression of emission. In the global minimum of the ground state of 1-Ca2+-ACN, the N atom of the AC ligand is
tetrahedral as in the case of the free 1-Ca2+ complex. The main peak of the absorption spectra of 1-Ca2+-ACN are shifted to higher energies by
about 30 nm with respect to the free 1-Ca2+, however the general shape of the absorption spectrum does not change (see Figures S3 and S4).
The 1-Ca2+-ACN calculation, without taking into account the cLR process, presents two excited states one at 719 nm and a CT at 590 nm (see
Figure 4). The global minimum of the first excited state has a tetrahedral N atom, while the global minimum of the second excited state has an N
atom of quasi-planar geometry (see Table 1). However, after including the cLR process the ordering of the two excited states is reversed. Within
cLR process, the CT excited state has a peak at 868 nm and the emitting state has a peak at 689 nm (Figure 4), and thus the experimental absence
of emission spectra of 1-Ca2+ is explained. The CT excitation corresponds to an excitation from benzoazacrown ether to dipyrromethene/two
F IGURE 4 Electron densityplots of themolecular orbitalsinvolved in the excitationscorresponding to themajor peaksfor transitions from the ground (S0)to the three lowest excited states(S1, S2, and S3) of1-Ca
2+ and1-Ca2+
interactingwith one acetonitrilemolecule (1-Ca2+-ACN). The S0geometry (absorption) and theoptimized geometry of thecorresponding excited state(emission) are employed. Relativeenergies ofMO, f-values, and λmax
in nmof the singlet (black solidarrows) and charge-transferexcitations (blue dash arrows) aregivenwithout and (with) inclusion ofthe cLR correction
8 of 13 TZELI ET AL.

styrenes unit. To sum up, the addition of one acetonitrile molecule results in making the global minimum of the second excited state to be a CT
state with an N atom of a quasi-planar geometry and the cLR process corrects the ordering of the excited states and leads this CT state to be the
lowest excited state. In other words, both the explicit inclusion of solvent and the cLR process are necessary for the correct ordering of the exited
states in the case of 1-Ca2+.
In the case of 1-Hg2+, even before the cLR correction the first excited state calculated at 1092 nm has a CT character (and f-value 0.0053)
(see Figure 5). Experimentally a weak peak was measured at 653 nm for this system.[9] Theoretically, the peak was calculated at 695 nm
(corresponding to the second excited state) and the cLR corrected value was at 665 nm, in excellent agreement with the experimental value of
653 nm[9]. The reason why a weak peak is observed experimentally here but not in 1 or the other two 1-M2+ systems may be that while in all
these cases the population of the second excited state (S2) is reduced by internal conversion to the first excited state (S1) which is the CT state, in
1-Hg2+ the energy difference between the CT and the emitting state is 0.5 eV, larger than in the other systems (see Table 2) allowing some
F IGURE 5 Electron densityplots of the molecular orbitalsinvolved in the excitationscorresponding to the major peaksfor transitions from the ground(S0) to the three lowest excitedstates (S1, S2, and S3) of 1-Hg2+
and 2. The S0 geometry(absorption) and the optimizedgeometry of the correspondingexcited state (emission) areemployed. Relative energies ofMO, f-values, and λmax in nm ofthe singlet (black solid arrows)and charge-transfer excitations(blue dash arrows) are givenwithout and (with) inclusion ofthe cLR correction
TZELI ET AL. 9 of 13
emission to be observed from S2. Note that via internal conversion from S2 to S1 this peak is reduced. The S2 ! S0 excitation correspond to exci-
tations within the dipyrromethene and styrene groups, while the S1 ! S0 and S3 ! S0 excitations are CT excitations from dipyrromethene-two
styrenes to Hg2+-DSC ligand and from benzoazacrown ether to dipyrromethene and to Hg2+-DSC ligand, respectively.
In addition to the above, calculations have been carried out on the S1 and S2 states of 1-Zn2+ and 1-Hg2+, with inclusion of a solvent molecule
explicitly, without and with cLR (values in brackets below), for comparison. The peaks of the emitted state is at 686[661] for 1-Zn2+-ACN and 699
[670] nm for 1-Hg2+-ACN; very similar to the values of those of the complexes without the addition of an ACN molecule, namely 685[661] for
1-Zn2+ and 695[665] nm for 1-Hg2+. The peaks of the CT state are at 700[989] for 1-Zn2+-ACN and 916 nm for 1-Hg2+-ACN. In the case of 1-Hg2+,
it was not possible to reach convergence for the CT state, with both cLR and explicit inclusion. Thus, we observe that for 1-Zn2+ and 1-Hg2+, the rel-
ative ordering of the emitted state and CT state does not change with the explicit inclusion of the solvent, that is, the first excited state is a CT state,
while the second excited state emits.
For 2 the main emission peak is calculated at 649(683) nm via the PBE0(B3LYP) functionals while the experimental peak was at 656 nm, in
excellent agreement with the PBE0 value (see Figure 5). The corresponding cLR values are 619(718), showing differences of about 30 nm with
respect the experimental values. In 2, the first and the third excited states correspond to excitations within the dipyrromethene and styrene
groups, while the second excited state which is a CT excitation corresponds to excitation from dipyrromethene/two styrenes groups to Hg2+-DSC
ligand (see Figure 5). Finally, it should be noted that the character of the excitation of the CT states of both 2 and 1-Hg2+ is similar (see Figure 5).
Moreover, the character of the excitation of the CT states of 1, 1-Ca2+, and 1-Zn2+ is similar and differs from that of 2 and 1-Hg2+ (cf. Figures 3–5).
Thus, the presence of the Hg2+ is responsible for the character of the CT state of 2.
Bozdemir et al[9] have shown experimentally, that 2 is a candidate for a three-input AND molecular logic gate in the emission mode because
2 has an intense emission peak while 1 and its complexes with one or two metal dications present weak or no emission peak. The present
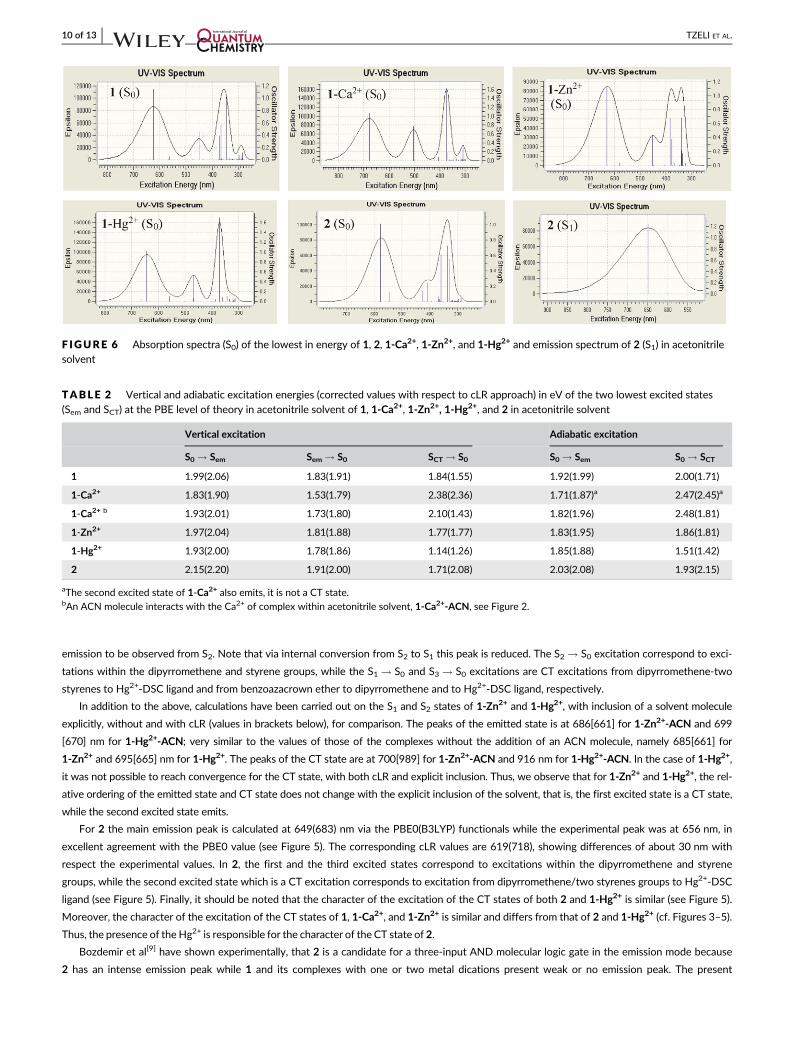
F IGURE 6 Absorption spectra (S0) of the lowest in energy of 1, 2, 1-Ca2+, 1-Zn2+, and 1-Hg2+ and emission spectrum of 2 (S1) in acetonitrilesolvent
TABLE 2 Vertical and adiabatic excitation energies (corrected values with respect to cLR approach) in eV of the two lowest excited states
(Sem and SCT) at the PBE level of theory in acetonitrile solvent of 1, 1-Ca2+, 1-Zn2+, 1-Hg2+, and 2 in acetonitrile solvent
Vertical excitation Adiabatic excitation
S0 ! Sem Sem ! S0 SCT ! S0 S0 ! Sem S0 ! SCT
1 1.99(2.06) 1.83(1.91) 1.84(1.55) 1.92(1.99) 2.00(1.71)
1-Ca2+ 1.83(1.90) 1.53(1.79) 2.38(2.36) 1.71(1.87)a 2.47(2.45)a
1-Ca2+ b 1.93(2.01) 1.73(1.80) 2.10(1.43) 1.82(1.96) 2.48(1.81)
1-Zn2+ 1.97(2.04) 1.81(1.88) 1.77(1.77) 1.83(1.95) 1.86(1.81)
1-Hg2+ 1.93(2.00) 1.78(1.86) 1.14(1.26) 1.85(1.88) 1.51(1.42)
2 2.15(2.20) 1.91(2.00) 1.71(2.08) 2.03(2.08) 1.93(2.15)
aThe second excited state of 1-Ca2+ also emits, it is not a CT state.bAn ACN molecule interacts with the Ca2+ of complex within acetonitrile solvent, 1-Ca2+-ACN, see Figure 2.
10 of 13 TZELI ET AL.

theoretical study explains the experimental findings, that is, the emission of the fluorophore and of monometallic complexes is quenched, while
the emission of the trimetallic complex of fluorophore is retained.
To sum up, in the 1, 1-Ca2+, and 1-Zn2+ species, the benzoazacrown ether acts as an electron donor and the dipyrro-methene-two styrenes
group as an electron acceptor in the CT states. On the contrary, in 1-Hg2+, the dipyrromethene-two styrenes act as an electron donor while the
Hg2+-DSC ligand as an electron acceptor in the first CT state, but in the second CT state again the benzoazacrown ether act as an electron donor
and the dipyrromethene-two styrenes group as an electron acceptor. Thus, the ascending ordering of the groups with respect to the capability to
attract electrons is benzoazacrown ether < dipyrromethene-two styrenes < Hg2+-DSC.
It should be noted that the combination of three different receptors with the BODIPY fluorophore is required in order to elicit the observed
optoelectronic responses. Here, the bodipy system is connected with one PET active group (DPA) and two ICT active groups (DSC and AC). The
emission in all five calculated species is always from an orbital that is mainly a bodipy-centered H orbital, to the L orbital, which is also mainly dye
centered. The PET activity is expected to be linked to the presence of a DPA ligand-centered orbital above the bodipy-centered orbital, while the
ICT activity is expected to be linked to the presence of a DSC or AC ligand-centered orbital above the bodipy-centered orbital. What we see here
is that the CT state is from the AC ligand-centered orbital to bodipy-centered orbital for 1, 1-Ca2+ and 1-Zn2+, that is, the ICT activity of AC ligand
is dominant. The complexation of the Hg2+ metal results in a change of the character of the CT state, that is, the transfer occurs from a mainly
bodipy-centered (H) orbital to DSC-Hg orbital that becomes the L orbital. However, the addition of the other two metal cations are necessary to
stabilize the bodipy centered H orbital and the CT state becomes the second excited state. The ICT activity of DSC acts antagonistic to the ICT
activity of AC and the PET activity of DPA. As a result, the trimetallic complex emits.
4 | SUMMARY AND CONCLUSIONS
In the present work, we study the photophysical processes of a styryl-bodipy derivative that acts as a three-receptor fluorophore and it is a candi-
date for a three-input AND molecular logic gate in the emission mode. We calculated the free molecule (1), its monometallic complexes (1-Ca2+,
1-Zn2+, and 1-Hg2+), and its trimetallic complex with the Ca2+, Zn2+, and Hg2+ cations (2). We carried out DFT and TDDFT calculations using the
B3LYP and PBE0 functionals in acetonitrile solvent, including the cLR correction to the energies for nonequilibrium solvent effects.
The motivation of the present work, beyond the rationalization of the complex experimental observations, was to establish a computational
procedure that will yield accurately the physics of such challenging systems, including the proper approach for accounting for the effects of the
solvent.
Of interest in the present work was to explain why the emissions of the single fluorophore and of the monometallic complexes are quenched,
while the emission of the trimetallic complex of 1 fluorophore (2) is retained.
Good agreement is found between the calculated and experimental absorption λmax values of the five calculated species: the absorption λmax
PBE0(B3LYP)[expt] values of 1, 2, 1-Ca2+, 1-Zn2+, and 1-Hg2+ are 624(646)[692], 577(623)[626], 678(700)[672], 629(651)[668], and 643(666)
[630] nm.
The main emission peak of 2 is found theoretically at 649(683) nm via the PBE0(B3LYP) functionals while the experimental peak is at 656 nm,
in excellent agreement with the PBE0 value. Similarly, for 1-Hg2+ there is excellent agreement between the calculated emission from S2 at
665 nm, and the experimentally observed weak emission at 653 nm.
Regarding the emissions of the single fluorophore and of the monometallic complexes, we found that they are quenched because the first
excited state is a charge-transfer state. It should be noted that the inclusion of state-specific cLR approach is necessary in order to obtain the first
TABLE 3 Relative ordering of the excited states obtained with PCM model and cLR approach
PCM cLR
S1 S2 S1 S2
1a emit CT CT emit
1-Ca2+ a emit emit CT emit
1-Ca2+ b emit CT CT emit
1-Zn2+ a,b emit CT CT emit
1-Hg2+ a,b CT emit CT emit
2 a,b CT emit emit CT
Abbreviations: cLR, corrected linear response; CT, charge transfer; PCM, polarizable continuum model.aImplicit inclusion of ACN solvent.bExplicit inclusion of ACN solvent.
TZELI ET AL. 11 of 13

excited state as a CT state in the case of systems 1, and 1-Zn2+, while for 1-Ca2+, in addition to the cLR correction the explicit inclusion of the sol-
vent was required in order to reveal the CT character of the first excited state (see Table 3).
Thus, we recommend, for the correct calculation of the spectra of potential molecular logic gates and in general of sensors, the inclusion of
both cLR approach and explicit solvent addition. It is necessary their effects to be examined and estimated in all theoretical studies. It should be
noted that the accurate calculation of the spectra will lead to a successful design and prediction of MLG and sensors candidates.
Finally, it should be added that the combination of the three different receptors with the BODIPY fluorophore is needed in order to be pre-
sent for such interesting optoelectronic responses. The emission in all five species calculated is always from an orbital that is mainly a bodipy-
centered H orbital, to the L orbital, which is also dye-centered. Regarding the CT state, the ICT activity of AC ligand overwhelms for 1, 1-Ca2+,
and 1-Zn2+. The complexation of the Hg2+ metal in 1 results in a change to the character of the CT state, that is, the transfer occurs from a mainly
bodipy centered H orbital to DSC-Hg orbital, while the addition of the other two metals results in the stabilization of the bodipy centered H
orbital and the CT state becomes the second excited state. The ICT activity of DSC acts antagonistic to ICT activity of AC and PET activity of
DPA. As a result, the trimetallic complex emits.
ACKNOWLEDGMENTS
We acknowledge support of this work by the project “Advanced Materials and Devices” (MIS 5002409) that is implemented under the “Action for
the Strategic Development on the Research and Technological Sector”, funded by the Operational Programme “Competitiveness, Entrepreneur-
ship and Innovation” (NSRF 2014-2020) and cofinanced by Greece and the European Union (European Regional Development Fund).
ORCID
Demeter Tzeli https://orcid.org/0000-0003-0899-7282
REFERENCES
[1] P. de Silva, H. Q. N. Gunaratne, C. P. McCoy, Nature 1993, 364, 42.[2] S. Ozlem, E. U. Akkaya, J. Am. Chem. Soc. 2009, 131, 48.[3] D. C. Magri, A. P. de Silva, New J. Chem. 2010, 34, 476.
[4] M. R. Ajayakumar, G. Hundalb, P. Mukhopadhyay, Chem. Commun. 2013, 49, 7684.[5] J. Ling, B. Daly, V. A. D. Silverson, A. P. de Silva, Chem. Comm. 2015, 51, 8403 and references therein.
[6] G. T. Yan, H. Li, Y. R. Zhu, B.-B. Shi, W. Qu, Q. Lin, H. Yao, Y.-M. Zhang, T.-B. Wei, New J. Chem. 2015, 39, 8797.[7] S. Karmakar, S. Mardanya, S. Das, S. Baitalik, J. Phys. Chem. C 2015, 119, 6793.[8] K. Szacilowski, Chem. Rev. 2008, 108, 3481.
[9] O. A. Bozdemir, R. Guliyev, O. Buyukcakir, S. Selcuk, S. Kolemen, G. Gulseren, T. Nalbantoglu, H. Boyaci, E. U. Akkaya, J. Am. Chem. Soc. 2010, 132,8029.
[10] L. M. Adleman, Science 1994, 266, 1021.[11] A. P. de Silva, N. D. McClenaghan, Chem. Eur. J. 2004, 10, 574.[12] T. H. Lee, J. I. Gonzalez, J. Zheng, R. M. Dickson, Acc. Chem. Res. 2005, 38, 534.
[13] A. P. de Silva, S. Uchiyama, Nat. Nanotechnol. 2007, 2, 399.[14] U. Pischel, Angew. Chem., Int. Ed. 2007, 46, 4026.[15] S. Erbas-Cakmak, S. Kolemen, A. C. Sedgwick, T. Gunnlaugsson, T. D. James, J. Yoon, E. U. Akkaya, Chem. Soc. Rev. 2018, 47, 2228.[16] S. C. Burdette, Eur. J. Inorg. Chem. 2015, 2015, 5728.[17] J. F. Callan, A. P. de Silva, J. Ferguson, A. J. M. Huxley, A. M. O'Brien, Tetrahedron 2004, 60, 11125.
[18] D. P. Kennedy, C. D. Incarvito, S. C. Burdette, Inorg. Chem. 2010, 49, 916.[19] D. C. Magri, G. J. Brown, G. D. McClean, A. Prasanna de Silva, J. Am. Chem. Soc. 2006, 128, 4950.[20] D. C. Magri, M. C. Fava, C. J. Mallia, Chem. Commun. 2014, 50, 1009.[21] (a) G. Naren, S. Li, J. Andréasson, Chem. Phys. Chem. 2017, 18, 1726. (b) E. U. Akkaya, E. Katz, U. Pischel, Chem. Phys. Chem. 2017, 18, 1665.
[22] (a) G. J. Scerri, M. Cini, J. S. Schembri, P. F. da Costa, A. D. Johnson, D. C. Magri, Chem. Phys. Chem. 2017, 18, 1742. (b) M. Baroncini, M. Semeraro,
A. Credi, Chem. Phys. Chem 2017, 18, 1755. (c) M. L. Wood, S. Domanskyi, V. Privman, Chem. Phys. Chem. 2017, 18, 1773.[23] (a) B. O. F. McKinney, B. Daly, C. Yao, M. Schroeder, A. P. de Silva, Chem. Phys. Chem. 2017, 18, 1760. (b) B. Fresch, F. Remacle, R. D. Levine, Chem.
Phys. Chem. 2017, 18, 1782.[24] (a) M. Gamella, M. Privman, S. Bakshi, A. Melman, E. Katz, Chem. Phys. Chem. 2017, 18, 1811. (b) A. Adamatzky, Chem. Phys. Chem. 2017, 18, 1822.
[25] S. Sreejith, A. Ajayaghosh, India J. Chem 2012, 51A, 47.[26] M. Massey, I. L. Medintz, M. G. Ancona, W. R. Algar, ACS Sens. 2017, 2, 1205.[27] D. Tzeli, I. D. Petsalakis, G. Theodorakopoulos, Phys. Chem. Chem. Phys. 2016, 18, 32132.[28] S. M. Núñez, E. Santos, H. M. Oliveira, J. L. C. Santos, C. Lodeiro, Chemistry Open 2014, 3, 190.[29] A. R. Chowdhury, P. Ghosh, B. G. Roy, S. K. Mukhopadhyay, P. Mitrae, P. Banerjee, RSC Adv. 2015, 5, 62017.
[30] Z.-H. Pan, G.-G. Luo, J.-W. Zhou, J.-X. Xia, K. Fang, R.-B. Wu, Dalton Trans. 2014, 43, 8499.[31] F. Yan, T. Zheng, S. Guo, D. Shi, Z. Han, S. Zhou, L. Chen, Spectrochim. Acta A 2015, 151, 881.
12 of 13 TZELI ET AL.

[32] A. P. de Silva, N. D. McClenaghan, J. Am. Chem. Soc. 2000, 122, 3965.[33] H. T. Baytekin, E. U. Akkaya, Org. Lett. 2000, 2, 1725.
[34] B. Valeur, I. Leray, Inorg. Chem. Acta 2007, 360, 765.[35] I. D. Petsalakis, D. Tzeli, I. S. K. Kerkines, G. Theodorakopoulos, Comput. Theoret. Chem. 2011, 965, 168.[36] I. D. Petsalakis, G. Theodorakopoulos, O. Buchman, R. Baer, Chem. Phys. Let. 2015, 625, 98.[37] S. Kümmel, Adv. Energy Mater. 2017, 7, 1700440.[38] N. Mardirossian, M. Head-Gordon, Mol. Phys. 2017, 115, 2315.
[39] Tzeli, I. D. Petsalakis, G. Theodorakopoulos, Phys. Chem. Chem. Phys. 2011, 13, 11965.[40] L. Xing, O. Borodin, Phys. Chem. Chem. Phys. 2012, 14, 12838.[41] D. Tzeli, P. G. Tsoungas, I. D. Petsalakis, P. Kozielewicz, M. Zloh, Tetrahedron 2015, 71, 359.[42] (a) D. Becke, J. Chem. Phys. 1993, 98, 1372. (b) C. Lee, W. Yang, R. G. Parr, Phys. Rev. B. 1988, 37, 785.
[43] (a) J. P. Perdew, K. Burke, M. Ernzerhof, Phys. Rev. Lett. 1996, 77, 3865. (b) M. Enzerhof, G. E. Scuseria, J. Chem. Phys. 1999, 110, 5029. (c) C. Adamo,
V. Barone, J. Chem. Phys. 1999, 110, 6158.[44] L. A. Curtiss, M. P. McGrath, J.-P. Blaudeau, N. E. Davis, R. C. Binning Jr., L. Radom, J. Chem. Phys. 1995, 103, 6104.[45] (a)P. J. Hay, W. R. Wadt, J. Chem. Phys. 1985, 82, 299. (b) L. E. Roy, P. J. Hay, R. L. Martin, J. Chem. Theory Comput. 2008, 4, 1029.[46] Tzeli, I. D. Petsalakis, G. Theodorakopoulos, Phys. Chem. Chem. Phys. 2011, 13, 954.
[47] M. Cozi, G. Scalmani, N. Rega, V. Barone, J. Chem. Phys. 2002, 117, 43.[48] (a) J. Tomasi, B. Mennucci, R. Cammi, Chem. Rev. 2005, 105, 2999. (b) A. Pedone, J. Bloino, S. Monti, G. Prampolini, V. Barone, Phys. Chem. Chem. Phys.
2010, 12, 1000.[49] M. Caricato, B. Mennucci, J. Tomasi, F. Ingrosso, R. Cammi, S. Corni, G. Scalmani, J. Chem. Phys. 2006, 124, 124520.[50] M. J. Frisch et al., Gaussian 09, Revision A.1, Gaussian, Inc, Wallingford CT 2009.
[51] D. Petsalakis, I. S. K. Kerkines, N. N. Lathiotakis, G. Theodorakopoulos, Chem. Phys. Lett. 2009, 479, 278.[52] D. Petsalakis, G. Theodorakopoulos, Chem. Phys. Lett. 2013, 586, 111.[53] T. Tzeli, G. Mercouris, T. I. D. Petsalakis, Comput. Theoret. Chem. 2017, 1115, 197.[54] R. Improta, C. Ferrante, R. Bozio, V. Barone, Phys. Chem. Chem. Phys. 2009, 11, 4664.[55] D. Tzeli, I. D. Petsalakis, G. Theodorakopoulos, J. Phys. Chem. A 2011, 115, 11749.
SUPPORTING INFORMATION
Additional supporting information may be found online in the Supporting Information section at the end of this article.
How to cite this article: Tzeli D, Petsalakis ID, Theodorakopoulos G. Theoretical study of the photophysical processes of a styryl-bodipy
derivative eliciting an AND molecular logic gate response. Int J Quantum Chem. 2019;e25958. https://doi.org/10.1002/qua.25958
TZELI ET AL. 13 of 13