theevolutionofpopular...
TRANSCRIPT
rsos.royalsocietypublishing.org
ResearchCite this article:Mauch M, MacCallum RM,Levy M, Leroi AM. 2015 The evolution ofpopular music: USA 1960–2010. R. Soc. opensci. 2: 150081.http://dx.doi.org/10.1098/rsos.150081
Received: 17 February 2015Accepted: 9 April 2015
Subject Category:Biology (whole organism)
Subject Areas:evolution/cognition/acoustics
Keywords:popular music, diversity, stylistic revolutions,cultural evolution
Author for correspondence:Matthias Mauche-mail: [email protected]
Electronic supplementary material is availableat http://dx.doi.org/10.1098/rsos.150081 or viahttp://rsos.royalsocietypublishing.org.
The evolution of popularmusic: USA 1960–2010Matthias Mauch1, Robert M. MacCallum2, Mark Levy3
and Armand M. Leroi2
1School of Electronic Engineering and Computer Science, Queen MaryUniversity of London, London E1 4NS, UK2Division of Life Sciences, Imperial College London, London SW7 2AZ, UK3Last.fm, 5-11 Lavingdon Street, London SE1 0NZ, UK
MM, 0000-0002-4352-6809
1. SummaryIn modern societies, cultural change seems ceaseless. The fluxof fashion is especially obvious for popular music. While muchhas been written about the origin and evolution of pop, mostclaims about its history are anecdotal rather than scientific innature. To rectify this, we investigate the US Billboard Hot100 between 1960 and 2010. Using music information retrievaland text-mining tools, we analyse the musical properties ofapproximately 17 000 recordings that appeared in the charts anddemonstrate quantitative trends in their harmonic and timbralproperties. We then use these properties to produce an audio-based classification of musical styles and study the evolutionof musical diversity and disparity, testing, and rejecting, severalclassical theories of cultural change. Finally, we investigatewhether pop musical evolution has been gradual or punctuated.We show that, although pop music has evolved continuously, itdid so with particular rapidity during three stylistic ‘revolutions’around 1964, 1983 and 1991. We conclude by discussing howour study points the way to a quantitative science of culturalchange.
2. IntroductionThe history of popular music has long been debated byphilosophers, sociologists, journalists, bloggers and pop stars[1–7]. Their accounts, though rich in vivid musical lore andaesthetic judgements, lack what scientists want: rigorous testsof clear hypotheses based on quantitative data and statistics.Economics-minded social scientists studying the history of musichave done better, but they are less interested in music thanthe means by which it is marketed [8–15]. The contrast withevolutionary biology—a historical science rich in quantitativedata and models—is striking, the more so because culturaland organismic variety are both considered to be the result of
2015 The Authors. Published by the Royal Society under the terms of the Creative CommonsAttribution License http://creativecommons.org/licenses/by/4.0/, which permits unrestricteduse, provided the original author and source are credited.
on May 13, 2018http://rsos.royalsocietypublishing.org/Downloaded from

2
rsos.royalsocietypublishing.orgR.Soc.opensci.2:150081
................................................
150
100
50
0
2
0
–2
AbG
F#FE
EbD
C#CB
BbA
121110
987654321
delta
MFC
C0
zero
cro
ssin
gco
unt
chro
ma
MFC
Cs
time (s)16 18 20 22 24
time (s)16 18 20 22 24
time (s)16 18 20 22 24
q q
T-topics H-topics
timbre classcluster
mapping
chord changedetection
countaggregation
LDA topicmapping
T1–T8 H1–H8
timbre harmony
audio
low-levelfeatures
lexiconconstruction
topicconstruction
topicvector
Figure 1. Data processing pipeline illustratedwith a segment of Queen’s Bohemian Rhapsody, 1975, one of the fewHot 100 hits to featurean astrophysicist on lead guitar.
modification-by-descent processes [16–19]. Indeed, linguists and archaeologists, studying the evolutionof languages and material culture, commonly apply the same tools that evolutionary biologists do whenstudying the evolution of species [20–25].
Until recently, the single greatest impediment to a scientific account of musical history has been a wantof data. That has changed with the emergence of large, digitized, collections of audio recordings, musicalscores and lyrics. Quantitative studies of musical evolution have quickly followed [26–30]. Here, we usea corpus of digitized music to investigate the history of American popular music. Drawing inspirationfrom studies of organic and cultural evolution, we view the history of pop music as a ‘fossil record’ andask the kinds of questions that a palaeontologist might: has the variety of popular music increased ordecreased over time? Is evolutionary change in popular music continuous or discontinuous? And, if it isdiscontinuous, when did the discontinuities occur?
To delimit our sample, we focused on songs that appeared in the US Billboard Hot 100 between 1960and 2010. We obtained 30-s-long segments of 17 094 songs covering 86% of the Hot 100, with a small biastowards missing songs in the earlier years. Because our aim is to investigate the evolution of populartaste, we did not attempt to obtain a representative sample of all the songs that were released in the USAin that period of time, but just those that were most commercially successful.
Like previous studies of pop-music history [28,30], our study is based on features extracted fromaudio rather than from scores. However, where these early studies focused on technical aspects ofaudio such as loudness, vocabulary statistics and sequential complexity, we have attempted to identifymusically meaningful features. To this end, we adopted an approach inspired by recent advances intext-mining (figure 1). We began by measuring our songs for a series of quantitative audio features,12 descriptors of tonal content and 14 of timbre (electronic supplementary material, M2–3). Thesewere then discretized into ‘words’ resulting in a harmonic lexicon (H-lexicon) of chord changes, anda timbral lexicon (T-lexicon) of timbre clusters (electronic supplementary material, M4). To relate theT-lexicon to semantic labels in plain English, we carried out expert annotations (electronic supplementary
on May 13, 2018http://rsos.royalsocietypublishing.org/Downloaded from
3
rsos.royalsocietypublishing.orgR.Soc.opensci.2:150081
................................................material, M5). The musical words from both lexica were then combined into 8 + 8 = 16 ‘topics’ usinglatent Dirichlet allocation (LDA). LDA is a hierarchical generative model of a text-like corpus, in whichevery document (here: song) is represented as a distribution over a number of topics, and every topicis represented as a distribution over all possible words (here: chord changes from the H-lexicon, andtimbre clusters from the T-lexicon). We obtain the most likely model by means of probabilistic inference(electronic supplementary material, M6). Each song, then, is represented as a distribution over eightharmonic topics (H-topics) that capture classes of chord changes (e.g. ‘dominant-seventh chord changes’)and eight timbral topics (T-topics) that capture particular timbres (e.g. ‘drums, aggressive, percussive’,‘female voice, melodic, vocal’, derived from the expert annotations), with topic proportions q. These topicfrequencies were the basis of our analyses.
3. Results3.1. The evolution of topicsBetween 1960 and 2010, the frequencies of the topics in the Hot 100 varied greatly: some topics becamerarer, others became more common, yet others cycled (figure 2). To help us interpret these dynamics, wemade use of associations between the topics and particular artists as well as genre-tags assigned by thelisteners of Last.fm, a web-based music discovery service with approximately 50 million users (electronicsupplementary material, M8). Considering the H-topics first, the most frequent was H8 (mean ± 95% CI:q̄ = 0.236 ± 0.003)—major chords without changes. Nearly two-thirds of our songs show a substantial(> 12.5%) frequency of this topic, particularly those tagged as CLASSIC COUNTRY, CLASSIC ROCK andLOVE (online tables). Its presence in the Hot 100 was quite constant, being the most common H-topic in43 of 50 years.
Other H-topics were much more dynamic. Between 1960 and 2009, the mean frequency of H1 declinedby about 75%. H1 captures the use of dominant-seventh chords. Inherently dissonant (because of thetritone interval between the third and the minor-seventh), these chords are commonly used in Jazz tocreate tensions that are eventually resolved to consonant chords; in Blues music, the dissonances aretypically not resolved and thus add to the characteristic ‘dirty’ colour. Accordingly, we find that songstagged BLUES or JAZZ have a high frequency of H1; it is especially common in the songs of Blues artistssuch as B.B. King and Jazz artists such as Nat ‘King’ Cole. The decline of this topic, then, represents thelingering death of Jazz and Blues in the Hot 100.
The remaining H-topics capture the evolution of other musical styles. H3, for example, embracesminor-seventh chords used for harmonic colour in funk, disco and soul—this topic is over-representedin FUNK and DISCO, and artists such as Chic and KC & The Sunshine Band. Between 1967 and 1977,the mean frequency of H3 more than doubles. H6 combines several chord changes that are a mainstayin modal rock tunes and therefore common in artists with big-stadium ambitions (e.g. Mötley Crüe,Van Halen, REO Speedwagon, Queen, Kiss and Alice Cooper). Its increase between 1978 and 1985, andsubsequent decline in the early 1990s, marks the age of Arena Rock. Of all H-topics, H5 shows the moststriking change in frequency. This topic, which captures the absence of identifiable chord structure, barelyfeatures in the 1960s and 1970s when, a few spoken-word-music collages aside (e.g. those of DickieGoodman), nearly all songs had clearly identifiable chords. H5 starts to become more frequent in the late1980s and then rises rapidly to a peak in 1993. This represents the rise of Hip Hop, Rap and related genres,as exemplified by the music of Busta Rhymes, Nas and Snoop Dog, who all use chords particularly rarely(online tables).
The frequencies of the timbral Topics, too, evolve over time. T3, described as ‘energetic, speech,bright’, shows the same dynamics as H5 and is also associated with the rise of Hip Hop-related genres.Several of the other timbral topics, however, appear to rise and fall repeatedly, suggesting recurringfashions in instrumentation. For example, the evolution of T4 (‘piano, orchestra, harmonic’) appearssinusoidal, suggesting a return in the 2000s to timbral qualities prominent in the 1970s. T5 (‘guitar,loud, energetic’) underwent two full cycles with peaks in 1966 and 1985, heading upward once morein 2009. The second, larger, peak coincides with a peak in H6, the chord changes also associated withstadium rock groups such as Mötley Crüe (online tables). Finally, T1 (‘drums, aggressive, percussive’)rises continuously until 1990, which coincides with the spread of new percussive technology suchas drum machines and the gated reverb effect famously used by Phil Collins on In the air tonight,1981. Accordingly, T1 is over-represented in songs tagged DANCE, DISCO and NEW WAVE and artistssuch as The Pet Shop Boys. After 1990, the frequency of T1 declines: the reign of the drum machinewas over.
on May 13, 2018http://rsos.royalsocietypublishing.org/Downloaded from

4
rsos.royalsocietypublishing.orgR.Soc.opensci.2:150081
................................................H1
dominant 7thchords
H2naturalminor
H4standarddiatonic
major chords,no changes
drums,aggressive,percussive
T2calm, quiet,
mellow
T3energetic,
speech, bright
piano,orchestra,harmonic
guitar, loud,energetic
T6/ay/, male voice,
vocal
T7/oh/, rounded,
mellow
T8female voice,
melodic, vocal
H7ambiguous
tonality
H6stepwise chord
changes
H5no chords
minor 7thchords
1960 1980 2000 1960 1980 2000 1960 1980year year
2000 1960 1980 2000 1960 1980 2000 1960 1980 2000 1960 1980 2000 1960 1980 2000
0.3
0.2
0.1
0.3
0.2
0.1
q–
q–
H3
H8 T5
T1 T4
Figure 2. Evolution of musical topics in the Billboard Hot 100. Mean topic frequencies (q̄)±95% CI estimated by bootstrapping.
3.2. The varieties of musicTo analyse the evolution of musical variety, we began by classifying our songs. Popular music is classifiedinto genres such as COUNTRY, ROCK AND ROLL, RHYTHM AND BLUES (R‘N’B) as well as a multitude ofsubgenres (DANCE-POP, SYNTHPOP, HEARTLAND ROCK, ROOTS ROCK, etc.). Such genres are, however,but imperfect reflections of musical qualities. Popular music genres such as COUNTRY and RAP partiallycapture musical styles but, besides being informal, are also based on non-musical factors such as the ageor ethnicity of performers (e.g. CLASSIC ROCK and K[OREAN]-POP) [5]. For this reason, we constructed ataxonomy of 13 styles by k-means clustering on principal components derived from our topic frequencies(figure 3 and electronic supplementary material, M9). We investigated all k < 25 and found that the bestclustering solution, as determined by mean silhouette score, was k = 13.
In order to relate Last.fm tags to the style clusters, we used a technique called enrichment analysisfrom bioinformatics. This technique is usually applied to arrive at biological interpretations of sets ofgenes, i.e. to find out what the ‘function’ of a set of genes is. Applying the GeneMerge enrichment-detection algorithm [31] to our style data, we found that all styles are strongly enriched for particulartags, i.e. for each style some Last.fm tags are significantly over-represented (electronic supplementarymaterial, table S1), so we conclude that they capture at least some of the structure of popular musicperceived by consumers. The evolutionary dynamics of our styles reflect well-known trends in popularmusic. For example, the frequency of style 4, strongly enriched for JAZZ, FUNK, SOUL and related tags,declines steadily from 1960 onwards. By contrast, styles 5 and 13, strongly enriched for ROCK-relatedtags, fluctuate in frequency, whereas style 2, enriched for RAP-related tags, is very rare before the mid-1980s but then rapidly expands to become the single largest style for the next 30 years, contracting againin the late 2000s.
What do our styles represent? Figure 3 shows that styles and their evolution relate to discretesubgroups of the charts (genres), and hierarchical cluster analysis suggests that styles can be groupedinto a higher hierarchy. However, we suppose that, unlike organisms of different biological species,all the songs in the charts comprise one large, highly structured, metapopulation of songs linked by anetwork of ancestor–descendant relationships arising from songwriters imitating their predecessors [32].Styles and genres, then, represent populations of music that have evolved unique characters (topics), orcombinations of characters, in partial geographical or cultural isolation, e.g. COUNTRY in the SouthernUSA during the 1920s or RAP in the South Bronx of the 1970s. These styles rise and fall in frequencyover time in response to the changing tastes of songwriters, musicians and producers, who are in turninfluenced by the audience.
3.3. Musical diversity has not declinedJust as palaeontologists have discussed the tempo and mode of evolutionary change in the fossil record[33], historians of music have discussed musical change and the processes that drive it. Some haveargued that oligopoly in the media industries has caused a relentless decline in cultural diversity ofnew music [1,2], whereas others suggest that such homogenizing trends are periodically interrupted bysmall competitors offering novel and varied content resulting in ‘cycles of symbol production’ [8,12]. Forwant of data, there have been few tests of either theory [9–11,14].
To test these ideas, we estimated four yearly measures of diversity (figure 4). We found that althoughall four evolve, two—topic diversity and disparity—show the most striking changes, both declining to a
on May 13, 2018http://rsos.royalsocietypublishing.org/Downloaded from

5
rsos.royalsocietypublishing.orgR.Soc.opensci.2:150081
................................................
hip
hop/
rap/
gang
sta
rap/
old
scho
ol
easy
list
enin
g/co
untr
y/lo
ve s
ong/
pian
o
love
son
g/sl
ow ja
ms/
soul
/fol
k
coun
try/
clas
sic
coun
try/
folk
/roc
kabi
lly
clas
sic
rock
/cou
ntry
/roc
k/si
nger
-son
gwri
ter
rock
/cla
ssic
roc
k/po
p/ne
w w
ave
rock
/har
d ro
ck/a
ltern
ativ
e/cl
assi
c-ro
ck
soul
/R’n
B/f
unk/
disc
o
nort
hern
sou
l/sou
l/hip
hop
/dan
ce
funk
/blu
es/d
ance
/blu
es r
ock
danc
e/ne
w w
ave/
pop/
elec
tron
ic
funk
/blu
es/ja
zz/s
oul
fem
ale-
voca
l/pop
/R’n
’B/M
otow
n
1960
1970
1980
1990
2000
2010 12 1110 9 87 65 43 13 12
Figure 3. Evolution of musical styles in the Billboard Hot 100. The evolution of 13 styles, defined by k-means clustering on principalcomponents of topic frequencies. The width of each spindle is proportional to the frequency of that style, normalized to each year. Thespindle contours are based on a±2-year moving average smoother; unsmoothed yearly frequencies are shown as grey horizontal lines.A hierarchical cluster analysis on the k-means centroids grouped our styles into several larger clusters here represented by a tree: anEASY-LISTENING+ LOVE-SONG cluster, a COUNTRY+ ROCK cluster and SOUL+ FUNK+ DANCE cluster; the fourth, most divergent, cluster only containsthe HIP HOP+ RAP-rich style 2. All resolved nodes have≥75% bootstrap support. Labels list the four most highly over-represented Last.fmuser tags in each style according toour enrichment analysis; see electronic supplementarymaterial, table S1 for full results. Shaded regionsdefine eras separated by musical revolutions (figure 5).
minimum around 1986, but then rebounding and increasing to a maximum in the early 2000s. Becauseneither of these measures track song number, their dynamics cannot be due to varying numbers of songsin the Hot 100; nor, because our sampling over 50 years is nearly complete, can they be due to the over-representation of recent songs—the so-called pull of the recent [34]. Instead, their dynamics are due tochanges in the frequencies of musical styles.
The decline in topic diversity and disparity in the early 1980s is due to a decline of timbral ratherthan harmonic diversity (electronic supplementary material, figure S1). This can be seen in the evolutionof particular topics (figure 2). In the early 1980s timbral topics T1 (drums, aggressive, percussive) andT5 (guitar, loud, energetic) become increasingly dominant; the subsequent recovery of diversity is dueto the relative decrease in frequency of the these topics as T3 (energetic, speech, bright) increases. Putin terms of styles, the decline of diversity is due to the dominance of genres such as NEW WAVE, DISCO,HARDROCK; its recovery is due to their waning with the rise of RAP and related genres (figure 2). Contraryto current theories of musical evolution, then, we find no evidence for the progressive homogenization ofmusic in the charts and little sign of diversity cycles within the 50 year time frame of our study. Instead,the evolution of chart diversity is dominated by historically unique events: the rise and fall of particularways of making music.
on May 13, 2018http://rsos.royalsocietypublishing.org/Downloaded from

6
rsos.royalsocietypublishing.orgR.Soc.opensci.2:150081
................................................
200 400DN
600 9 10 11 12DS DT
6.8 7.2 7.6 –2 0 2
DY
1960
1970
1980
1990
2000
2010
Figure 4. Evolution of musical diversity in the Billboard Hot 100. We estimate four measures of diversity. From left to right: song numberin the charts,DN, depends only on the rate of turnover of unique entities (songs), and takes no account of their phenotypic similarity. Classdiversity,DS, is the effective number of styles and captures functional diversity. Topic diversity,DT, is the effective number ofmusical topicsused each year, averaged across the harmonic and timbral topics. Disparity, DY, or phenotypic range is estimated as the total standarddeviation within a year. Note that although in ecology DS and DY are often applied to sets of distinct species or lineages they need not be;our use of them implies nothing about the ontological status of our styles and topics. For full definitions of the diversity measures, seeelectronic supplementary material, M11. Shaded regions define eras separated by musical revolutions (figure 5).
3.4. Musical evolution is punctuated by revolutionsThe history of popular music is often seen as a succession of distinct eras, e.g. the ‘Rock Era’, separatedby revolutions [3,6,14]. Against this, some scholars have argued that musical eras and revolutionsare illusory [5]. Even among those who see discontinuities, there is little agreement about when theyoccurred. The problem, again, is that data have been scarce, and objective criteria for deciding whatconstitutes a break in a historical sequence scarcer yet.
To determine directly whether rate discontinuities exist we divided the period 1960–2010 into 200quarters and used the principal components of the topic frequencies to estimate a pairwise distancematrix between them (figure 5a). This matrix suggested that, while musical evolution was ceaseless,there were periods of relative stasis punctuated by periods of rapid change. To test this impression, weapplied a method from Music Information Retrieval, Foote Novelty, which estimates the magnitude ofchange in a distance matrix over a given temporal window [35]. The method relies on a kernel matrixwith a checkerboard pattern. Because a distance matrix exposes just such a checkerboard pattern atchange points [35], convolving it with the checkerboard kernel along its diagonal directly yields thenovelty function (electronic supplementary material, M11). We calculated Foote Novelty for all windowsbetween 1 and 10 years and, for each window, determined empirical significance cut-offs based onrandom permutation of the distance matrix. We identified three revolutions: a major one around 1991and two smaller ones around 1964 and 1983 (figure 5b). From peak to succeeding trough, the rate ofmusical change during these revolutions varied four- to six-fold.
This temporal analysis, when combined with our style clusters (figure 3), shows how musicalrevolutions are associated with the expansion and contraction of particular musical styles. Usingquadratic regression models, we identified the styles that showed significant (p < 0.01) change infrequency against time in the 6 years surrounding each revolution (electronic supplementary material,table S2). We also carried out a style-enrichment analysis for the same periods (electronic supplementarymaterial, table S2). Of the three revolutions, 1964 was the most complex, involving the expansion ofseveral styles—1, 5, 8, 12 and 13—enriched at the time for SOUL- and ROCK-related tags. These gainswere bought at the expense of styles 3 and 6, both enriched for DOOWOP among other tags. The 1983revolution is associated with an expansion of three styles—8, 11 and 13—here enriched for NEW WAVE-,DISCO- and HARD ROCK-related tags and the contraction of three styles—3, 7 and 12—here enriched forSOFT ROCK-, COUNTRY-related or SOUL + R‘N’B-related tags. The largest revolution of the three, 1991, isassociated with the expansion of style 2, enriched for RAP-related tags, at the expense of styles 5 and 13,here enriched for ROCK-related tags. The rise of RAP and related genres appears, then, to be the single
on May 13, 2018http://rsos.royalsocietypublishing.org/Downloaded from

7
rsos.royalsocietypublishing.orgR.Soc.opensci.2:150081
................................................
0.05
0.001
1960
1970
1980
1990
2000
2010(a)
(b)
0.01
year
1960 1970 1980 1990 2000 2010
10
5
2
1
kern
el h
alf-
wid
th (
year
)
Figure 5. Musical revolutions in the Billboard Hot 100. (a) Quarterly pairwise distance matrix of all the songs in the Hot 100. (b) Rateof stylistic change based on Foote Novelty over successive quarters for all windows 1–10 years, inclusive. The rate of musical change—slow-to-fast—is represented by the colour gradient blue, green, yellow, red, brown: 1964, 1983 and 1991 are periods of particularly rapidmusical change. Using a FooteNovelty kernelwith a half-width of 3 years results in significant change in these periods,withNovelty peaksin 1963–Q4 (p< 0.01), 1982–Q4 (p< 0.01) and 1991–Q1 (p< 0.001)marked by dashed lines. Significance cut-offs for all windowswereempirically determined by random permutation of the distance matrix. Significance contour lines with p-values are shown in black.
most important event that has shaped the musical structure of the American charts in the period thatwe studied.
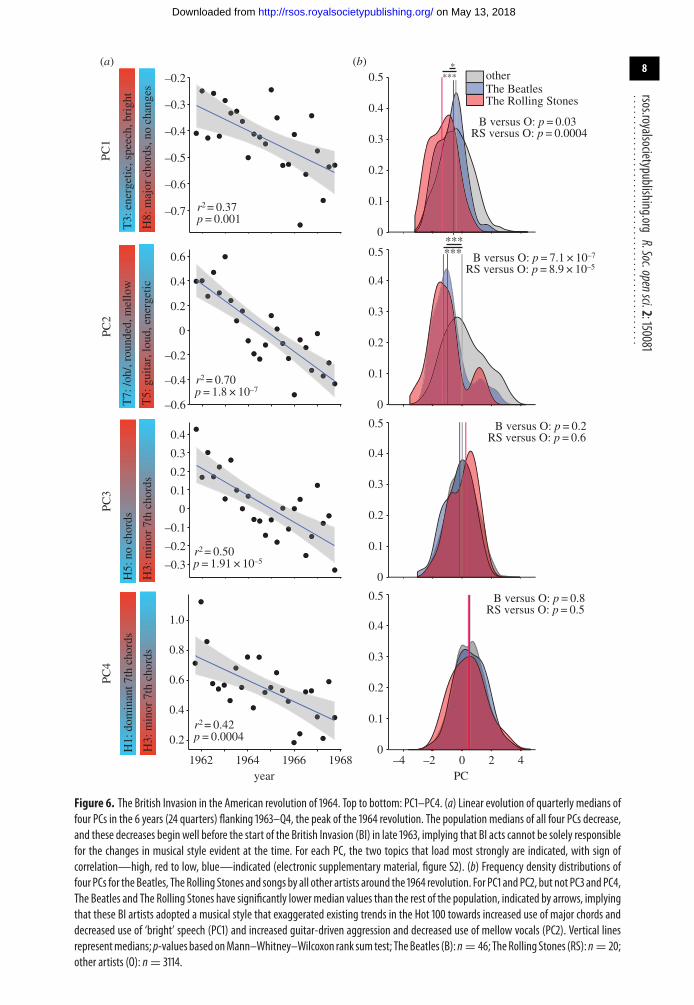
3.5. The British did not start the American revolution of 1964Our analysis does not reveal the origins of musical styles; rather, it shows when changes in stylefrequency affect the musical structure of the charts. Bearing this in mind, we investigated the roles ofparticular artists in one revolution. On 26 December 1963, The Beatles released I want to hold your hand inthe USA. They were swiftly followed by dozens of British acts who, over the next few years, flooded theAmerican charts. It is often claimed that this ’British Invasion’ (BI) was responsible for musical changesof the time [36]. Was it? As noted above, around 1964, many styles were changing in frequency; manyprincipal components of the topic frequencies show linear changes in this period too. Inspection ofthe first four PCs shows that their evolutionary trajectories were all established before 1964, implyingthat, whereas the British may have contributed to this revolution, they could not have been entirelyresponsible for it (figure 6a). We then compared two of the most successful BI acts, The Beatles and The
on May 13, 2018http://rsos.royalsocietypublishing.org/Downloaded from
8
rsos.royalsocietypublishing.orgR.Soc.opensci.2:150081
................................................
–0.7
–0.6
–0.5
–0.4
–0.3
–0.2
–0.6
–0.4
–0.2
0
0.2
0.4
0.6
–0.3
–0.2
–0.1
0
0.1
0.2
0.3
0.4
0.2
0.4
0.6
0.8
1.0
1962 1964 1966 1968
0
0.1
0.2
0.3
0.4
0.5
0
0.1
0.2
0.3
0.4
0.5
0
0.1
0.2
0.3
0.4
0.5
0
0.1
0.2
0.3
0.4
0.5
–4 –2 0 2 4
otherThe BeatlesThe Rolling Stones
year
PC1
PC2
PC3
PC4
PC
r2 = 0.37p = 0.001
r2 = 0.70p = 1.8 × 10⁻⁷
r2 = 0.50p = 1.91 × 10⁻⁵
r2 = 0.42p = 0.0004
B versus O: p = 0.03RS versus O: p = 0.0004
B versus O: p = 7.1 × 10⁻⁷
RS versus O: p = 8.9 × 10⁻⁵
B versus O: p = 0.2RS versus O: p = 0.6
B versus O: p = 0.8RS versus O: p = 0.5
(a) (b)
T44
T4
TT H8:
maj
or c
hord
s, n
o ch
ange
s4444
T4
T4
T4
T4
TT3:
ene
rget
ic, s
peec
h, b
righ
t
T5:
gui
tar,
loud
, ene
rget
ic
T7:
/oh/
, rou
nded
, mel
low
H3:
min
or 7
th c
hord
s
H5:
no
chor
ds
H3:
min
or 7
th c
hord
s
H1:
dom
inan
t 7th
cho
rds
******
****
Figure 6. The British Invasion in the American revolution of 1964. Top to bottom: PC1–PC4. (a) Linear evolution of quarterly medians offour PCs in the 6 years (24 quarters) flanking 1963–Q4, the peak of the 1964 revolution. The population medians of all four PCs decrease,and these decreases begin well before the start of the British Invasion (BI) in late 1963, implying that BI acts cannot be solely responsiblefor the changes in musical style evident at the time. For each PC, the two topics that load most strongly are indicated, with sign ofcorrelation—high, red to low, blue—indicated (electronic supplementary material, figure S2). (b) Frequency density distributions offour PCs for the Beatles, The Rolling Stones and songs by all other artists around the 1964 revolution. For PC1 and PC2, but not PC3 and PC4,The Beatles and The Rolling Stones have significantly lower median values than the rest of the population, indicated by arrows, implyingthat these BI artists adopted a musical style that exaggerated existing trends in the Hot 100 towards increased use of major chords anddecreased use of ‘bright’ speech (PC1) and increased guitar-driven aggression and decreased use of mellow vocals (PC2). Vertical linesrepresentmedians;p-values based onMann–Whitney–Wilcoxon rank sum test; TheBeatles (B):n= 46; TheRolling Stones (RS):n= 20;other artists (O): n= 3114.
on May 13, 2018http://rsos.royalsocietypublishing.org/Downloaded from

9
rsos.royalsocietypublishing.orgR.Soc.opensci.2:150081
................................................Rolling Stones, with the rest of the Hot 100 (figure 6b). In the case of PC1 and PC2, the songs of both bandshave (low) values that anticipate the Hot 100’s trajectory: for these musical attributes, they were literallyahead of the curve. In the case of PC3 and PC4, their songs resemble the rest of the Hot 100: for thesemusical attributes, they were merely on-trend. Together, these results suggest that, even if the British didnot initiate the American revolution of 1964, they did exploit it and, to the degree that they were imitatedby other artists, fanned its flames. Indeed, the extraordinary success of these two groups—66 Hot 100hits between them prior to 1968—may be attributable to their having done so.
4. Discussion and ConclusionOur findings provide a quantitative picture of the evolution of popular music in the USA over thecourse of 50 years. As such, they form the basis for the scientific study of musical change. Those whowish to make claims about how and when popular music changed can no longer appeal to anecdote,connoisseurship and theory unadorned by data. Similarly, recent work has shown that it is possibleto identify discrete stylistic changes in the history of Western classical music by clustering on motifsextracted from a corpus of written scores [29]. Insofar that our approach is based on audio, it can alsobe applied to music for which no scores exist, including that from pre-Modern cultures [19,37,38]. Wehave already applied a similar approach to the classification of art music (‘classical music’) into historicalperiods [39]. More generally, music is a natural starting point for the study of stylistic evolution becauseit is not only a universal human cultural trait [40] but also measurable, largely determined by form, andavailable in a relatively standardized format (digital recordings).
Our study is limited in several ways. First, it is limited by the features studied. Our measures mustcapture only a fraction of the phenotypic complexity of even the simplest song; other measures maygive different results. However, the finding that our classifications are supported by listener genre-tagsgives us some confidence that we have captured an important part of the perceptible variance of oursample. Second, in confining our study to the Hot 100, 1960–2010, we have only sampled a small fractionof the new singles released in the USA; a complete picture would require compiling a database of severalmillion songs, which in itself is a challenge [41]. Given that the Hot 100 is certainly a biased subset of thesesongs, our conclusions cannot be extended to the population of all releases. Finally, we are interested inextending the temporal range of our sample to at least the 1940s—if only to see whether 1955 was, asmany have claimed, the birth date of Rock’n’Roll [42].
We have not addressed the causes of the dynamics that we detect. Like any cultural artefact—and anyliving organism—music is the result of a variational-selection process [16–19]. In evolutionary biology,causal explanations of organismal diversity appeal to intrinsic constraints (developmental or genetic),ecological factors (competition among individuals or lineages) and stochastic events (e.g. rocks fromspace) [43–45]. By analogy, a causal account of the evolution of music must ultimately contain an accountof how musicians imitate, and modify, existing music when creating new songs, that is, an accountof the mode of inheritance, the production of musical novelty and its constraints. The first of these—inheritance and its constraints—is obscure [46,47]; the second—selection—less so. The selective forcesacting upon new songs are at least partly captured by their rise and fall through the ranks of the charts.Many anecdotal histories of music attempt to explain these dynamics. For example, the rise of rap inthe charts has been credited to the television show Yo, MTV Raps! first broadcast in 1988 [48]. A general,multilevel, selection theory, not restricted to Mendelian inheritance, should provide a means for suchhypotheses to be tested [49–51].
Finally, we note that the statistical tools used in this study are quite general. LDA can be used tostudy the evolving structure of many kinds of assemblages; Foote Novelty can be used to detect ratediscontinuities in temporal sequences of distances based on many kinds of phenotypes. Such tools,and the existence of large digital corpora of cultural artefacts—texts, music, images, computer-aideddesign (CAD) files—now permits the evolutionary analysis of many dimensions of modern culture. Weanticipate that the study of cultural trends based upon such datasets will soon constrain and inspiretheories about the evolution of culture just as the fossil record has for the evolution of life [52,53].
Data accessibility. All methods and supplementary figures and tables are available in the electronic supplementarymaterial. Extensive data, including song titles, artists, topic frequencies and tags are available from the Figsharerepository: main data frame 10.6084/m9.figshare.1309953; secondary data frame 10.6084/m9.figshare.1309950.Acknowledgements. We thank the public participants in this study; Austin Burt, Katy Noland and Peter Foster forcomments on the manuscript; Last.fm for musical samples; Queen Mary University of London for the use ofhigh-performance computing facilities.Funding statement. M.M. is supported by a Royal Academy of Engineering Research Fellowship.
on May 13, 2018http://rsos.royalsocietypublishing.org/Downloaded from

10
rsos.royalsocietypublishing.orgR.Soc.opensci.2:150081
................................................Author contributions. M.L. provided data; M.M., R.M.M. and A.M.L. analysed the data; M.M. and A.M.L. conceived thestudy, designed the study, coordinated the study and wrote the manuscript. All authors gave final approval forpublication.Conflict of interests. We have no competing interests.
References1. Adorno TW. 1941 On popular music. Stud. Philos.
Soc. Sci. 9, 17–48.2. Adorno TW. 1975 Culture industry reconsidered.
New German Critique 6, 12–19. (doi:10.2307/487650)3. Frith S. 1988Music for pleasure. Cambridge, UK:
Polity Press.4. Mauch M. 2011 The anatomy of the UK charts: a
light-hearted investigation of 50 years of UK chartsusing audio data; collection of 5 blog posts. Seehttp://schall-und-mauch.de/anatomy-of-the-charts/.
5. Negus K. 1996 Popular music theory. Cambridge, UK:Polity.
6. Stanley B. 2013 Yeah yeah yeah: the story of modernpop. London: Faber & Faber.
7. Morrissey SP. 2013 Autobiography. London, UK:Penguin.
8. Peterson RA, Berger DG. 1975 Cycles in symbolproduction. Am. Soc. Rev. 40, 158–173. (doi:10.2307/2094343)
9. Lopes PD. 1992 Innovation and diversity in thepopular music industry, 1969–1990. Am. Sociol. Rev.57, 56–71. (doi:10.2307/2096144)
10. Christianen M. 1995 Cycles in symbol production? Anewmodel to explain concentration, diversity, andinnovation in the music Industry. Popular Music 14,55–93. (doi:10.1017/S0261143000007637)
11. Alexander PJ. 1996 Entropy and popular culture:product diversity in the popular music recordingindustry. Am. Sociol. Rev. 61, 171–174. (doi:10.2307/2096412)
12. Peterson RA, Berger DG. 1996 Measuring industryconcentration, diversity, and innovation in popularmusic. Am. Sociol. Rev. 61, 175–178. (doi:10.2307/2096413)
13. Crain WM, Tollinson RD. 1997 Economics and thearchitecture of popular music. J. Econ. Behav. Organ.901, 185–205. (doi:10.1016/S0167-2681(96)00901-8)
14. Tschmuck P. 2006 Creativity and innovation in themusic industry. Dordrecht, The Netherlands:Springer.
15. Klein CC, Slonaker SW. 2010 Chart turnover and salesin the recorded music industry: 1990–2005. Rev. Ind.Organ. 36, 351–372. (doi:10.1007/s11151-010-9250-z)
16. Leroi AM, Swire J. 2006 The recovery of the past.World of Music 48, 43–54.
17. Jan S. 2007 The memetics of music: a Neo-Darwinianview of musical structure and culture. Farnham, UK:Ashgate.
18. MacCallum RM, Mauch M, Burt A, Leroi AM. 2012Evolution of music by public choice. Proc. Natl Acad.Sci. USA 109, 12 081–12 086. (doi:10.1073/pnas.1203182109)
19. Savage PE, Brown S. 2013 Toward a newcomparative musicology. Anal. Approach. WorldMusic 2, 148–197.
20. Cavalli-Sforza LL. 1981 Cultural transmission andevolution: a quantitative approach. Princeton, NJ:Princeton University Press.
21. Boyd R, Richerson PJ. 1985 Culture and theevolutionary process. Chicago, IL: University ofChicago Press.
22. Shennan S. 2009 Pattern and process in culturalevolution. Berkley, CA: University of CaliforniaPress.
23. Steele J, Jordan P, Cochrane E. 2010 Evolutionaryapproaches to cultural and linguistic diversity. Phil.Trans. R. Soc. B 365, 3781–3785. (doi:10.1098/rstb.2010.0202)
24. Mesoudi A. 2011 Cultural evolution: how Darwiniantheory can explain human culture and synthesize thesocial sciences. Chicago, IL: University of ChicagoPress.
25. Whiten A, Hinde RA, Stringer C, Laland KN. 2012Culture evolves. Oxford, UK: Oxford University Press.
26. Dodds PS, Danforth CM. 2010 Measuring thehappiness of large-scale written expression: songs,blogs, and presidents. J. Happ. Stud. 11, 441–456.(doi:10.1007/s10902-009-9150-9)
27. Shanahan D, Broze Y. 2012 A diachronic analysis ofharmonic schemata in jazz. In Proc. 12th Int. Conf. onMusic Perception and Cognition and the 8th TriennialConf. of the European Society for the CognitiveSciences of Music, Thessaloniki, Greece, 23–28 July2012, pp. 909–917.
28. Serrà J, Corral A, Boguñá M, Haro M, Arcos JLI. 2012Measuring the evolution of contemporary Westernpopular music. Sci. Rep. 2, 521 .(doi:10.1038/srep00521)
29. Rodriguez Zivic PH, Shifres F, Cecchi GA. 2013Perceptual basis of evolving Western musical styles.Proc. Natl Acad. Sci. USA 110, 10 034–10 038. (doi:10.1073/pnas.1222336110)
30. Foster P, Mauch M, Dixon S. 2014 Sequentialcomplexity as a descriptor for musical similarity.IEEE Trans. Audio, Speech, Lang. Process. 22,1965–1977. (doi:10.1109/TASLP.2014.2357676)
31. Castillo-Davis CI, Hartl DL. 2003 GeneMerge – postgenomic analysis, data mining, and hypothesistesting. Bioinformatics 19, 891–892. (doi:10.1093/bioinformatics/btg114)
32. Zollo P. 2003 Songwriters on songwriting. Jackson,TN: Da Capo Press.
33. Simpson GG. 1944 Tempo andmode in evolution.New York, NY: Columbia University Press.
34. Jablonski D, Roy K, Valentine JW, Price RM,Anderson PS. 2003 The impact of the pull ofthe recent on the history of bivalve diversity.Science 300, 1133–1135. (doi:10.1126/science.1083246)
35. Foote J. 2000 Automatic audio segmentation usinga measure of audio novelty. In IEEE Int. Conf. onMultimedia and Expo., New York, NY, 30 July–2August 2000, vol. 1, pp. 452–455.
36. Fitzgerald J. 1995 When the Brill building metLennon–McCartney: continuity and change in theearly evolution of the mainstream pop song.
Popular Music Soc. 19, 59–77. (doi:10.1080/03007769508591581)
37. Lomax A. 1968 Folk song style and culture.Washington, DC: American Association for theAdvancement of Science.
38. Lomax A, Berkowitz N. 1972 The evolutionarytaxonomy of culture. Science 177, 228–239.(doi:10.1126/science.177.4045.228)
39. Weiß C, Mauch M, Dixon S. 2014 Timbre-invariantaudio features for style analysis of classical music. InProc. 11th Music Computing Conf. (SMC 2014),Athens, Greece, 14–20 September 2014,pp. 1461–1468.
40. Brown DE. 1991 Human universals. Philadelphia, PA:Temple University Press.
41. Bertin-Mahieux T, Ellis DPW, Whitman B, Lamere P.2011 The million song dataset. In Proc. 12th Int. Soc.Music Information Retrieval Conf. (ISMIR 2011),Miami, FL, 24–28 October 2011, pp. 591–596.
42. Peterson RA. 1990 Why 1955? Explaining the adventof rock music. Popular Music 9, 97–116. (doi:10.1017/S0261143000003767)
43. Erwin DH. 2007 Disparity: morphological patternand developmental context. Palaeontology50, 57–73. (doi:10.1111/j.1475-4983.2006.00614.x)
44. Gould SJ. 2002 The structure of evolutionarytheory. Cambridge, MA: Harvard UniversityPress.
45. Jablonski D. 2008 Species selection: theory anddata. Annu. Rev. Ecol. Syst. 39, 501–524. (doi:10.1146/annurev.ecolsys.39.110707.173510 )
46. Pachet F. 2006 Creativity studies and musicalinteraction. InMusical creativity: multidisciplinaryresearch in theory and practice (eds I Deliège, GAWiggins), pp. 347–358. Hove, UK: PsychologyPress.
47. McIntyre P. 2008 Creativity and cultural production:a study of contemporary Western popular musicsongwriting. Creat. Res. J. 20, 40–52. (doi:10.1080/10400410701841898)
48. George N. 2005 Hip hop America. London, UK:Penguin.
49. Price GR. 1970 Selection and covariance. Nature 227,520–521. (doi:10.1038/227520a0)
50. Price GR. 1972 Extension of covariance selectionmathematics. Ann. Hum. Genet. 35,485–490. (doi:10.1111/j.1469-1809.1957.tb01874.x)
51. Frank SA. 1995 George Price’s contributions toevolutionary genetics. J. Theor. Biol. 175, 373–388.(doi:10.1006/jtbi.1995.0148)
52. Michel J et al. 2011 Quantitative analysis of cultureusing millions of digitized books. Science 331,176–182. (doi:10.1126/science.1199644)
53. Perc M. 2012 Evolution of the most common Englishwords and phrases over the centuries. J. R. Soc.Interface 9, 3323–3328. (doi:10.1098/rsif.2012.0491)
on May 13, 2018http://rsos.royalsocietypublishing.org/Downloaded from