on march 3, 2018 identificationofthebeagle...
TRANSCRIPT
rsos.royalsocietypublishing.org
ResearchCite this article: Bridges JC et al.. 2017Identification of the Beagle 2 lander on Mars.R. Soc. open sci. 4: 170785.http://dx.doi.org/10.1098/rsos.170785
Received: 27 June 2017Accepted: 13 September 2017
Subject Category:Astronomy
Subject Areas:space exploration/solar system
Keywords:Beagle 2, Mars, HiRISE
Author for correspondence:J. C. Bridgese-mail: [email protected]
Electronic supplementary material is availableonline at https://dx.doi.org/10.6084/m9.figshare.c.3899092.
Identification of the Beagle2 lander on MarsJ. C. Bridges1, J. Clemmet2, M. Croon3, M. R. Sims1,
D. Pullan1, J.-P. Muller4, Y. Tao4, S. Xiong4, A. R. Putri4,
T. Parker5, S. M. R. Turner1 and J. M. Pillinger61Leicester Institute for Space and Earth Observation, Department of Physics andAstronomy, University of Leicester, Leicester LE1 7RH, UK2Airbus, Gunnels Wood Road, Stevenage SG1 2AS, UK3Citizen Scientist4Mullard Space Science Laboratory, Department of Space and Climate Physics,University College London, Holmbury St Mary RH5 6NT, UK5Jet Propulsion Laboratory, 4800 Oak Grove Drive, Pasadena, CA 91109, USA6School of Physical Sciences, The Open University, Walton Hall,Milton Keynes MK7 6AA, UK
JCB, 0000-0002-9579-5779
The 2003 Beagle 2 Mars lander has been identified in IsidisPlanitia at 90.43° E, 11.53° N, close to the predicted targetof 90.50° E, 11.53° N. Beagle 2 was an exobiology landerdesigned to look for isotopic and compositional signs of lifeon Mars, as part of the European Space Agency Mars Express(MEX) mission. The 2004 recalculation of the original landingellipse from a 3-sigma major axis from 174 km to 57 km,and the acquisition of Mars Reconnaissance Orbiter HighResolution Imaging Science Experiment (HiRISE) imagery at30 cm per pixel across the target region, led to the initialidentification of the lander in 2014. Following this, more HiRISEimages, giving a total of 15, including red and blue-greencolours, were obtained over the area of interest and searched,which allowed sub-pixel imaging using super high-resolutiontechniques. The size (approx. 1.5 m), distinctive multilobedshape, high reflectivity relative to the local terrain, specularreflections, and location close to the centre of the plannedlanding ellipse led to the identification of the Beagle 2 lander.The shape of the imaged lander, although to some extentmasked by the specular reflections in the various images, isconsistent with deployment of the lander lid and then someor all solar panels. Failure to fully deploy the panels—whichmay have been caused by damage during landing—wouldhave prohibited communication between the lander and MEXand commencement of science operations. This implies that
2017 The Authors. Published by the Royal Society under the terms of the Creative CommonsAttribution License http://creativecommons.org/licenses/by/4.0/, which permits unrestricteduse, provided the original author and source are credited.
on May 15, 2018http://rsos.royalsocietypublishing.org/Downloaded from

2
rsos.royalsocietypublishing.orgR.Soc.opensci.4:170785
................................................the main part of the entry, descent and landing sequence, the ejection from MEX, atmospheric entryand parachute deployment, and landing worked as planned with perhaps only the final full paneldeployment failing.
1. Introduction1.1. The Beagle 2 missionBeagle 2 was the small (72.7 kg including entry and landing systems) UK-led probe which was part ofEuropean Space Agency’s (ESA’s) Mars Express (MEX) mission launched on 2 June 2003. Beagle 2 wasnamed after H.M.S. Beagle, the ship Charles Darwin sailed on between 1831 and 1836, during whichvoyage he made many of the observations that led him to write On the Origin of Species. Beagle 2 wasEurope’s first Mars lander project [1]. The lander (approx. 33 kg) was designed to search for extinctlife via isotopically fractionated organic material on and below (approx. 2 m) the surface using the gasanalysis package (GAP) mass spectrometer and a stepped combustion-based system [2]. Sub-surfacesamples would have been obtained using the so-called ‘mole’, a hammering self-burying penetrometer-type mechanism [3]. It was also designed to study the inorganic chemistry and mineralogy of the landingsite with its other instruments [2] and take multispectral imagery with PanCam [4]. GAP was alsodesigned to search for methane within the atmosphere as a potential biomarker and science objectivesincluded attempting in situ K-Ar age dating of samples [5]. The original, planned landing site in IsidisPlanitia at 11.60° areocentric north latitude, 90.74° eastward longitude and –3367 m MOLA elevation(figures 1 and 2) was described in [6]. The 3-sigma landing ellipse size at the time of launch was 174 × 106km with a 74.9° azimuth. This ellipse had an area of 14 500 km2 posing a considerable challenge to anyattempt to locate the lander and associated hardware. The entry, descent and landing (EDL) design wasbased on concepts developed for the Huygens parachute landing on Titan and NASA’s Pathfinder andMars Exploration Rovers (MERs) [7,8], with adaptations and design changes as needed for Beagle 2 andMEX [9].
Beagle 2 was successfully ejected from MEX during its approach to Mars on 19 December 2003. Allpre-ejection telemetry showed the probe to be in good health. Entry into the atmosphere was expectedat 02.51.22 on 25 December 2003 with touchdown on the surface 8 min later with first data transmissionfrom the surface via NASA’s Mars Odyssey spacecraft expected at 05.25 [10]. No communication withBeagle 2 was possible until successful deployment of all four solar panels (§1.2) and after four monthsof attempts at communication (24 in total) via both Mars Odyssey and MEX, the lander, unable tocommunicate with Earth, was assumed to be lost. No communication was possible during EDL as therewas no Mars spacecraft in the correct position to receive any signal owing to MER entry operationsand MEX orbital insertion. Hence, no such communication system was built for Beagle 2. The LovellRadio Telescope, at Jodrell Bank, UK, which acted as a ‘direct to Earth’ listening station was also notvisible during EDL although attempts were made to detect Beagle 2 surface transmissions on 25, 26and 27 December 2003 using the telescope. The last of these attempts were made in conjunction withthe Stanford radio telescope. The reasons for the loss have remained unclear. An ESA enquiry in 2004[11] detailed a number of potential causes for the loss including failure of airbags, potential tanglingwith parachute during airbag bounces. The project also held its own internal enquiry and catalogued anumber of potential causes for the loss and produced a lessons-learnt document [12]. However, owingto lack of information it was not possible to eliminate any of the many potential causes.
In 2004, the landing ellipse size was recalculated—using Monte Carlo simulations and more accurateatmospheric entry coordinates [13,14] derived from MEX data—with a semi-major axis of 28.5 km anda semi-minor axis of 3.8 km, and this made identifying Beagle 2 on the Isidis ground surface morefeasible with High Resolution Imaging Science Experiment (HiRISE) (figures 1 and 2). Isidis is a generallyflat plain with moderate topography and relatively few slopes greater than a few degrees [6]. Thepositive surface features, e.g. figure 2, are surface expressions of relict craters, possible tuff cones andwrinkle ridges. The partial infilling of some larger kilometre-size craters was interpreted as a result ofan Amazonian sedimentary influx across the basin’s underlying Hesperian volcanic basement [6]. Thegenerally subdued topography means that identifying the Beagle 2 lander (example of the HiRISE imagesused in figure 2) was feasible. HiRISE is a 25 cm per pixel resolution camera with 400–1000 nm red : blue-green colour capability onboard the Mars Reconnaissance Orbiter, which has a 255 × 300 km orbit [15].It has been in operation since 2006 and using this high resolution and colour, previous landers have
on May 15, 2018http://rsos.royalsocietypublishing.org/Downloaded from
3
rsos.royalsocietypublishing.orgR.Soc.opensci.4:170785
................................................
12.5
89.0 89.5 90.0 90.5
east longitude (°)
91.0 91.5 92.0
0 10 km
12.0
11.5
latti
tude
(°)
11.0
norminal target: 90.74° E, 11.60° Nreconstructed target: 90.54° E, 11.53° Nbeagle 2: 90.43° E, 11.53° N
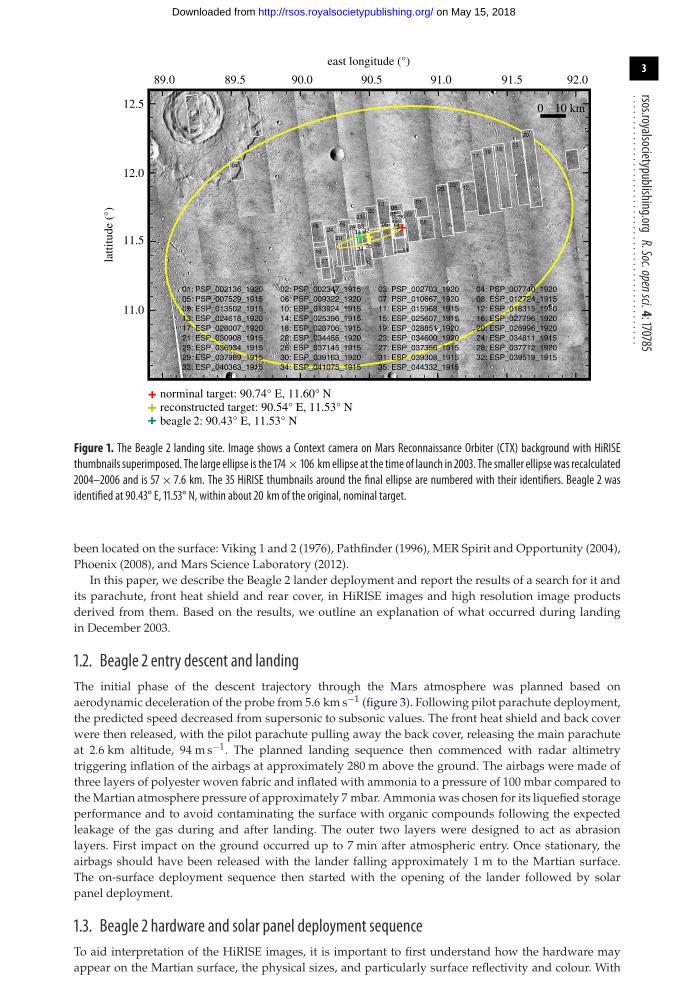
Figure 1. The Beagle 2 landing site. Image shows a Context camera on Mars Reconnaissance Orbiter (CTX) background with HiRISEthumbnails superimposed. The large ellipse is the 174× 106 km ellipse at the time of launch in 2003. The smaller ellipsewas recalculated2004–2006 and is 57× 7.6 km. The 35 HiRISE thumbnails around the final ellipse are numbered with their identifiers. Beagle 2 wasidentified at 90.43° E, 11.53° N, within about 20 km of the original, nominal target.
been located on the surface: Viking 1 and 2 (1976), Pathfinder (1996), MER Spirit and Opportunity (2004),Phoenix (2008), and Mars Science Laboratory (2012).
In this paper, we describe the Beagle 2 lander deployment and report the results of a search for it andits parachute, front heat shield and rear cover, in HiRISE images and high resolution image productsderived from them. Based on the results, we outline an explanation of what occurred during landingin December 2003.
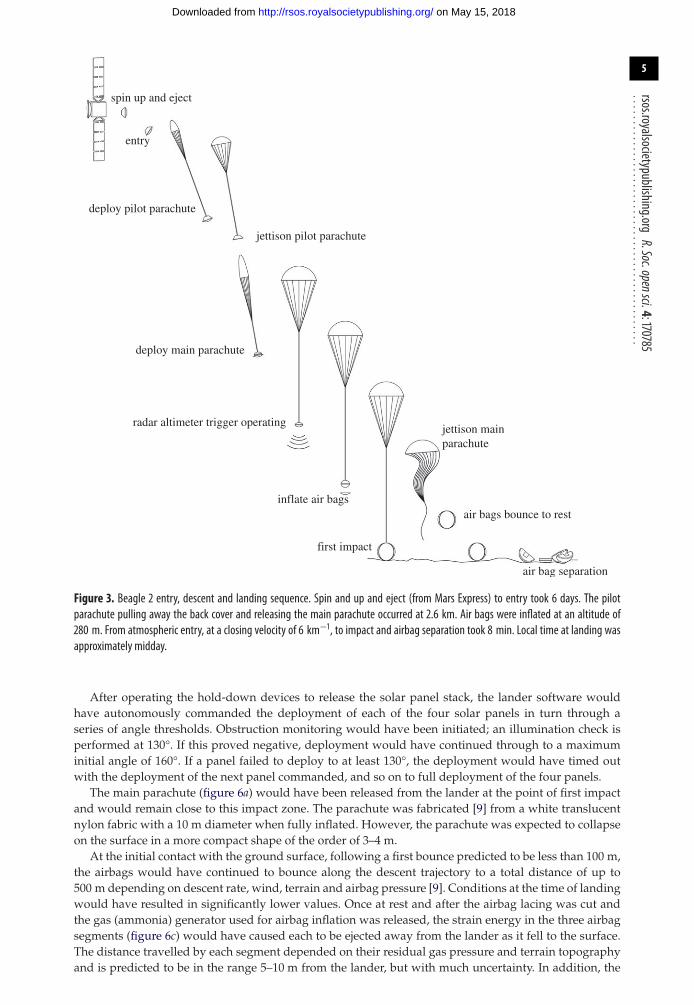
1.2. Beagle 2 entry descent and landingThe initial phase of the descent trajectory through the Mars atmosphere was planned based onaerodynamic deceleration of the probe from 5.6 km s−1 (figure 3). Following pilot parachute deployment,the predicted speed decreased from supersonic to subsonic values. The front heat shield and back coverwere then released, with the pilot parachute pulling away the back cover, releasing the main parachuteat 2.6 km altitude, 94 m s−1. The planned landing sequence then commenced with radar altimetrytriggering inflation of the airbags at approximately 280 m above the ground. The airbags were made ofthree layers of polyester woven fabric and inflated with ammonia to a pressure of 100 mbar compared tothe Martian atmosphere pressure of approximately 7 mbar. Ammonia was chosen for its liquefied storageperformance and to avoid contaminating the surface with organic compounds following the expectedleakage of the gas during and after landing. The outer two layers were designed to act as abrasionlayers. First impact on the ground occurred up to 7 min after atmospheric entry. Once stationary, theairbags should have been released with the lander falling approximately 1 m to the Martian surface.The on-surface deployment sequence then started with the opening of the lander followed by solarpanel deployment.
1.3. Beagle 2 hardware and solar panel deployment sequenceTo aid interpretation of the HiRISE images, it is important to first understand how the hardware mayappear on the Martian surface, the physical sizes, and particularly surface reflectivity and colour. With
on May 15, 2018http://rsos.royalsocietypublishing.org/Downloaded from

4
rsos.royalsocietypublishing.orgR.Soc.opensci.4:170785
................................................
10 mESP_030908_1915_RED ESP_039308_1915_MRGB
Isidis Planitia
B
C
(a)
(c)
(b)
Figure 2. Location of the proposed Beagle 2 lander candidate. (a) MOLA map showing the Beagle 2 landing site and identified location(b) within Isidis Planitia, (b) HiRISE 0.25 m per pixel image ESP_039308_1915_MRGB showing colour coverage and lander position. Thisareawas also used for follow-up searches for the lander after the initial identification (see §2.1.). (c) HiRISE image ESP_030908_1915_REDshowing proposed lander as a bright object at the centre of view (Sun illumination is from the southwest).
a successful landing and deployment of Beagle 2 on the surface of Mars, examination of orbiter imagesof the landing ellipse would have been focused on looking for four main objects: the lander itself, themain parachute, the rear cover with the pilot chute attached and the front heat shield. Each of thoseis sufficiently distinguishable from the natural terrain to make their discovery possible. The airbagsegments are likely to present a greater challenge because of their tan colour. In the context of searchingfor the elements of Beagle 2 on the surface of Mars, it should be noted that, with the exception of themain parachute (10 m canopy), the largest dimension—the front heat shield diameter—is 0.93 m, andthe maximum possible dimension of the lander with all solar panels deployed is 1.7 m (figures 4 and 5).This is to be compared with a HiRISE pixel size of 0.3 m.
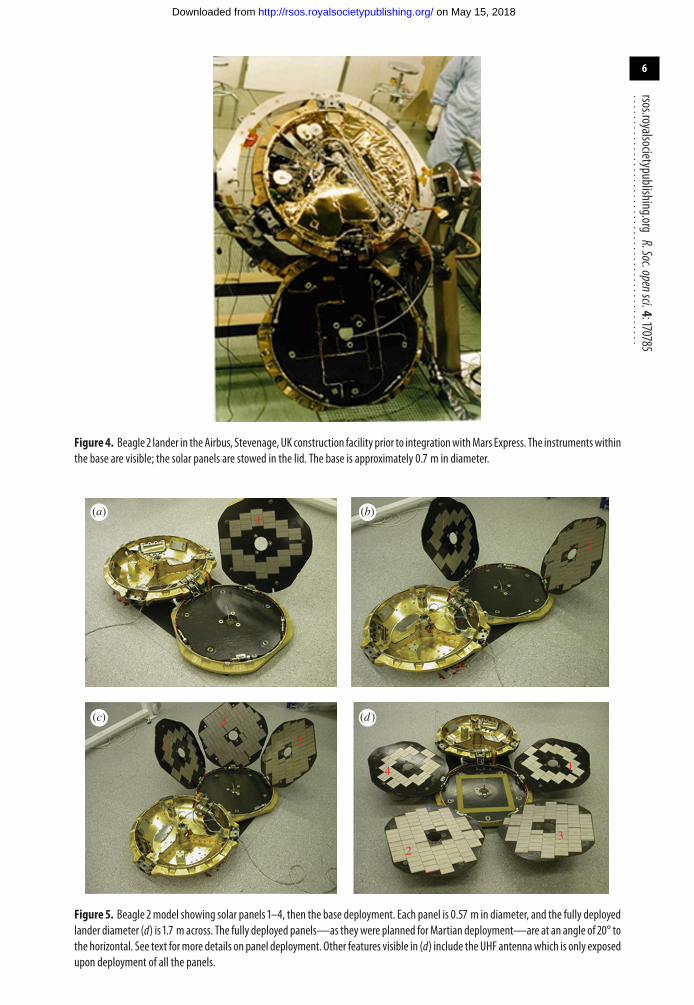
In more detail, the lander is comprised a shallow bowl 0.66 m in diameter and 0.08 m, a lid of the samediameter but only 0.03 m deep, and four pentagon-shaped solar panels nominally 0.57 m across. Thepanels were stowed in a stack in the lid with their rear surface uppermost. This is shown in figure 5. Allstructural elements were constructed from carbon fibre reinforced plastic composite, but the reasonablyreflective resin-rich surface was not always exposed. The front surface of each solar panel has 85% solarcell coverage providing a highly reflective surface when deployed. Solar cells are designed to absorbenergy from the red part of the spectrum, and thus a low red : blue-green spectral ratio signature isexpected, and is one of the key criteria used in identifying the lander on the Martian surface. With allpanels deployed, the UHF antenna embedded into the lid would be exposed (figure 5d). The surface ofthe lid is a carbon fibre composite with a reflective resin-rich surface.
The gold-coated Kapton thermal blankets of the base provide a highly reflective specular finish andaccount for nearly two-thirds of the exposed base following lid deployment. The remaining one-thirdis accounted for by the robotic arm wrapped in aluminized tape and the instruments’ predominantlyaluminium in composition. The back surface of each of the solar panels is carbon fibre composite buthas the texture of the bleed cloth imprinted into it from the manufacturing process. Therefore, althoughresin-rich, these surfaces provide a more diffuse reflectivity. This would have been the surface presentedby the lid if not all panels were deployed, with the reflectivity dominated by the gold-coated blanket andthe number of deployed solar panels themselves.
on May 15, 2018http://rsos.royalsocietypublishing.org/Downloaded from
5
rsos.royalsocietypublishing.orgR.Soc.opensci.4:170785
................................................
spin up and eject
entry
deploy pilot parachute
deploy main parachute
radar altimeter trigger operating
inflate air bags
first impact
air bags bounce to rest
air bag separation
jettison pilot parachute
jettison mainparachute
Figure 3. Beagle 2 entry, descent and landing sequence. Spin and up and eject (from Mars Express) to entry took 6 days. The pilotparachute pulling away the back cover and releasing the main parachute occurred at 2.6 km. Air bags were inflated at an altitude of280 m. From atmospheric entry, at a closing velocity of 6 km−1, to impact and airbag separation took 8 min. Local time at landing wasapproximately midday.
After operating the hold-down devices to release the solar panel stack, the lander software wouldhave autonomously commanded the deployment of each of the four solar panels in turn through aseries of angle thresholds. Obstruction monitoring would have been initiated; an illumination check isperformed at 130°. If this proved negative, deployment would have continued through to a maximuminitial angle of 160°. If a panel failed to deploy to at least 130°, the deployment would have timed outwith the deployment of the next panel commanded, and so on to full deployment of the four panels.
The main parachute (figure 6a) would have been released from the lander at the point of first impactand would remain close to this impact zone. The parachute was fabricated [9] from a white translucentnylon fabric with a 10 m diameter when fully inflated. However, the parachute was expected to collapseon the surface in a more compact shape of the order of 3–4 m.
At the initial contact with the ground surface, following a first bounce predicted to be less than 100 m,the airbags would have continued to bounce along the descent trajectory to a total distance of up to500 m depending on descent rate, wind, terrain and airbag pressure [9]. Conditions at the time of landingwould have resulted in significantly lower values. Once at rest and after the airbag lacing was cut andthe gas (ammonia) generator used for airbag inflation was released, the strain energy in the three airbagsegments (figure 6c) would have caused each to be ejected away from the lander as it fell to the surface.The distance travelled by each segment depended on their residual gas pressure and terrain topographyand is predicted to be in the range 5–10 m from the lander, but with much uncertainty. In addition, the
on May 15, 2018http://rsos.royalsocietypublishing.org/Downloaded from
6
rsos.royalsocietypublishing.orgR.Soc.opensci.4:170785
................................................
Figure4. Beagle 2 lander in theAirbus, Stevenage, UK construction facility prior to integrationwithMars Express. The instrumentswithinthe base are visible; the solar panels are stowed in the lid. The base is approximately 0.7 m in diameter.
1 1
2
1
3
2
4
23
1
(a)
(c) (d )
(b)
Figure 5. Beagle 2model showing solar panels 1–4, then the base deployment. Each panel is 0.57 m in diameter, and the fully deployedlander diameter (d) is 1.7 m across. The fully deployed panels—as theywere planned forMartian deployment—are at an angle of 20° tothe horizontal. See text formore details on panel deployment. Other features visible in (d) include the UHF antennawhich is only exposedupon deployment of all the panels.
on May 15, 2018http://rsos.royalsocietypublishing.org/Downloaded from
7
rsos.royalsocietypublishing.orgR.Soc.opensci.4:170785
................................................ab
fs
rc
(a)
(c)(d )
(b)
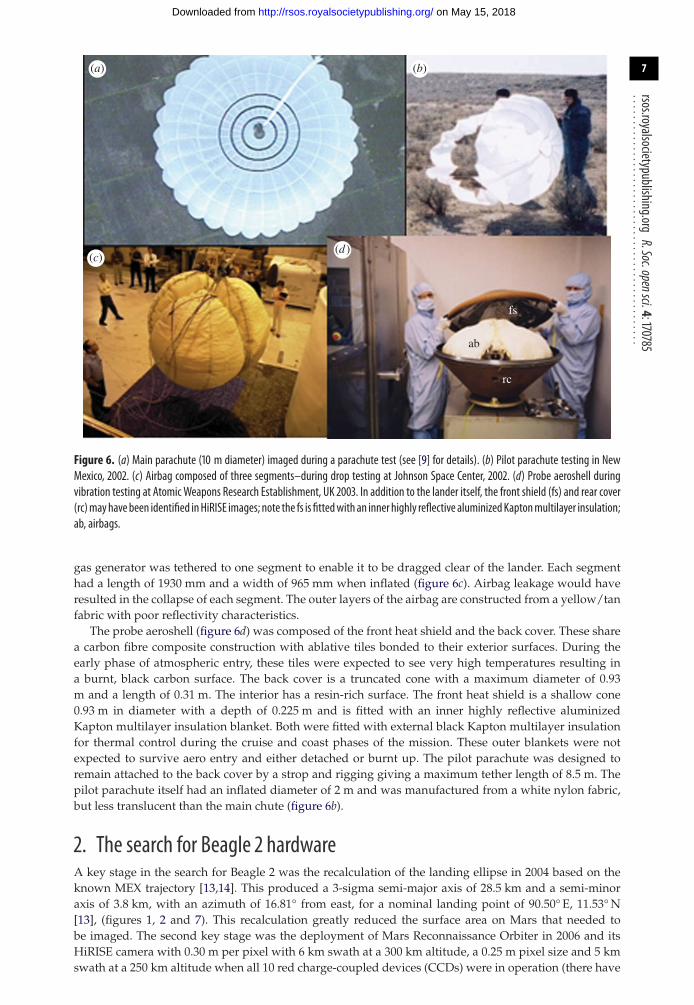
Figure 6. (a) Main parachute (10 m diameter) imaged during a parachute test (see [9] for details). (b) Pilot parachute testing in NewMexico, 2002. (c) Airbag composed of three segments–during drop testing at Johnson Space Center, 2002. (d) Probe aeroshell duringvibration testing at Atomic Weapons Research Establishment, UK 2003. In addition to the lander itself, the front shield (fs) and rear cover(rc)mayhavebeen identified inHiRISE images; note the fs is fittedwith an inner highly reflective aluminizedKaptonmultilayer insulation;ab, airbags.
gas generator was tethered to one segment to enable it to be dragged clear of the lander. Each segmenthad a length of 1930 mm and a width of 965 mm when inflated (figure 6c). Airbag leakage would haveresulted in the collapse of each segment. The outer layers of the airbag are constructed from a yellow/tanfabric with poor reflectivity characteristics.
The probe aeroshell (figure 6d) was composed of the front heat shield and the back cover. These sharea carbon fibre composite construction with ablative tiles bonded to their exterior surfaces. During theearly phase of atmospheric entry, these tiles were expected to see very high temperatures resulting ina burnt, black carbon surface. The back cover is a truncated cone with a maximum diameter of 0.93m and a length of 0.31 m. The interior has a resin-rich surface. The front heat shield is a shallow cone0.93 m in diameter with a depth of 0.225 m and is fitted with an inner highly reflective aluminizedKapton multilayer insulation blanket. Both were fitted with external black Kapton multilayer insulationfor thermal control during the cruise and coast phases of the mission. These outer blankets were notexpected to survive aero entry and either detached or burnt up. The pilot parachute was designed toremain attached to the back cover by a strop and rigging giving a maximum tether length of 8.5 m. Thepilot parachute itself had an inflated diameter of 2 m and was manufactured from a white nylon fabric,but less translucent than the main chute (figure 6b).
2. The search for Beagle 2 hardwareA key stage in the search for Beagle 2 was the recalculation of the landing ellipse in 2004 based on theknown MEX trajectory [13,14]. This produced a 3-sigma semi-major axis of 28.5 km and a semi-minoraxis of 3.8 km, with an azimuth of 16.81° from east, for a nominal landing point of 90.50° E, 11.53° N[13], (figures 1, 2 and 7). This recalculation greatly reduced the surface area on Mars that needed tobe imaged. The second key stage was the deployment of Mars Reconnaissance Orbiter in 2006 and itsHiRISE camera with 0.30 m per pixel with 6 km swath at a 300 km altitude, a 0.25 m pixel size and 5 kmswath at a 250 km altitude when all 10 red charge-coupled devices (CCDs) were in operation (there have
on May 15, 2018http://rsos.royalsocietypublishing.org/Downloaded from
8
rsos.royalsocietypublishing.orgR.Soc.opensci.4:170785
................................................
10 m 10 m
10 m 10 m
(a)
(c) (d )
(b)
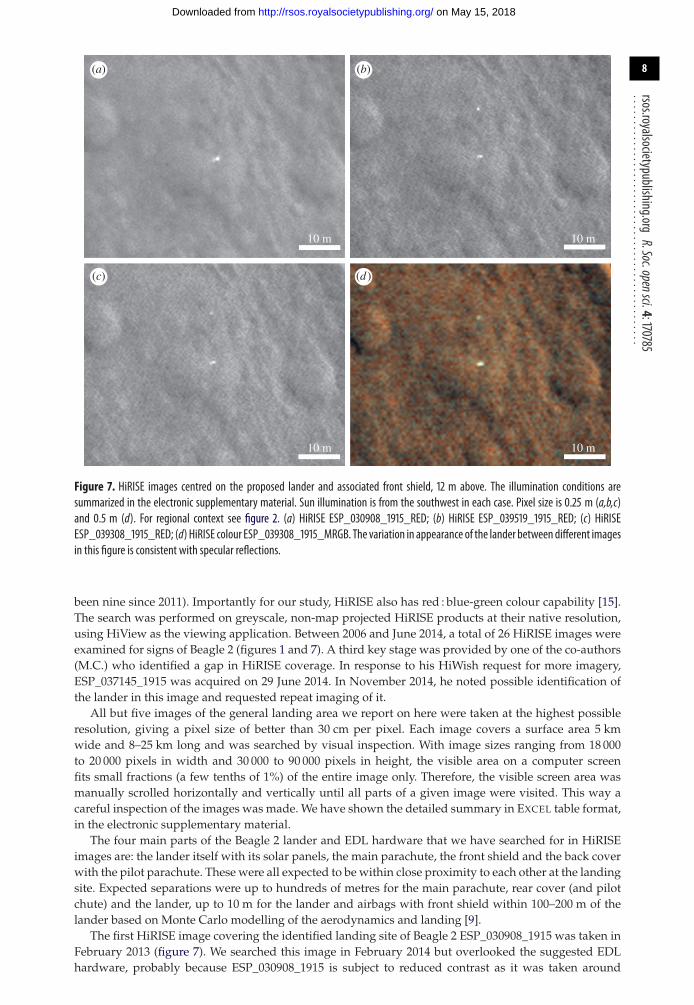
Figure 7. HiRISE images centred on the proposed lander and associated front shield, 12 m above. The illumination conditions aresummarized in the electronic supplementary material. Sun illumination is from the southwest in each case. Pixel size is 0.25 m (a,b,c)and 0.5 m (d). For regional context see figure 2. (a) HiRISE ESP_030908_1915_RED; (b) HiRISE ESP_039519_1915_RED; (c) HiRISEESP_039308_1915_RED; (d) HiRISE colour ESP_039308_1915_MRGB. The variation in appearance of the lander between different imagesin this figure is consistent with specular reflections.
been nine since 2011). Importantly for our study, HiRISE also has red : blue-green colour capability [15].The search was performed on greyscale, non-map projected HiRISE products at their native resolution,using HiView as the viewing application. Between 2006 and June 2014, a total of 26 HiRISE images wereexamined for signs of Beagle 2 (figures 1 and 7). A third key stage was provided by one of the co-authors(M.C.) who identified a gap in HiRISE coverage. In response to his HiWish request for more imagery,ESP_037145_1915 was acquired on 29 June 2014. In November 2014, he noted possible identification ofthe lander in this image and requested repeat imaging of it.
All but five images of the general landing area we report on here were taken at the highest possibleresolution, giving a pixel size of better than 30 cm per pixel. Each image covers a surface area 5 kmwide and 8–25 km long and was searched by visual inspection. With image sizes ranging from 18 000to 20 000 pixels in width and 30 000 to 90 000 pixels in height, the visible area on a computer screenfits small fractions (a few tenths of 1%) of the entire image only. Therefore, the visible screen area wasmanually scrolled horizontally and vertically until all parts of a given image were visited. This way acareful inspection of the images was made. We have shown the detailed summary in EXCEL table format,in the electronic supplementary material.
The four main parts of the Beagle 2 lander and EDL hardware that we have searched for in HiRISEimages are: the lander itself with its solar panels, the main parachute, the front shield and the back coverwith the pilot parachute. These were all expected to be within close proximity to each other at the landingsite. Expected separations were up to hundreds of metres for the main parachute, rear cover (and pilotchute) and the lander, up to 10 m for the lander and airbags with front shield within 100–200 m of thelander based on Monte Carlo modelling of the aerodynamics and landing [9].
The first HiRISE image covering the identified landing site of Beagle 2 ESP_030908_1915 was taken inFebruary 2013 (figure 7). We searched this image in February 2014 but overlooked the suggested EDLhardware, probably because ESP_030908_1915 is subject to reduced contrast as it was taken around
on May 15, 2018http://rsos.royalsocietypublishing.org/Downloaded from
9
rsos.royalsocietypublishing.orgR.Soc.opensci.4:170785
................................................
10 m 10 m
10 m 10 m
(a)
(c) (d )
(b)
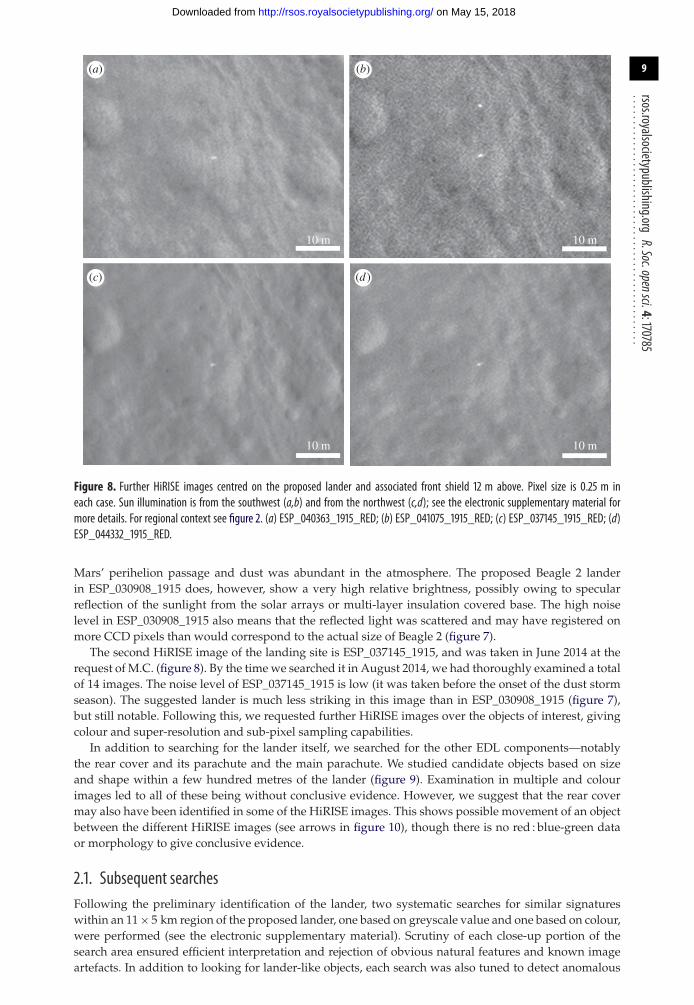
Figure 8. Further HiRISE images centred on the proposed lander and associated front shield 12 m above. Pixel size is 0.25 m ineach case. Sun illumination is from the southwest (a,b) and from the northwest (c,d); see the electronic supplementary material formore details. For regional context see figure 2. (a) ESP_040363_1915_RED; (b) ESP_041075_1915_RED; (c) ESP_037145_1915_RED; (d)ESP_044332_1915_RED.
Mars’ perihelion passage and dust was abundant in the atmosphere. The proposed Beagle 2 landerin ESP_030908_1915 does, however, show a very high relative brightness, possibly owing to specularreflection of the sunlight from the solar arrays or multi-layer insulation covered base. The high noiselevel in ESP_030908_1915 also means that the reflected light was scattered and may have registered onmore CCD pixels than would correspond to the actual size of Beagle 2 (figure 7).
The second HiRISE image of the landing site is ESP_037145_1915, and was taken in June 2014 at therequest of M.C. (figure 8). By the time we searched it in August 2014, we had thoroughly examined a totalof 14 images. The noise level of ESP_037145_1915 is low (it was taken before the onset of the dust stormseason). The suggested lander is much less striking in this image than in ESP_030908_1915 (figure 7),but still notable. Following this, we requested further HiRISE images over the objects of interest, givingcolour and super-resolution and sub-pixel sampling capabilities.
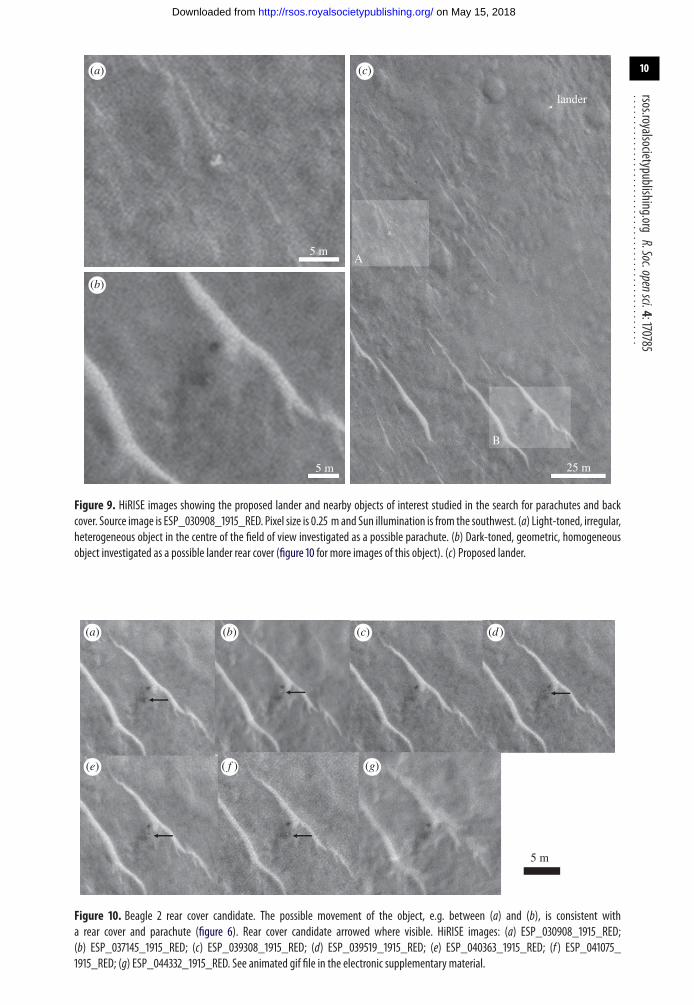
In addition to searching for the lander itself, we searched for the other EDL components—notablythe rear cover and its parachute and the main parachute. We studied candidate objects based on sizeand shape within a few hundred metres of the lander (figure 9). Examination in multiple and colourimages led to all of these being without conclusive evidence. However, we suggest that the rear covermay also have been identified in some of the HiRISE images. This shows possible movement of an objectbetween the different HiRISE images (see arrows in figure 10), though there is no red : blue-green dataor morphology to give conclusive evidence.
2.1. Subsequent searchesFollowing the preliminary identification of the lander, two systematic searches for similar signatureswithin an 11 × 5 km region of the proposed lander, one based on greyscale value and one based on colour,were performed (see the electronic supplementary material). Scrutiny of each close-up portion of thesearch area ensured efficient interpretation and rejection of obvious natural features and known imageartefacts. In addition to looking for lander-like objects, each search was also tuned to detect anomalous
on May 15, 2018http://rsos.royalsocietypublishing.org/Downloaded from
10
rsos.royalsocietypublishing.orgR.Soc.opensci.4:170785
................................................
5 m
5 m 25 m
B
lander
A
(a) (c)
(b)
Figure 9. HiRISE images showing the proposed lander and nearby objects of interest studied in the search for parachutes and backcover. Source image is ESP_030908_1915_RED. Pixel size is 0.25 m and Sun illumination is from the southwest. (a) Light-toned, irregular,heterogeneous object in the centre of the field of view investigated as a possible parachute. (b) Dark-toned, geometric, homogeneousobject investigated as a possible lander rear cover (figure 10 for more images of this object). (c) Proposed lander.
5 m
(a) (c) (d)(b)
(e) ( f ) (g)
Figure 10. Beagle 2 rear cover candidate. The possible movement of the object, e.g. between (a) and (b), is consistent witha rear cover and parachute (figure 6). Rear cover candidate arrowed where visible. HiRISE images: (a) ESP_030908_1915_RED;(b) ESP_037145_1915_RED; (c) ESP_039308_1915_RED; (d) ESP_039519_1915_RED; (e) ESP_040363_1915_RED; (f ) ESP_041075_1915_RED; (g) ESP_044332_1915_RED. See animated gif file in the electronic supplementary material.
on May 15, 2018http://rsos.royalsocietypublishing.org/Downloaded from
11
rsos.royalsocietypublishing.orgR.Soc.opensci.4:170785
................................................
10 m 10 m
(a) (b)
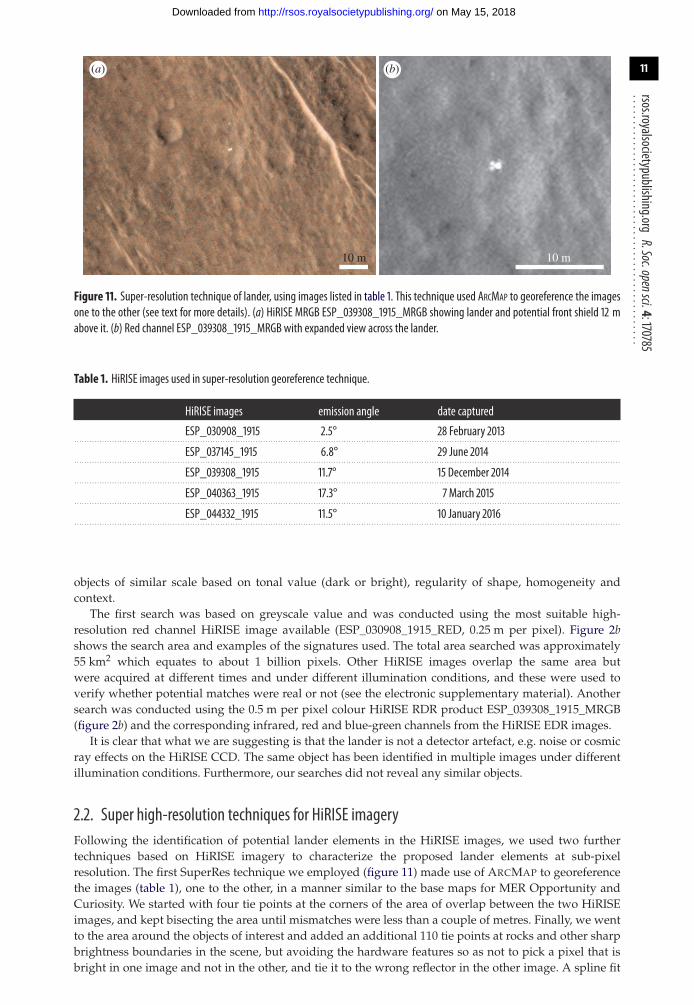
Figure 11. Super-resolution technique of lander, using images listed in table 1. This technique used ARCMAP to georeference the imagesone to the other (see text for more details). (a) HiRISE MRGB ESP_039308_1915_MRGB showing lander and potential front shield 12 mabove it. (b) Red channel ESP_039308_1915_MRGB with expanded view across the lander.
Table 1. HiRISE images used in super-resolution georeference technique.
HiRISE images emission angle date captured
ESP_030908_1915 2.5° 28 February 2013. . . . . . . . . . . . . . . . . . . . . . . . . . . . . . . . . . . . . . . . . . . . . . . . . . . . . . . . . . . . . . . . . . . . . . . . . . . . . . . . . . . . . . . . . . . . . . . . . . . . . . . . . . . . . . . . . . . . . . . . . . . . . . . . . . . . . . . . . . . . . . . . . . . . . . . . . . . . . . . . . . . . . . . . . . . . . . . . . . . . . . . . . . . . . . . . . . . . . . . . . . . . . . . . . . . . . . . . .
ESP_037145_1915 6.8° 29 June 2014. . . . . . . . . . . . . . . . . . . . . . . . . . . . . . . . . . . . . . . . . . . . . . . . . . . . . . . . . . . . . . . . . . . . . . . . . . . . . . . . . . . . . . . . . . . . . . . . . . . . . . . . . . . . . . . . . . . . . . . . . . . . . . . . . . . . . . . . . . . . . . . . . . . . . . . . . . . . . . . . . . . . . . . . . . . . . . . . . . . . . . . . . . . . . . . . . . . . . . . . . . . . . . . . . . . . . . . . .
ESP_039308_1915 11.7° 15 December 2014. . . . . . . . . . . . . . . . . . . . . . . . . . . . . . . . . . . . . . . . . . . . . . . . . . . . . . . . . . . . . . . . . . . . . . . . . . . . . . . . . . . . . . . . . . . . . . . . . . . . . . . . . . . . . . . . . . . . . . . . . . . . . . . . . . . . . . . . . . . . . . . . . . . . . . . . . . . . . . . . . . . . . . . . . . . . . . . . . . . . . . . . . . . . . . . . . . . . . . . . . . . . . . . . . . . . . . . . .
ESP_040363_1915 17.3° 7 March 2015. . . . . . . . . . . . . . . . . . . . . . . . . . . . . . . . . . . . . . . . . . . . . . . . . . . . . . . . . . . . . . . . . . . . . . . . . . . . . . . . . . . . . . . . . . . . . . . . . . . . . . . . . . . . . . . . . . . . . . . . . . . . . . . . . . . . . . . . . . . . . . . . . . . . . . . . . . . . . . . . . . . . . . . . . . . . . . . . . . . . . . . . . . . . . . . . . . . . . . . . . . . . . . . . . . . . . . . . .
ESP_044332_1915 11.5° 10 January 2016. . . . . . . . . . . . . . . . . . . . . . . . . . . . . . . . . . . . . . . . . . . . . . . . . . . . . . . . . . . . . . . . . . . . . . . . . . . . . . . . . . . . . . . . . . . . . . . . . . . . . . . . . . . . . . . . . . . . . . . . . . . . . . . . . . . . . . . . . . . . . . . . . . . . . . . . . . . . . . . . . . . . . . . . . . . . . . . . . . . . . . . . . . . . . . . . . . . . . . . . . . . . . . . . . . . . . . . . .
objects of similar scale based on tonal value (dark or bright), regularity of shape, homogeneity andcontext.
The first search was based on greyscale value and was conducted using the most suitable high-resolution red channel HiRISE image available (ESP_030908_1915_RED, 0.25 m per pixel). Figure 2bshows the search area and examples of the signatures used. The total area searched was approximately55 km2 which equates to about 1 billion pixels. Other HiRISE images overlap the same area butwere acquired at different times and under different illumination conditions, and these were used toverify whether potential matches were real or not (see the electronic supplementary material). Anothersearch was conducted using the 0.5 m per pixel colour HiRISE RDR product ESP_039308_1915_MRGB(figure 2b) and the corresponding infrared, red and blue-green channels from the HiRISE EDR images.
It is clear that what we are suggesting is that the lander is not a detector artefact, e.g. noise or cosmicray effects on the HiRISE CCD. The same object has been identified in multiple images under differentillumination conditions. Furthermore, our searches did not reveal any similar objects.
2.2. Super high-resolution techniques for HiRISE imageryFollowing the identification of potential lander elements in the HiRISE images, we used two furthertechniques based on HiRISE imagery to characterize the proposed lander elements at sub-pixelresolution. The first SuperRes technique we employed (figure 11) made use of ARCMAP to georeferencethe images (table 1), one to the other, in a manner similar to the base maps for MER Opportunity andCuriosity. We started with four tie points at the corners of the area of overlap between the two HiRISEimages, and kept bisecting the area until mismatches were less than a couple of metres. Finally, we wentto the area around the objects of interest and added an additional 110 tie points at rocks and other sharpbrightness boundaries in the scene, but avoiding the hardware features so as not to pick a pixel that isbright in one image and not in the other, and tie it to the wrong reflector in the other image. A spline fit
on May 15, 2018http://rsos.royalsocietypublishing.org/Downloaded from
12
rsos.royalsocietypublishing.orgR.Soc.opensci.4:170785
................................................
B
2500 m
ESP
_030
908_
1915
_RE
D
1 m 1 m
10 m
(a)
(c) (d )
(b)
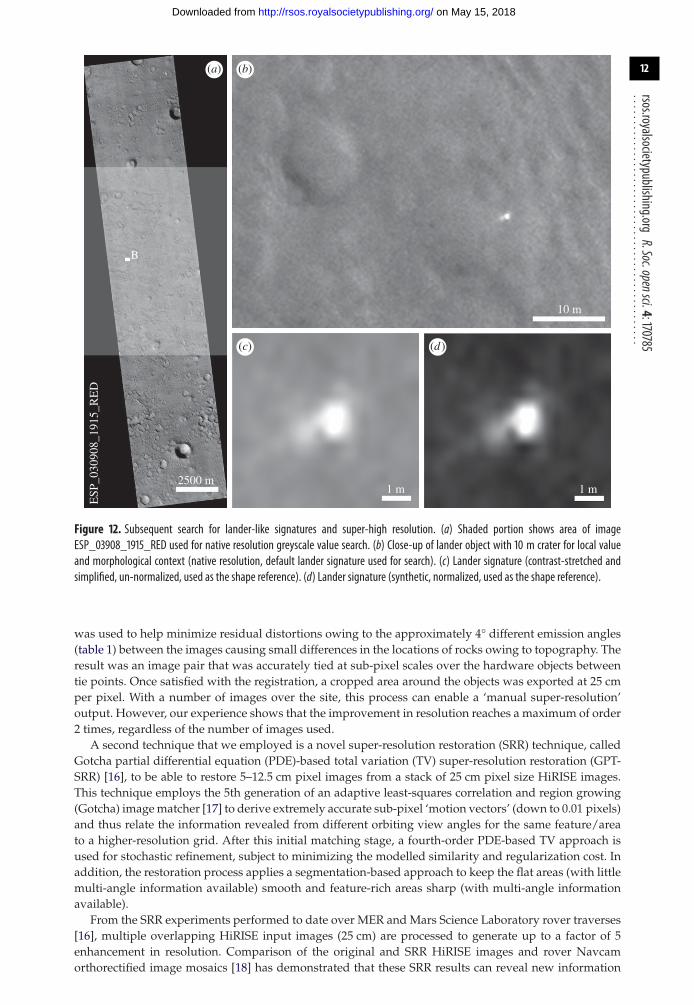
Figure 12. Subsequent search for lander-like signatures and super-high resolution. (a) Shaded portion shows area of imageESP_03908_1915_RED used for native resolution greyscale value search. (b) Close-up of lander object with 10 m crater for local valueand morphological context (native resolution, default lander signature used for search). (c) Lander signature (contrast-stretched andsimplified, un-normalized, used as the shape reference). (d) Lander signature (synthetic, normalized, used as the shape reference).
was used to help minimize residual distortions owing to the approximately 4° different emission angles(table 1) between the images causing small differences in the locations of rocks owing to topography. Theresult was an image pair that was accurately tied at sub-pixel scales over the hardware objects betweentie points. Once satisfied with the registration, a cropped area around the objects was exported at 25 cmper pixel. With a number of images over the site, this process can enable a ‘manual super-resolution’output. However, our experience shows that the improvement in resolution reaches a maximum of order2 times, regardless of the number of images used.
A second technique that we employed is a novel super-resolution restoration (SRR) technique, calledGotcha partial differential equation (PDE)-based total variation (TV) super-resolution restoration (GPT-SRR) [16], to be able to restore 5–12.5 cm pixel images from a stack of 25 cm pixel size HiRISE images.This technique employs the 5th generation of an adaptive least-squares correlation and region growing(Gotcha) image matcher [17] to derive extremely accurate sub-pixel ‘motion vectors’ (down to 0.01 pixels)and thus relate the information revealed from different orbiting view angles for the same feature/areato a higher-resolution grid. After this initial matching stage, a fourth-order PDE-based TV approach isused for stochastic refinement, subject to minimizing the modelled similarity and regularization cost. Inaddition, the restoration process applies a segmentation-based approach to keep the flat areas (with littlemulti-angle information available) smooth and feature-rich areas sharp (with multi-angle informationavailable).
From the SRR experiments performed to date over MER and Mars Science Laboratory rover traverses[16], multiple overlapping HiRISE input images (25 cm) are processed to generate up to a factor of 5enhancement in resolution. Comparison of the original and SRR HiRISE images and rover Navcamorthorectified image mosaics [18] has demonstrated that these SRR results can reveal new information
on May 15, 2018http://rsos.royalsocietypublishing.org/Downloaded from

13
rsos.royalsocietypublishing.orgR.Soc.opensci.4:170785
................................................
50 m
0 2 m
2 m
(a)
(c)(b)
Figure 13. Super-resolution restoration technique in image (a) (lander, parachute candidate and rear cover candidate arrowed, figure 6)and zoomed-in view of the lander (b) and parachute target (c). See animated gif files in the electronic supplementary material.
1 3.
2.base
(a) (b)
Figure 14. (a) Super-resolution sampling, close-up view of the lander based on HiRISE MRGB ESP_039308_1915_MRGB with super-resolution sampling (figure 13b). (b) Beagle 2 potential deployment scenario with numbered solar panels 1–3, base and lid (figure 5 forcontext).
on May 15, 2018http://rsos.royalsocietypublishing.org/Downloaded from
14
rsos.royalsocietypublishing.orgR.Soc.opensci.4:170785
................................................including the imaging of individual rocks (diameter ≥ 30 cm). Further SRR experiments were applied tothe Beagle 2 lander elements, where GPT-SRR was applied to a stack of five HiRISE scenes captured todate since February 2013 covering the same area, enabling us to see more details of the potential lander(figures 12 and 13).
2.3. Brightness, red and blue-green values from colour HiRISE EDR and RDR imagesAs part of our characterisation of the lander and surrounding terrain we studied the relative brightness ofthe lander, and red and blue-green channels in a colour HiRISE EDR image (figure 7d). In addition to theuncalibrated EDR data we used an USGS ISIS procedure [19] to radiometrically calibrate the values (RDRin the electronic supplementary material). We found no conclusive differences in R : GB ratios for EDR orRDR products between the lander elements and local terrain. Partial dust cover and atmospheric dust arelikely to mask colour variations [20]. However, the data do show large variations in overall brightnessof the main lander element between images, and a high relative brightness compared to surroundingterrain (for example, figures 7,8,9,11). This is consistent with the surface reflectance, specular propertiesof the solar panel and other metallic lander surfaces, and the varying solar elevation/incidence angles ofthe HiRISE images. The surrounding natural terrain gives diffuse reflectance and, despite a systematicsearch, no objects of similarly high relative high brightness relative to the local terrain were found(electronic supplementary material).
2.4. Lander identified in the HiRISE images and landing scenarioThe bright, 1.5 m diameter, multicomponent, object—identified as the lander—at 90.43° E, 11.53° N isapparently lying flat, as it does not cast a recognizable shadow in any of the images. The variationbetween images is consistent with specular reflection. However, imagery suggests that it is composed ofat least four lobes (figures 12 and 13). This is consistent with partial or complete solar panel deployment.Within 12 m, to the north of the lander, the bright object that appears in the images, with red : blue-greenratio of 1.4 may be the front shield (figure 13a), which would be expected to be close to the lander. Asshown in figure 10 and §2, and the electronic supplementary material animated GIFs, we also have acandidate object for the rear cover and its parachute.
The identification of the intact lander suggests that following nominal ejection from MEX,atmospheric entry and descent occurred as planned. The lack of EDL telemetry data means that wecannot be certain that the nominal set of procedures as shown in figure 3 occurred as planned, but theintact nature of Beagle 2 suggests that it did until deployment of the solar panels. Possible failure todeploy all of the solar panels would have meant that the UHF transmitter’s antenna (figure 5d) wasobscured and thus communication between Beagle 2 and MEX was precluded. This in turn wouldhave stopped any initial data being returned and operations commencing. In figure 14b, we show apotential solar panel deployment scenario consistent with the HiRISE and sub-pixel imagery, althoughwe note that other possibilities are consistent with the images, e.g. partial if not complete deployment ofthe fourth panel. The variation in specular reflections between the different images makes an accuratedeployment scenario problematic. However, at least the lid and solar panels 1–3 could have beendeployed, and possibly all of the panels were deployed. Failure to complete panel deployment couldhave been caused by damage to the lander, e.g. wiring or mechanisms or software issues during landing.With all panels deployed, partially or otherwise, damage to the antenna system would also need to beincluded.
To precisely determine the exact coordinates of the lander, we have used a HiRISE-CTX-HRSC co-registration technique described in [21]. Using HiRISE ESP_039308_1915 with CTXD19_034455_1918_XN_11N269 W and with HRSCHh1193_0001, the exact co-ordinates are 90.43139° E,11.52879° N.
3. Conclusion and implicationsThe location at 90.43° E, 11.53° N (more exactly 90.43139° E, 11.52879° N), 1.5 m size, multi-lobed shape,and high reflectivity relative to the surrounding natural terrain, with specular reflections, of an objectidentified in HiRISE imagery and sub-pixel-sampled imagery derived from them, suggest a highprobability of having identified the Beagle 2 lander on the surface of Mars close to the planned targetin Isidis Planitia. The success of the search benefited from three propitious circumstances. Firstly, the
on May 15, 2018http://rsos.royalsocietypublishing.org/Downloaded from
15
rsos.royalsocietypublishing.orgR.Soc.opensci.4:170785
................................................initial landing ellipse size was recalculated to a 3-sigma major axis length of 57 × 7.6 km from the at-launch values of 174 × 106 km. Secondly, the landing site was imaged at the full resolution of 30 cm perpixel by HiRISE from 2006 onwards. It would have been impossible to identify the Beagle 2 hardwareat 60 cm per pixel (2 × 2 binning) or in Mars Orbiter camera images (1.5–2 m per pixel). Thirdly, thelanding site happens to be in the overlap of two HiRISE images, which allowed us to cross-check thecandidate against the other images. Systematic searches in HiRISE images in an 11 × 5 km region aroundthe identified lander confirm the lander’s unique identification compared to rocks and sand ripples.
It is expected that other parts of Beagle 2 hardware i.e. parachutes, front shield, airbag segments andrear cover would be present in the vicinity, and we have identified some candidates, including a frontshield approximately 12 m from the lander and a rear cover within a few hundred metres of the lander.The most confident identification is that of the lander. A lack of spectral and shape or size criteria hinderfully confident identification of other Beagle 2 elements, though the apparent movement of an objectbetween HiRISE images is consistent with a rear cover attached to its pilot parachute.
Beagle 2 was the UK’s and ESA’s first attempt at landing on Mars. The data analysed above showthat the lander completed its descent and landing sequence, the most difficult and risky part, but wasprevented from communicating with its planned orbiting relay spacecraft (NASA Odyssey and ESA’sMars Express) probably owing to an incomplete deployment, though that is yet to be fully proved.This shows that the engineering of the spacecraft was basically sound. Further analysis of the data andadditional images of the landing site may elucidate the cause of the failure to communicate.
Data accessibility. The data used in this paper are stored at data dryad: http://dx.doi.org/10.5061/dryad.707kc [22]. Thisis an EXCEL spreadsheet where the results of the search for Beagle 2, Mars coordinates, HiRISE imagery id, red : blue-green data, etc. are catalogued. The data also include the animated GIFs over the lander, rear cover and parachutecandidates.Authors’ contributions. J.C.B. led preparation of the manuscript and characterization strategy leading up to its preparationand revision. J.C. wrote sections of the paper on Beagle 2 hardware and landing technology. M.C., first identification ofthe lander and request for HiRISE image within which it was found. M.R.S. helped write and edit sections on Beagle 2hardware and development. D.P. performed searches in HiRISE images after the initial discovery and helped preparefigures for the manuscript. J.-P.M. led the super-resolution technique section. Y.T. worked on the super-resolutiontechnique and red : blue-green characterization. S.X. prepared HiRISE mosaic (figure 1) and worked on the super-resolution technique. A.R.P. prepared red : blue-green characterization and helped revise text. T.P. prepared the super-resolution view of the lander with the ARCGIS georeferencing technique. S.M.R.T. helped prepare figures and ARCGIScharacterization of HiRISE images. J.M.P. helped edit the manuscript and produce figures from the Beagle 2 archive.All the authors gave their final approval for publication.Competing interests. We have no competing interests.Funding. J.-P.M. and Y.T. acknowledge the support of the EU-FP7 iMars project no. 607379 and partial funding fromthe STFC ‘MSSL Consolidated Grant’ ST/K000977/1.Acknowledgements. This paper is dedicated to the Beagle 2 team and its principal investigator, the late Professor ColinPillinger FRS. The HiRISE camera team is thanked for providing imagery across the Beagle 2 landing ellipse, thepublic target suggestion programme HiWish and the image-viewing application HiView. Two anonymous reviewersand Alfred McEwen are thanked for reviews which helped to improve the manuscript.
References1. Sims MR et al. 1999 Beagle 2: a proposed exobiology
lander for ESA’s 2003 Mars express mission. Adv.Space Res. 23, 1925–1928. (doi:10.1016/S0273-1177(99)00280-X)
2. Pullan D, Sims MR, Wright IP, Pillinger CT, TrautnerR. 2004 Beagle 2: the exobiological lander of Marsexpress. ESA SP-1240, p. 165–204.
3. Kochan H et al. 2001 The mobile penetrometer(Mole): a tool for planetary sub-surfaceinvestigations. In Penetrometry in the Solar System(eds NI Komle, G Kargl, AJ Ball, RD Lorenz). In Proc.of the Int. Workshop, Graz, 18–20 October 1999.Austrian Academy of Sciences Press, pp. 213–243.
4. Griffiths AD, Coates AJ, Josset J-L, Paar G, HofmannB, Pullan D, Rüffer P, Sims MR, Pillinger CT. 2005The Beagle 2 stereo camera system. Planet. SpaceSci. 53, 1466–1482. (doi:10.1016/j.pss.2005.07.007)
5. Wright IP, Sims MR, Pillinger CT. 2003 Scientificobjectives of the Beagle 2 lander. Acta Astronaut.52, 219–225. (doi:10.1016/S0094-5765(02)00160-1)
6. Bridges JC et al. 2003 Selection of the landing site inIsidis Planitia of Mars probe Beagle 2. JGR: Planets108, E1. (doi:10.1029/2001JE001820)
7. Clausen KC, Hassan H, Verdant M, Couzin P, HuttinG, Brisson M, Sollazzo C, Lebreton J-P. 2002 Thehuygens probe system design. Space Sci. Rev.104, 155–189. (doi:10.1023/A:1023648925732)
8. Crisp JA, Adler M, Matijevic JR, Squyres SW,Arvidson RE, Klass DM. 2003 Mars Exploration RoverMission. JGR: Planets 108, E12.(doi:10.1029/2002JE002038)
9. Pillinger CT, Sims MR, Clemmet J. 2003 The guide toBeagle 2. London, UK: Faber and Faber.
10. Sims MR. 2004 Beagle 2 Mars: Mission Report.University of Leicester, Leicester, UK.
11. Bonnefoy R, Link D, Casani J, Vorontsov VA,Engström F, Wolf P, Jude R, Patti B, Jones C. 2004Beagle 2 ESA/UK Commission of Inquiry. ESA and UKMinistry of Science and Innovation.
12. Sims MR. 2004 Beagle 2 Mars: lessons learned andmanagement and programmatics. University ofLeicester, Leicester, UK.
13. Bauske R. 2004 Dependence of the Beagle 2trajectory on the Mars atmosphere. In 18th Int. Sym.on Space Flight Dynamics,Munich, P1073.
14. Cramm R, de Juana Gamo JM, Bauske R.2004 Reconstructed Beagle2 trajectory. In 18th Int.Symp. on Space Flight Dynamics,Munich, P0123.
15. McEwen AS et al. 2007 Mars ReconnaissanceOrbiter’s High Resolution Imaging Science
on May 15, 2018http://rsos.royalsocietypublishing.org/Downloaded from

16
rsos.royalsocietypublishing.orgR.Soc.opensci.4:170785
................................................Experiment (HiRISE). JGR: Planets 112, E5.(doi:10.1029/2005JE002605)
16. Tao Y, Muller J-P. 2016 A novel method for surfaceexploration: super-resolution restoration of Marsrepeat-pass orbital imagery. Planet. SpaceSci. 121, 103–114. (doi:10.1016/j.pss.2015.11.010)
17. Shin D, Muller J-P. 2012 Progressively weightedaffine adaptive correlation matching forquasi-dense 3D reconstruction. Pattern Recognit. 45,3795–3809. (doi:10.1016/j.patcog.2012.03.023)
18. Tao Y, Muller J-P. 2016 Quantitative assessment of anovel super-resolution restoration technique usingHiRISE with Navcam images: howmuch resolution
enhancement is possible from repeat-passobservations. In The international archives of thephotogrammetry, remote sensing and spatialinformation sciences, pp. 503–509. Prague, CzechRepublic: International Society for Photogrammetryand Remote Sensing (ISPRS).(doi:10.5194/isprsarchives-XLI-B4-503-2016)
19. USGS ISIS 3 Application Documentation. Websiteaccessed September 2017. https://isis.astrogeology.usgs.gov/
20. Kinch KM, Sohl-Dickstein J, Bell III JF, Johnson JR,Goetz W, Landis GA. 2007 Dust deposition on theMars Exploration Rover Panoramic Camera
(Pancam) calibration targets. J. Geophys. Res.-Sol.Ea. 112. (doi:10.1029/2006JE002807)
21. Tao Y, Muller J-P, Poole W. 2016 Automatedlocalisation of Mars rovers using co-registeredHiRISE-CTX-HRSC orthorectified images andwide baseline Navcam orthorectified mosaics.Icarus 280, 139–157. (doi:10.1016/j.icarus.2016.06.017)
22. Bridges JC et al. 2017 Data from: Identification ofthe Beagle 2 lander on Mars. Dryad DigitalRepository. (http://dx.doi.org/10.5061/dryad.707kc)
on May 15, 2018http://rsos.royalsocietypublishing.org/Downloaded from