the world of operations management in 10...
TRANSCRIPT
Orbsen Consulting...making Sense of the World of business
www.orbsenconsulting.comCopyright © 2016 Orbsen Knowledge Service Ltd, All rights reserved
Orbsen Consulting...making Sense of the World of business
The world of Operations Management in 10 statements
Dr. John Harhen5th October 2016

Orbsen Consulting...making Sense of the World of business
www.orbsenconsulting.comCopyright © 2016 Orbsen Knowledge Service Ltd, All rights reserved
Engagements & Experiences
Group
Site
Global
short medium long
Orbsen Consulting...making Sense of the World of business
www.orbsenconsulting.comCopyright © 2016 Orbsen Knowledge Service Ltd, All rights reserved
1. IT IS NOT ABOUT MAINLY ABOUT THEORY AND TOOLS….
IT IS MORE ABOUT BEHAVIOUR
Orbsen Consulting...making Sense of the World of business
www.orbsenconsulting.comCopyright © 2016 Orbsen Knowledge Service Ltd, All rights reserved
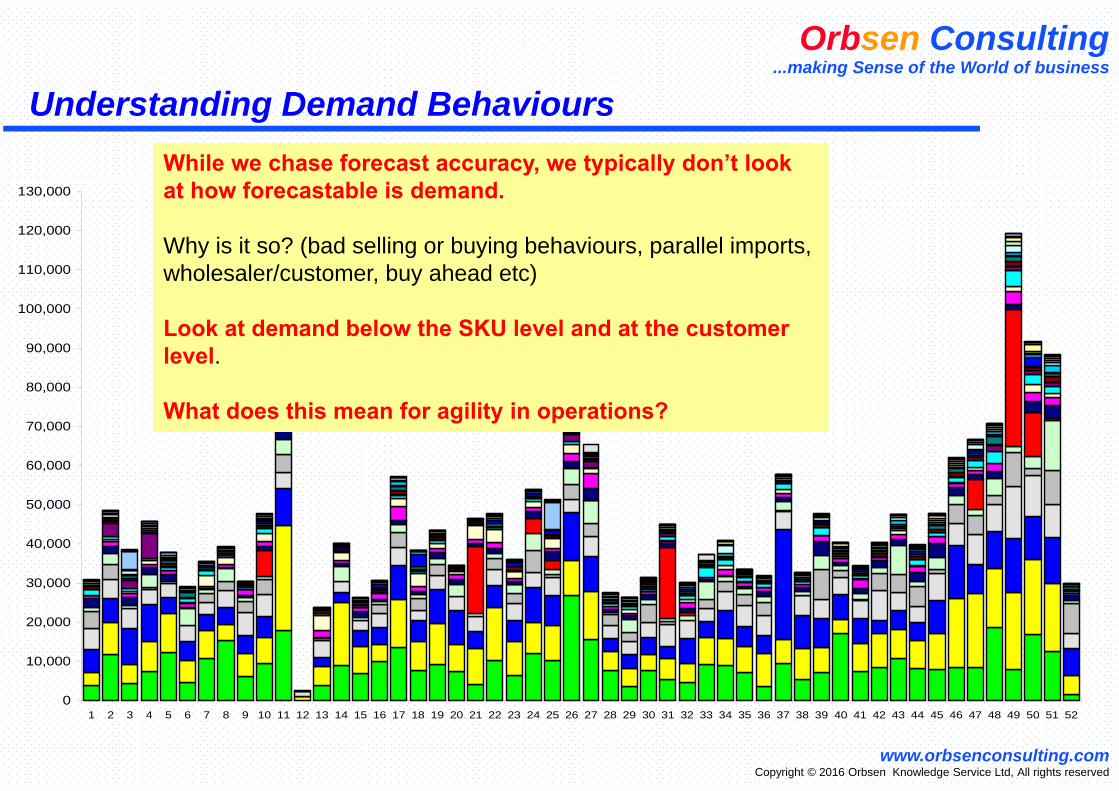
Understanding Demand Behaviours
0
10,000
20,000
30,000
40,000
50,000
60,000
70,000
80,000
90,000
100,000
110,000
120,000
130,000
1 2 3 4 5 6 7 8 9 10 11 12 13 14 15 16 17 18 19 20 21 22 23 24 25 26 27 28 29 30 31 32 33 34 35 36 37 38 39 40 41 42 43 44 45 46 47 48 49 50 51 52
While we chase forecast accuracy, we typically don’t look at how forecastable is demand.
Why is it so? (bad selling or buying behaviours, parallel imports, wholesaler/customer, buy ahead etc)
Look at demand below the SKU level and at the customer level.
What does this mean for agility in operations?
Orbsen Consulting...making Sense of the World of business
www.orbsenconsulting.comCopyright © 2016 Orbsen Knowledge Service Ltd, All rights reserved
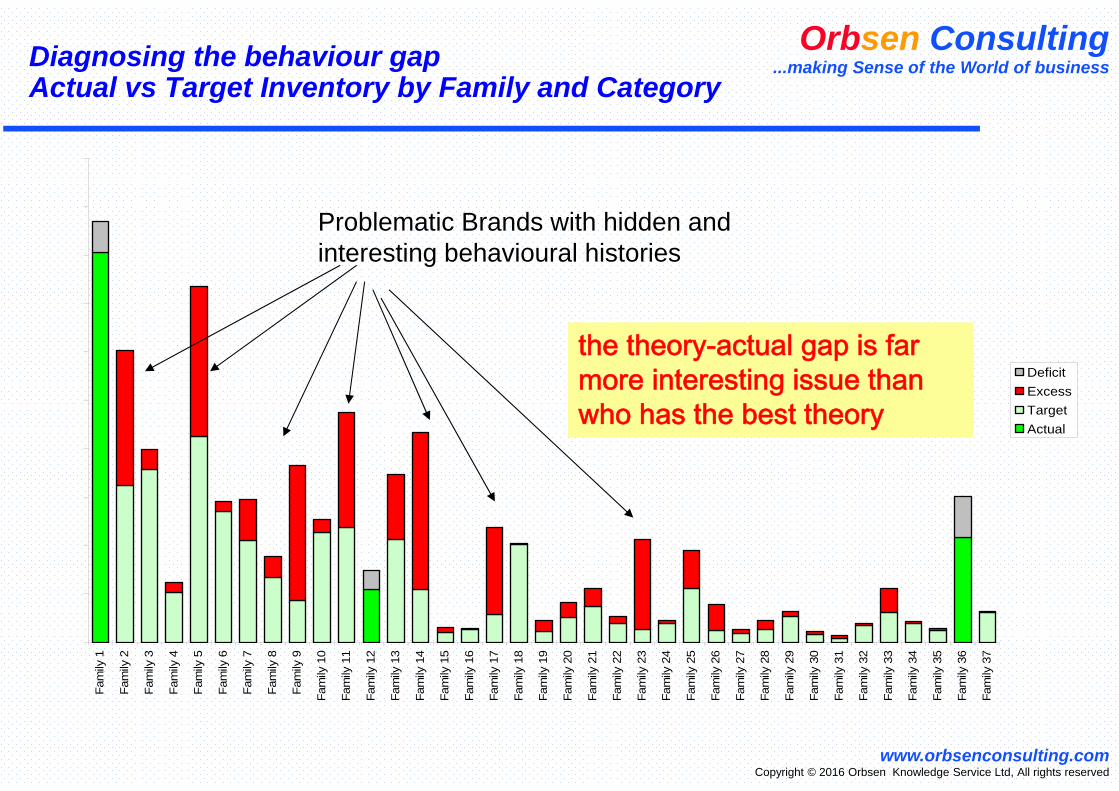
Diagnosing the behaviour gap Actual vs Target Inventory by Family and Category
Fam
ily 1
Fam
ily 2
Fam
ily 3
Fam
ily 4
Fam
ily 5
Fam
ily 6
Fam
ily 7
Fam
ily 8
Fam
ily 9
Fam
ily 1
0
Fam
ily 1
1
Fam
ily 1
2
Fam
ily 1
3
Fam
ily 1
4
Fam
ily 1
5
Fam
ily 1
6
Fam
ily 1
7
Fam
ily 1
8
Fam
ily 1
9
Fam
ily 2
0
Fam
ily 2
1
Fam
ily 2
2
Fam
ily 2
3
Fam
ily 2
4
Fam
ily 2
5
Fam
ily 2
6
Fam
ily 2
7
Fam
ily 2
8
Fam
ily 2
9
Fam
ily 3
0
Fam
ily 3
1
Fam
ily 3
2
Fam
ily 3
3
Fam
ily 3
4
Fam
ily 3
5
Fam
ily 3
6
Fam
ily 3
7
DeficitExcessTargetActual
the theory-actual gap is far more interesting issue than who has the best theory
Problematic Brands with hidden and interesting behavioural histories
Orbsen Consulting...making Sense of the World of business
www.orbsenconsulting.comCopyright © 2016 Orbsen Knowledge Service Ltd, All rights reserved
2. MOST PEOPLE JUST DON’T UNDERSTAND CAPACITY, MAINLY BECAUSE CAPACITY IS ELASTIC.
THIS LACK OF UNDERSTANDING IS A GRAVE ERROR. CAPACITY IS COST. CAPACITY CREATION IS OPPORTUNITY.
Orbsen Consulting...making Sense of the World of business
www.orbsenconsulting.comCopyright © 2016 Orbsen Knowledge Service Ltd, All rights reserved
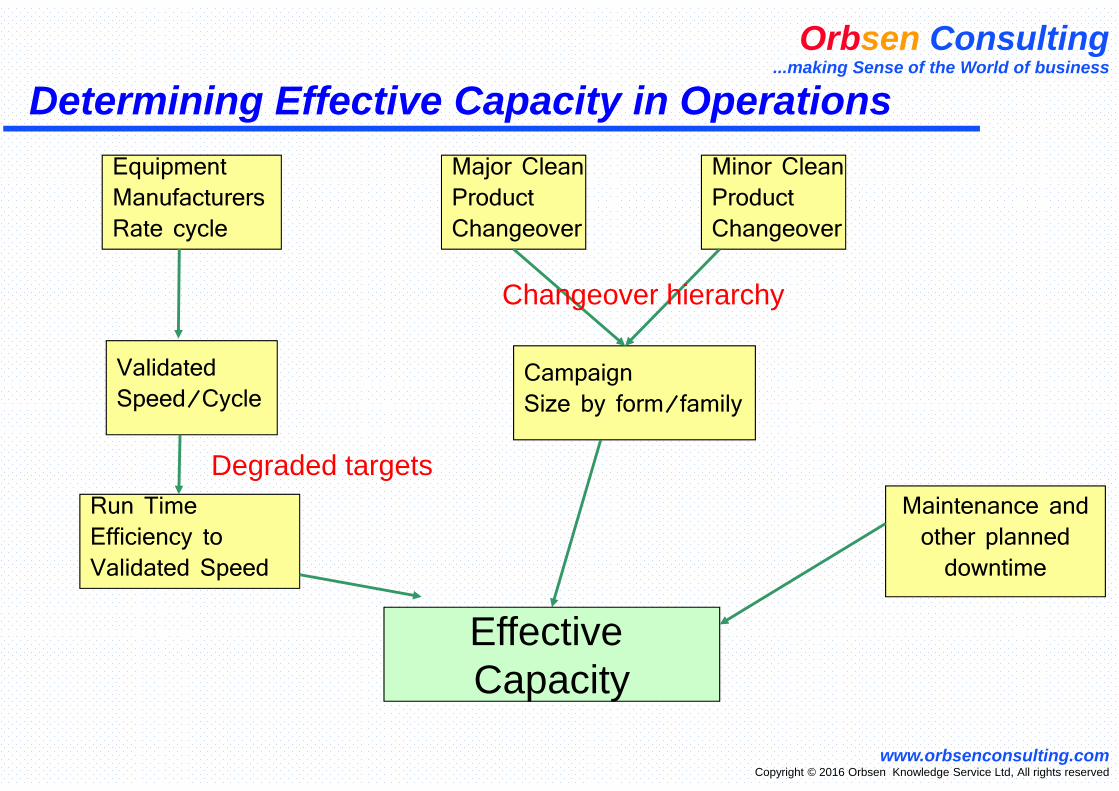
Determining Effective Capacity in Operations
Campaign Size by form/family
Major CleanProduct Changeover
Equipment ManufacturersRate cycle
Minor CleanProduct Changeover
Validated Speed/Cycle
Run Time Efficiency to Validated Speed
Maintenance and other planned
downtime
Effective Capacity
Changeover hierarchy
Degraded targets

Orbsen Consulting...making Sense of the World of business
www.orbsenconsulting.comCopyright © 2016 Orbsen Knowledge Service Ltd, All rights reserved
Setup Dilution PrincipleHours per Batch Compared with Campaign Length in Batches across various steps
Analysts Hours/Batch
0.00
5.00
10.00
15.00
20.00
25.00
30.00
35.00
40.00
45.00
50.00
1 2 3 4 5 6 7 8 9 10 11 12
Analysts Hours/Batch
0.00
5.00
10.00
15.00
20.00
25.00
30.00
35.00
40.00
45.00
50.00
1 2 3 4 5 6 7 8 9 10 11 12
0
5
10
15
20
25
30
35
40
1 2 3 4 5 6 7 8
Dispensing
Laboratory
0.0
2.0
4.0
6.0
8.0
10.0
12.0
14.0
16.0
18.0
20.0
22.0
1 2 4 6 8 10 12 14 16 18 20
Wet Granulation
0.0
2.0
4.0
6.0
8.0
10.0
12.0
14.0
16.0
18.0
1 2 3 4 5 6 7 8 9 10
Compression
0.0
2.0
4.0
6.0
8.0
10.0
12.0
14.0
16.0
18.0
1 2 3 4 5 6 7 8 9 10
Blending
Orbsen Consulting...making Sense of the World of business
www.orbsenconsulting.comCopyright © 2016 Orbsen Knowledge Service Ltd, All rights reserved
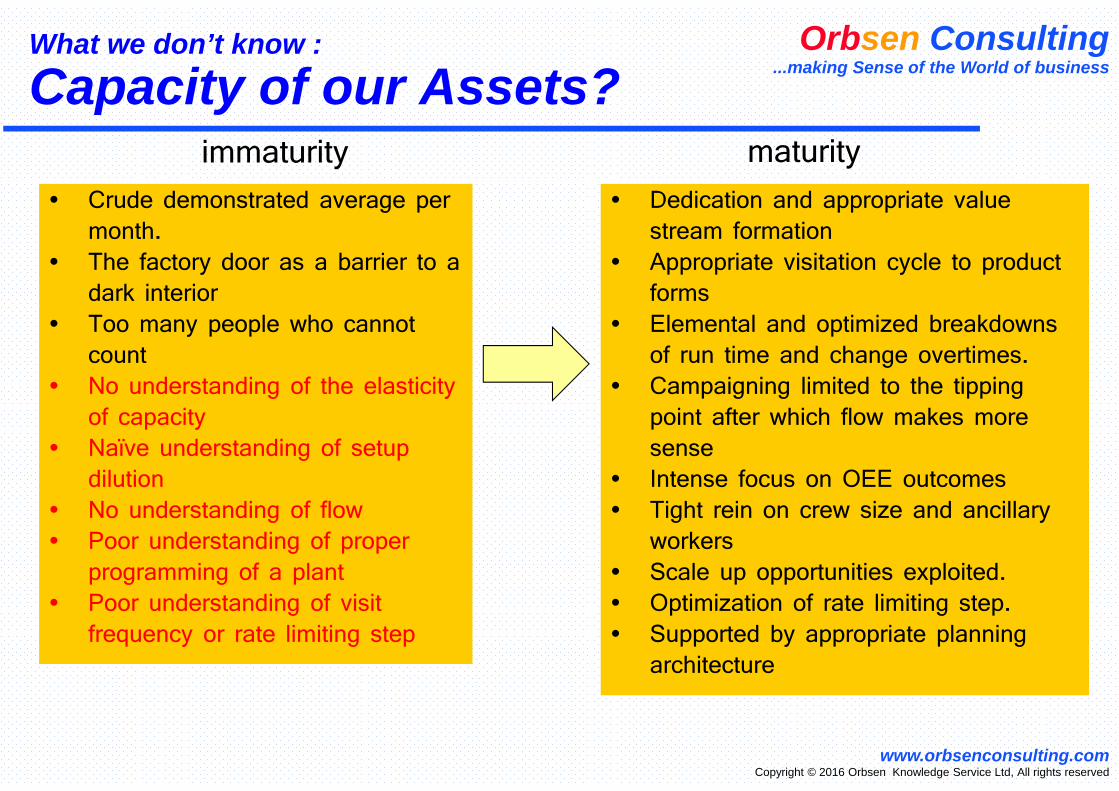
What we don’t know :
Capacity of our Assets?
• Crude demonstrated average per month.
• The factory door as a barrier to a dark interior
• Too many people who cannot count
• No understanding of the elasticity of capacity
• Naïve understanding of setup dilution
• No understanding of flow• Poor understanding of proper
programming of a plant• Poor understanding of visit
frequency or rate limiting step
• Dedication and appropriate value stream formation
• Appropriate visitation cycle to product forms
• Elemental and optimized breakdowns of run time and change overtimes.
• Campaigning limited to the tipping point after which flow makes more sense
• Intense focus on OEE outcomes• Tight rein on crew size and ancillary
workers• Scale up opportunities exploited.• Optimization of rate limiting step.• Supported by appropriate planning
architecture
immaturity maturity
Orbsen Consulting...making Sense of the World of business
www.orbsenconsulting.comCopyright © 2016 Orbsen Knowledge Service Ltd, All rights reserved
3. ONE SIZE FITS ALL PLANNING IS NOT A VALUE PLATFORM.
Orbsen Consulting...making Sense of the World of business
www.orbsenconsulting.comCopyright © 2016 Orbsen Knowledge Service Ltd, All rights reserved
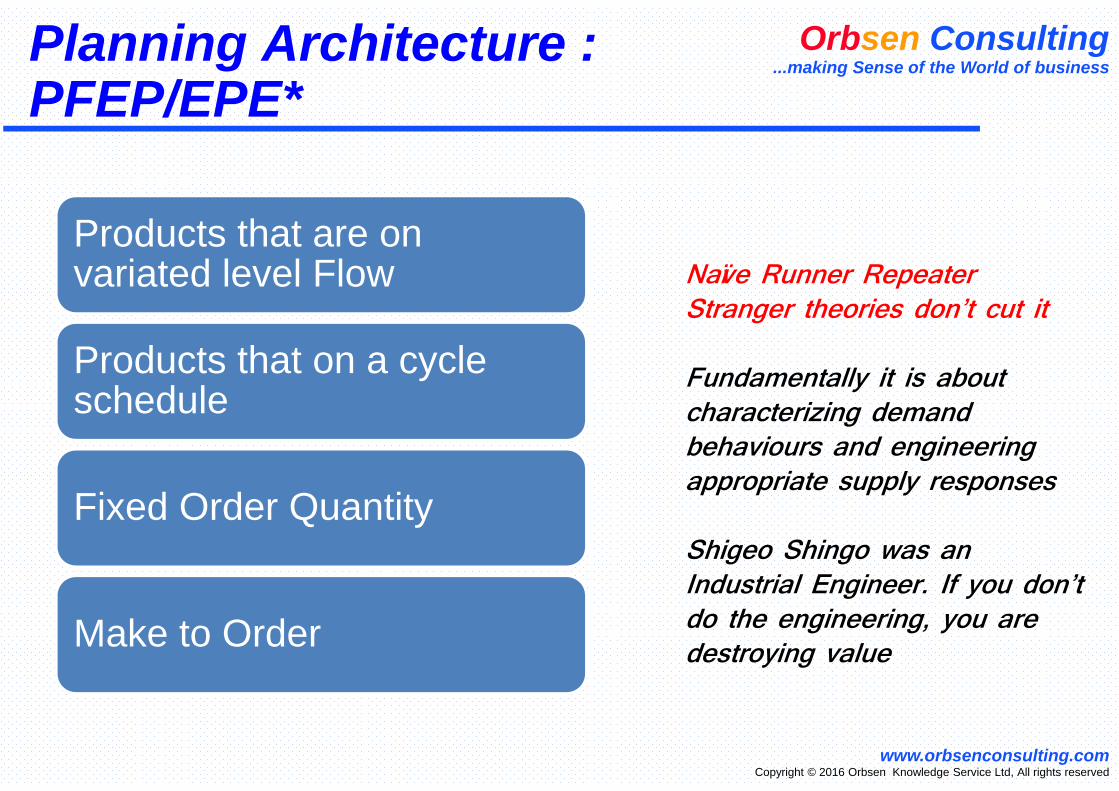
Planning Architecture : PFEP/EPE*
Products that are on variated level Flow
Products that on a cycle schedule
Fixed Order Quantity
Make to Order
Naïve Runner Repeater Stranger theories don’t cut it
Fundamentally it is about characterizing demand behaviours and engineering appropriate supply responses
Shigeo Shingo was an Industrial Engineer. If you don’t do the engineering, you are destroying value
Orbsen Consulting...making Sense of the World of business
www.orbsenconsulting.comCopyright © 2016 Orbsen Knowledge Service Ltd, All rights reserved
4. FLOW IS THE MOST IMPORTANT WORD IN THE LEAN LEXICON.
Orbsen Consulting...making Sense of the World of business
www.orbsenconsulting.comCopyright © 2016 Orbsen Knowledge Service Ltd, All rights reserved
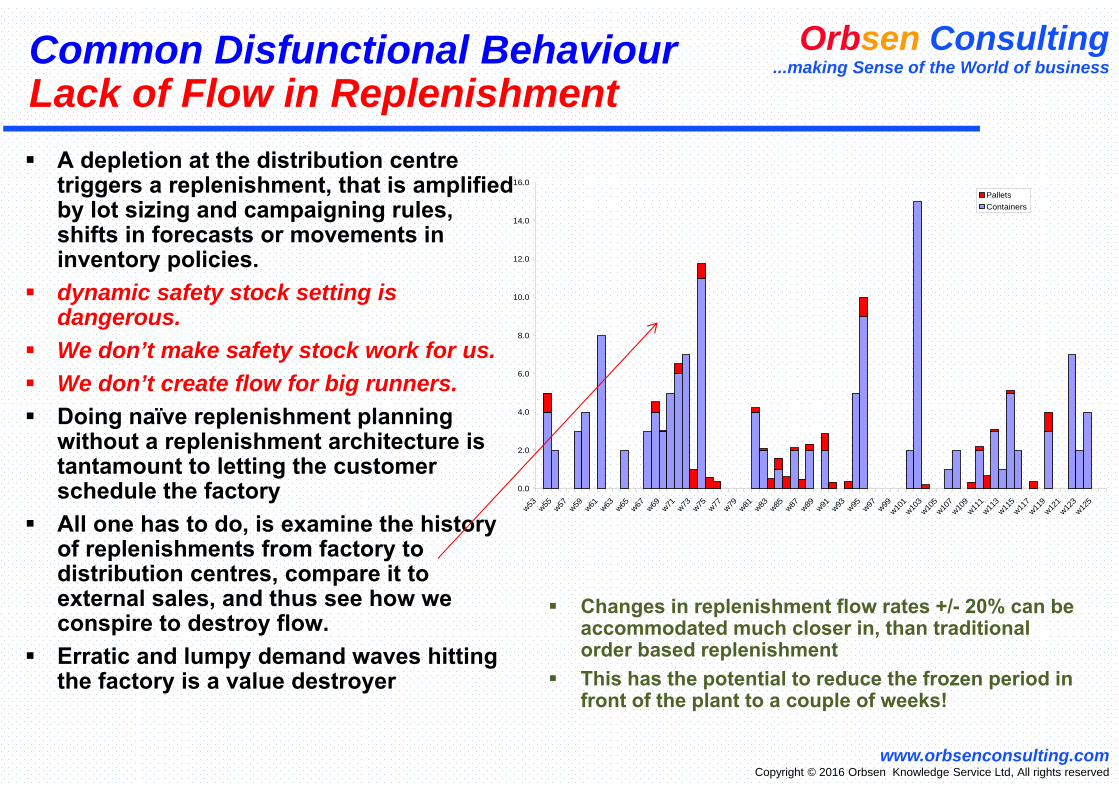
Common Disfunctional BehaviourLack of Flow in Replenishment A depletion at the distribution centre
triggers a replenishment, that is amplified by lot sizing and campaigning rules, shifts in forecasts or movements in inventory policies.
dynamic safety stock setting is dangerous.
We don’t make safety stock work for us. We don’t create flow for big runners. Doing naïve replenishment planning
without a replenishment architecture is tantamount to letting the customer schedule the factory
All one has to do, is examine the history of replenishments from factory to distribution centres, compare it to external sales, and thus see how we conspire to destroy flow.
Erratic and lumpy demand waves hitting the factory is a value destroyer
0.0
2.0
4.0
6.0
8.0
10.0
12.0
14.0
16.0
w53 w55 w57 w59 w61 w63 w65 w67 w69 w71 w73 w75 w77 w79 w81 w83 w85 w87 w89 w91 w93 w95 w97 w99w10
1w10
3w10
5w10
7w10
9w11
1w11
3w11
5w11
7w11
9w12
1w12
3w12
5
PalletsContainers
Changes in replenishment flow rates +/- 20% can be accommodated much closer in, than traditional order based replenishment
This has the potential to reduce the frozen period in front of the plant to a couple of weeks!

Orbsen Consulting...making Sense of the World of business
www.orbsenconsulting.comCopyright © 2016 Orbsen Knowledge Service Ltd, All rights reserved
5. DO YOU KNOW THE TIPPING POINT BETWEEN FLOW AND EFFICIENCY AS A VALUE DRIVER?
Orbsen Consulting...making Sense of the World of business
www.orbsenconsulting.comCopyright © 2016 Orbsen Knowledge Service Ltd, All rights reserved
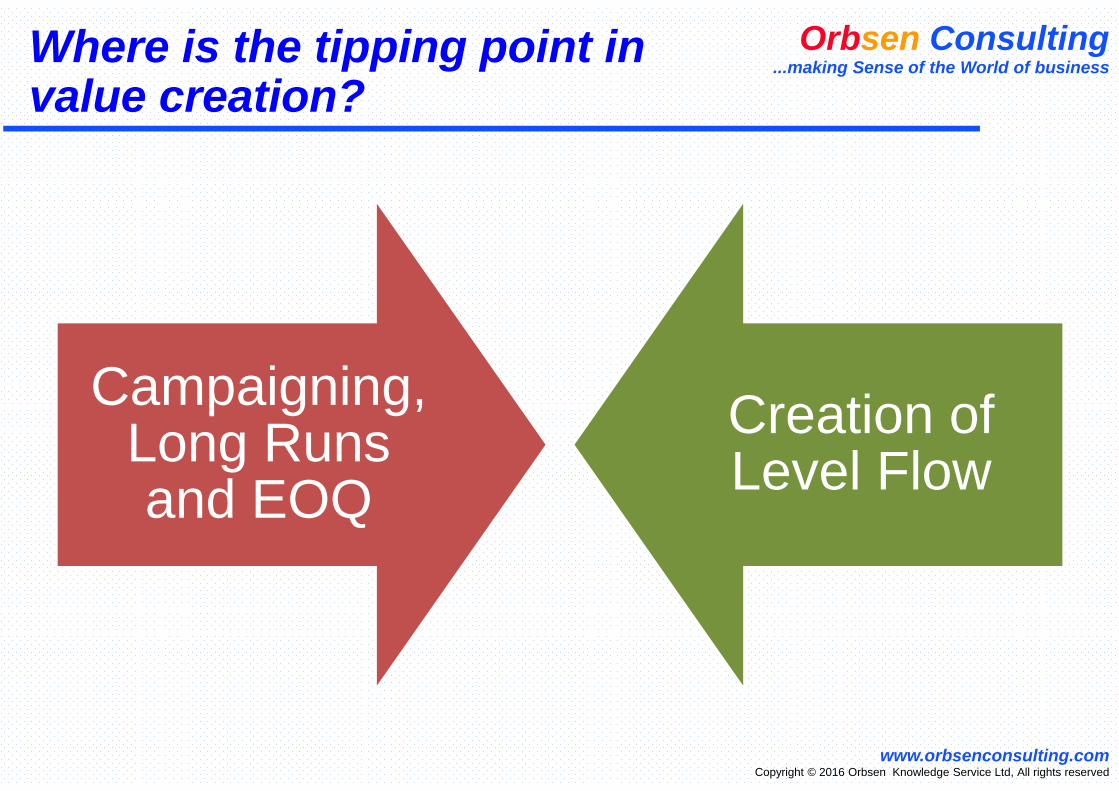
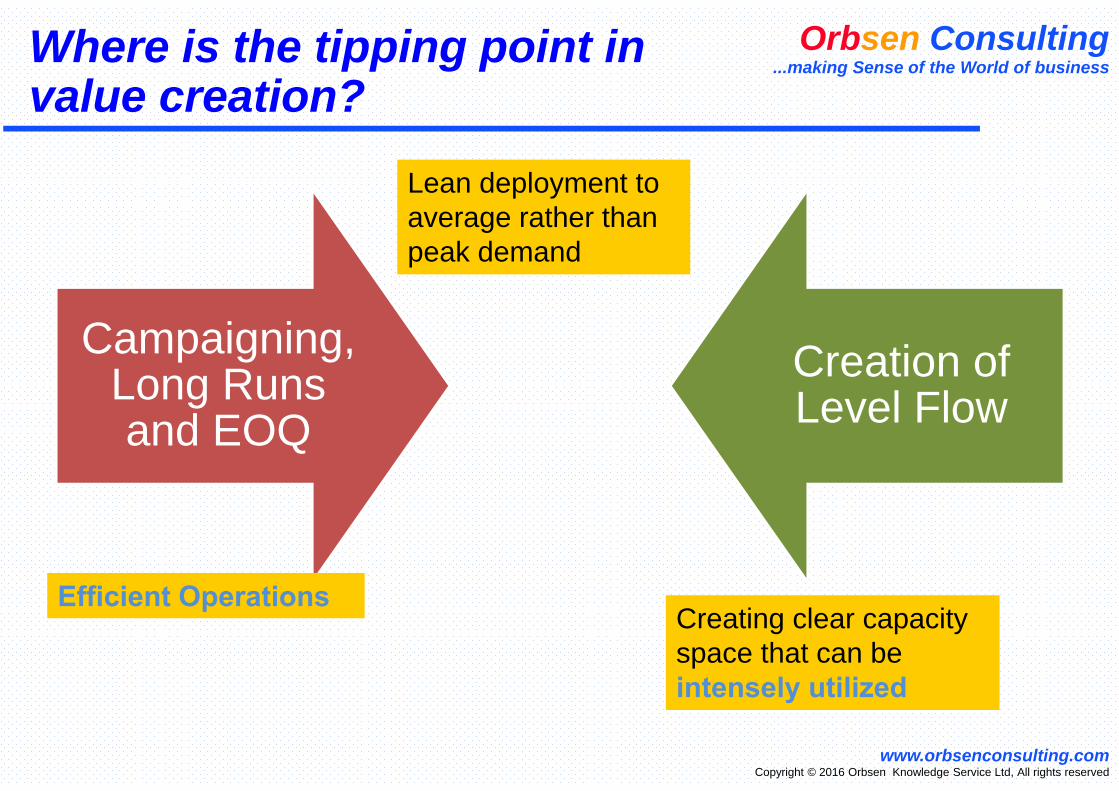
Where is the tipping point in value creation?
Campaigning, Long Runs and EOQ
Creation of Level Flow
Orbsen Consulting...making Sense of the World of business
www.orbsenconsulting.comCopyright © 2016 Orbsen Knowledge Service Ltd, All rights reserved
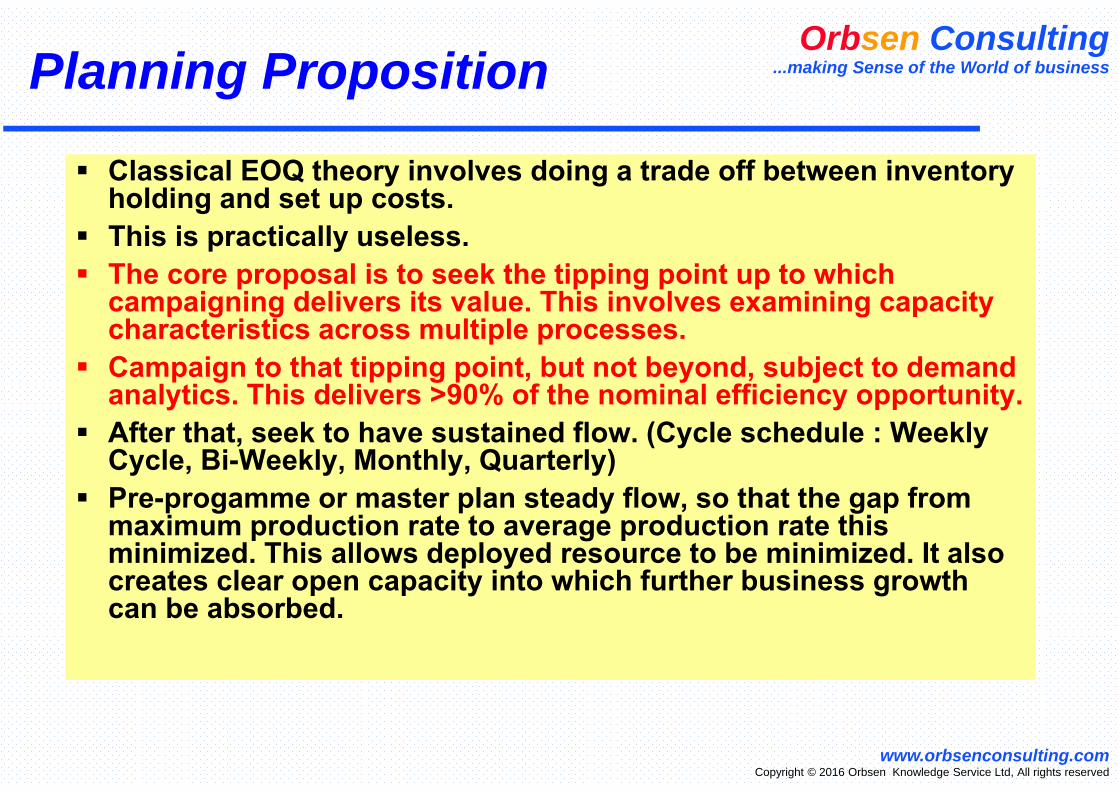
Planning Proposition
Classical EOQ theory involves doing a trade off between inventory holding and set up costs.
This is practically useless. The core proposal is to seek the tipping point up to which
campaigning delivers its value. This involves examining capacity characteristics across multiple processes.
Campaign to that tipping point, but not beyond, subject to demand analytics. This delivers >90% of the nominal efficiency opportunity.
After that, seek to have sustained flow. (Cycle schedule : Weekly Cycle, Bi-Weekly, Monthly, Quarterly)
Pre-progamme or master plan steady flow, so that the gap from maximum production rate to average production rate this minimized. This allows deployed resource to be minimized. It also creates clear open capacity into which further business growth can be absorbed.
Orbsen Consulting...making Sense of the World of business
www.orbsenconsulting.comCopyright © 2016 Orbsen Knowledge Service Ltd, All rights reserved
Where is the tipping point in value creation?
Campaigning, Long Runs and EOQ
Creation of Level Flow
Efficient OperationsCreating clear capacity space that can be intensely utilized
Lean deployment to average rather than peak demand
Orbsen Consulting...making Sense of the World of business
www.orbsenconsulting.comCopyright © 2016 Orbsen Knowledge Service Ltd, All rights reserved
6. INVENTORY IS LIKE CHOLESTEROL :
DO YOU KNOW THE DIFFERENCE BETWEEN GOOD AND BAD?
Inventory Benchmark :Pharmaceuticals
35
84 90100 102 104 107 111 114
129142 148 154 155
175 176189 195 201 209
245
379 388
0
50
100
150
200
250
300
350
400
Elan F09
MSD F09 P
roform
aAbb
ott F09
BMS F09
John
son a
nd Jo
hnso
n F09
Allerga
n F09
King F09
Astra Z
enec
a F09
Hospir
a F09
Actavis
F06Alco
n F09
Bayer
F09Eisa
i F09
Baxter
F09Nov
artis
F09
Forest
Labs
F09
Boehri
nger
Ingelh
eimr F
09Gen
zyme F
09Nyc
omed
F09GSK F09
Eli Lilly
F09
Pfizer
F09 P
roForm
aAmge
n F09
Inventory Benchmark : Medical Devices
5670
8290
99 102 104 104112 116 120 122 123 124 126 130 134 139 142 142 142
152 158
180198
209 210
231
324 331 336
0
50
100
150
200
250
300
350
Intuit
ive S
urgery
F09
Olympu
s F10
Carefus
ion F0
9Abb
ott F09
Covidi
en F09
John
son a
nd Jo
hnso
n F09
Allerga
n F09
Smiths G
roup
F09
CR Bard
F09
Varian
Med
ical F
09B B
raun F
09Te
leflex
F09
Pall F
09BD F
09Millip
ore F0
9
Boston
Scie
ntific
F09
Teru
mo F10
Qiagen
F09Alco
n F09
Medtro
nic F1
0 Prel
imHolo
gic F0
9
Edward
s Life
Scie
nces
F09
Stryke
r F09
Kinetic
F09
St Jun
e Med
ical F
09Int
egra
F09
Sigma A
ldrich
F09Biom
et F09
Synthe
s F09
Smith &
Nep
hew F0
9Zim
mer F09
Total Inventory Holding excl Maturing as days of COGSbased on latest published reports
reporting currency basis
40 4862 63 65 69 70
77
2437
45 46 47 50 51 5262 63
83
137 141152
163
261
144
0102030405060708090
100110120130140150160170180190200210220230240250260270
InBev
F09
Asahi
F09
(Jap
an)
Danon
e F08
Carlsb
erg
F09
preli
m
Asia P
acifi
c Br
ew.F
09 (S
inga
por
Heinek
en F
09 p
relim
Peps
i F09
pre
limMol
son
Coors
F09
FEMSA
Cer
vazo
F09
(Mex
ico)
Kirin
F09
(Jap
an)
SAB M
iller F
09Ne
stle
F09
Fujia
n Ya
njin
g F0
9 (Ch
ina)
Unilev
er F
09 P
relim
P&G F
09He
inz F
09
Colg
ateP
almol
ive F
09 p
relim
Coca C
ola F
09 p
relim
Diag
eo F
09Bro
wn Fo
rman
F09
Cam
pari
F08
Fost
ers F
09Pe
rnod
Rica
rd F
09
Beam
(est
imat
e) F
09 p
relim
Remy C
oint
reau
F09
CPGBeerWineSpiritsBeer/Wine
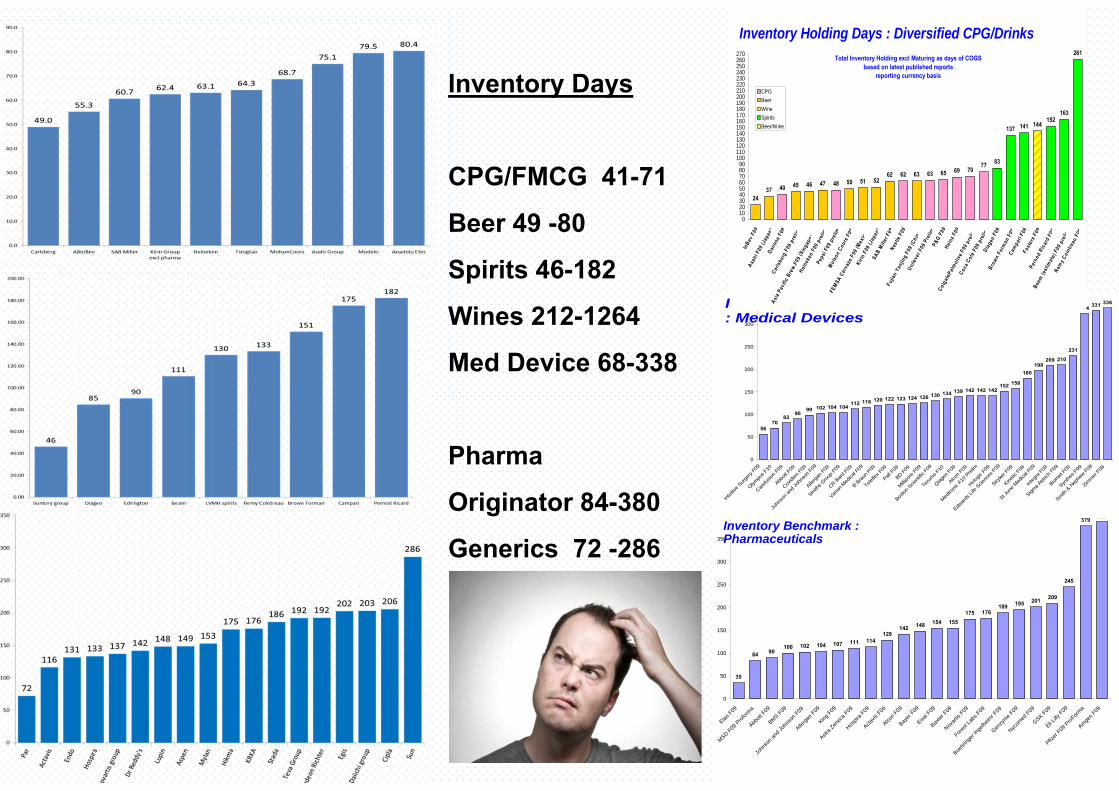
Inventory Holding Days : Diversified CPG/Drinks
Inventory Days
CPG/FMCG 41-71
Beer 49 -80
Spirits 46-182
Wines 212-1264
Med Device 68-338
Pharma
Originator 84-380
Generics 72 -286
Orbsen Consulting...making Sense of the World of business
www.orbsenconsulting.comCopyright © 2016 Orbsen Knowledge Service Ltd, All rights reserved
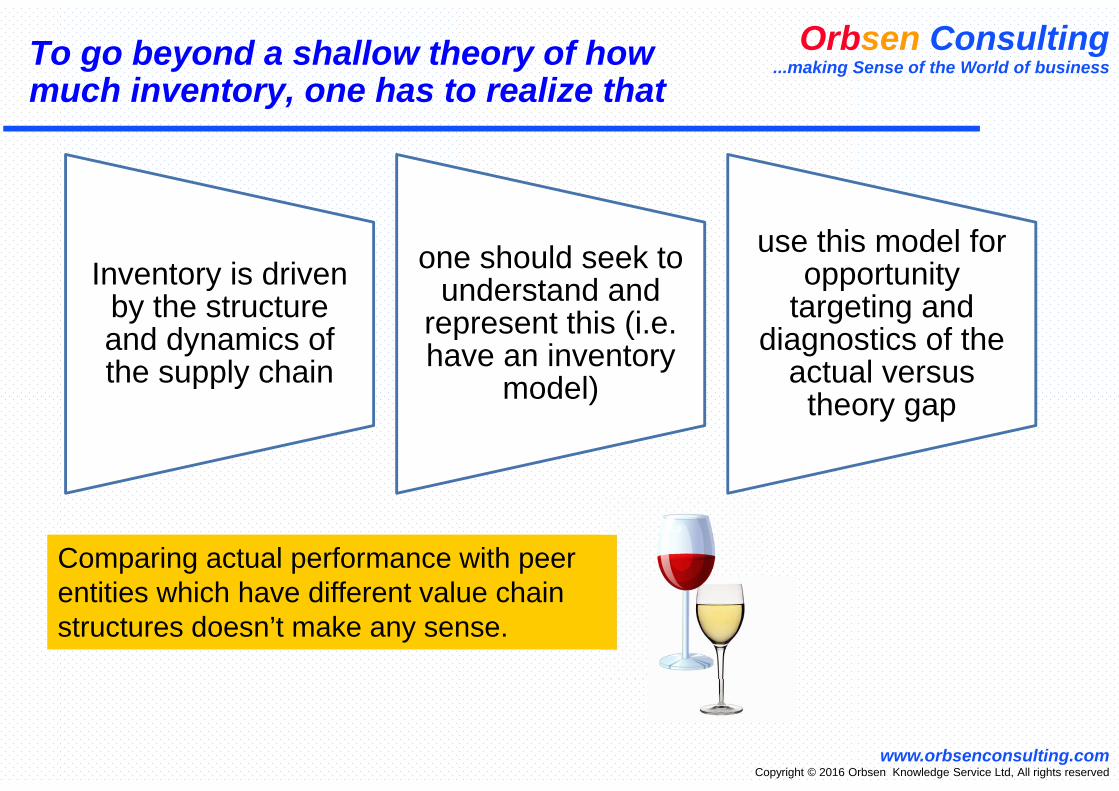
To go beyond a shallow theory of how much inventory, one has to realize that
Inventory is driven by the structure and dynamics of the supply chain
one should seek to understand and
represent this (i.e. have an inventory
model)
use this model for opportunity
targeting and diagnostics of the
actual versus theory gap
Comparing actual performance with peer entities which have different value chain structures doesn’t make any sense.

Orbsen Consulting...making Sense of the World of business
www.orbsenconsulting.comCopyright © 2016 Orbsen Knowledge Service Ltd, All rights reserved
Inventory is like cholesterol : Do you know the difference between good and bad?
What inventory should we
have?
How business structure
drives inventory How
business dynamics
drive inventory
Why are our
inventory outcomes different?How can
we improve
our inventory outcomes
How can we
optimize our target inventory
entity inventory
vs corporate balance sheet
99% of companies don’t know how much inventory they should have.

Orbsen Consulting...making Sense of the World of business
www.orbsenconsulting.comCopyright © 2016 Orbsen Knowledge Service Ltd, All rights reserved
Inventory Structures
Market Safety stock (demand variation and
policy)
Cycle stock of Market
ReplenishmentTransport
modal Inventory
Fiscal adj.Transfer pricing, PPV, Duty, M&A
step up
Seasonal Anticipation Inventory
In-market reworks
Plant distribution Inventory
(postponement)
Packaging FG Cycle Inventory
Packaging materials Cycle
Inventory
Packaging materials Safety
Inventory
QA release Impaired Inventory
Packaging lead time Inventory
Bulk-Pack Decoupling Inventory
Production Conversion Inventory
QC release Inventory
Impaired Bulk Inventory
Raw Material Cycle Inventory
Raw material Safety stock
Inventory
Upstream conversion
(API)
Orbsen Consulting...making Sense of the World of business
www.orbsenconsulting.comCopyright © 2016 Orbsen Knowledge Service Ltd, All rights reserved
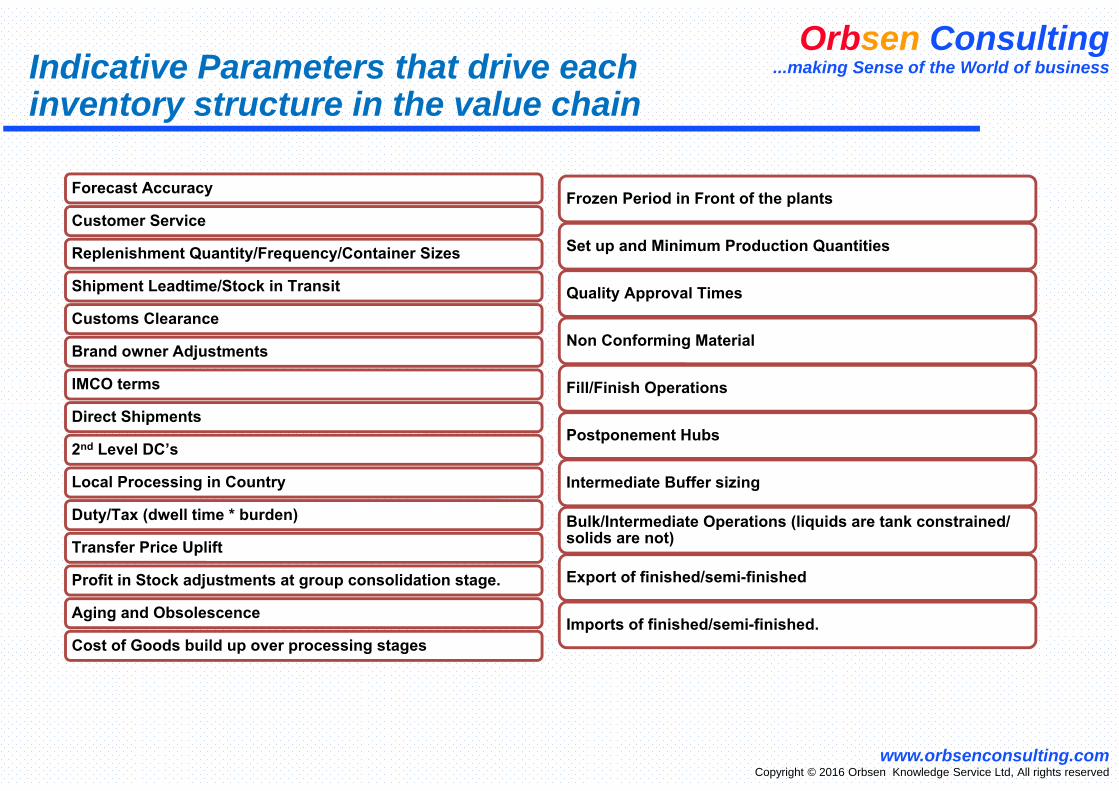
Indicative Parameters that drive each inventory structure in the value chain
Forecast Accuracy
Customer Service
Replenishment Quantity/Frequency/Container Sizes
Shipment Leadtime/Stock in Transit
Customs Clearance
Brand owner Adjustments
IMCO terms
Direct Shipments
2nd Level DC’s
Local Processing in Country
Duty/Tax (dwell time * burden)
Transfer Price Uplift
Profit in Stock adjustments at group consolidation stage.
Aging and Obsolescence
Cost of Goods build up over processing stages
Frozen Period in Front of the plants
Set up and Minimum Production Quantities
Quality Approval Times
Non Conforming Material
Fill/Finish Operations
Postponement Hubs
Intermediate Buffer sizing
Bulk/Intermediate Operations (liquids are tank constrained/ solids are not)
Export of finished/semi-finished
Imports of finished/semi-finished.
Orbsen Consulting...making Sense of the World of business
www.orbsenconsulting.comCopyright © 2016 Orbsen Knowledge Service Ltd, All rights reserved
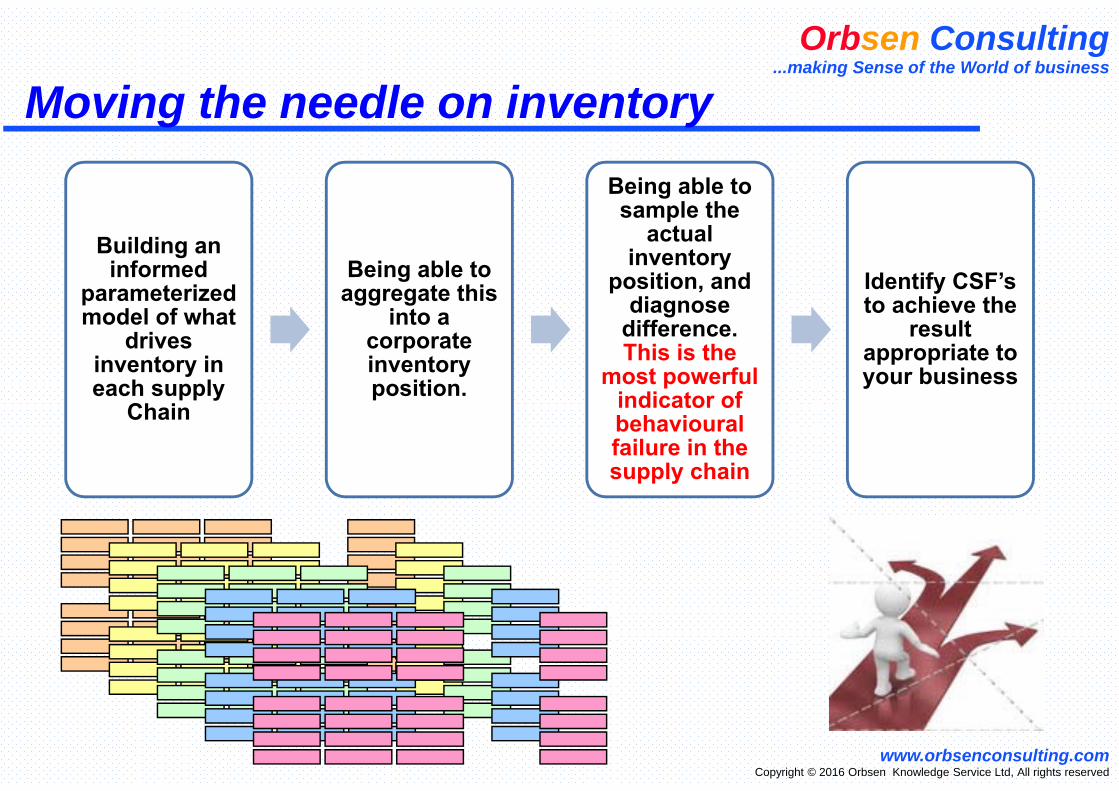
Moving the needle on inventory
Building an informed
parameterized model of what
drives inventory in each supply
Chain
Being able to aggregate this
into a corporate inventory position.
Being able to sample the
actual inventory
position, and diagnose
difference. This is the
most powerful indicator of behavioural failure in the supply chain
Identify CSF’s to achieve the
result appropriate to your business

Orbsen Consulting...making Sense of the World of business
www.orbsenconsulting.comCopyright © 2016 Orbsen Knowledge Service Ltd, All rights reserved
We all think we know how to set Safety Stock In the DC
Forecast Error/ period( ) Supply
Variation+ ( )Number of periods*
2 2
Service level *
Orbsen Consulting...making Sense of the World of business
www.orbsenconsulting.comCopyright © 2016 Orbsen Knowledge Service Ltd, All rights reserved
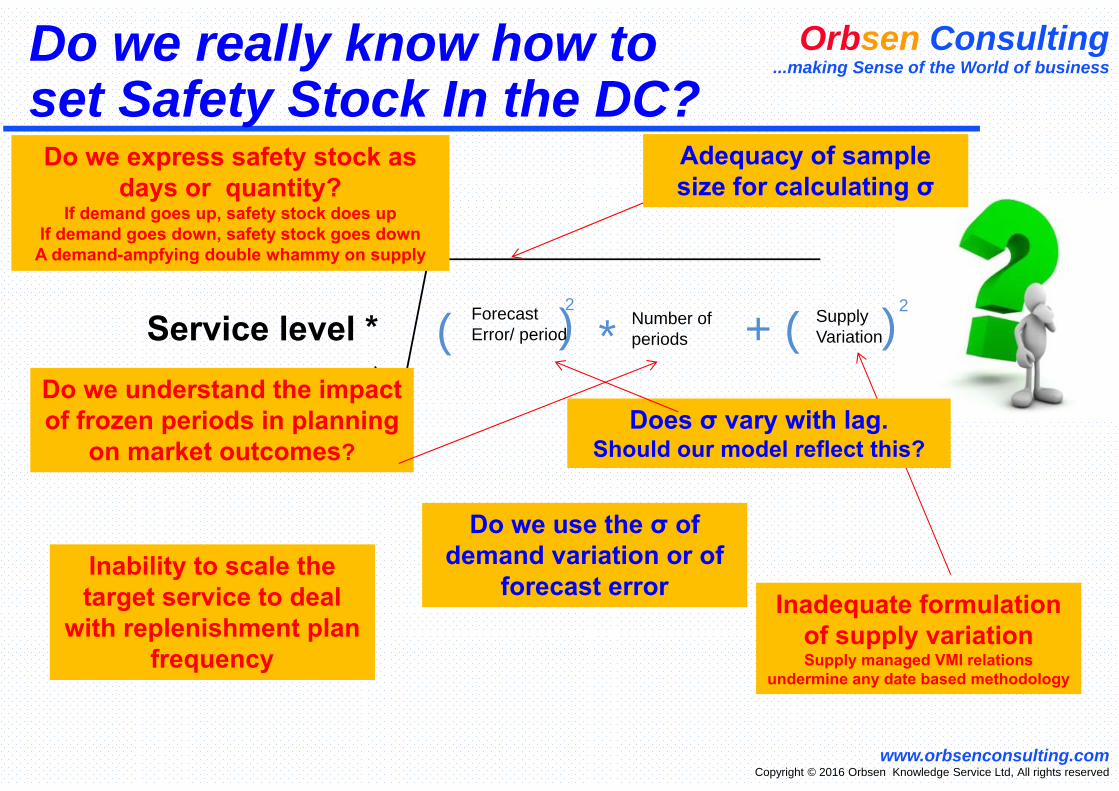
Do we really know how to set Safety Stock In the DC?
Forecast Error/ period( ) Supply
Variation+ ( )Number of periods*
2 2
Service level *
Inadequate formulation of supply variationSupply managed VMI relations
undermine any date based methodology
Inability to scale the target service to deal
with replenishment plan frequency
Do we use the σ of demand variation or of
forecast error
Do we express safety stock as days or quantity?
If demand goes up, safety stock does upIf demand goes down, safety stock goes down
A demand-ampfying double whammy on supply
Adequacy of sample size for calculating σ
Does σ vary with lag. Should our model reflect this?
Do we understand the impact of frozen periods in planning
on market outcomes?

Orbsen Consulting...making Sense of the World of business
www.orbsenconsulting.comCopyright © 2016 Orbsen Knowledge Service Ltd, All rights reserved
Attacking Inventory
Total Inventory (X Days)
Target Inventorymodified ways of working (X days)
Safety Stock(k days)
Demand RiskAmplified by lead-time
Supply Risk(w days)
Cycle Stock(M days)
Transport(R days)
Excess Inventory(Y days)
• Address Brand specific excess’s
• Eliminate Bias• Address over
campaigning in packaging
• Apply normalization to various forecast lags
Lag‐3 vs Lag‐1
Review the end to end supply impacts of chain fragmentation
• Change approach to replenishment scaling
• Change language for supply risk
Orbsen Consulting...making Sense of the World of business
www.orbsenconsulting.comCopyright © 2016 Orbsen Knowledge Service Ltd, All rights reserved
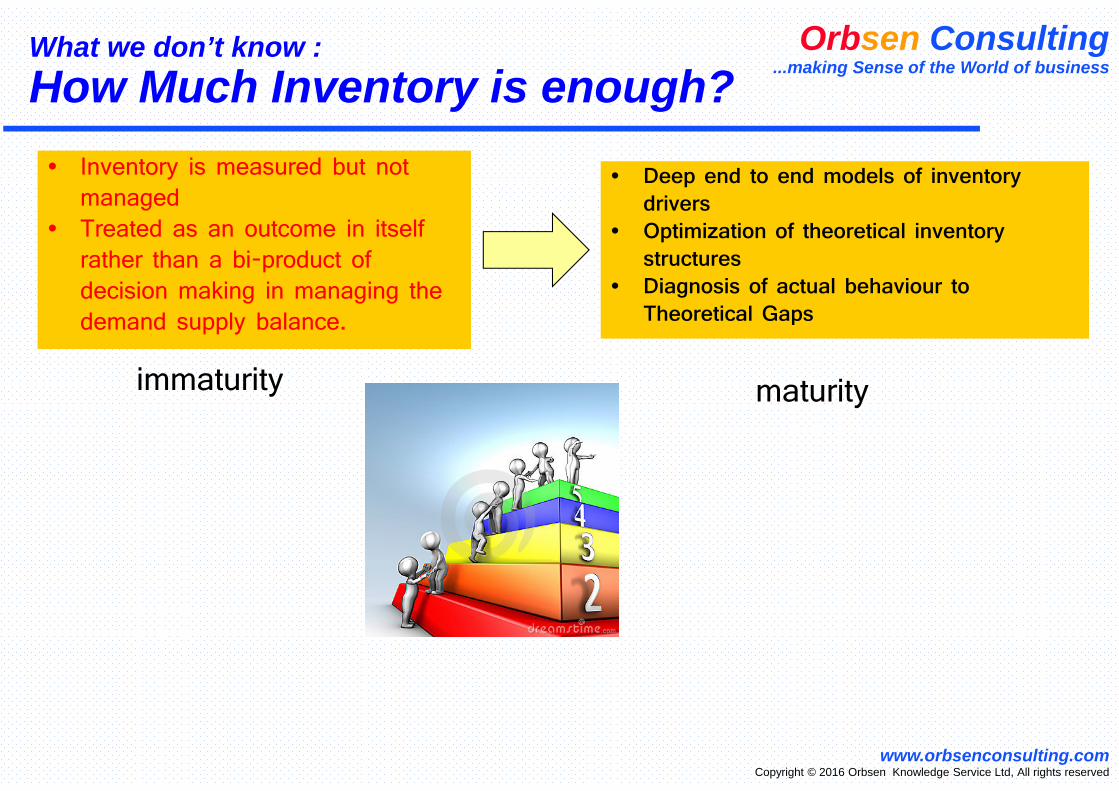
What we don’t know :How Much Inventory is enough?
• Inventory is measured but not managed
• Treated as an outcome in itself rather than a bi-product of decision making in managing the demand supply balance.
• Deep end to end models of inventory drivers
• Optimization of theoretical inventory structures
• Diagnosis of actual behaviour to Theoretical Gaps
immaturity maturity
Orbsen Consulting...making Sense of the World of business
www.orbsenconsulting.comCopyright © 2016 Orbsen Knowledge Service Ltd, All rights reserved
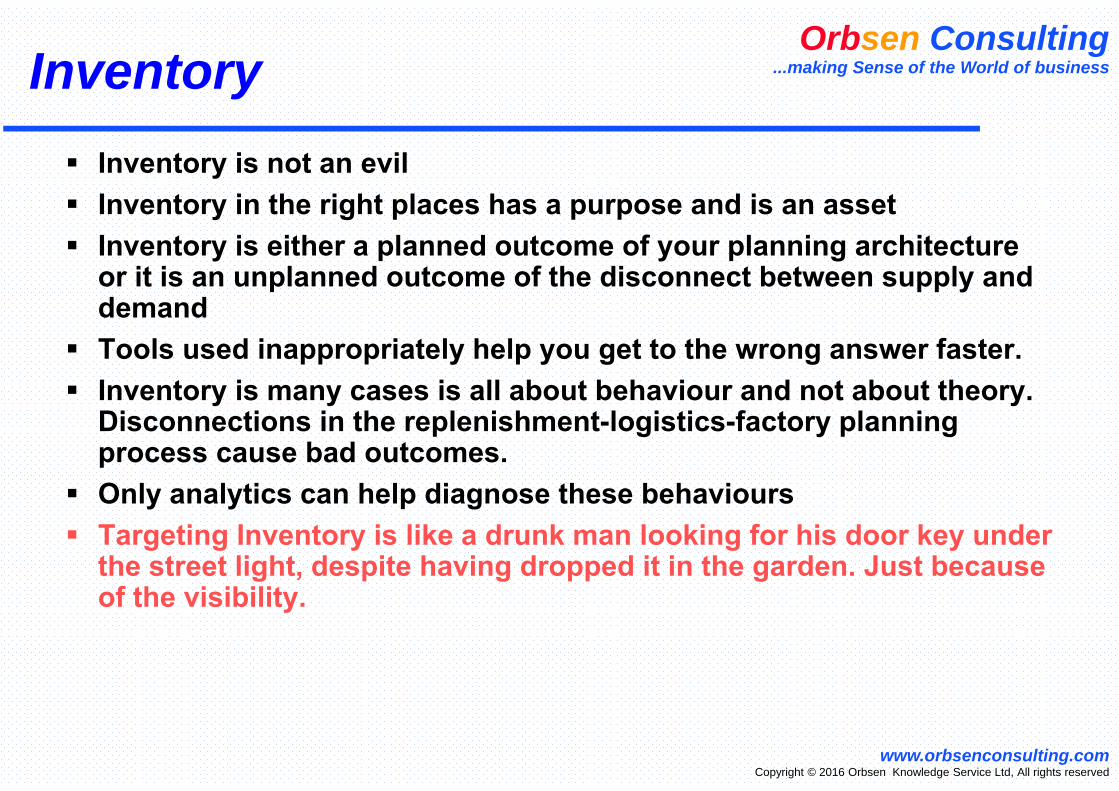
Inventory Inventory is not an evil Inventory in the right places has a purpose and is an asset Inventory is either a planned outcome of your planning architecture
or it is an unplanned outcome of the disconnect between supply and demand
Tools used inappropriately help you get to the wrong answer faster. Inventory is many cases is all about behaviour and not about theory.
Disconnections in the replenishment-logistics-factory planning process cause bad outcomes.
Only analytics can help diagnose these behaviours Targeting Inventory is like a drunk man looking for his door key under
the street light, despite having dropped it in the garden. Just because of the visibility.
Orbsen Consulting...making Sense of the World of business
www.orbsenconsulting.comCopyright © 2016 Orbsen Knowledge Service Ltd, All rights reserved
7. IF YOU CANNOT SEE YOUR SUPPLY CHAINS,…
YOU CANNOT EVEN BEGIN TO HAVE A THEORY OF HOW TO MANAGE THEM.

Use Analytics to overcome the fog of SKU complexity, discover bad behaviours and value platforms and improve business outcomes
Good Analytics is better that good theoryIt cuts like a knife through the butter of all the blah-blah theories that populate our business discourse
Moving beyond tools and theories to behaviour remediation. It is about using that data to understand and diagnose business behaviours.
Seeing the supply chain and knowing what is to be done
Rapid Analytics enables one do discovery and go deep in the characterisation of value platforms
Obtaining better Supply Chain Outcomes
95% of companies cannot see their supply chains
Orbsen Consulting...making Sense of the World of business
www.orbsenconsulting.comCopyright © 2016 Orbsen Knowledge Service Ltd, All rights reserved
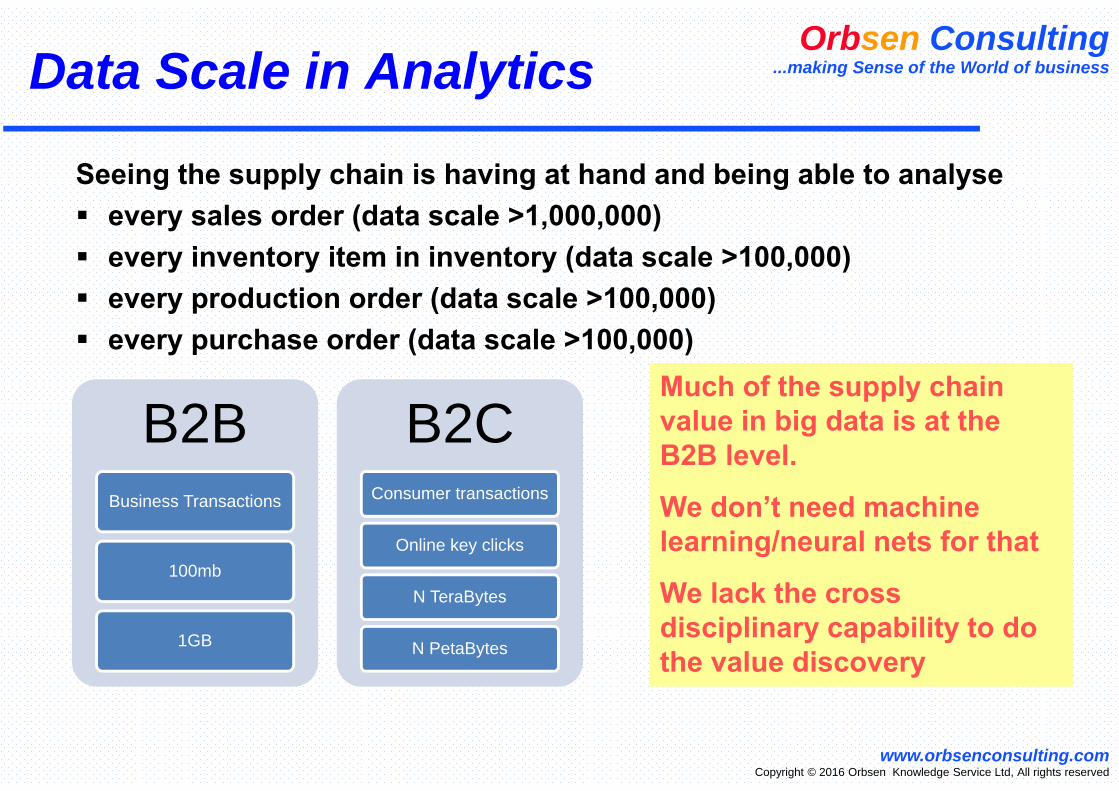
Data Scale in Analytics
B2BBusiness Transactions
100mb
1GB
B2CConsumer transactions
Online key clicks
N TeraBytes
N PetaBytes
Seeing the supply chain is having at hand and being able to analyse every sales order (data scale >1,000,000) every inventory item in inventory (data scale >100,000) every production order (data scale >100,000) every purchase order (data scale >100,000)
Much of the supply chain value in big data is at the B2B level.
We don’t need machine learning/neural nets for that
We lack the cross disciplinary capability to do the value discovery

Orbsen Consulting...making Sense of the World of business
www.orbsenconsulting.comCopyright © 2016 Orbsen Knowledge Service Ltd, All rights reserved
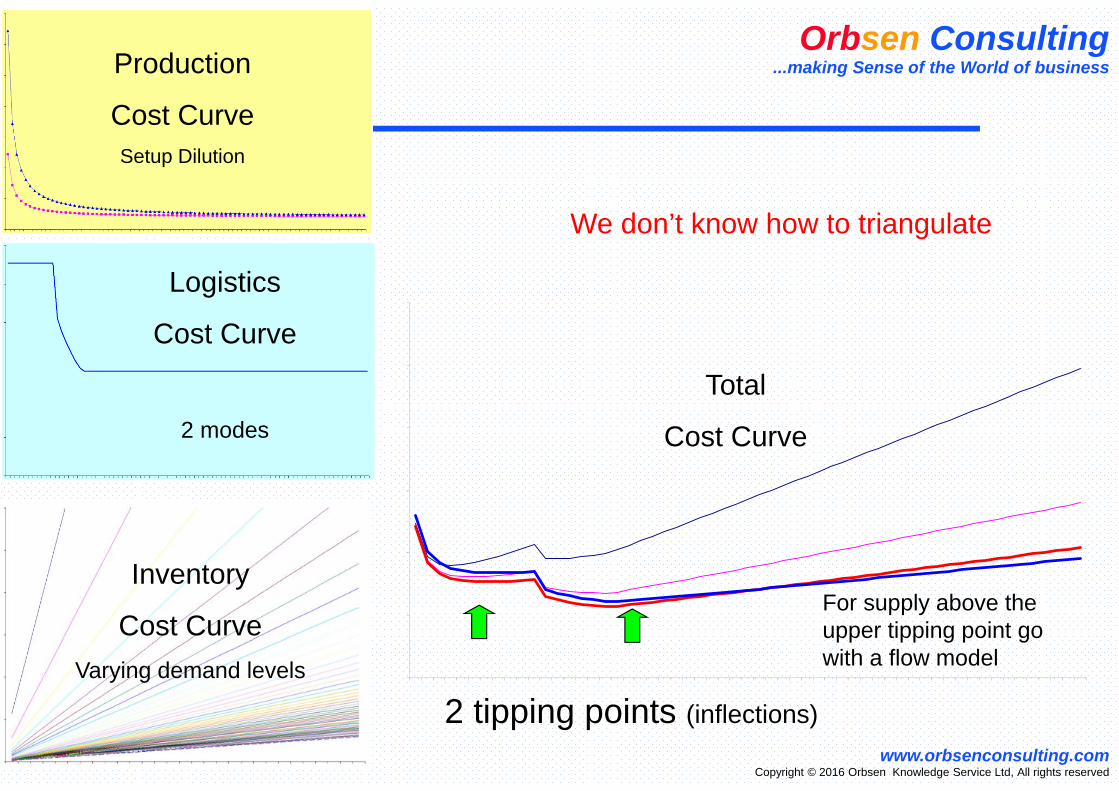
8. WE DON’T KNOW HOW TO TRIANGULATE…
PRODUCTION, LOGISTICS AND INVENTORY COSTS..
Orbsen Consulting...making Sense of the World of business
www.orbsenconsulting.comCopyright © 2016 Orbsen Knowledge Service Ltd, All rights reserved
Production
Cost CurveSetup Dilution
Logistics
Cost Curve
2 modes
Inventory
Cost CurveVarying demand levels
Total
Cost Curve
2 tipping points (inflections)
For supply above the upper tipping point go with a flow model
We don’t know how to triangulate

Orbsen Consulting...making Sense of the World of business
www.orbsenconsulting.comCopyright © 2016 Orbsen Knowledge Service Ltd, All rights reserved
Planning Architecture : PFEP/EPE*
PlanningProducts that are on variatedlevel Flow
Products that on a cycle schedule
Fixed Order Quantity
Make to Order
Logistics

Orbsen Consulting...making Sense of the World of business
www.orbsenconsulting.comCopyright © 2016 Orbsen Knowledge Service Ltd, All rights reserved
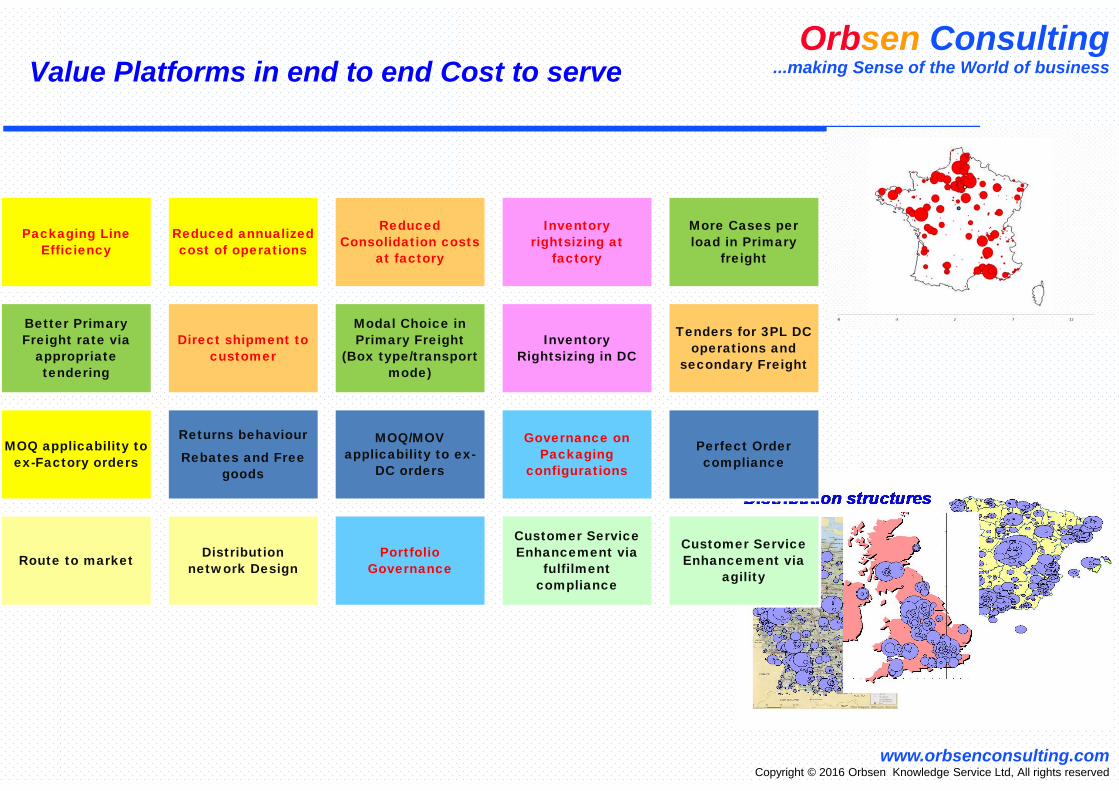
9. WE DON’T THINK END TO END…
.
Orbsen Consulting...making Sense of the World of business
www.orbsenconsulting.comCopyright © 2016 Orbsen Knowledge Service Ltd, All rights reserved
Value Platforms in end to end Cost to serve
Packaging Line Efficiency
Reduced annualized cost of operations
Reduced Consolidation costs
at factory
Inventory rightsizing at
factory
More Cases per load in Primary
freight
Better Primary Freight rate via
appropriate tendering
Direct shipment to customer
Modal Choice in Primary Freight
(Box type/transport mode)
Inventory Rightsizing in DC
Tenders for 3PL DC operations and
secondary Freight
MOQ applicability to ex-Factory orders
Returns behaviour
Rebates and Free goods
MOQ/MOV applicability to ex-
DC orders
Governance on Packaging
configurations
Perfect Order compliance
Route to market Distribution network Design
Portfolio Governance
Customer Service Enhancement via
fulfilment compliance
Customer Service Enhancement via
agility

Orbsen Consulting...making Sense of the World of business
www.orbsenconsulting.comCopyright © 2016 Orbsen Knowledge Service Ltd, All rights reserved
10. IF YOU DON’T DO THE SUPPLY CHAIN ENGINEERING, .
YOU ARE ONLY FOOLING YOURSELF WITH LEANSPEAK.
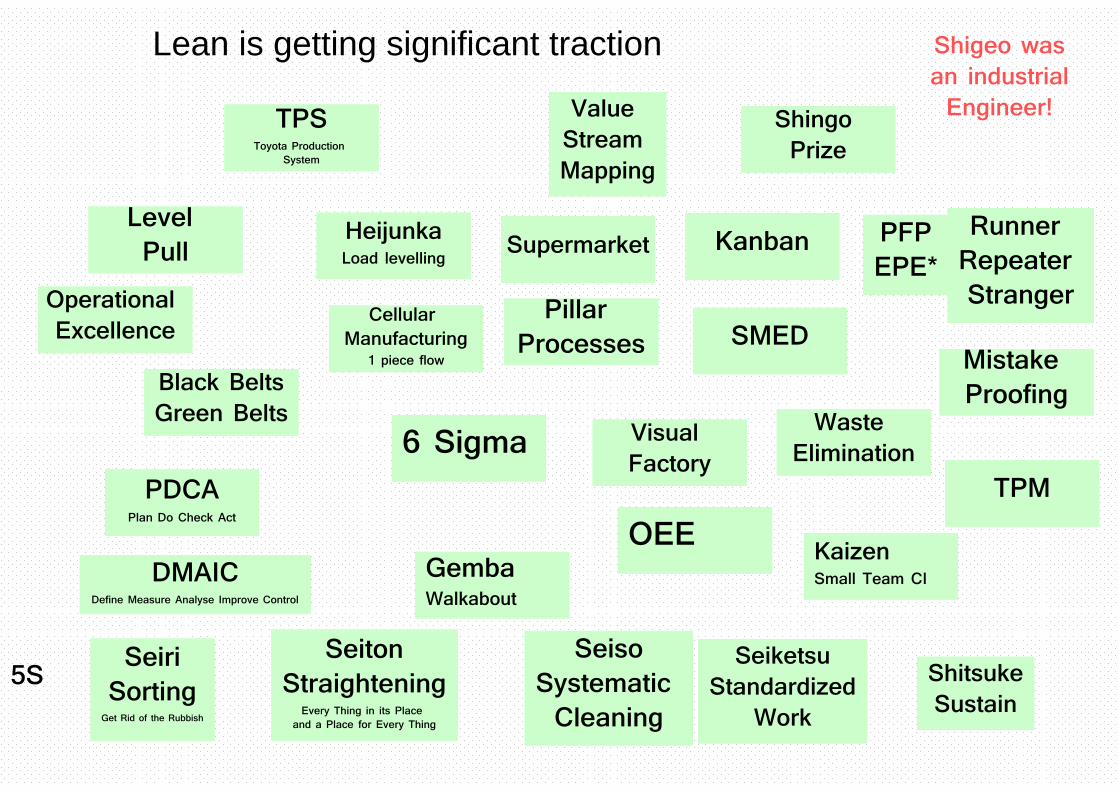
Lean is getting significant traction
HeijunkaLoad levelling
GembaWalkabout
KaizenSmall Team CI
Level Pull Kanban
TPM
SeiriSorting
Get Rid of the Rubbish
SeitonStraightening
Every Thing in its Place and a Place for Every Thing
SeisoSystematic Cleaning
SeiketsuStandardized
Work
ShitsukeSustain
5S
PDCAPlan Do Check Act
Supermarket
Pillar Processes
Black BeltsGreen Belts
DMAICDefine Measure Analyse Improve Control,
6 Sigma
Shingo Prize
Visual Factory
Operational Excellence SMED
Shigeo was an industrial Engineer!TPS
Toyota Production System
Cellular Manufacturing
1 piece flow
OEE
Waste Elimination
Mistake Proofing
Value Stream Mapping
Runner Repeater Stranger
PFPEPE*

Lean is getting significant traction
HeijunkaLoad levelling
GembaWalkabout
KaizenSmall Team CI
Level Pull Kanban
TPM
SeiriSorting
Get Rid of the Rubbish
SeitonStraightening
Every Thing in its Place and a Place for Every Thing
SeisoSystematic Cleaning
SeiketsuStandardized
Work
ShitsukeSustain
5S
PDCAPlan Do Check Act
Supermarket
Pillar Processes
Black BeltsGreen Belts
DMAICDefine Measure Analyse Improve Control,
6 Sigma
Shingo Prize
Visual Factory
Operational Excellence SMED
Shigeo was an industrial Engineer!TPS
Toyota Production System
Cellular Manufacturing
1 piece flow
OEE
Waste Elimination
Mistake Proofing
Value Stream Mapping
Runner Repeater Stranger
PFPEPE*IF YOU DON’T DO THE
SUPPLY CHAIN ENGINEERING, YOU ARE SERIOUSLY MISGUIDED

Limits of Lean Talk and LeanspeakToo much religionNot enough money
Be Pragmatic. Follow the business imperative, Follow the money
Having a lean team makes you lean Have a appropriate “weigh-in”Conversion Cost, Inventory DaysEmbed lean rather than have centralized teams.
Inventory is evil Inventory in the right places is good. It should be an informed consequence of your planning architecture
big batches are bad Campaign size in the Planning Architecture should be fully informed by the trade-offs between setup dilution, distribution optimization and inventory costs
Level pull is where it is at Level flow of any form (push or pull) works just fineTends to be under-informed about supply chain structure, pareto and dynamics
Do the analytics
Tends not to do the necessary supply chain engineering. (e.g. how to you parameterize a decoupling supermarket?)
Do the engineering
Tends not to understand the reality of sectoral operations
Follow the business imperative
5S gone mad 5S only in the appropriate placesLimits of Heijunka in dealing with seasonal demand Have a master plan.
Don’t let the customer schedule the plant
immaturity maturity
Orbsen Consulting...making Sense of the World of business
www.orbsenconsulting.comCopyright © 2016 Orbsen Knowledge Service Ltd, All rights reserved
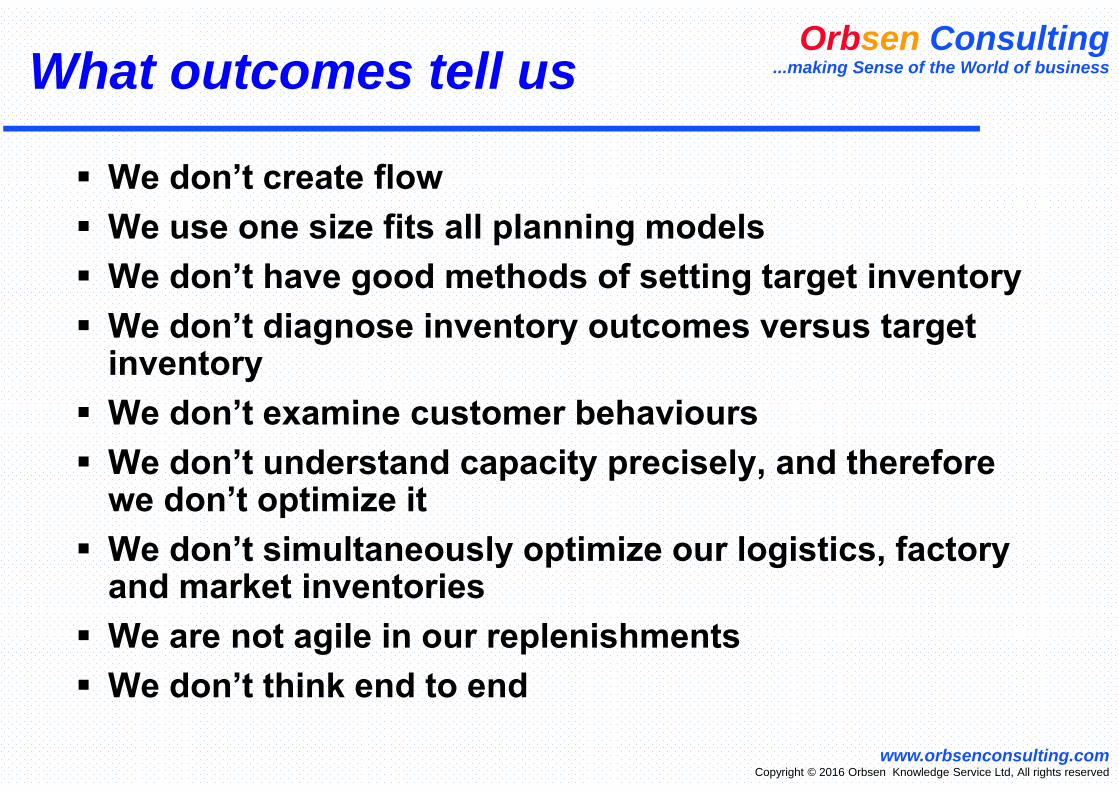
What outcomes tell us
We don’t create flow We use one size fits all planning models We don’t have good methods of setting target inventory We don’t diagnose inventory outcomes versus target
inventory We don’t examine customer behaviours We don’t understand capacity precisely, and therefore
we don’t optimize it We don’t simultaneously optimize our logistics, factory
and market inventories We are not agile in our replenishments We don’t think end to end
Orbsen Consulting...making Sense of the World of business
www.orbsenconsulting.comCopyright © 2016 Orbsen Knowledge Service Ltd, All rights reserved
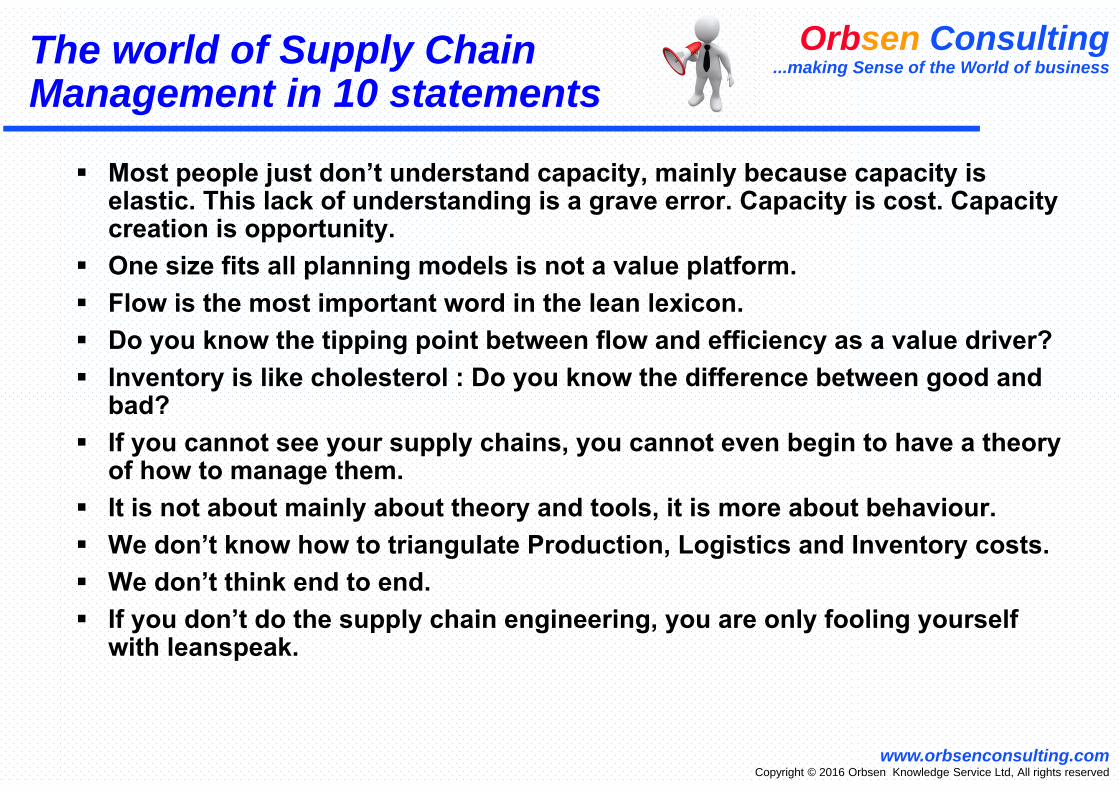
The world of Supply Chain Management in 10 statements
Most people just don’t understand capacity, mainly because capacity is elastic. This lack of understanding is a grave error. Capacity is cost. Capacity creation is opportunity.
One size fits all planning models is not a value platform. Flow is the most important word in the lean lexicon. Do you know the tipping point between flow and efficiency as a value driver? Inventory is like cholesterol : Do you know the difference between good and
bad? If you cannot see your supply chains, you cannot even begin to have a theory
of how to manage them. It is not about mainly about theory and tools, it is more about behaviour. We don’t know how to triangulate Production, Logistics and Inventory costs. We don’t think end to end. If you don’t do the supply chain engineering, you are only fooling yourself
with leanspeak.
Orbsen Consulting...making Sense of the World of business
www.orbsenconsulting.comCopyright © 2016 Orbsen Knowledge Service Ltd, All rights reserved
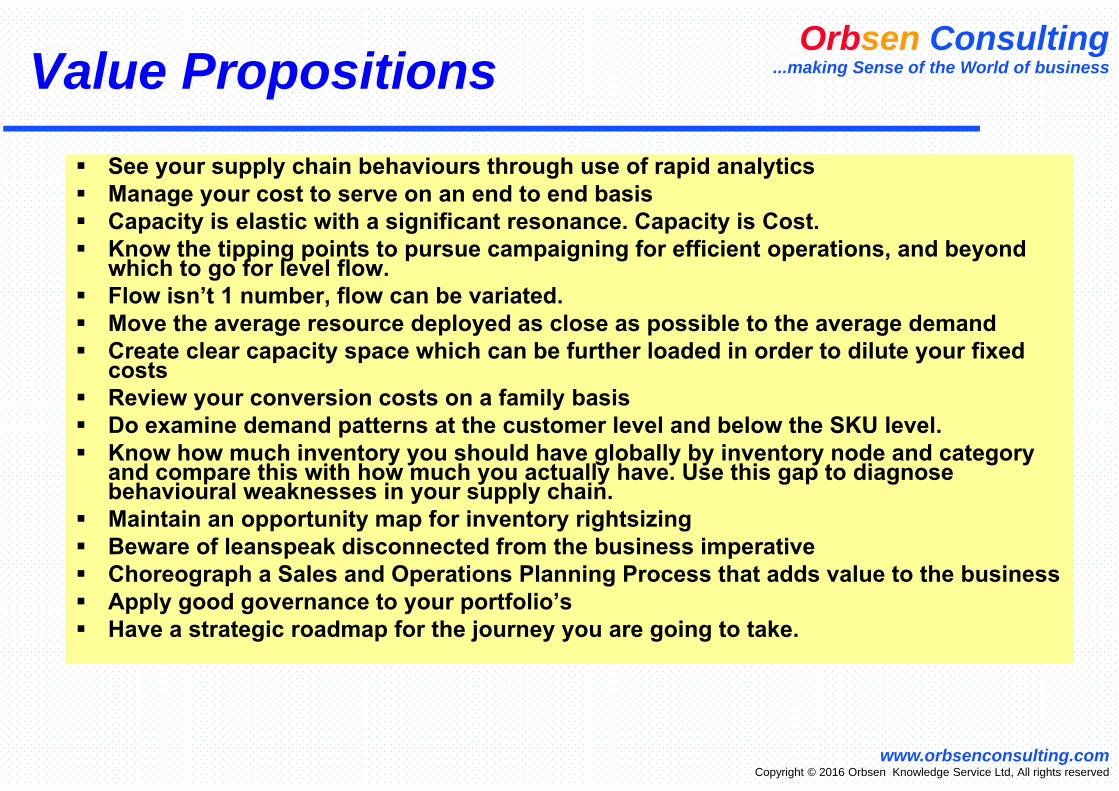
Value Propositions See your supply chain behaviours through use of rapid analytics Manage your cost to serve on an end to end basis Capacity is elastic with a significant resonance. Capacity is Cost. Know the tipping points to pursue campaigning for efficient operations, and beyond
which to go for level flow. Flow isn’t 1 number, flow can be variated. Move the average resource deployed as close as possible to the average demand Create clear capacity space which can be further loaded in order to dilute your fixed
costs Review your conversion costs on a family basis Do examine demand patterns at the customer level and below the SKU level. Know how much inventory you should have globally by inventory node and category
and compare this with how much you actually have. Use this gap to diagnose behavioural weaknesses in your supply chain.
Maintain an opportunity map for inventory rightsizing Beware of leanspeak disconnected from the business imperative Choreograph a Sales and Operations Planning Process that adds value to the business Apply good governance to your portfolio’s Have a strategic roadmap for the journey you are going to take.

Orbsen Consulting...making Sense of the World of business
www.orbsenconsulting.comCopyright © 2016 Orbsen Knowledge Service Ltd, All rights reserved
Possibilities?
Capacity Creation : +34%, +24%, +180% in very large sites
Inventory Reduction -27% on corporate balance sheets

Orbsen Consulting...making Sense of the World of business
www.orbsenconsulting.comCopyright © 2016 Orbsen Knowledge Service Ltd, All rights reserved
Orbsen Consulting...making Sense of the World of business
To Contact Us
www.orbsenconsulting.com
Tel : 353-87-2240489 cellular/mobileTel : 353-58-44986 landline
Orbsen Consulting...making Sense of the World of business
www.orbsenconsulting.comCopyright © 2016 Orbsen Knowledge Service Ltd, All rights reserved
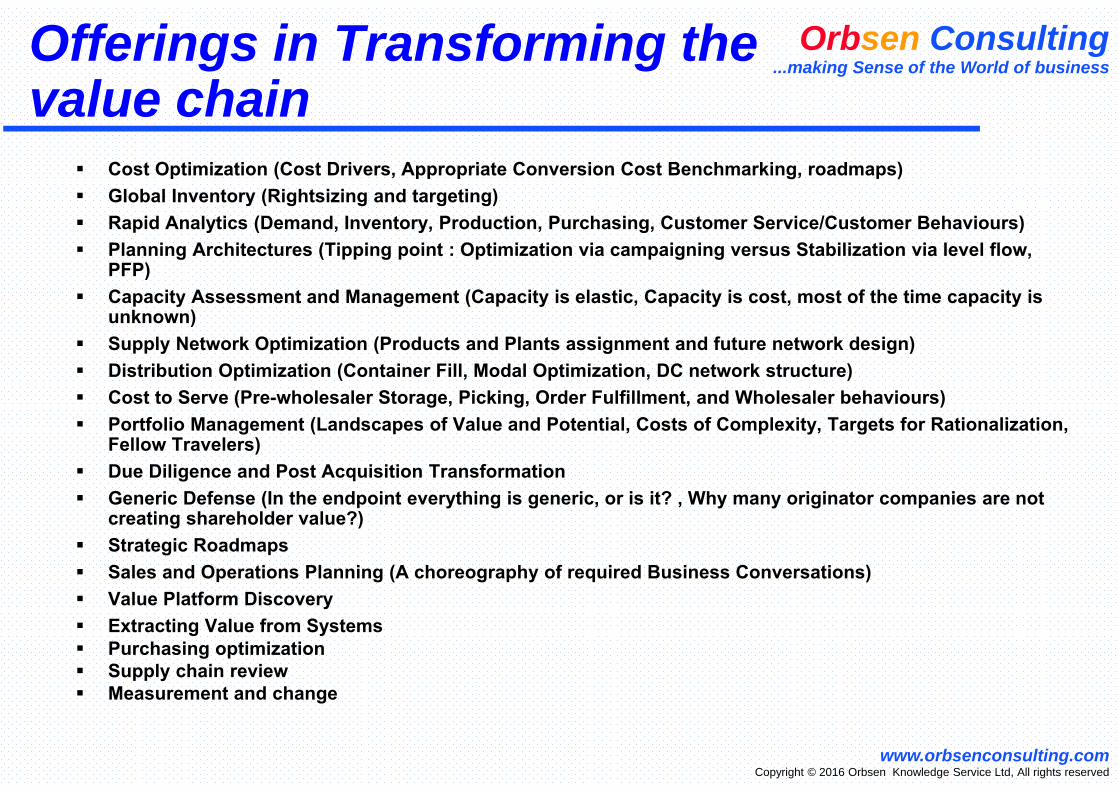
Offerings in Transforming the value chain
Cost Optimization (Cost Drivers, Appropriate Conversion Cost Benchmarking, roadmaps) Global Inventory (Rightsizing and targeting) Rapid Analytics (Demand, Inventory, Production, Purchasing, Customer Service/Customer Behaviours) Planning Architectures (Tipping point : Optimization via campaigning versus Stabilization via level flow,
PFP) Capacity Assessment and Management (Capacity is elastic, Capacity is cost, most of the time capacity is
unknown) Supply Network Optimization (Products and Plants assignment and future network design) Distribution Optimization (Container Fill, Modal Optimization, DC network structure) Cost to Serve (Pre-wholesaler Storage, Picking, Order Fulfillment, and Wholesaler behaviours) Portfolio Management (Landscapes of Value and Potential, Costs of Complexity, Targets for Rationalization,
Fellow Travelers) Due Diligence and Post Acquisition Transformation Generic Defense (In the endpoint everything is generic, or is it? , Why many originator companies are not
creating shareholder value?) Strategic Roadmaps Sales and Operations Planning (A choreography of required Business Conversations) Value Platform Discovery Extracting Value from Systems Purchasing optimization Supply chain review Measurement and change
Orbsen Consulting...making Sense of the World of business
www.orbsenconsulting.comCopyright © 2016 Orbsen Knowledge Service Ltd, All rights reserved
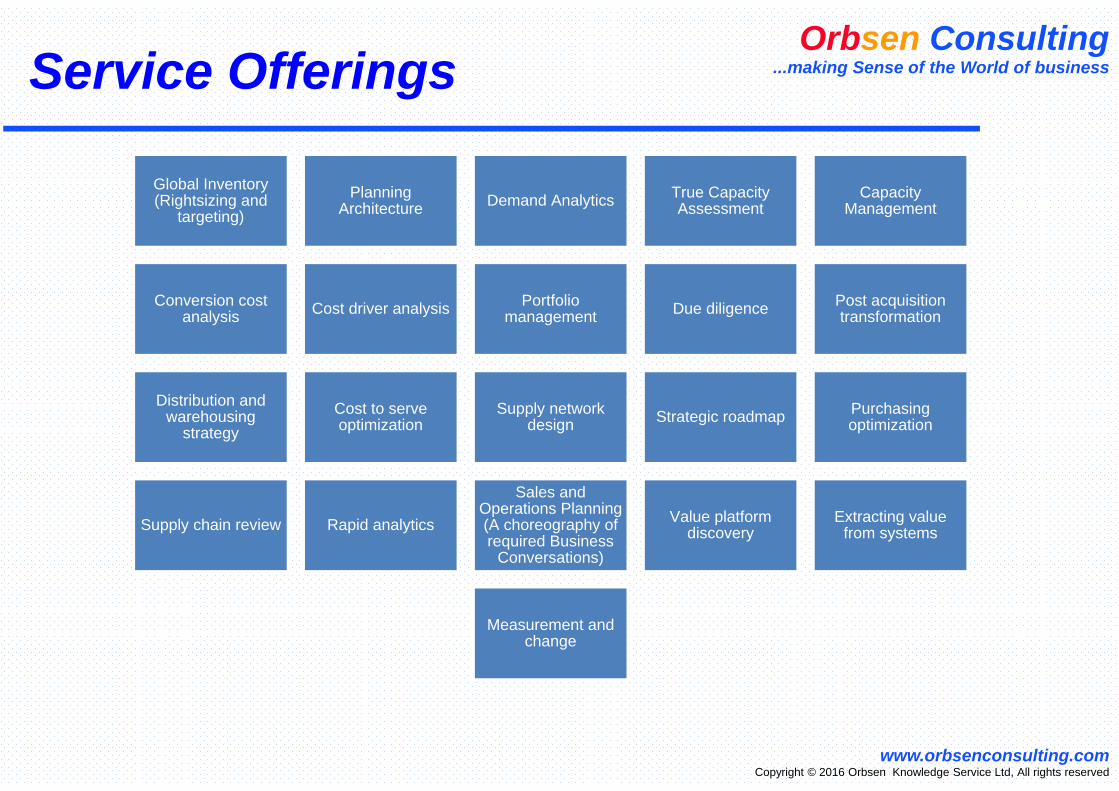
Service Offerings
Global Inventory (Rightsizing and
targeting)Planning
Architecture Demand Analytics True Capacity Assessment
Capacity Management
Conversion cost analysis Cost driver analysis Portfolio
management Due diligence Post acquisition transformation
Distribution and warehousing
strategyCost to serve optimization
Supply network design Strategic roadmap Purchasing
optimization
Supply chain review Rapid analytics
Sales and Operations Planning (A choreography of required Business
Conversations)
Value platform discovery
Extracting value from systems
Measurement and change