the world biotech market 2005 - investorideas.com of world biotech market, 2005 ... pharma 2.3.1...
TRANSCRIPT

The World Biotech Market 2005
A visiongain report
© NOTICEThis material is copyright 2005 by visiongain. It is against the law to reproduce any of this material without the prior written agreement of visiongain. You cannot photocopy, fax, download to database or duplicate in any other way any of the material contained in this report. Each purchase and single copy is for personal use only.
wvisiongain™

Chapter 1: ExecutiveSummary of WorldBiotech Market, 2005
1.1 Abstract of Biotech, 2005
1.2 Aims, Scope and Format of Biotech, 2005
2.1 What is Biotechnology?
2.2 The Uniqueness of Biopharmaceuticals: Turning
Medicine Around
2.3 Biotechnologies Used and Their Applications to
Pharma
2.3.1 Bioprocessing Technology
2.3.2 Monoclonal Antibodies
2.3.3 Recombinant DNA Technology
2.3.4 Cloning
2.3.4.1 Molecular Cloning
2.3.4.2 Cellular Cloning
2.3.4.3 Animal Cloning
2.3.4.4 Protein Engineering
2.4 The Future Biopharmaceutical Market
2.4.1 Biopharmaceutical 2004 Market Capatilisation Worth
$311bn
2.4.2 Over 7000 Biotechnology Patents Granted Per Annum
Since 1998
2.4.3 2004 Witnessed 54 New Biopharmaceuticals Approved
by the FDA
2.4.4 Biopharmaceuticals Share 12.5% of 2004 Global
Prescriptions
2
Contents
Chapter 2: Introductionto Biotechnology
3.1 Biopharmaceuticals Are Versatile Agents
3.2 Orphan Diseases Are A Major Target of Biotech: 3 Out
of 10 2004 Orphan Disease Drug Approvals Were
Biopharmaceuticals
3.3 Overview of Major and Orphan Diseases Treated By
Biopharmaceuticals, 2005
4.1 Monoclonal Antibodies: Leading Class of
Biopharmaceuticals in 2004 With Sales of $13bn
4.2 Biopharmceuticals by Therapy Class: Blood Disorders
Share Over A Quarter of the 2004
Biopharmaceuticals Market
4.3 2004 Biopharmaceuticals Market Worth a Staggering
$55.7bn
4.4 The Top 20 Selling Biopharma Drugs of 2004
Accounted For 62% of Total Revenues
4.5 The Top 3 Biopharmaceuticals Products of 2004 Sold
Over $9bn
4.5.1 Procrit/Eprex - The Number One Biopharmaceutical
Struggles at the Top
4.5.2 Risperdal Performs Well Thanks to New Delivery
Technology
4.5.3 Epogen: The Third Best Selling BiopharmDrug of
2004
4.6 Santura: The Highest Earning Newcomer of 2004
3
Contents
Chapter 3: DiseasesTreated byBiopharmaceuticals
Chapter 4: OverviewofBiopharmaceuticalsMarket, 2003-2004

Chapter 5: CompanyRevenues and MarketShare, 2004
5.1 Amgen: The Reign Continues With A 17% Share of
2004 Market
5.1.1 Who Are Amgen?
5.2 Biotech Company Winners and Losers in 2004:
Abbott, Sanofi-Aventis and Roche
5.3 BMS: The Best Company Newcomer of 2004
5.4 Biotech Companies Show High Growth Rates
6.1 Technology Driving Biopharma Pipeline
6.2 Biotech Targeting Chronic Illness
6.3 Arthritis Biopharmaceutical Pipeline, 2005
6.4 MS Biopharmaceutical Pipeline, 2005
6.5 Late-Stage Biopharmaceutical Oncology Pipeline,
2005
6.6 Late StageBiopharmaceutical Vaccine Pipeline, 2005
6.7 Blood Disorders Biopharmaceutical Pipeline, 2005
6.8 Late Stage Biopharmaceutical Endocrine Pipeline,
2005
6.9 Anti-Infectives Biopharmaceutical Pipeline, 2005
6.10 Enzyme Deficency Biopharmaceutical Pipeline, 2005
6.11 Late Stage Biopharmaceutical Opthalmic Pipeline,
2005
6.12 Late Stage Biopharmaceutical ‘Other’ Pipeline, 2005
4
Contents
Chapter 6:BiopharmaceuticalPipeline

7.1 Blood Disorders
7.2 Endocrine Disorders
7.3 Multiple Sclerosis
7.4 Oncology
7.5 Anti Infectives
7.6 Enzyme Deficiency Disorders
7.7 Vaccines
7.8 Arthritis
7.9 Opthalmics
7.10 Others
7.11 Biopharmaceutical Market Set To Almost Triple By
2010
8.1 Aransep: The Top Selling Biopharmaceutical of 2010
With Sales of $5.2bn
8.2 Blood Disorders Will Reamain Market Leaders
8.3 Ophthalmic Biopharmaceuticals: The Fastest Growing
Therapeutic Class 2003-2010
8.4 By 2010 Biopharmaceuticals Will Account for Over
17% of All Drug Prescriptions
5
Contents
Chapter 7:BiopharmaceuticalMarket Forecast byTherapeutic Area,2003-2010
Chapter 8: Summaryof 2010BiopharmaceuticalsMarket

9.1 What are Biogenerics?
9.2 The Biogeneric Threat Looms Large
9.3 All Change in 2003: CDER to CBER
9.4 How are Approval Pathways Limiting the
Development of Biogenerics?
9.5 Omnitrope Approved in Australia, Will Europe and the
US Follow?
9.6 High Cost of Market Entry
9.7 Manufacturing Capacity Problems
9.8 Biopharma Vs Biogenerics: The Fight Continues
9.8.1 Bioequivalence or Biosimilarity?
9.9 Will the Benefits of Biogenerics be as Great as
Anticipated?
9.10 How Imminent is the Threat from Biogeneric
Competition?
10.1 $13bn of Biopharmaceuticals To Lose Patency
Protection By 2007
10.2 Eleven Biopharmaceuticals to Face Patent Expiry by
2007
10.3 High-Revenue Generating Biopharmaceuticals Face
Patent Expiry Before 2007
10.4 High-Profile Biopharmaceuticals With Patent
Expirations Before 2007 Revenue Forecast, 2003-
2010
10.5 Erythropoiteins Are Most At Risk To Biogeneric
Competition
6
Contents
Chapter 9: Introductionto Biogenerics
Chapter 10: ThePotential BiogenericMarket

Chapter 11:BiopharmaceuticalMarket Challenges
11.1 BioTech's Delivery Challenge
11.1.1 Pulmonary Delivery: An Innovative Alternative to the
Needle?
11.1.2 The Major Issues of the Pulmonary Pathway
11.1.3 Does Protein Formulation Affect Pulmonary Delivery?
11.1.4 Does Pulmonary Drug Delivery Have a Future?
11.1.5 Pegylated Forms Set to Revolutionise Delivery
11.1.6 Pegylation Can Extend Patencies! The Filgrastim
Example
11.1.7 Transdermal Technologies
11.1.8 Microneedles for Transdermal Delivery of Vaccines
11.1.9 Nasal Delivery Is Demonstrating Promise
11.1.10 Moving Towards Pills? Altus' Unique Technology
11.1.11 New Delivery Technologies: A Pharmacy or Medical
Benefit?
11.1.12 Innovative Insulin Delivery Technology: The Race is
On!
11.1.13 Numerous Potential Blockbusting NonInjected
Insulins Set to Arrive 2005-2009
11.2 Manufacturing Capacity Shortfall
11.2.1 Why is There a Shortfall in Manufacturing Capacity
for Biopharmaceuticals?
11.2.2 Make Vs. Buy: The 1980s BioIndustry
11.2.3 CMO Manufacturing Capacity was Adequate for the
Supply of Clinical Materials Only
11.2.4 Late-Stage Products have absorbed CMO Clinical
Manufacturing Capacity
11.2.5 How is the Manufacturing Capacity Shortfall Being
Overcome?
7
Contents

11.2.6 Does The Future for Biopharmaceuitcal Manufacturing
Lie with Transgenics?
11.3 The Cost of Biopharmaceuticals
11.3.1 The Top Five Biopharmaceuticals Each Cost at Least
$10K Per Patient Per Annum
11.3.2 Monoclonal Antibodies and CSF's High Costs Reflect
Production Difficulties
11.3.3 Yeast-Based Systems May Bring Down the Cost of
Therapeutic Proteins in the Future
11.4 Acquiring Capital
11.4.1 Financing of Biotech Companies in 2003 Neared
$17bn
11.5 Reliance Upon University/Company Collaborations
11.5.1 The Need For Collaboration
11.5.2 Biotech's Increasing Role of Commercialising
University Research
11.5.3 Future Biotech Innovation Lies With Academia
11.5.4 The Risky Path from Bench to Market
11.5.5 Collaboration Strategies & Becoming the Partner of
Choice
11.5.5.1 Objectives That Support Strategic Goals
11.5.5.2 Understanding the Value Brought to an Alliance
11.5.5.3 Identifying and Understanding Potential Partners
11.5.5.4 Due Diligence
11.5.5.5 Promoting Capabilities to Potential Partners
11.5.5.6 Maintaining a Relationship Through Structured
Interactions
11.5.5.7 Gaining Competitive Advantage
11.5.5.8 Collaboration Management: Developing and
Maintain A Deal
11.5.5.9 Strategic Goals to Consider
11.6 Regulatory Issues
11.6.1 Biopharmaceuticals and the FDA
11.6.2 FDA Improving Upon Biologics Approval Wait
8
Contents

11.7 Biogeneric Threat
11.8 Dependence upon Venture Capital Investment
11.9: Drivers and Restraints of Biopharmaceutical Market
Growth
11.9.1 Drivers
11.9.2 Restraints
12.1 What is Venture Capital Investment?
12.2 What does VC Offer?
12.3 What Do Venture Capitalists Do?
12.4 Who Are Venture Capitalists?
12.4.1 Banks as Venture Capitalists
12.4.2 Business Angels (Wealthy Individuals) as Venture
Capitalists
12.4.3 Corporate or Direct Investors as Venture Capitalists
12.4.4 Government Grants and Governments as Venture
Capitalists
12.4.5 Venture Capital Firms
12.4.6 Other Types of Venture Capitalists
12.5 Why Do Biotech Companies Need VC Funding?
12.6 Venture Capital Investment in the US Biotech
Market
12.6.1 US VC Investment Now Recovering Following
Stockmarket Crash in 2000
12.6.2 329 US Biotech VC Investments Made in 2004,
Providing Over $3.8bn
12.6.3 Synta Provides 2004's Largest US Investment Sum
With $80m
12.6.4 MPM Capital 2004's Most Active US Biotech VC Firm
12.6.5 Company Expansion Stage is the Most Favourable for
VC Investment
12.7 Increase in VC Funding of European Biotech
9
Contents
Chapter 12: VentureCapital Investment &Biotech

12.8 PE European Investments in Biotech Followed
Similar Trends as in the US
12.9 European PE Biotech Investments are a Small part
of the Funding Market
13.1 The World Biopharmaceutical Market is Dominated
by the US
13.2 Both the Japanese and European Biotech World
Market Share Set to Fall by 2010
13.3 The US Biotech Market Will Retain Its World
Dominance
13.4 The European Biotech Market Will See Reduced
Growth
13.5 European Biotech Industry Faces VC Funding Drop
13.6 Price Cuts in Japanese Biotech Market
13.7 Asia-Pacific Region: A Dormant Giant?
13.8 Biotech Industries in the Asia-Pacific Region are
Growing Rapidly
13.9 China has the Most Biotech Companies in the Asia-
Pacific region
13.10 Other World Markets
13.10.1 Russia Will See Growth in Biopharma Generics
13.10.2 Israel is and Area of Biotech Industry More than
a Market for Biotech Drugs
14.1 Applications and Future Developments of the HGP
15.1 Conclusion
10
Contents
Chapter 15:Conclusion: Big PharmaMust Invest into theBiotech Arena
Chapter 14: The HumanGenome Project and ItsInfluence on theBiotech Industry
Chapter 13: The GlobalBiopharmaceuticalMarket by Region,2003-2010

Table 2.1 Definitions of Selected Biopharmaceuticals
Table 2.2 Summary of Biotechnologies
Table 3.1: Overview to Major Diseases and Selected Orphan Diseases
Treated by Biopharmaceuticals, 2005
Table 4.6: Revenue ($m) for Classes of Technology Biopharmaceuticals,
2004
Table 4.1 Biopharmaceutical Revenues ($m) by Technology Class, 2004
Table 4.2: Vaccine Products in 2004 Market
Table 4.3 Monoclonal Antibody Products % Growth Rates, 2004
Table 4.4 Biopharmaceuticals Revenue ($m) by Therapeutic Area, 2004
Table 4.5: Blood Modifiers by Revenue ($m), 2004
Table 4.6: Biopharmaceutical Revenues ($m) in 2003 Top 400 by Drug
Type, 2004
Table 4.7 Total Biopharmaceutical Revenues 2003 & 2004
Table 4.8: Top 20 Selling Biopharmaceuticals, 2004
Table 4.9: Revenues of Newcomers to 2004 Biopharmaceuticals Market
Table 5.1: Biotech Company Revenues ($m), 2003 & 2004, and
2004 Company Market Share (%)
Table 5.2: Roche Biopharmaceutical Portfolio By Revenue ($m), 2003 and
2004
Table 5.3: GSK Biopharmaceutical Portfolio By Revenue ($m), 2003 and
2004
Table 5.4: Schering Plough Biopharmaceutical Portfolio By Revenue ($m),
2003 and 2004
Table 5.5: Amgen's Product Portfolio By Revenue ($m), 2004
Table 5.6: Amgen Total Revenue ($bn), 2001-2004
Table 6.1: Overview of Biotech Pipeline By Biotechnology Type, 2005
Table 6.2: Arthritis Biopharmaceutical Pipeline, 2005
Table 6.3: MS Biopharmaceutical Pipeline, 2005
Table 6.4: Late Stage Biopharmaceutical Oncology Pipeline
Table 6.5: Late Stage Biopharmaceutical Vaccine Pipeline, 2005
Table 6.6: Blood Disorders Biopharmaceuticals Pipeline, 2005
Table 6.7: Late-Stage Biopharmaceutical Endocrine Pipeline, 2005
Table 6.8: Anti-Infective Biopharmaceutical Pipeline, 2005
List of Tables
11
Contents

Table 6.9: Enzyme Deficency Disorder Biopharmaceutical Pipeline, 2005
Table 6.10: Late-Stage Biopharmaceutical Opthalmic Pipeline, 2005
Table 6.11: Late-Stage Biopharmaceutical Others Pipeline, 2005
Table 7.1: Treatment of Blood Disorder by Biopharmaceutical by Revenue
($m), 2003 and 2004
Table 7.2: Total World Biopharmaceutical Blood Disorder Market Forecast
($m), 2003-2010
Table 7.3 Endocrine Biopharmaceutical by Revenue ($m), 2003 and 2004
Table 7.4: Total World Biopharmaceutical Endocrine Market Forecast ($m),
2003-2010
Table 7.5: Multiple Sclerosis Biopharmaceutical by Revenue ($m), 2003
and 2004
Table 7.6: Total World Biopharmaceutical Multiple Sclerosis Market
Forecast ($m),2003-2010
Table 7.7: Oncology Biopharmaceutical by Revenue ($m), 2003 and 2004
Table 7.8: Total World Biopharmaceutical Oncology Market Forecast ($m),
2003-2010
Table 7.9: Anti-Infective Biopharmaceutical by Revenue ($m), 2003 and
2004
Table 7.10: Total World Biopharmaceutical Anti-Infectives Market Forecast
($m), 2003-2010
Table 7.11: Enzyme Replacement Biopharmaceutical by Revenue ($m),
2003 and 2004
Table 7.12: Total World Biopharmaceutical Enzyme Replacement Market
Forecast ($m), 2003-2010
Table 7.13: Vaccine Biopharmaceutical by Revenue ($m), 2003 and 2004
Table 7.14: Total World Biopharmaceutical Vaccine Market Forecast ($m),
2003-2010
Table 7.15: Arthritis Biopharmaceutical by Revenue ($m), 2003 and 2004
Table 7.16: Total World Biopharmaceutical Arthritis Market Forecast ($m),
2003-2010
Table 7.17: Ophthalmic Biopharmaceutical by Revenue ($m), 2003 and
2004
Table 7.18: Total World Biopharmaceutical Ophthalmic Market Forecast
($m), 2003-2010
12
Contents

Table 7.19: Other Biopharmaceutical by Revenue ($m), 2003 and 2004
Table 7.20: Total World Biopharmaceutical Other Market Forecast ($m),
2003-2010
Table 7.21: Total Global Biopharmaceutical Market Revenue ($bn) Forecast
2003-2010
Table 8.1: Top 10 Selling Biopharmaceuticals of 2010
Table 8.2: Total Global Biopharmaceutical Market Revenue ($bn) Forecast
by Therapeutic Class, 2003-2010
Table 8.3: Market Share of Biopharmaceuticals By Therapeutic Class, 2003
& 2010 Comparison
Table 8.4: Biopharmaceuticals CAGR% By Therapeutic Class, 2003-2010
Table 8.5: Revenues ($bn) of Total Prescriptions By Technology Type 1999-
2010
Table 9.1 Biopharmaceuticals Facing Patent Expiry and their Biogeneric
Status, 2005
Table 9.2: Key Supporters For Biogenerics And Their Opinions
Table 9.3: Key Opponents Arguments Against Biogenerics
Table 10.1: Biopharmaceuticals Facing Patency Expiry by 2007
Table 10.2 Revenue ($m) Forecast (2003-2010) of 6 High Profile
Biopharmaceuticals Facing Patency Expiry Before 2007
Table 11.1 Mode of Administration of 2004's Top 5 Biopharmaceuticals
Table 11.2: Expected Blockbuster Noninjected Insulins From 2005
Table 11.3: Total European IPOs by Country, 2003
Table 12.1: US and European VC Investment ($m) Into Biotech Companies,
1997-2003
Table 12.2: Total US VC Investment ($bn), 1994-2004
Table 12.3: Biopharmaceutical Venture Capital Investments By Quarter,
2003 vs 2004
Table 12.4: Number of Biopharmaceutical Venture Capital Investments By
Quarter, 2003 vs 2004
Table 12.5: Top 5 Largest Biotech Investments ($m) by Company, 2004
Table 12.6: Most Active Biotech Venture Capital Firms of 2004
Table 12.7: US VC Investments by Company Stage, 2003-2004
Table 12.8: PE European Investments ($m) in Biotech, 1997-2003
13
Contents

World Biotech 2005Table 13.1: Total Global Biopharmaceutical Market Revenue Forecast ($bn),
2003-2010
Table 13.2: Global Market Share (%) and Revenue ($bn) by
Country/Region, 2003
Table 13.3: Global Market Share (%) and Revenue ($bn) by
Country/Region, 2010
Table 13.4: US Biotech Market Revenue ($bn) Forecast, 2003-2010
Table 13.5: EU Biotech Market Revenue ($bn) Forecast, 2003-2010
Table 13.6: Japanese Biotech Market Revenue ($bn) Forecast, 2003-2010
Table 13.7: Asia-Pacific Biotech Market Revenue ($bn) Forecast, 2003-
2010
Graph 2.1:Biopharmaceutical Market Capatilsation ($bn), 1994-2004
Graph 2.2: Total Number of Biotechnology Patents Granted: 1992-2002
Graph 2.3: Number of New Biological FDA Approvals: 1994-2004
Graph 2.4 Biopharmaceuticals Share of Global Prescriptions 1999-2004
Graph 4.1: Global Sales ($m) of Biopharmaceuticals by Technology Class,
2004
Graph 4.2: Global Sales ($m) of Biopharmaceuticals by Therapeutic Area,
2004
Graph 4.3: Total Global Biopharmaceutical Revenue, 2003-2004
Graph 4.4: Top 20 Selling Biopharmaceuticals, 2004
Graph 4.5: Global Procrit/Eprex Sales ($m), 2001-2004
Graph 4.6: Global Risperdal Sales ($m), 2001-2004
Graph 4.7: Global Epogen Sales ($m), 2001-2004
Graph 4.8: Revenues for Newcomers to the Global Biopharmaceutical
Market, 2004
Graph 5.1: Biotech Company Revenues ($m), 2003 & 2004
Graph 5.2: Company % Change in Revenue, 2003-2004
Graph 5.3: 2004 Company Newcomers to Biopharmaceuticals Market By
Revenue ($m)
Graph 5.4: Amgen Company Revenue ($bn), 2001-2004
Graph 5.5: Amgen Change in Revenue (%), 2002-2004
Graph 6.1: Biopharmaceutical Pipeline by Biotechnology Type, 2005
14
List of Graphs
Graph 6.2: Duration of Therapies of Biotech Pipeline Products in Late-
Stage Development, 2003
Graph 7.1: Total World Biopharmaceutical Blood Disorder Market Forecast
($bn), 2003-2010
Graph 7.2: Total World Biopharmaceutical Blood Disorder Market Revenue
Growth Forecast (%), 2004-2010
Graph 7.3: Total World Biopharmaceutical Endocrine Market Forecast
($bn), 2003-2010
Graph 7.4: Total World Biopharmaceutical Endocrine Market Revenue
Growth Forecast (%), 2004-2010
Graph 7.5: Total World Biopharmaceutical Multiple Sclerosis Market
Forecast ($bn), 2003-2010
Graph 7.6: Total World Biopharmaceutical Multiple Sclerosis Market
Revenue Growth Forecast (%), 2004-2010
Graph 7.7: Total World Biopharmaceutical Oncology Market Forecast ($bn),
2003-2010
Graph 7.8: Total World Biopharmaceutical Oncology Market Revenue
Growth Forecast (%), 2004-2010
Graph 7.9: Total World Biopharmaceutical Anti- Infectives Market Forecast
($bn), 2003-2010
Graph 7.10: Total World Biopharmaceutical Anti-Infectives Market Revenue
Growth Forecast (%), 2004-2010
Graph 7.11:Total World Biopharmaceutical Enzyme Replacement Market
Forecast ($bn), 2003-2010
Graph 7.12: Total World Biopharmaceutical Enzyme Replacement Market
Revenue Growth Forecast (%), 2004-2010
Graph 7.13: Total World Biopharmaceutical Vaccine Market Forecast ($bn),
2003-2010
Graph 7.14: Total World Biopharmaceutical Vaccine Market Revenue
Growth Forecast (%), 2004-2010
Graph 7.15: Total World Biopharmaceutical Arthritis Market Forecast ($bn),
2003-2010
Graph 7.16: Total World Biopharmaceutical Arthritis Market Revenue
Growth Forecast (%), 2004-2010
15
Contents
Graph 7.17: Total World Biopharmaceutical Ophthalmic Market Forecast
($bn), 2003-2010
Graph 7.18: Total World Biopharmaceutical Ophthalmic Market Revenue
Growth Forecast (%), 2004-2010
Graph 7.19: Total World Biopharmaceutical Other Market Forecast ($bn),
2003-2010
Graph 7.20: Total World Biopharmaceutical Other Market Revenue Growth
Forecast (%), 2004-2010
Graph 7.21: Total Global Biopharmaceutical Market Revenue Growth (%),
2004-2010
Graph 7.22: Total Global Biopharmaceutical Market Revenue ($bn)
Forecast 2003-2010
Graph 8.1: Top-10 Selling Biopharmaceuticals of 2010 ($m)
Graph 8.2: Total Global Biopharmaceutical Market Revenue ($bn)
Forecast by Therapeutic Class, 2003-2010
Graph 8.3: % Change of Market Share By Therapeutic Area, 2003 & 2010
Graph 8.4: Biopharmaceuticals CAGR% By Therapeutic Class, 2003-2010
Graph 8.5: Biopharmaceutical Revenue ($bn) of Total Prescriptions, 1999-
2010
Graph 10.1 Targets Of Biogeneric Companies By Drug Class
Graph 10.2: Total Revenue ($bn) of Six High Profile Biopharmaceuticals
Facing Patent Expiry By 2007, 2003-2010
Graph 10.3: Total Revenue Growth (%) of Six High Profile
Biopharmaceuticals Facing Patent Expiry By 2007, 2003-2010
Graph 11.1 Cost of Top Five Selling Biopharmaceuticals of 2004 ($ Per
Patient Per Year)
Graph 11.2: Total Financing of Biopharmaceuticals ($bn), 2000-2003
Graph 11.3: Number of Pharmaceutical Alliances Formed By Party, 1997-
2001
Graph 11.4: % of Alliances Formed With Licensing, By Party During 2001
Graph 11.5: % of Alliances Formed With Development/Co-Development, By
Party During 2001
Graph 11.6: % of Alliances Formed With Research, By Party During 2001
Graph 11.7: Mean FDA Approval Time For New Biopharmaceuticals, 2000-
2004
16
Contents

Graph 12.1: US and European VC Investment ($m) Into Biotech
Companies, 1997-2003
Graph 12.2: Total US VC Investment ($bn), 1994 - 2004
Graph 12.3: % Change From Previous Year of Total US VC Investment,
1995- 2004
Graph 12.4: Total Biotech VC Investments ($m) By Quarter, 2003-2004
Graph 12.5: % Change of Biotech VC Investments By Quarter, 2003-2004
Graph 12.6: Number of Biotech VC Investments By Quarter, 2003 -2004
Graph 12.7: % Change of Number of Biotech VC Investments By Quarter,
2003 -2004
Graph 12.8: PE European Investments ($m) in Biotech, 1997-2003
Graph 12.9: % Change of PE European Investments ($m) in Biotech, 1998-
2003
Graph 13.1: Change in Market Share (%) by Country/Region, 2003-2010
Graph 13.2: US Biotech Market Revenue ($bn) Forecast, 2003-2010
Graph 13.3: US Biotech Market Revenue Growth Forecast (%), 2003-2010
Graph 13.4: EU Biotech Market Revenue ($bn) Forecast, 2003-2010
Graph 13.5: EU Biotech Market Revenue Growth Forecast (%), 2003-2010
Graph 13.6: Japanese Biotech Market Revenue ($bn) Forecast, 2003-2010
Graph 13.7: Japanese Biotech Market Revenue Growth Forecast (%), 2003-
2010
Graph 13.8: Asia-Pacific Biotech Market Revenue ($bn) Forecast, 2003-
2010
Graph 13.9: Asia-Pacific Biotech Market Revenue Growth Forecast (%),
2003-2010
Chart 4.1: Biopharmaceutical Market Share (%) by Class, 2004
Chart 4.2: Biopharmaceutical Market Share (%) by Therapeutic Class, 2004
Chart 4.3 Top 20 Selling Biologics Share (%) of Total Biopharmaceuticals
Market
Chart 4.4: Global Market Share (%) for the Top 3 Selling Biologics, 2004
Chart 5.1: 2004 Market Share (%) By Company
17
Contents
List of Charts
Chart 6.1: Pipeline share (%) of Biopharmaceuticals Duration of Therapy ,
2003Chart 11.1: Biopharmaceutical Industry Financing By
Source, 2003
Chart 8.1: Market Share of the Top-10 Selling Biopharmaceuticals (%),
2010
Chart 8.2: Biopharmaceutical Therapeutic Class Market Share (%), 2003
Chart 8.3: Biopharmaceutical Therapeutic Class Market Share (%), 2010
Chart 10.1: Six High Profile Biopharmaceuticals Revenue Share (%) of Total
Biopharmaceuticals Facing Patency Expiry By 2007, 2004
Chart 12.1: US VC Investments in Biotech by Company Stage, 2004
Chart 13.1: Biopharmaceuticals Market Share (%) by Country/Region, 2003
Chart 13.2: Biopharmaceutical Market Share (%) by Country/Region, 2010
18
Contents

World Biotech 2005
19
Table A: List of Companies Mentioned
continued overleaf
3M Boston Millennia Partners Genrex Biotech
Abbott Laboratories Boston Scientific Genzyme
Abgenix Burrill & Company Gilead Sciences
Abraxis Cangene GlycoFi
Addex Pharmaceuticals Cell Genesys Goodwin Biotechnology
Alfacell Celltech GSK
AlgoRx Centocor Human Genome Sciences
Allergan Chiron ImClone Systems Inc
Alta Partners Chugai Indevus
Altus Connetics Corp Intarcia
Amarillo Corus Intercell
American Pharma Partners CoTherix ISTA
Amgen Covance JDS
Antisoma CTI Jerini
Ardana Daiichi Johnson & Johnson
Arpida Danek Lonza
AstraZeneca Dendreon Lundbeck
Aventis Domain Associates Mallinckrodt
Aventis DSM Maxgen
Basilea DynPort Vaccine Maxim
Bausch & Lomb Elan Corp MedImmune
Bayer Eli Lilly Medtronic
Biogen Idec Endo Pharmaceuticals Merck
Biomarin Enron Millennium Pharmaceuticals
Biomura Evotec MPM Capital
BioScience Contract Production Eximias NCI
BMS Eyetech Nobex Corp
Boehringer-Ingelheim. Fletcher Spaght Ventures Novartis
Bone Care Galderma Novo Nordisk
Borealis Ventures. Genentech NPS

World Biotech 2005
20
Table A: List of Companies Mentioned
source: visiongain, 2005
Odyssey Vicuron Pharma
OSI Village Ventures
Paion WorldCom
Peninsula Equity Partners Wyeth
Pfizer Xenova
Pharmion Corp YM Biosciences
Polaris Ventures
Prospect Venture Partners
Roche
Salix
Sandoz
Sanofi-Aventis
Santarus
Savient
Schering AG
Schering Plough
Schroder Ventures Life Sciences
Sepracor
Serono
Shire Pharmaceuticals
Sofamor
SouthWest Oncology
Synta
Techno Ventures Management
Telix
Transkaryotic
United Pharmaceuticals
Unither
Versant Ventures
Vertex
World Biotech 2005Chapter 1: Executive Summary of TheWorld Biotech Market, 2005
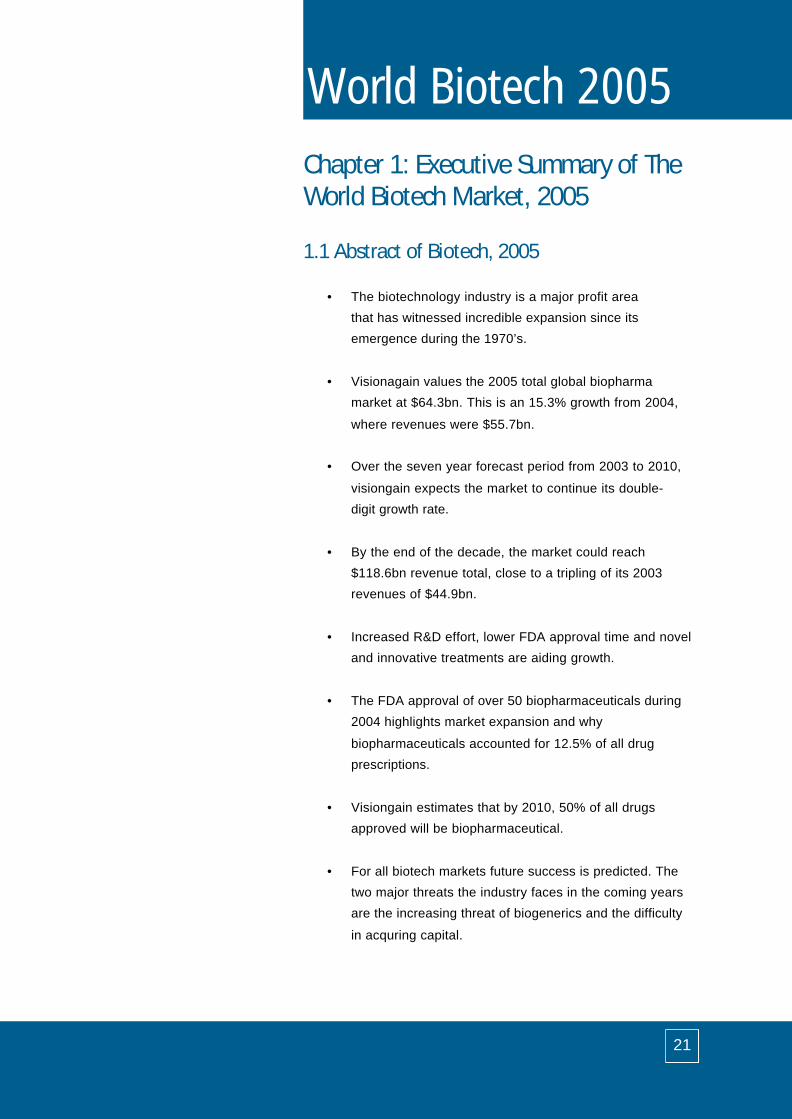
1.1 Abstract of Biotech, 2005
• The biotechnology industry is a major profit area
that has witnessed incredible expansion since its
emergence during the 1970’s.
• Visionagain values the 2005 total global biopharma
market at $64.3bn. This is an 15.3% growth from 2004,
where revenues were $55.7bn.
• Over the seven year forecast period from 2003 to 2010,
visiongain expects the market to continue its double-
digit growth rate.
• By the end of the decade, the market could reach
$118.6bn revenue total, close to a tripling of its 2003
revenues of $44.9bn.
• Increased R&D effort, lower FDA approval time and novel
and innovative treatments are aiding growth.
• The FDA approval of over 50 biopharmaceuticals during
2004 highlights market expansion and why
biopharmaceuticals accounted for 12.5% of all drug
prescriptions.
• Visiongain estimates that by 2010, 50% of all drugs
approved will be biopharmaceutical.
• For all biotech markets future success is predicted. The
two major threats the industry faces in the coming years
are the increasing threat of biogenerics and the difficulty
in acquring capital.
21

World Biotech 20051.2 Aims, Scope and Format of World Biotech,2005 This report begins by introducing biopharmaceuticals and the
technologies involved in their development and manufacture. The
market is also introduced, with a brief overview of its history.
Chapter 3 provides an overview of disease information that
biopharmaceuticals treat.
The report then goes on to value the 2003/2004 market for
biopharmaceuticals, including the leading brands, drug classes
and the comapanies dominating the market.
The report then examines pipelines for each therapeutic class of
biopharmaceuticals, and goes on to highlight the sales potential
for all leading products and key pipeline candidates from 2003 to
2010.
Forecasts for each biopharmaceutical therapeutic area is provided
in chapter 7, with in-depth analysis and forecasting by drug type.
A summary chapter of the 2010 market is then provided in
Chapter 8, illustrating the predicted leading brands and
therapeutic categories on the market by 2010.
The threat of biogenerics is examined and the potential value of
the biogeneric market is detailed in Chapter 10, with revenues for
the six major biologics under patent expiry threat.
This is followed by a detailed discussion regarding the challenges
the biopharma market will face in the coming years. Each
challenge is detailed with strategies that can be used by biotech
companies to overcome them. The major challenge of venture
captalism within bitoech is discussed in Chapter 12.
Chapter 13 details the global biopharmaceutical market from 2003
to 2010 by country/region. Market share in 2003 and 2010 is
compared for the US, EU, Japan and the Asia-Pacific region.
Forecast revenues are also provided for each of these
countries/regions.
22
World Biotech 2005The report then goes on to discuss the impact of the human
genome project on the biopharmaceutical market. World Biotech,
2005 ends with a concise conclusion, summarising the main
issues analysed within the report.
World Biotech, 2005 represents a key tool for companies wishing
to enter into or expand into the biopharma market. The reader will
be left with a clear idea of therapeutic targets currently under
development within the field, whom is responsible for this
development and the competition that companies will face from
current and future products.
23