the winds of change are blowing - regional …...the winds of change are blowing a provincial...
TRANSCRIPT

The Winds of Change are Blowing
A provincial perspective on the proposed, planned and approved Energy developments in the Eastern Cape
A Nelson Mandela Bay Business Chamber Renewable Energy Event
Donald McGillivray Pr. Eng. Pr CPM Wednesday 26 September 2012
The Business Chamber Renewable Energy Task Team Initiative

LTMS South Africa Emissions Intensity
South Africa’s emissions intensity (emissions per GPD) is high compared to most developed (OECD) countries and developing countries. SA’s emissions per capita are higher than China and India, which are also coal-based energy economies, and higher than Brazil
Source: Long Term Mitigation Scenarios Strategic Options for South Africa
South Africa – The Current Situation
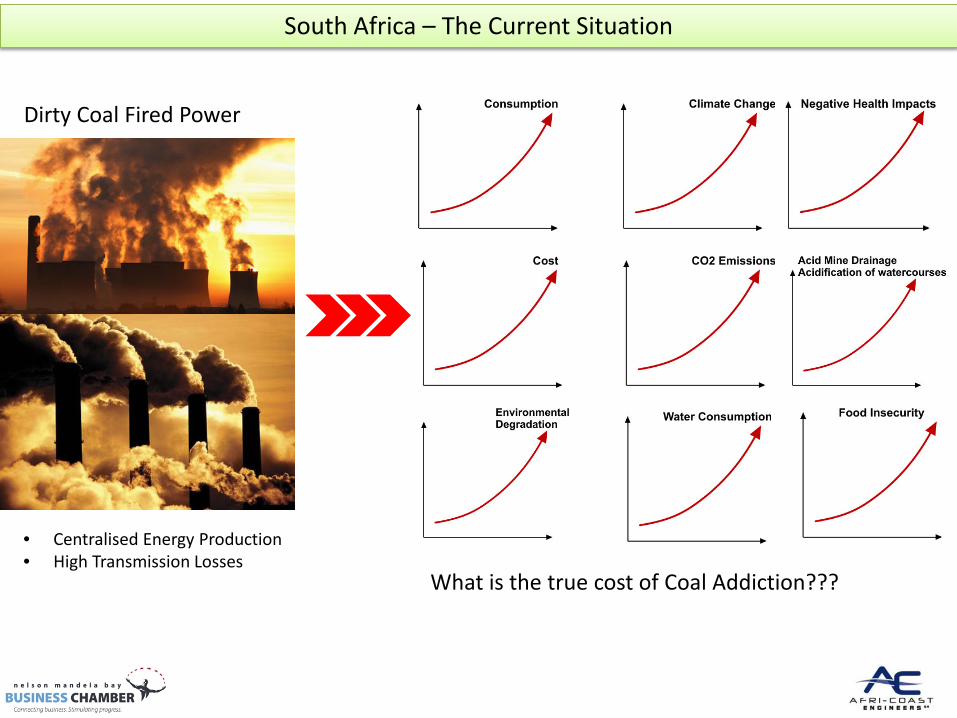
Dirty Coal Fired Power
• Centralised Energy Production • High Transmission Losses
What is the true cost of Coal Addiction???

South Africa – The Current Situation

South Africa – The Current Situation

South Africa – The Current Situation
Excluded: Environmental degradation Damage of roads and transportation infrastructure & Many other external costs
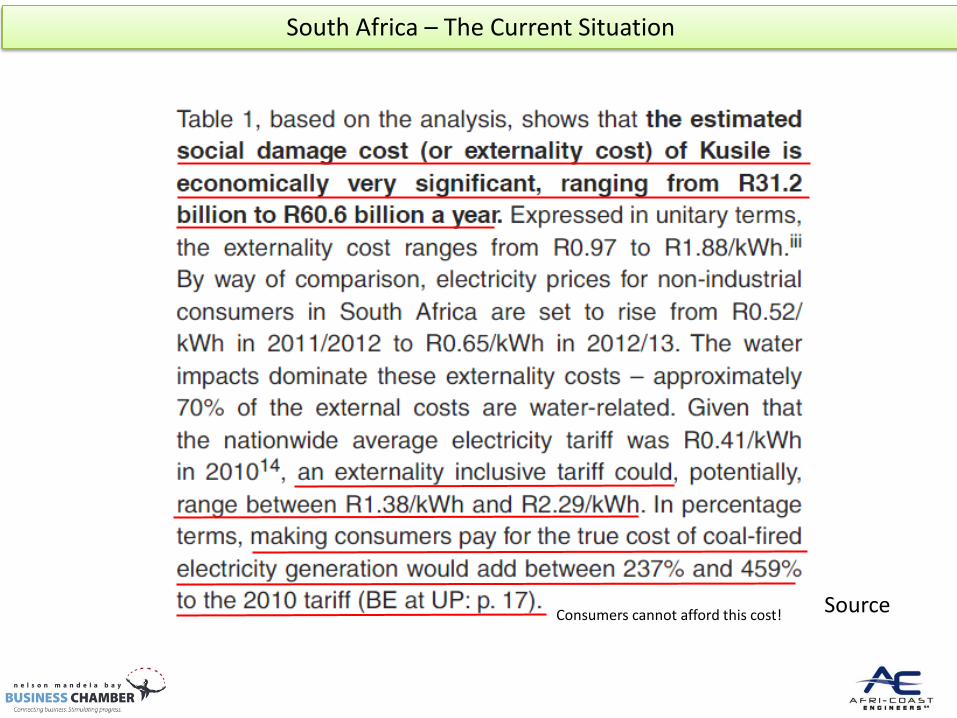
South Africa – The Current Situation
Source Consumers cannot afford this cost!

South Africa Energy Resource
South Africa has a good supply of coal Cheap dirty coal has formed the foundation for the economic growth of South Africa However we are now paying the escalating cost both internal and externally South Africa’s future coal reserves are also finite and the value should be optimised:
South Africa is richly endowed with abundant clean sustainable renewable energy resources both in the form of wind and solar energy
The BP Statistical Review of World Energy 20081 - South Africa's coal reserve has been reduced by nearly 18 Gt, from 48 Gt in the previous
annual review to 30 Gt in the 2008 edition - A question remains, however, about the completeness and rigour of the current re-
assessment. Rutledge9 recently provided an estimate of only 23 Gt for the full recoverable cumulative coal resource in the African continent (effectively South Africa, Botswana and Zimbabwe), of which about 8 Gt was already consumed by production to end-2007. The implication that the present remaining reserve of African coal is only about 15 Gt deserves closer scrutiny.

South Africa ESKOM New Build Programme
=> 66% Plant Capacity Factor

South Africa – The Construction Cost of Coal in SA - Medupi
Medupi plant capacity = 4 764 MW Full construction cost estimate = R130 bn Cost per MW = R27m/MW Plant capacity factor = 85% Marginal Cost per kWh = R0.91 Escalation = >> CPI (O&M) high escalation, increasing fuel cost
Wind DoE Rnd 2 Cost per MW = 15-18m / MW Plant capacity factor = 35% Cost per kWh = R0.89 Escalation = CPI (5.5%)
+ External cost = R1.38/kWh-R2.29/kWh
Source – Engineering News
Price uncertainty going into the future with high escalation!!
Price certainty going into the future with low escalation
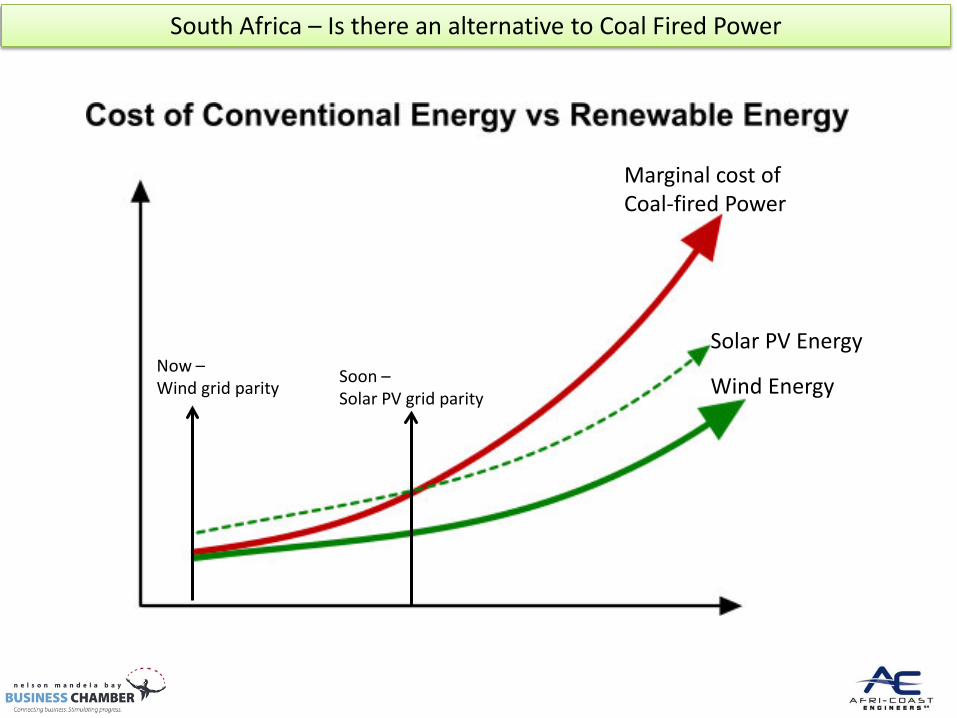
South Africa – Is there an alternative to Coal Fired Power
Marginal cost of Coal-fired Power
Wind Energy
Solar PV Energy Now – Wind grid parity
Soon – Solar PV grid parity

South Africa’s vast Renewable Energy Resource
South Africa is richly endowed with abundant clean sustainable renewable energy resources both in the form of wind and solar energy
Excellent wind resource 7m/s -> 9m/s
Excellent Solar PV resource

DoE REIPPPP
Source

DoE REIPPPP
• The procurement documents were released on the 03 of August 2011 and compulsory bidders conference for the first and second window on the 14 of September 2011.
• The document provides for procurement of 3725MW in five different rounds subject to the availability of the MW
• The Department. Under round one: – Received 53 Bids on the 4th of November – Announced 28 preferred bidders in December 2011
• With regards to round two:
– Received 79 bids on the 5th of March 2012 – These bids amount to 3255MW whilst the cap was 1275MW

DoE REIPPPP
•Requirements •Rules
RFP Part A
•Environment • Land •Economic Develop • Finance •Technical •Price •Capacity
RFP Part B Qualification
•Price • Job creation • Local content •Preferential
Procurement •Enterprise Development • Socio-economic
development
RFP Part C Comparative Evaluation
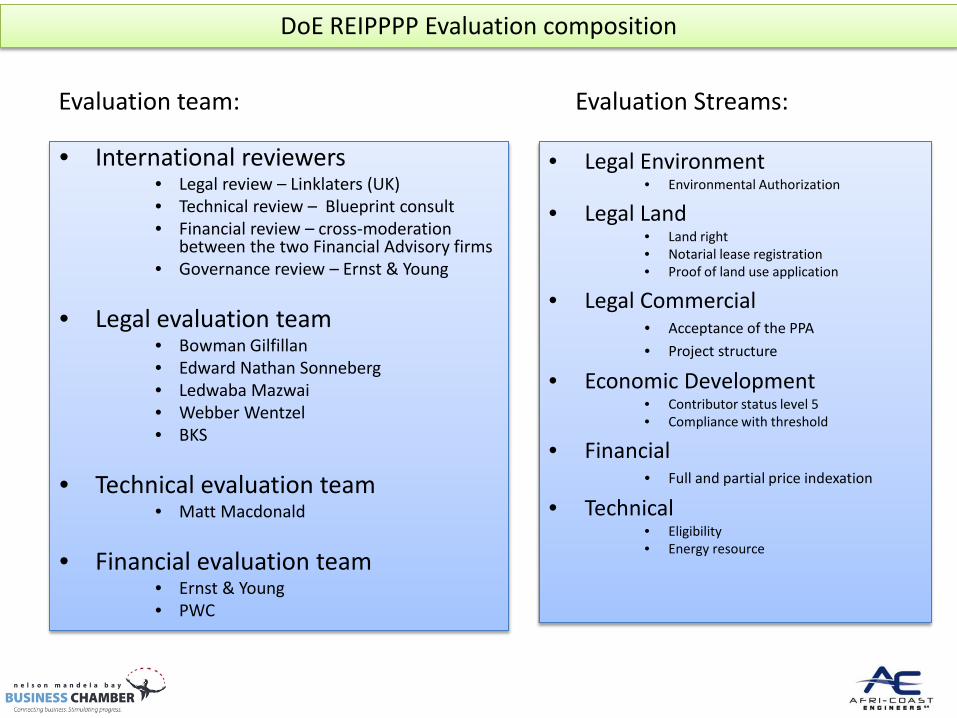
DoE REIPPPP Evaluation composition
Evaluation team:
• International reviewers • Legal review – Linklaters (UK) • Technical review – Blueprint consult • Financial review – cross-moderation
between the two Financial Advisory firms • Governance review – Ernst & Young
• Legal evaluation team • Bowman Gilfillan • Edward Nathan Sonneberg • Ledwaba Mazwai • Webber Wentzel • BKS
• Technical evaluation team • Matt Macdonald
• Financial evaluation team • Ernst & Young • PWC
Evaluation Streams:
• Legal Environment • Environmental Authorization
• Legal Land • Land right • Notarial lease registration • Proof of land use application
• Legal Commercial • Acceptance of the PPA • Project structure
• Economic Development • Contributor status level 5 • Compliance with threshold
• Financial • Full and partial price indexation
• Technical • Eligibility • Energy resource
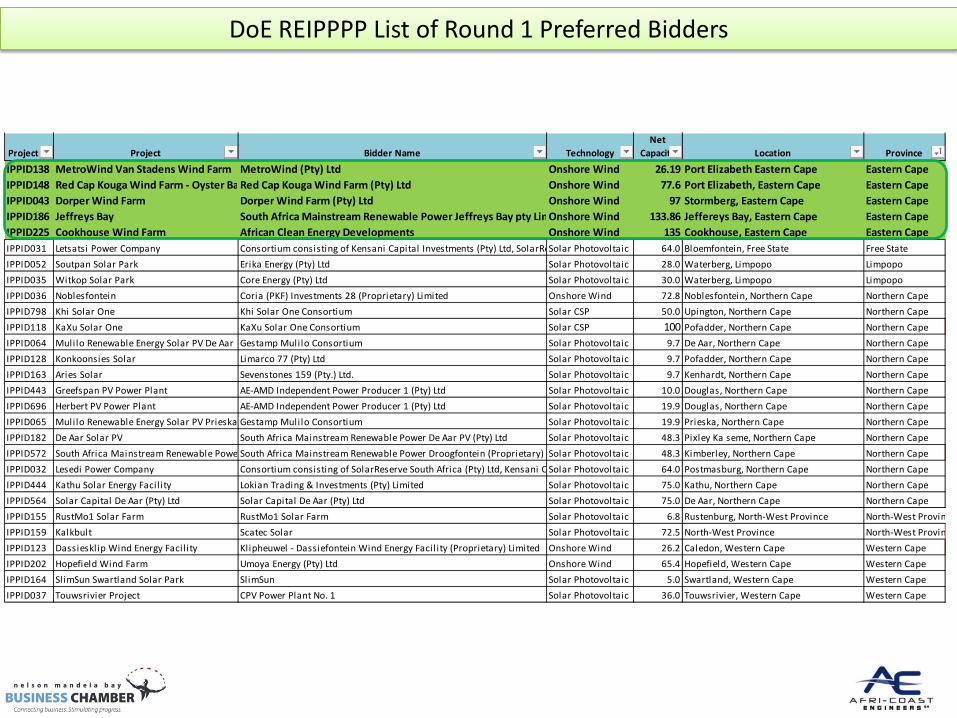
DoE REIPPPP List of Round 1 Preferred Bidders
Project ID Project Bidder Name TechnologyNet
Capacity Location Province
IPPID138 MetroWind Van Stadens Wind Farm MetroWind (Pty) Ltd Onshore Wind 26.19 Port Elizabeth Eastern Cape Eastern CapeIPPID148 Red Cap Kouga Wind Farm - Oyster BaRed Cap Kouga Wind Farm (Pty) Ltd Onshore Wind 77.6 Port Elizabeth, Eastern Cape Eastern CapeIPPID043 Dorper Wind Farm Dorper Wind Farm (Pty) Ltd Onshore Wind 97 Stormberg, Eastern Cape Eastern CapeIPPID186 Jeffreys Bay South Africa Mainstream Renewable Power Jeffreys Bay pty LimOnshore Wind 133.86 Jeffereys Bay, Eastern Cape Eastern CapeIPPID225 Cookhouse Wind Farm African Clean Energy Developments Onshore Wind 135 Cookhouse, Eastern Cape Eastern CapeIPPID031 Letsatsi Power Company Consortium consisting of Kensani Capital Investments (Pty) Ltd, SolarRe Solar Photovoltaic 64.0 Bloemfontein, Free State Free StateIPPID052 Soutpan Solar Park Erika Energy (Pty) Ltd Solar Photovoltaic 28.0 Waterberg, Limpopo LimpopoIPPID035 Witkop Solar Park Core Energy (Pty) Ltd Solar Photovoltaic 30.0 Waterberg, Limpopo LimpopoIPPID036 Noblesfontein Coria (PKF) Investments 28 (Proprietary) Limited Onshore Wind 72.8 Noblesfontein, Northern Cape Northern CapeIPPID798 Khi Solar One Khi Solar One Consortium Solar CSP 50.0 Upington, Northern Cape Northern CapeIPPID118 KaXu Solar One KaXu Solar One Consortium Solar CSP 100 Pofadder, Northern Cape Northern CapeIPPID064 Mulilo Renewable Energy Solar PV De Aar Gestamp Mulilo Consortium Solar Photovoltaic 9.7 De Aar, Northern Cape Northern CapeIPPID128 Konkoonsies Solar Limarco 77 (Pty) Ltd Solar Photovoltaic 9.7 Pofadder, Northern Cape Northern CapeIPPID163 Aries Solar Sevenstones 159 (Pty.) Ltd. Solar Photovoltaic 9.7 Kenhardt, Northern Cape Northern CapeIPPID443 Greefspan PV Power Plant AE-AMD Independent Power Producer 1 (Pty) Ltd Solar Photovoltaic 10.0 Douglas, Northern Cape Northern CapeIPPID696 Herbert PV Power Plant AE-AMD Independent Power Producer 1 (Pty) Ltd Solar Photovoltaic 19.9 Douglas, Northern Cape Northern CapeIPPID065 Mulilo Renewable Energy Solar PV Prieska Gestamp Mulilo Consortium Solar Photovoltaic 19.9 Prieska, Northern Cape Northern CapeIPPID182 De Aar Solar PV South Africa Mainstream Renewable Power De Aar PV (Pty) Ltd Solar Photovoltaic 48.3 Pixley Ka seme, Northern Cape Northern CapeIPPID572 South Africa Mainstream Renewable Powe South Africa Mainstream Renewable Power Droogfontein (Proprietary) Solar Photovoltaic 48.3 Kimberley, Northern Cape Northern CapeIPPID032 Lesedi Power Company Consortium consisting of SolarReserve South Africa (Pty) Ltd, Kensani C Solar Photovoltaic 64.0 Postmasburg, Northern Cape Northern CapeIPPID444 Kathu Solar Energy Facil ity Lokian Trading & Investments (Pty) Limited Solar Photovoltaic 75.0 Kathu, Northern Cape Northern CapeIPPID564 Solar Capital De Aar (Pty) Ltd Solar Capital De Aar (Pty) Ltd Solar Photovoltaic 75.0 De Aar, Northern Cape Northern CapeIPPID155 RustMo1 Solar Farm RustMo1 Solar Farm Solar Photovoltaic 6.8 Rustenburg, North-West Province North-West ProvinIPPID159 Kalkbult Scatec Solar Solar Photovoltaic 72.5 North-West Province North-West ProvinIPPID123 Dassiesklip Wind Energy Facil ity Klipheuwel - Dassiefontein Wind Energy Facil ity (Proprietary) Limited Onshore Wind 26.2 Caledon, Western Cape Western CapeIPPID202 Hopefield Wind Farm Umoya Energy (Pty) Ltd Onshore Wind 65.4 Hopefield, Western Cape Western CapeIPPID164 SlimSun Swartland Solar Park SlimSun Solar Photovoltaic 5.0 Swartland, Western Cape Western CapeIPPID037 Touwsrivier Project CPV Power Plant No. 1 Solar Photovoltaic 36.0 Touwsrivier, Western Cape Western Cape
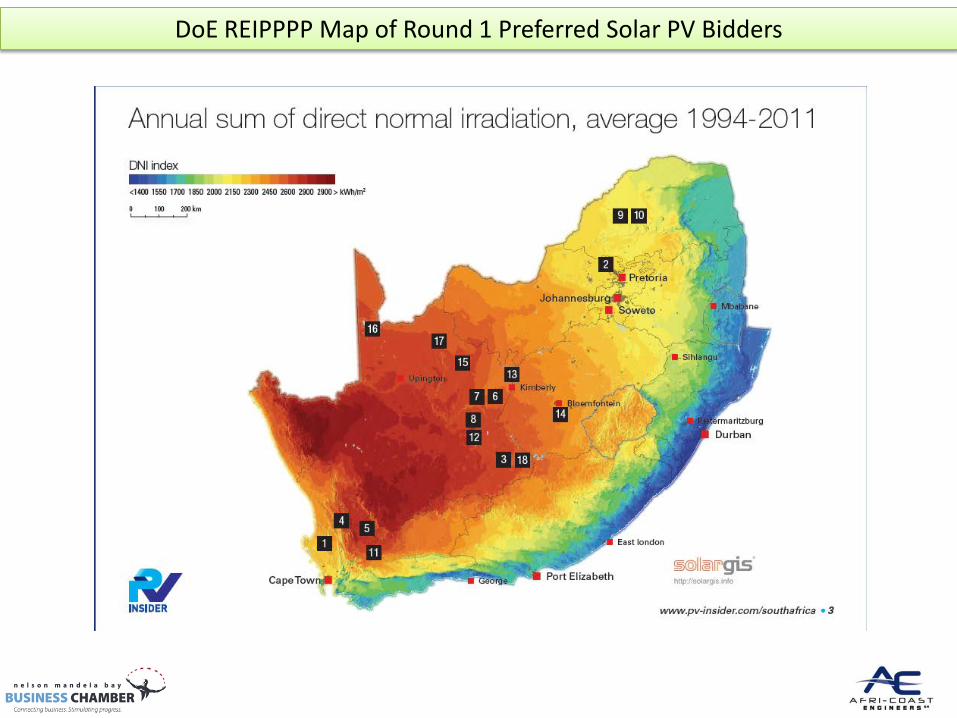
DoE REIPPPP Map of Round 1 Preferred Solar PV Bidders

DoE REIPPPP Map of Round 2 Preferred Bidders
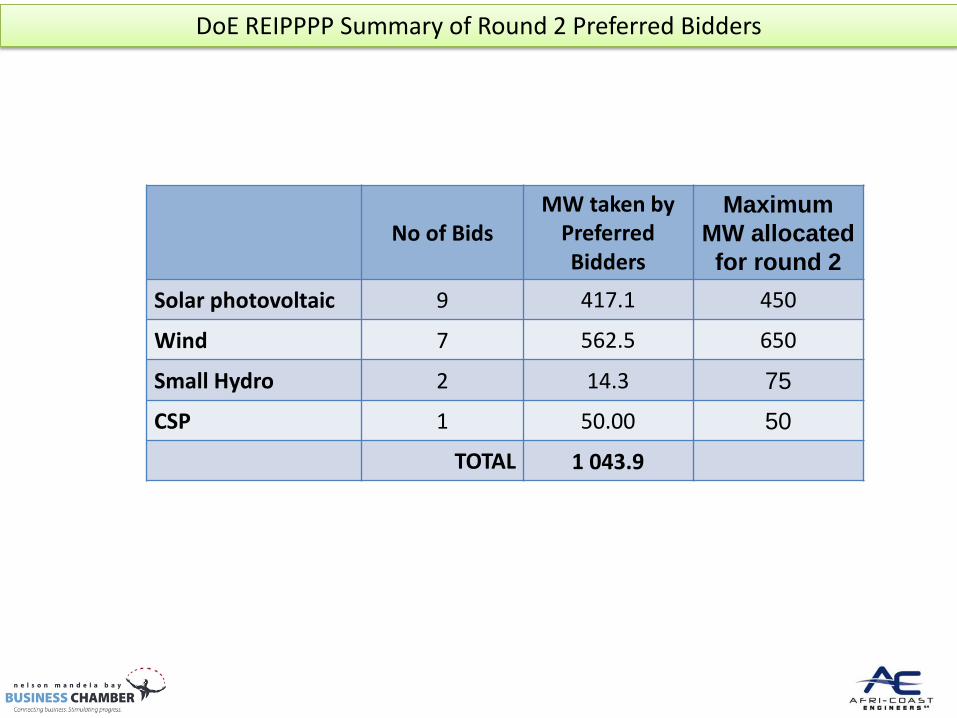
DoE REIPPPP Summary of Round 2 Preferred Bidders
No of Bids MW taken by
Preferred Bidders
Maximum MW allocated for round 2
Solar photovoltaic 9 417.1 450
Wind 7 562.5 650
Small Hydro 2 14.3 75 CSP 1 50.00 50
TOTAL 1 043.9
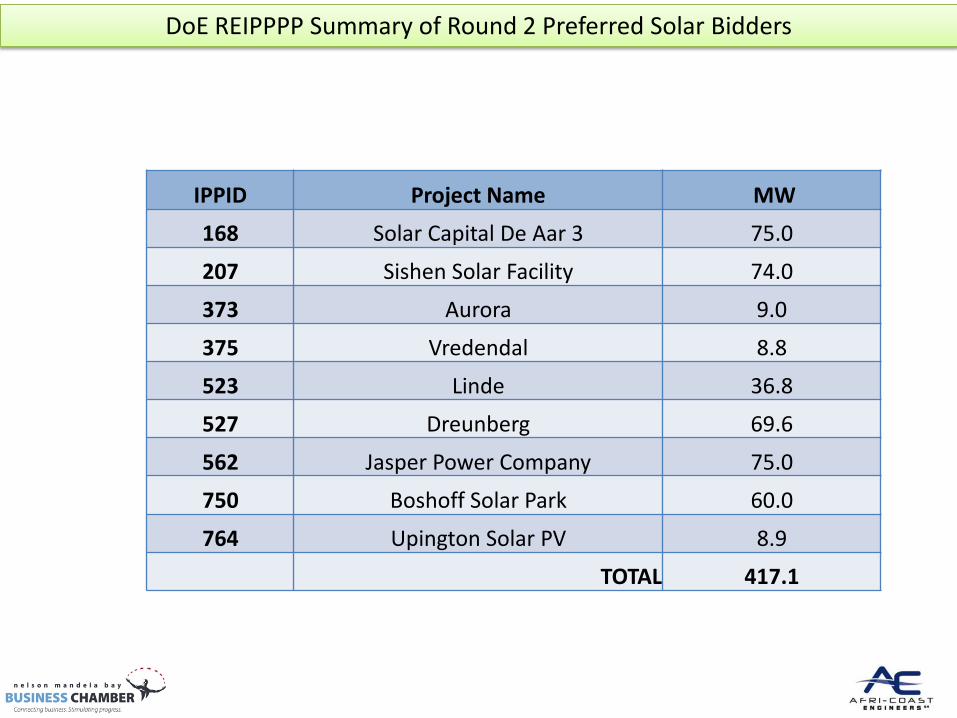
DoE REIPPPP Summary of Round 2 Preferred Solar Bidders
IPPID Project Name MW
168 Solar Capital De Aar 3 75.0
207 Sishen Solar Facility 74.0
373 Aurora 9.0
375 Vredendal 8.8
523 Linde 36.8
527 Dreunberg 69.6
562 Jasper Power Company 75.0
750 Boshoff Solar Park 60.0
764 Upington Solar PV 8.9
TOTAL 417.1
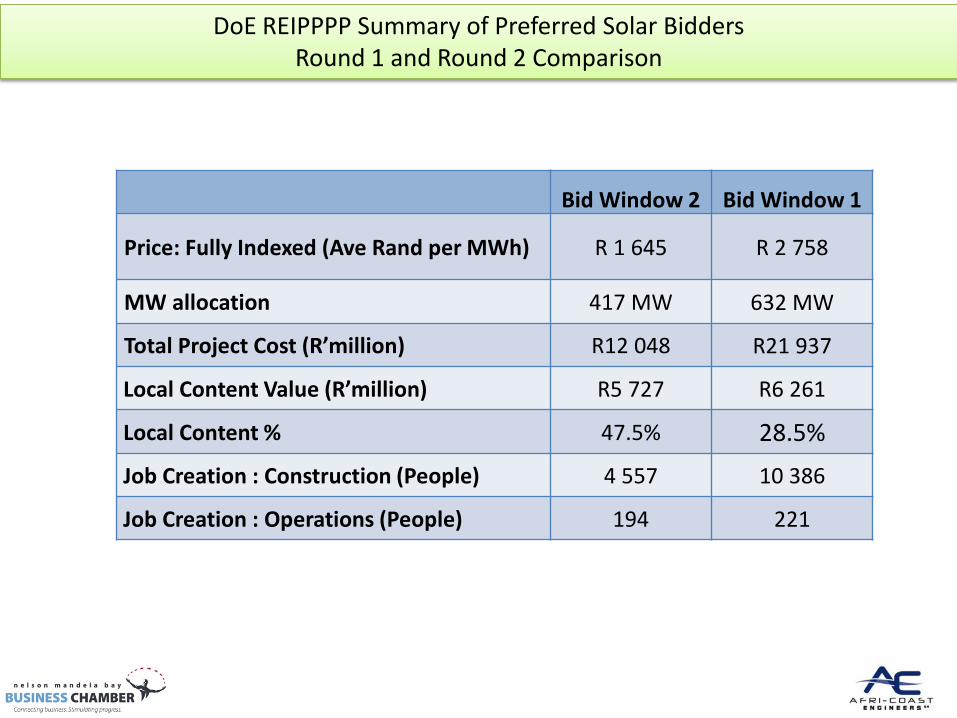
DoE REIPPPP Summary of Preferred Solar Bidders Round 1 and Round 2 Comparison
Bid Window 2 Bid Window 1
Price: Fully Indexed (Ave Rand per MWh) R 1 645 R 2 758
MW allocation 417 MW 632 MW
Total Project Cost (R’million) R12 048 R21 937
Local Content Value (R’million) R5 727 R6 261
Local Content % 47.5% 28.5%
Job Creation : Construction (People) 4 557 10 386
Job Creation : Operations (People) 194 221

DoE REIPPPP Summary of Round 2 Preferred Wind Bidders
IPPID Project Name MW 014 Gouda Wind Facility 135.2
240 Amakhala Emoyeni (Phase 1) Eastern Cape 137.9
303 Tsitsikamma Community Wind Farm 94.8 309 West Coast 1 90.8 362 Waainek 23.4 364 Grassridge 59.8 372 Chaba 20.6
TOTAL 562.5

DoE REIPPPP Summary of Preferred Wind Bidders Round 1 and Round 2 Comparison
Bid Window 2 Bid Window 1 Price: Fully Indexed (Ave Rand per MWh) R 897 R 1 143 MW allocation 563 MW 634 MW Total Project Cost (R’million) R 10 897 R 12 724
Local Content Value (R’million) R 4 001 R 2 766 Local Content % 36.7% 21.7% Job Creation : Construction (People) 1 579 1 869 Job Creation : Operations (People) 65 128

DoE REIPPPP Summary of Preferred CSP Bidders Round 1 and Round 2 Comparison
Bid Window 2 Bid Window 1 Price: Fully Indexed (Ave Rand per MWh) R 2 512 R 2 686 MW allocation 50 MW 150 MW Total Project Cost (R’million) R 4 483 R 11 365
Local Content Value (R’million) R 1 638 R 2 391 Local Content % 36.5% 21.0% Job Creation : Construction (People) 662 1 165 Job Creation : Operations (People) 50 70

DoE REIPPPP Summary of Jobs Round 2 Preferred Bidders Jobs per Province
Description Jobs during
construction period
Jobs during operations period
BW2 BW2 Eastern Cape Province 1 026 64 Free State Province 140 32 Limpopo Province 0 0 Northern Cape Province 4 709 151 North-West Province 0 0 Western Cape Province 1 184 81 TOTAL 7 059 328

DoE REIPPPP Summary of Round 2 Investment per Province
Description Total Project Cost (ZAR million)
Local content value (ZAR million)
Northern Cape 12 359 5 837 Eastern Cape 8 649 3 171 Western Cape 4 684 1 829 Free State 2 367 950 TOTAL 28 059 11 787

DoE REIPPPP Analysis of MW invested and remaining
Technology
MW allocation in accordance
with the Determination
MW capacity allocated in the
First Bid Submission
Phase
MW capacity allocated in the
Second Bid Submission
Phase
MW capacity for allocation in
future Bid Submission
Phases
Onshore wind 1 850.0 MW 634.0 MW 562.5 MW 653.5 MW
Solar photovoltaic 1 450.0 MW 631.5 MW 417.1 MW 401.1 MW
Concentrated solar power 200.0 MW 150.0 MW 50.0 MW 0.0 MW
Small hydro (≤ 10MW) 75.0 MW 0.0 MW 14.3 MW 60.7 MW
Landfill gas 25.0 MW 0.0 MW 0.0 MW 25.0 MW Biomass 12.5 MW 0.0 MW 0.0 MW 12.5 MW Biogas 12.5 MW 0.0 MW 0.0 MW 12.5 MW
Total 3 625.0 MW 1 415.5 MW 1 043.9 MW 1 165.6 MW

DOE REIPPPP Round 2 Wind
IPP Project Name Province MW
Fully Indexed
EAT
Partially Indexed
EAT
Fully Indexed
Price
Partially Indexed
Price Portion Indexed
Part C – Financial
Score Part C – ED Score
Part C – Total Score
014 Gouda Wind Facility Western Cape 135.2 1 383.5 1 245.7 817.0 1 111.0 31% 70.00 28.82 98.82
362 Waainek Eastern Cape 23.3 1 353.8 1 255.4 800.0 980.0 50% 69.45 24.64 94.09
372 Chaba Eastern Cape 20.6 1 484.7 1 395.5 878.0 1 090.0 50% 61.58 24.64 86.22
240
Amakhala Emoyeni (Phase 1) Eastern Cape
Eastern Cape 137.9 1 651.8 1 468.5 975.0 1 410.0 25% 57.48 26.54 84.02
303 Tsitsikamma Community Wind Farm
Eastern Cape 94.8 1 608.9 1 508.2 951.0 1 420.0 23% 55.24 28.22 83.46
364 Grassridge Eastern Cape 59.8 1 607.6 1 498.8 950.0 1 170.0 50% 55.78 24.71 80.49
309 West Coast 1 Western Cape 90.8 1 537.1 1 335.7 908.9 1 176.5 32% 64.94 14.86 79.80
562.4
= Eastern Cape Province

IPP Project Name Province MW Fully Indexed
EAT
Partially Indexed
EAT
Fully Indexed
Price
Partially Indexed
Price
Portion Indexed
Part C – Financial
Score
Part C - ED Score
Part C – Total Score
375 Vredendal Solar Park Western Cape 8.8 2 370.3 2 036.8 1401.3 1 897.2 20.0% 70.00 27.24 92.54
373 Aurora Solar Park Western Cape 9.0 2 523.4 2 147.9 1491.9 2 000.7 20.0% 66.18 26.55 88.72
764 Upington Solar PV Northern Cape 8.9 2 462.1 2 346.9 1530.0 2 012.0 48.0% 59.35 22.54 81.75
168 Solar Capital Aggenys Northern Cape 75.0 2 688.8 2 496.2 1590.0 2 290.0 22.2% 54.21 22.54 81.45
207 Sishen Solar Facility Northern Cape 74.0 2 746.7 2 486.8 1622.0 2 218.0 30.5% 54.53 19.55 81.08
750 Boshoff Solar Park Free State 60.0 3 251.3 2 648.6 1920.0 2 500.0 23.0% 48.97 19.51 75.51
562 Jasper Power Company Northern Cape 75.0 2 873.4 2 643.1 1698.0 2 146.0 44.0% 49.16 24.68 73.84
523 Linde Northern Cape 36.8 2 959.4 2 535.7 1771.0 2 379.0 19.0% 52.85 26.54 72.40
527 Dreunberg Eastern Cape 69.6 3 006.4 2 584.6 1779.0 2 444.0 18.0% 51.17 22.40 70.68
417.1
DOE REIPPPP Round 2 Solar PV
IPP Project Name Province
MW Fully Indexed
EAT
Partially Indexed
EAT
Fully Indexed Price
Partiall
y Indexed
Price Portion Indexed
Part C – Financial
Score Part C – ED Score
Part C – Total Score
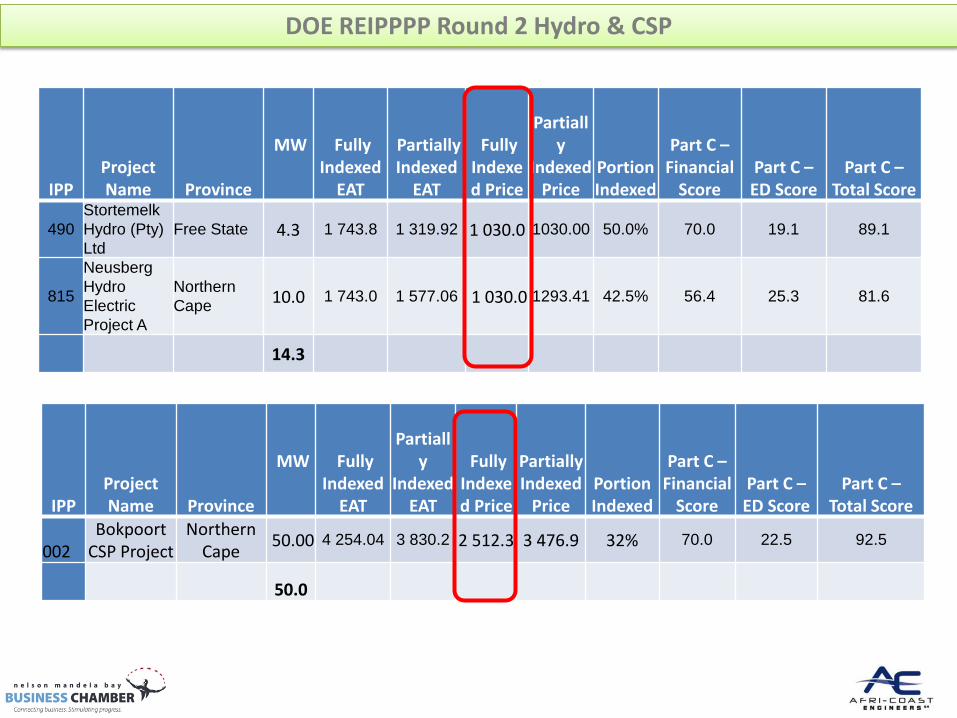
490 Stortemelk Hydro (Pty) Ltd
Free State 4.3 1 743.8 1 319.92 1 030.0 1030.00 50.0% 70.0 19.1 89.1
815
Neusberg Hydro Electric Project A
Northern Cape 10.0 1 743.0 1 577.06 1 030.0 1293.41 42.5% 56.4 25.3 81.6
14.3
IPP Project Name Province
MW Fully Indexed
EAT
Partiall
y Indexed
EAT
Fully Indexed Price
Partially Indexed
Price Portion Indexed
Part C – Financial
Score Part C – ED Score
Part C – Total Score
002 Bokpoort
CSP Project Northern
Cape 50.00 4 254.04 3 830.2 2 512.3 3 476.9 32% 70.0 22.5 92.5
50.0
DOE REIPPPP Round 2 Hydro & CSP

DoE Round 1 Mainstream Jeffreys Bay Wind Farm

The Future – The Sustainable High Road
• clean, renewable wind energy project • good for South Africa • good for the Nelson Mandela Bay Municipality (NMBM) & the Eastern
Cape Province • very good for the local community
Wind energy is the lowest cost, utility scale, commercially viable, clean sustainable renewable energy generation option available to South Africa

Coega Wind Turbine – a first for South Africa: Commissioned May 2010
WTG Components : Vestas V90 -1,8MW (95m) 4 x 4,2mø Tower Sections (each approx 24,4m long) Rotor Hub – 18 ton Nacelle (Generator) – 70 ton 3 x 44m long Rotor Blades (each 8 ton)
Source
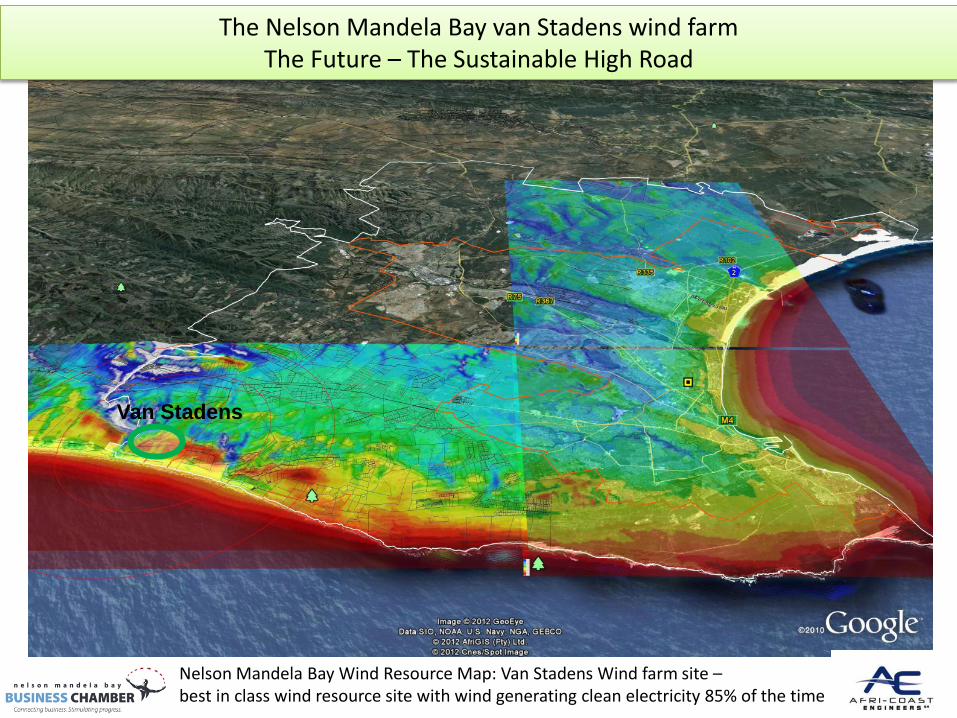
Van Stadens
The Nelson Mandela Bay van Stadens wind farm The Future – The Sustainable High Road
Nelson Mandela Bay Wind Resource Map: Van Stadens Wind farm site – best in class wind resource site with wind generating clean electricity 85% of the time
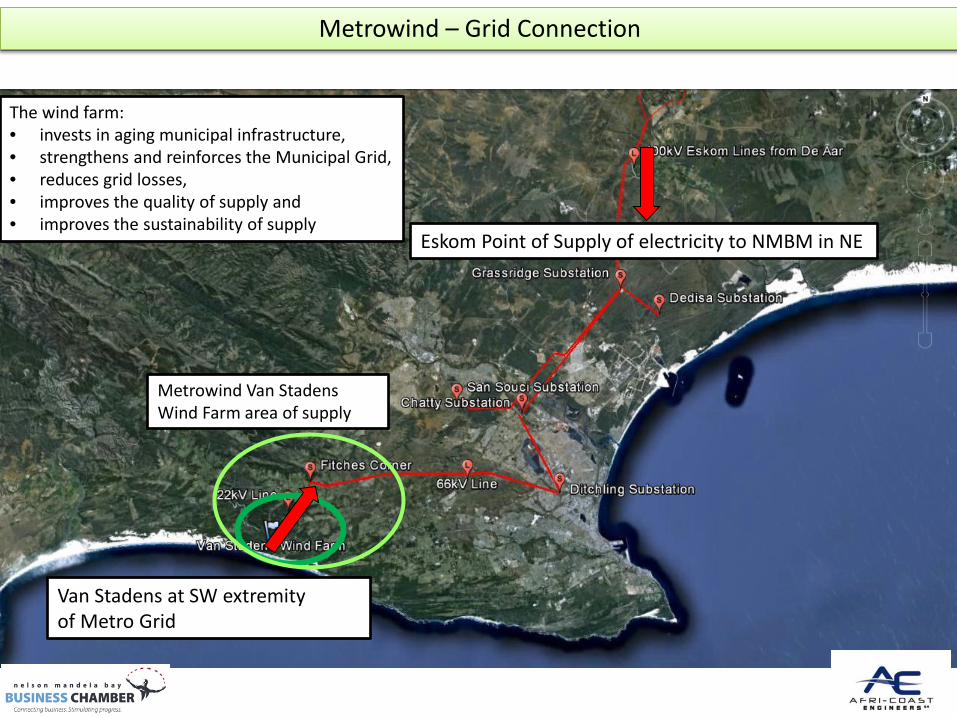
Metrowind – Grid Connection
Source
Eskom Point of Supply of electricity to NMBM in NE
The wind farm: • invests in aging municipal infrastructure, • strengthens and reinforces the Municipal Grid, • reduces grid losses, • improves the quality of supply and • improves the sustainability of supply
Metrowind Van Stadens Wind Farm area of supply
Van Stadens at SW extremity of Metro Grid
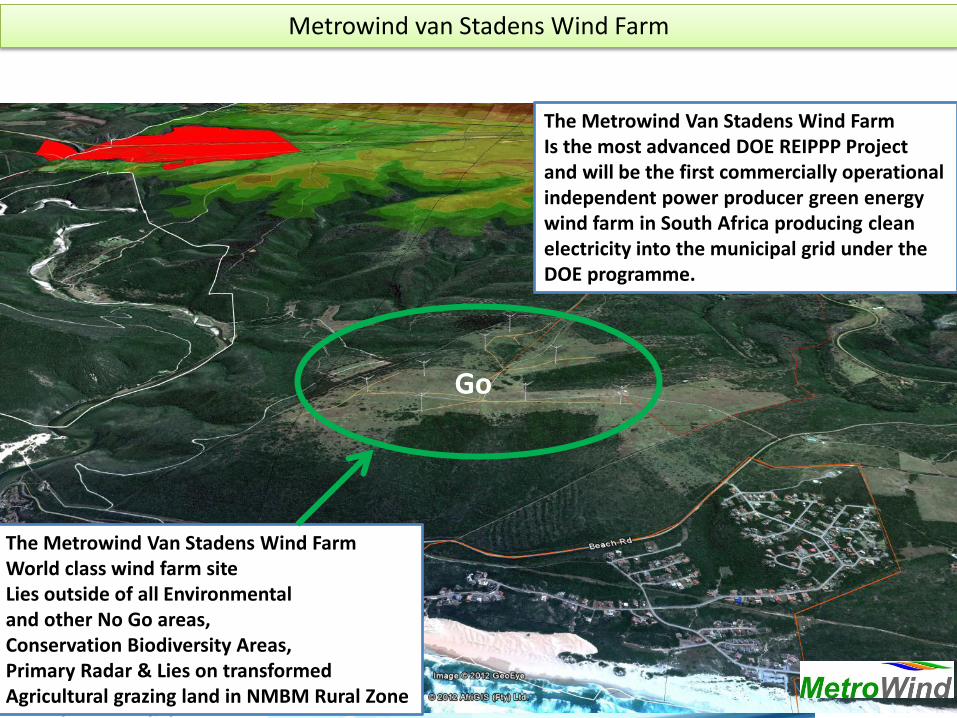
Metrowind van Stadens Wind Farm
Go
The Metrowind Van Stadens Wind Farm World class wind farm site Lies outside of all Environmental and other No Go areas, Conservation Biodiversity Areas, Primary Radar & Lies on transformed Agricultural grazing land in NMBM Rural Zone
The Metrowind Van Stadens Wind Farm Is the most advanced DOE REIPPP Project and will be the first commercially operational independent power producer green energy wind farm in South Africa producing clean electricity into the municipal grid under the DOE programme.

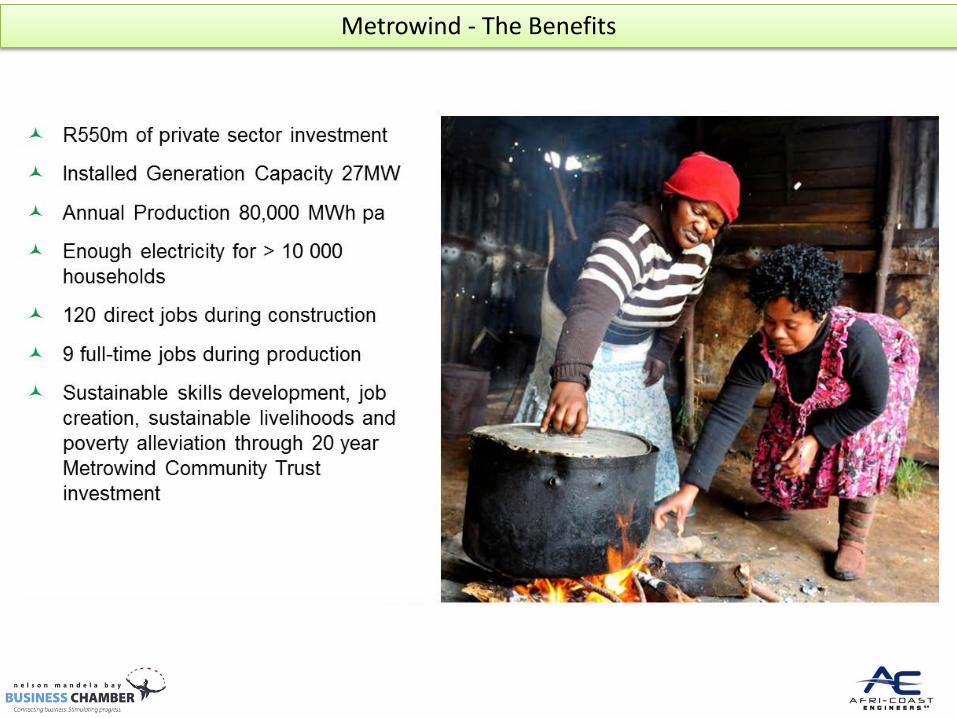
Metrowind - The Benefits
Metrowind - The Benefits

Witteklip Fitches Corner
Shamrock Van Stadens
Blue Horizon Bay
Van Stadens Nature Reserve
Woodridge Eco School
Waste Recycling
St Albans Prison
The Metrowind van Stadens Wind Farm hasl invested in Socio Economic Development of the surrounding marginalised rural communities
Metrowind - Socio Economic Development & Local Economic Development
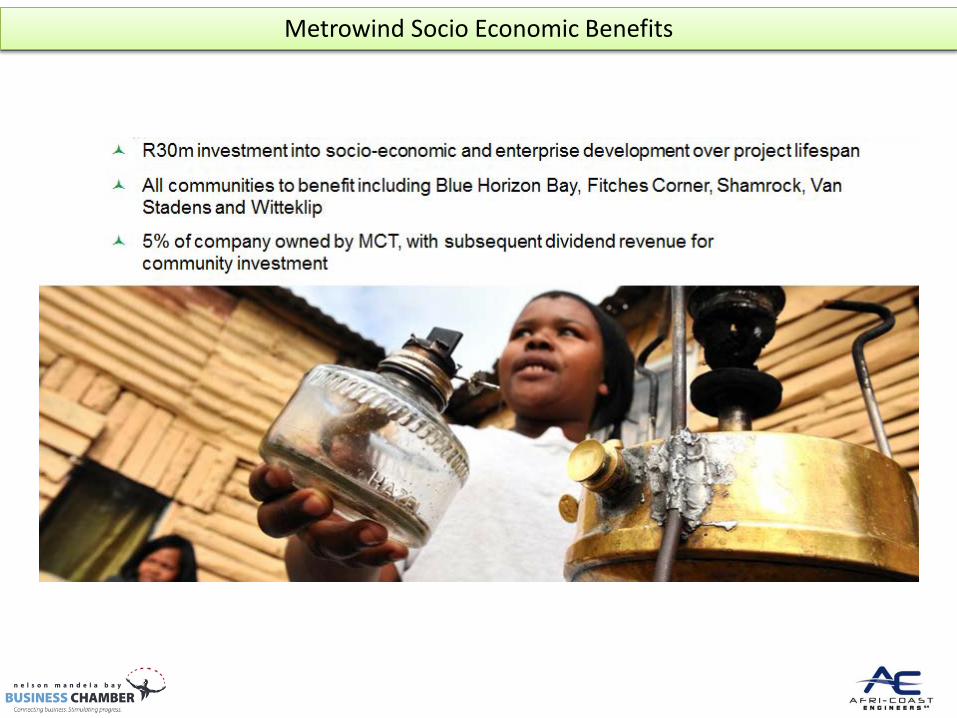
Metrowind Socio Economic Benefits

Metrowind Environmental Benefits

Metrowind Environmental Concerns Addressed

Metrowind Construction Programme

Metrowind van Stadens wind farm is…
Onshore Wind
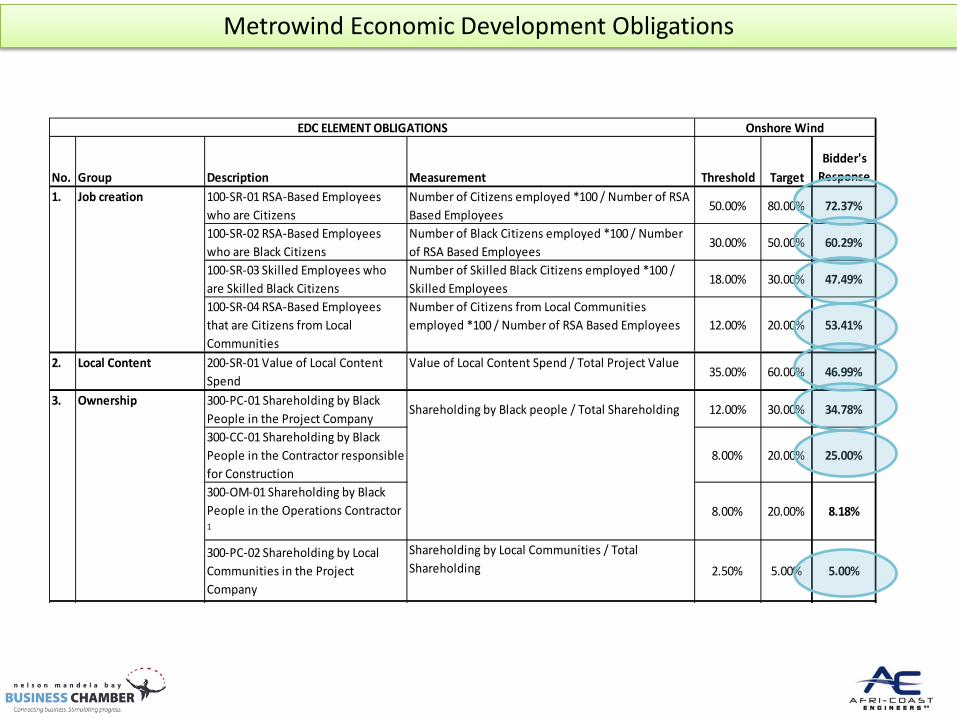
No. Group Description Measurement Threshold TargetBidder's
Response1. Job creation 100-SR-01 RSA-Based Employees
who are CitizensNumber of Citizens employed *100 / Number of RSA Based Employees
50.00% 80.00% 72.37%
100-SR-02 RSA-Based Employees who are Black Citizens
Number of Black Citizens employed *100 / Number of RSA Based Employees
30.00% 50.00% 60.29%
100-SR-03 Skilled Employees who are Skilled Black Citizens
Number of Skilled Black Citizens employed *100 / Skilled Employees
18.00% 30.00% 47.49%
100-SR-04 RSA-Based Employees that are Citizens from Local Communities
Number of Citizens from Local Communities employed *100 / Number of RSA Based Employees 12.00% 20.00% 53.41%
2. Local Content 200-SR-01 Value of Local Content Spend
Value of Local Content Spend / Total Project Value35.00% 60.00% 46.99%
3. Ownership 300-PC-01 Shareholding by Black People in the Project Company
Shareholding by Black people / Total Shareholding 12.00% 30.00% 34.78%
300-CC-01 Shareholding by Black People in the Contractor responsible for Construction
8.00% 20.00% 25.00%
300-OM-01 Shareholding by Black People in the Operations Contractor 1
8.00% 20.00% 8.18%
300-PC-02 Shareholding by Local Communities in the Project Company
Shareholding by Local Communities / Total Shareholding 2.50% 5.00% 5.00%
EDC ELEMENT OBLIGATIONS
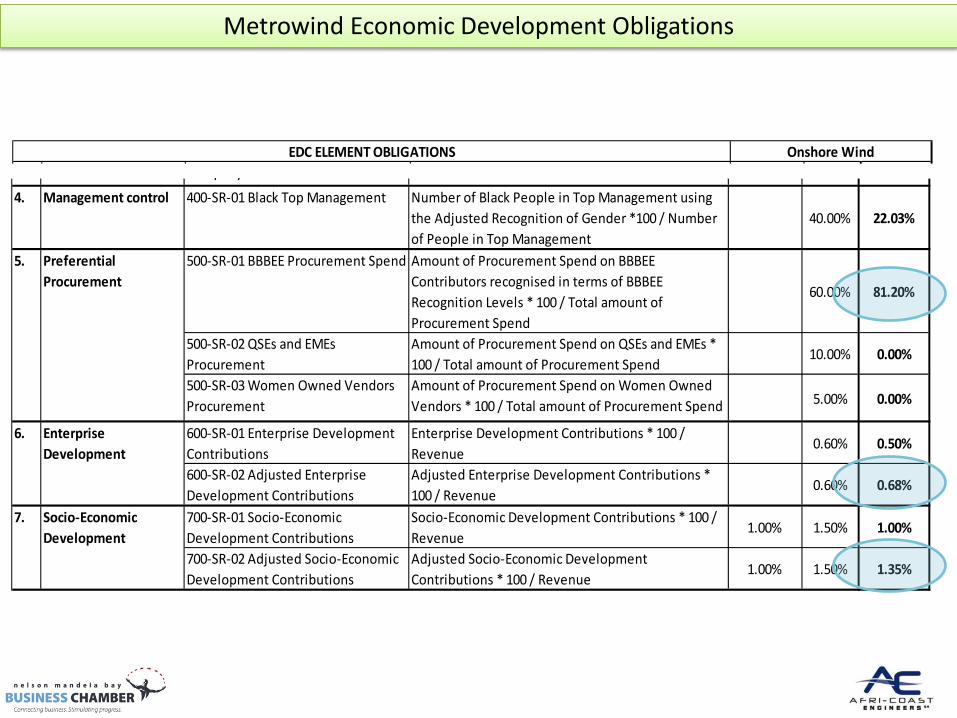
Metrowind Economic Development Obligations
Metrowind Economic Development Obligations
p y
4. Management control 400-SR-01 Black Top Management Number of Black People in Top Management using the Adjusted Recognition of Gender *100 / Number of People in Top Management
40.00% 22.03%
5. Preferential Procurement
500-SR-01 BBBEE Procurement Spend Amount of Procurement Spend on BBBEE Contributors recognised in terms of BBBEE Recognition Levels * 100 / Total amount of Procurement Spend
60.00% 81.20%
500-SR-02 QSEs and EMEs Procurement
Amount of Procurement Spend on QSEs and EMEs * 100 / Total amount of Procurement Spend
10.00% 0.00%
500-SR-03 Women Owned Vendors Procurement
Amount of Procurement Spend on Women Owned Vendors * 100 / Total amount of Procurement Spend 5.00% 0.00%
6. Enterprise Development
600-SR-01 Enterprise Development Contributions
Enterprise Development Contributions * 100 / Revenue
0.60% 0.50%
600-SR-02 Adjusted Enterprise Development Contributions
Adjusted Enterprise Development Contributions * 100 / Revenue
0.60% 0.68%
7. Socio-Economic Development
700-SR-01 Socio-Economic Development Contributions
Socio-Economic Development Contributions * 100 / Revenue
1.00% 1.50% 1.00%
700-SR-02 Adjusted Socio-Economic Development Contributions
Adjusted Socio-Economic Development Contributions * 100 / Revenue
1.00% 1.50% 1.35%
Onshore Wind
EDC ELEMENT OBLIGATIONS
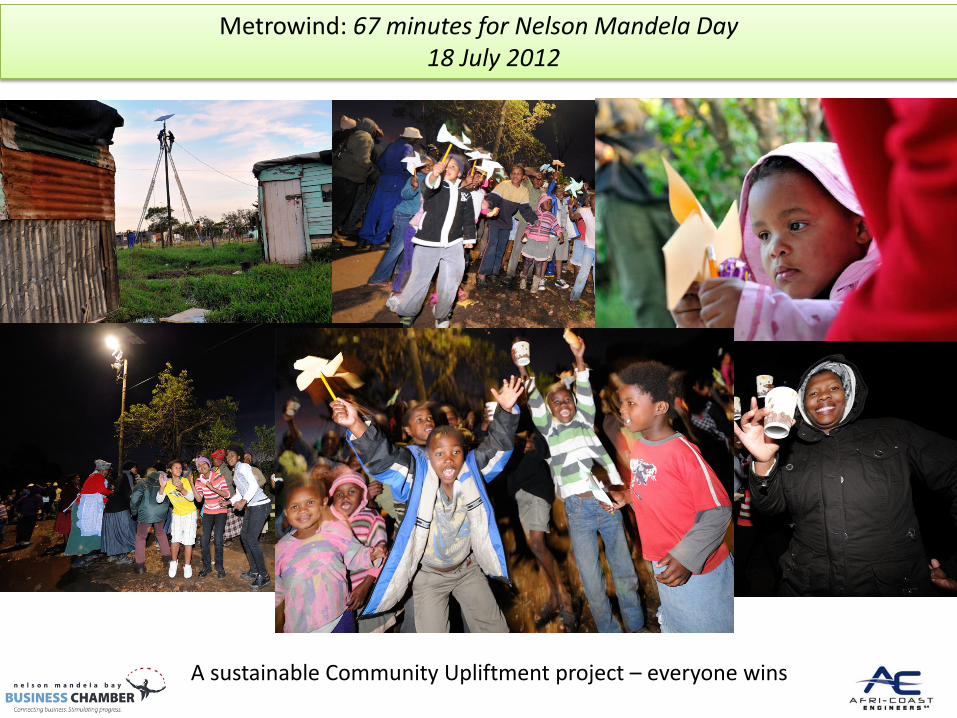
Metrowind: 67 minutes for Nelson Mandela Day 18 July 2012
A sustainable Community Upliftment project – everyone wins
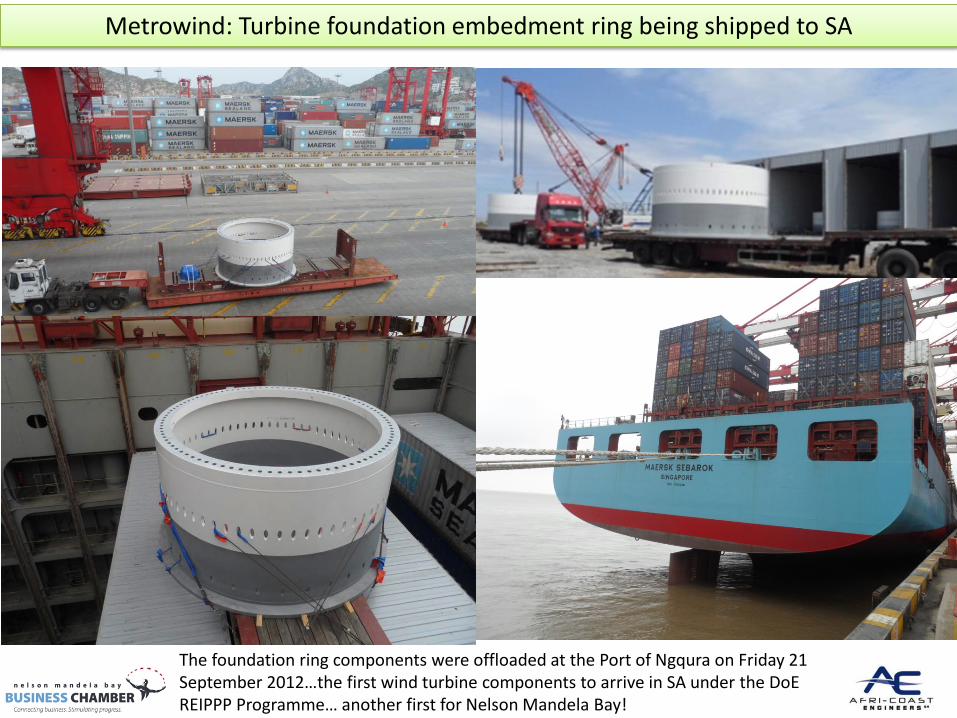
Metrowind: Turbine foundation embedment ring being shipped to SA
The foundation ring components were offloaded at the Port of Ngqura on Friday 21 September 2012…the first wind turbine components to arrive in SA under the DoE REIPPP Programme… another first for Nelson Mandela Bay!

The Future – The Sustainable High Road
Source Greenpeace – the advanced Energy [r]evolution A sustainable energy outlook for South Africa Report 2nd edition 2011 South Africa energy scenario
Our children’s future is in our hands…