the white paper - dairy ukrural impact of dairy dairy is the bedrock of local communities. local...
TRANSCRIPT

THEWHITEPAPEROCTObER 2017


i
Between them, Dairy UK members collect, process and distribute almost 85% of UK milk production. Our role is to help create a positive platform for the future of dairy.Our overarching goals are:
To help create an environment in which dairy foods are seen as safe, sustainable and integral to the UK nation’s diet;
To help create an environment that allows the dairy sector to compete and grow without an undue burden of regulation.
Dairy UK represents its members interests with a variety of stakeholders including: parliamentarians, Government departments, policy and regulatory bodies, industry organisations and the media.
We offer our members and the stakeholders with whom we interact a wealth of knowledge and experience across areas such as policy and economics, supply chain integrity and technical issues, nutrition and health, environmental sustainability and occupational health and safety.
Dairy UK owns a number of successful subsidiaries and schemes including:
• TheDairyCouncil;• TheBritishCheeseBoard(BCB);• DairyEnergySavings(DES);• DairyTransportAssuranceScheme(DTAS);• RollContainerRepatriationScheme.(Trolley
Team)
DAIRY UK
Dairy UK is the trade association for the British dairy supply chain. It brings together farmers, dairy co-operatives and processors, manufacturers and bottle milk buyers throughout the United Kingdom.
We have a strong international role working through organisations such as the International DairyFederation,EuropeanDairyAssociationandtheGlobalDairyPlatform.OurCEO,DrJudith Bryans, was elected President of the International Dairy Federation in October 2016 an organisation representing 45 countries and 75% of the global milk supply which makes it the global voice for the dairy sector on issues along the entire dairy chain from farm to fridge.
How to find usOurmainofficeislocatedinLondon:
Dairy UK Head Office6thfloor,210HighHolborn,LondonWC1V7EPt.+44(0)2074051484e. [email protected]
Wehavetwootheroffices:
Dairy UK Scotland110AMaxwellAvenue,Westerton,Bearsden,GlasgowG611HUt.+44(0)1419421447e. [email protected]
Dairy UK Northern IrelandShaftesburyHouse,EdgewaterOfficePark,EdgewaterRoad.BelfastBT39JQt.+44(0)2890770116e. [email protected]

Dairy UK | The White Paper 2017
ii

iii
Welcometothe2017editionofTheWhitePaper, which records the performance and importance of the UK dairy industry, whilst calling on Government to support the dairy industry with the many challenges and opportunities that lie ahead.
We take great pride in our industry and understandably so. Dairy matters a great deal and, like any strategically important industry, we need to ensure we are meeting the challenges of today and are equipped to deal with what the future holds.
Everyyeariseventfulforourindustry,but2017has presented us with some of our greatest tests yet. Brexit looms large on the horizon and so there has never been a more important time for us to remind Government and decisionmakersofoursignificance.
In this year’s White Paper we have been clear on what we think Government could do to help create an even more dynamic and successful dairy sector, highlighting the key policy challenges and opportunities we face. We look forward to working closely with the Government and key decision makers through thesetimesofchange,andareconfidentthedairy industry will emerge stronger than ever before.
I am glad to report there is great unity of purpose across the industry in sparing no effort to inform Government of how vital it is to have a thriving dairy industry and what
steps need to be taken to mitigate the threats and maximise the opportunities that Brexit presents, to ensure that we continue to be successful. We’re calling on the Government to work with us and ensure that future trading arrangements can work for our industry, and include fundamentals such as access to labour, supporting our dairy farmers and ensuring wecancontinuetoexporttotheEUandtheworld.
Our industry has to contend with a vast range of issues ranging from nutrition to the environment and animal welfare, and there is a continuing need for us to promote relentlesslythenutritionalbenefitsofourfoods. Of paramount importance is our ability tomaintaintheoutstandingconfidenceconsumers continue to show in our products. In this edition of the White Paper we have set out how we can work with the Government on these key issues so we can secure the resilient and effective dairy industry the future needs.Given the increase in global demand for dairy, prospects are good. We do, however, need to seize the moment – and that will require yet more of the innovation and inspiration that have been the hallmark of our industry for generations.
Ihopeyoufindthisyear’sWhitePaperahelpful reference tool and a useful insight into a great UK industry.
Paul Vernon,Chairman,DairyUK.
CHAIRMAN’S INTRODUCTION

Dairy UK | The White Paper 2017
iv

CONTENTS
1. THE SIgNIfICANCE Of THE UK DAIRY SECTOR .................... 1
2. bRExIT ....................................................................................... 5
3. ANIMAl HEAlTH AND WElfARE .......................................... 15
4. DAIRY fARMINg ...................................................................... 19
5. MIlK COllECTION ................................................................. 29
6. MIlK PROCESSINg ................................................................ 33
7. fOOD SAfETY, QUAlITY AND INTEgRITY ........................... 43
8. HEAlTH & SAfETY AND TRAININg ...................................... 47
9. CONSUMERS AND MARKETINg............................................ 51
10. DAIRY AND NUTRITION ......................................................... 59
11. UK DAIRY AND THE ENVIRONMENT ................................... 63
12. WORlD DAIRY TRADE AND fUTURE PROSPECTS ..............77
13. NUTRITION EDUCATION AND PROTECTION ...................... 87
v

Dairy UK | The White Paper 2017

THE SIgNIfICANCE Of THE UK DAIRY SECTOR
1.
1

Dairy UK | The White Paper 2017
Thedairysectorplaysasignificantpositive role in the UK economy, the diets of consumers, rural communities, the environment and in food security.
23,000 50,000Employed by processors Employed on farms
DAIRY INDUSTRY EMPlOYMENT
With13,000dairyfarmersproducingover14billion litres of milk annually, dairy represents
14 bIllIONlitres of milk
13,000DAIRY fARMERS
ANNUAl MIlK PRODUCTION
PRODUCE
Over 70,000 people are employed directly by the dairy sector in the UK on farm and in processingplants.Additionalemploymentisprovided within subsidiary industries whose ownprofitabilityreliesonastrongdairyindustry.
14.8% of the value of agricultural produce in the UK and £8.8 billion of sales at wholesale level.
2
THE IMPORTANCE Of THE DAIRY SECTOR IN THE UK

Theestimatedvalueoftheindustryisanaggregate of £27.8 billion once indirect and
VAlUE Of OUR INDUSTRY
14.8%of the value of agriculture produce at farm level.
£8.8bnof sales at wholesale.
£27.8bnaggregate turnover impact estimated once indirect and induced multiplier impacts are considered.
ThedairyindustryhelpstofeedtheUK.It’stherefore an important part of the nation’s food security.
RURAl IMPACT Of DAIRY
Dairy is the bedrock of local communities.
localProsperityland
Stewardship
Dairy farmers are key to stewardship of the land and the dairy sector plays a key role in the prosperity of rural communities.
induced multiplier impacts are taken into account.
1.THESIGnIFICAnCEOFTHEUKDAIRySECTOR
3

Dairy UK | The White Paper 2017
DAIRY AND A SUSTAINAblE DIET
The dairy food group plays an important role in providing key nutrients to the diets of children and adults.
PROTEIN
CAlCIUM
VITAMIN b2 (RIbOflAVIN)
PHOSPHORUS
IODINE
POTASSIUM
VITAMIN b5 (PANTOTHENIC ACID)
VITAMIN b12
Our processors deliver high quality, safe and nutritious foods to the UK consumer and both
DAIRY’S glObAl STORY
TheUKdairyindustryispartofalargerglobaldairy story. It is part of a one billion strong community of people whose economic livelihoodsrelyonthedairysector.Aroundsix billion people enjoy dairy foods and ingredients worldwide.
With 20% of the world’s agricultural land being cared for by the dairy sector, and accounting for 14% of global agricultural trade, milk is the top agricultural commodity in value terms the world over.
DAIRY UK AND ITS MEMbERS: COMMITTED TO THE fUTURE Of THE UK DAIRY SECTOR
AtDairyUKweareproudtorepresentavibrant dairy sector which plays its part nationally and internationally in enriching peoples lives economically, nutritionally and environmentally.
Our members produce some of the most loved and enjoyed foods found in UK fridges, and are continually striving to drive the industry forward.
Theareasinwhichwerepresentourmemberstouch the length of the supply chain and are covered in this report. Our overriding goal is to build a positive platform for the future of dairy.
farmers and processors are committed to producing dairy foods sustainably.
4
DAIRyUKISCALLInGOnTHEGOVERnMEnTTO;
• Acknowledgetheimportanceofthedairysectortotheeconomy,thecountrysideandthenation’sdietandthekeyroleitplaysinfoodsecurityandinruralcommunities;
• Listencloselytotheviewsofthesectorwhenformulatingpolicyonfoodandfarmingissues;• Demonstrateitssupportfortheimportanceofdairyinthediettoconsumers;• Workcollaborativelywiththedairyindustrytofacilitatethegrowthofthesector.

bRExIT2.
5

Dairy UK | The White Paper 2017
After40yearsofmembershipoftheEU,theUK dairy industry is deeply enmeshed in the Europeandairymarket.
Asthesector’saggregateturnoveriscalculated at £27.8bn, the industry is clearly a keycomponentintheUKeconomy.Therefore,it is in the national interest for dairy to be given due prominence during the Brexit process and for the industry to emerge as an effective, dynamic sector equipped to continue to feed the nation for generations to come.
TheEUisourbiggestexportmarketandBrexitcan be a success for the sector if impediments totheexistingpatternoftradewiththeEUareminimised. Stabilityisofparamountimportance.TheUKGovernment recently published a position paper on the continuity of the availability of goodsfortheEUandtheUKandhighlightedthe importance of agri-foods. Dairy UK supports the UK Government’s stated aim of reachingagreementwiththeEUinordertosecure frictionless trade in goods and services and welcomes the priority given to agri-foods.
Minimisingdisruptiontoconsumersanddairybusinesses will help the UK dairy industry take
ThedecisionbytheUKtoleavetheEuropeanUnionpresentstheUKdairyindustrywithoneofitsmostsignificantchallengesingenerations.
advantage of the opportunities that Brexit may yield.
Dairy UK is committed to working closely with the Government to ensure that the needs of the sector are taken into account.
IMPORTANCE Of THE UK DAIRY SECTOR
UK dairy processors currently process 14 billion litresofmilksuppliedby13thousanddairyfarmers.UKdairyprocessorsdirectlyemploy23thousand staff in dairy operations and cheese making.Atotalof50thousandindividualsareemployed on dairy farms in the UK.
Dairy farmers are responsible for the management of around 8% of UK land area andthewelfareof1.9millioncows.
Thesectorprovidesarangeofsafe,nutritiousand value for money foods that are consumed in98%ofUKhouseholds.Dairyproductsaccountfor9%ofaUKadult’scalorieintakeofwhich two-thirds is from domestically sourced production.
6
bRExIT AND TRADE
fUTURE RElATIONSHIP WITH THE EUTheabsolutepriorityfortheUKGovernmentshould be the earliest possible conclusion ofaFreeTradeAgreementwiththeEUthatensures the greatest possible continuity of existingarrangements.Theworstoutcometothe Brexit negotiations would be for trade with theEUtobebasedonlyonWTOrules.
ThetariffsfordairyproductsintheEU’sWTOMFntariffscheduleareprohibitivelyhighinorder to prevent the import of dairy products intotheEU.ImpositionoftheWTOschedulebytheUKwouldmakeEUimportsintotheUKmuch more expensive which would impact on UK wholesale prices.
UKsalestotheEU,whichaccountfortheoverwhelming majority of UK dairy exports, wouldhavetosurmounttheEUtariffwall.Given that UK exports account for a small portionofEUtotalconsumption,thentheywould become immediately uncompetitive.
TheUK’spositiononthirdcountrymarketswouldalsobeeroded.AriseinUKwholesalepriceswouldliftthepriceofrawmilk.Thiswould pull UK input costs out of line with the world market.
Ariseindomesticpriceswouldalsobedestructive of domestic demand and result in the increased consumption of dairy substitutes.
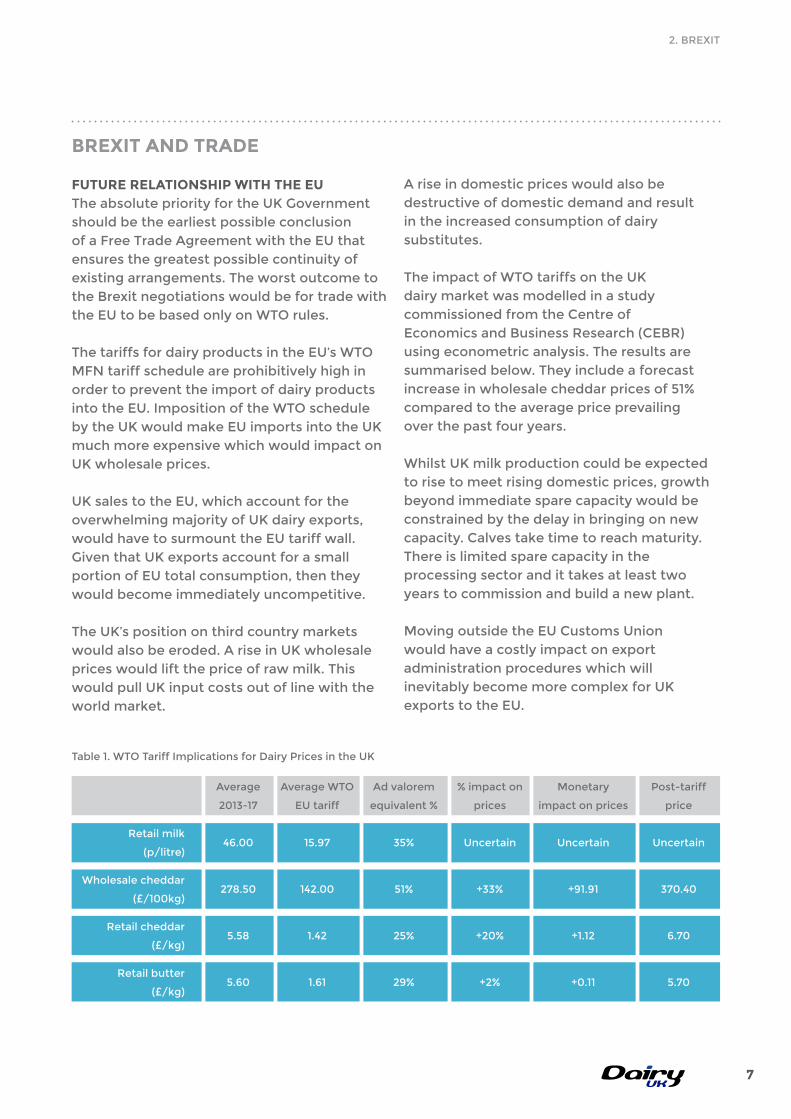
TheimpactofWTOtariffsontheUKdairy market was modelled in a study commissionedfromtheCentreofEconomicsandBusinessResearch(CEBR)usingeconometricanalysis.Theresultsaresummarisedbelow.Theyincludeaforecastincrease in wholesale cheddar prices of 51% compared to the average price prevailing over the past four years.
Whilst UK milk production could be expected to rise to meet rising domestic prices, growth beyond immediate spare capacity would be constrained by the delay in bringing on new capacity.Calvestaketimetoreachmaturity.Thereislimitedsparecapacityintheprocessing sector and it takes at least two years to commission and build a new plant.
MovingoutsidetheEUCustomsUnionwould have a costly impact on export administration procedures which will inevitably become more complex for UK exportstotheEU.
Retailmilk
(p/litre)
Wholesale cheddar
(£/100kg)
Retailcheddar
(£/kg)
Retailbutter
(£/kg)
Average
2013-17
46.00
278.50
5.58
5.60
AverageWTO
EUtariff
15.97
142.00
1.42
1.61
Advalorem
equivalent %
35%
51%
25%
29%
% impact on
prices
Uncertain
+33%
+20%
+2%
Monetary
impact on prices
Uncertain
+91.91
+1.12
+0.11
Post-tariff
price
Uncertain
370.40
6.70
5.70
Table1.WTOTariffImplicationsforDairyPricesintheUK
2.BREXIT
7

Dairy UK | The White Paper 2017
NORTHERN IRElAND
Ensuringgreatestpossiblecontinuityofexisting arrangements is particularly important forthedairyindustryinnorthernIrelandwhichisheavilyreliantonexportstotheEU,ofbothrawmilktotheRepublicandsalesofproducttotherestoftheEU.
TherelationshipbetweennorthernIrelandandtheRepublicisparticularlysignificant.In2015dairyexportsfromnorthernIrelandwereestimatedtobe£154m(secondinmarketvalueonlytoGB)representingapproximately15%oftotalsalesofthenIdairyindustry.ThevalueofexportsfromRoItonIduringthesameyearwasestimatedat£61.6m.HowevertherelationshipbetweennIandRoIdairyindustries goes beyond just the volume and valueoftradealone,RoIdairyco-operatives
own approximately 60% of the processing capacityinnI.
It is therefore essential that when the UK leavestheEUtwo-wayaccessbetweennIandRoIofrawmilk,dairyproductsforfurtherprocessing,andfinishedgoodsaremaintained,without tariffs and free from burdensome non-tariff administrative measures.
AhardborderbetweentheRoIandnIwouldbe the least desirable option for the dairy industry. Failure to achieve a soft border will create uncertainty around the ability of the dairyindustryinnItocontinuetooperateasit does currently, and in a way that minimises costandmaximisesefficiency,tothebenefitof all its stakeholders.
Graph1:northernIrelandMilkandMilkProductSalesbyDestinationin2014
nI GB ROI OtherEU AllEU(exc.GB)
ROW
0
100
200
300
400
£ m
illio
ns
8

STANDARDS
It is also important that the UK does not createnon-tariffbarrierswiththeEUthroughdivergence in standards. Issues that could ariseinclude; • AdoptionbytheUKofmandatoryfront
ofpacktraffic-lightlabellingsystem,currently applied on a voluntary basis in the UK, could become mandatory followingBrexit.Atthemoment,concernsfor the free movement of goods within theEUarestoppingitfrombecomingcompulsory;
• IntroductionofnutrientprofilesbyPublicHealthEnglandaccordingtowhichproducts would not be able to bear claims on pack if they exceeded certain thresholds forsalt,saturatedfatandsugar;
• Introductionofmandatorycountryoforiginlabelling which is currently voluntary in the UK.
Thiswouldcreateadivergenceintheregulatory environment between the UK and theEUwhichwouldalsohaveabearingonUKtraderelationswithnon-EUcountrieswhichis currently conducted on the basis of UK adherencetoEUstandards.
AgRICUlTURAl POlICY
AnothermajoraspectoffuturerelationswiththeEUwillbethedevelopmentoftheUK’sindependent agricultural policy outside the CommonAgriculturalPolicy.
AssumingatarifffreedealwiththeEUcanbereached, the UK dairy sector will continue to havetocompetewithsubsidisedEUfarmers.Therefore,itwillbeimportantforUKdairyfarmerstohavealevelplayingfieldwiththeirEUcounterparts,bymaintainingsimilarlevelsof public support.
SupportundertheEU’sCommonAgriculturalPolicyensuresthatEUmilkproduction is higher than would be the case
without subsidies, which acts to reduce theoveralllevelofEUprices.Inthispriceenvironment, direct payments become central to the viability of UK dairy farming.
RemovingbasicpaymentsintheUKwouldtherefore have a significant impact on the productive potential of the sector.
Shouldthefinancialresourcesallocatedto direct payments be reduced, these reductions should be compensated by resources being moved to schemes that improve the competitiveness of the sector in order to offset the loss of direct payments.
Table2:AverageDirectPaymenttoDairyFarmersbyUKCountry2015
England
Wales
Scotland
northernIreland
SingleFarmPayment
23,400
18,500
33,611
20,486
Farm Business Income
83,800
70,200
68,471
45,728
Percentage
28%
26%
49%
45%
2.BREXIT
9

Dairy UK | The White Paper 2017
CREATION Of A WTO SCHEDUlEInrespectofnon-EUcountriestheUK’s priority should be establishing an independenttariffscheduledintheWTO.TheUKshouldreplicatetheEU’simporttariffschedule to create negotiating leverage forfreetradeagreements.TheUKwouldthenbeatlibertytooperateMostFavourednationtariffsbelowthelimitssetbyitsschedule if it chose to do so.
AgreementwouldalsoberequiredontheUK’sshareoftheEU’sTariffRateQuotas(TRQs)fordairyproducts.Howevernoneofthesequotasplayasignificantroleinmeeting UK domestic demand for dairy products.newZealandnolongerutilisesits butter quota and utilisation rates for theremainingTRQsarehighlydependentonshorttermmarketdevelopments.Thisis because the tariffs associated with each quotaarestillsignificant,consequentlyexporters only have an incentive to utilisetheTRQwhenthereisasufficientdivergencebetweentheEUorUKmarketand the world market price to make payment ofthetariffcommerciallyviable.Thiscan occur at different points in the price cyclebutnotwithsufficientconsistencyto ensure full utilisation from year to year. ConsequentlythetradeundertheseTRQsisshort term and price driven.
TheUKwillalsohavetonegotiateitsshareofWTOrestrictionsonEUdomesticsupportalthough this is not expected to be a major issue.
UK SHARE Of EU ExPORT TARIff RATE QUOTASUnder a range of trade agreements the EUhasanumberofTRQsfordairyexportstonon-EUcountries.TheyincludeUSA,DominicanRepublic,Switzerland,norwayandSouthKorea.TRQsforexportstoCanadaandJapan will become available before Britain leavestheEU.
ThemostimportantexportTRQfortheUKdairyindustryiswiththeUSA.TradeoutsidethisTRQforhighvaluecheesesisoftenundertaken.HowevertheseTRQsareimportanttoUKcheeseexporters.TheUK Government should seek to negotiate acontinuingshareoftheseTRQsbasedonhistoric utilisation.
fUTURE fREE TRADE AgREEMENTS WITH NON-EU COUNTRIESDairy UK supports the Government seeking expanded trade opportunities outside the EUfortheUKdairysector.Ifthedairysectoris to realise its full potential then it needs to findgreatermarketopportunitiesoutsidetheUK.However,anyfutureagreementsshould be balanced and not prejudice the UK dairy industry’s position in its home market or its existing export markets, particularly theEU.
Tobenefitthesectortradeagreementsmust provide greater market access for dairyproducts.Agreementsshouldpromoteoffensive dairy interests through improved market access in terms of zero tariffs and noTRQs.Anotherprerequisitetoachieving
TRADE WITH NON-EU COUNTRIES
10

market access is to solve any barriers to trade andtopromoteagreementscoveringSanitaryand Phytosanitary issues and to achieve equivalence agreements.
Defra needs to ensure adequate resources to support and overcome administrative issues inrelationtoincreasedexport.Thisincludesworking on improvements to the export health certificateadministrationsystem.
TARgET MARKETSFor the UK dairy industry the ideal candidates forFTAswouldbecountriesthatprovidedacombination of:
* Anexistingtradedeficitindairyproducts.ThiswouldclearlyhelptoensurethatanyFTAwouldworktoclosetheUK’stradedeficitindairyproducts.
* Rapidlyexpandingdemand.Achievingmarket share in a rising market is easier than in a stable market. Globally rapid urbanisation, rising disposable income and change in dietary preferences is generating significantgrowthopportunitiesfordairy.
ThesetwofactorswouldtendtowardsseekingFTAswithcountriesinthefar-eastandChinain particular. Other target countries would be in the middle-east.
FurthercriteriawouldbeaffluentcountrieswithafoodcultureclosetotheUK.Thiswouldenable exporters to exploit their existing productrange.ThiswouldincludeCanada,
USAandAustralia.Incombinationthesefivetargetcountries/regionsarethoseidentifiedin Dairy UK’s export strategy as providing the greatest commonality in the export strategies being pursued by Dairy UK members.
TheUKGovernmentwillbeunderstrongpressuretoconcludeearlyFTAswiththeUK’straditionaltradingpartners.Careneedstobe taken to ensure that the industry pricing structure in these countries do not allow them to utilise below cost pricing to obtain and sustain market share in the UK market. In addition the Government must ensure that the production practices in these countries do notundermineUKconsumerconfidenceinthewholesomeness and safety of dairy products.
AnumberofUKdairyproductshavebeengrantedprotectedstatusundertheEU’sPDO/PGIscheme.ThebenefitsaccruedtotheseproductsshouldberecognisedinanyFTAnegotiated by the UK.
UK fOOD SAfETYAprerequisitetotheUKdairyindustrymaintaining and expanding exports is confidenceinthesafetyofUKdairyproducts.TheUKGovernmenthasavitalroletoplayin demonstrating to other countries the effectiveness of the food safety systems operated by UK authorities and by the industry.ThisrequirestheGovernmentto invest in the resources and expertise to communicate on this issue to foreign Governments, particularly during and after inspection visits.
2.BREXIT
11

Dairy UK | The White Paper 2017
THE RISKS Significanttariffbarrierswouldundermineexports, reduce domestic demand for dairy, provide an incentive for the growth in sales of dairy substitutes and disrupt the operation of the northernIrelandindustry.ImportsfromtheEUwould become prohibitively expensive, impacting wholesale prices negatively- with wholesale cheddar prices potentially increasing 51% in the eventofnodealbeingreachedwiththeEU.
non-tariffbarrierswouldresultindisruptionoftradeand imposition of additional costs on the industry.
EnsuretradingarrangementswiththeEUcontinuewithouttariffandnon-tariffbarriers
THE OPPORTUNITIES Minimisingdisruptiontotradewouldensure continued access to one of the largest most solvent dairy markets in the world, which presents the UK with considerable potential for sales growth in the future.
THE RISKS Unlike other areas of agriculture, dairy farming requires a steady level of labour throughout the year,asopposedtoseasonalfluctuations.Withover70,000 employees currently working in the dairy sector, producing over 14 billion litres of milk a year, it is an important cornerstone of the UK economy.
SoanyinabilitytorecruittrainedoruntrainedEUlabour would have a big impact on the dairy sector, driving up operating costs, with a consequential impact on margins.
For many individual dairy farmers, the absence of an alternative domestic source of labour would threaten the viability of their businesses.
Ensurethereiscontinuedaccesstoskilledandunskilledlabour
THE OPPORTUNITIES Solutionscouldbefoundtoaccessnon-EUlabourthatwouldenabletheindustry to maintain its current scale of operation.
THE RISKS AnydivergenceintheUK’sregulatoryenvironmentcould create de-facto barriers to trade that would inhibit export growth.
Ensureanyreviewofexistingregulationsortheintroductionofnewregulationswillnotcreatenon-tariff barriers
THE OPPORTUNITIES Arecognitionoftheneedforequivalence of standards between theEUandUKwouldfacilitatethatcontinuation of existing trade at minimum cost.
BREXITAnDTHEDAIRyInDUSTRy:RISKSVs.OPPORTUnITIES
12

TakestepstoensureUKfarmersarenotdisadvantagedcomparedtotheirEuropeanneighbours,and that any future schemes put in place by government reward continual improvements in efficiencyandfarmingbestpractice
THE RISKS Giving excessive emphasis in agricultural policy to environmental pillars of sustainability would underminethecompetitivenessofthesector.Thiswould happen especially in a regional dairy market, whereEUfarmerswouldbereceivingcontinuedhigh levels of income support.
THE OPPORTUNITIES Policy solutions could be found which allow public support to be more effective in enhancing the sustainability of the sector, whilst permitting a reconfigurationofpolicyobjectives.
THE RISKS Arushedtransitionwoulddisruptsupplychainsand undermine the presence of UK companies in theEUmarket.
Allowforanadequatetransitionperiodtostabilisethetradingenvironmentandallowcompanies adequate time to overcome any hurdles associated with Brexit and to take advantage of the opportunities Brexit gives rise to
THE OPPORTUNITIES Allowingadequatetimeforplanningand implementation of all changes would ensure optimum use of industry resources.
THE RISKS TheRepublicisasignificantexportmarketfornorthernIreland,accountingfor15%ofentireindustrysales,withimportsfromtheRepublicalsoplayingakeyrole.Anyhardborderwouldimpactdeeply embedded supply chain relationships wouldbeundermined,resultinginasignificantdisplacement of product onto the domestic UK market with a consequentially negative impact on producerpricesandprocessorsprofitability.
WorktoaddresstheborderissuesinnorthernIreland
THE OPPORTUNITIES Thecreationofafrictionlessandseamless border regime could provide a future template for trade relations with therestoftheEUafterBrexit.
THE RISKS TheUKdairyindustrycouldloseestablishedpositions in valuable exports.
EnsurethatcompaniesacrosstheUKhaveongoingaccesstothirdcountriesbasedonexistingEUFTAs,untiltheUKcannegotiatealternatives
THE OPPORTUNITIES Maintainingpathwaystomarketwillenable the industry to realise growth opportunities from established positions whilst providing the scale of operation in exports to exploit market opportunities fromFTAsnegotiatedbytheUK.
13

Dairy UK | The White Paper 2017
14

ANIMAl HEAlTH AND WElfARE
3.
15

Dairy UK | The White Paper 2017
Dairy farmers have a vested interest in maintaining the health and welfare of their dairycows.Therearepowerfulmoralaswellas economic reasons for keeping livestock healthy and productive for as long as possible.
In order to ensure dairy farmers meet benchmark standards of animal welfare and productquality,theindustrysupportsTheRedTractorFarmAssuranceDairyScheme(www.redtractor.org.uk).TheschemeispartofAssuredFoodStandards(AFS),andisoverseenby a board nominated by Dairy UK, the farmingunions,AHDB,BritishCattleVeterinaryAssociationandtheBritishRetailConsortium.
Thesefarmassurancestandardssetahighbarfor animal welfare so that consumers can be confidentthattheirmilkanddairyproductsare produced responsibly and respectfully. Under the scheme, farms are inspected every 18 months and the quality of the assessor is furtherverifiedbyacomplianceandintegrityprogramme consisting of regular training and witnessed assessments.
TheUKdairyindustrytakesthehealthandwelfareofdairycowsandrelatedstockextremelyseriously.Theindustryhasavarietyofinitiativesunderway to maintain and improve standards, overseen by an overarching strategy.Measurableimprovementsarebeingachievedatfarmlevelandtheindustrycanbeconfidentthattacklinganimalhealthandwelfareisoneofitsdefiningcharacteristics.
AttheendoftheOctober2015toSeptember2016 year, the scheme covered 64 milk purchasers, 11,158 milk producers and the 14 billion litres of milk that they produce.
Theschemeisbeingcontinuouslydevelopedwith standards being subject to a regular processofreview.FromOctober2013,assessors were required to score a sample of cattle against welfare indicators and discuss the results with farmers. From October 2017 amongst a range of changes, industry standards on medicines and veterinary engagementwillbetightened.Medicinerecords must provide an annual collation of total antibiotic used for the unit, either by a vet from prescription data or completed by a farmer from medicine records, and an annual review of antibiotics used must be undertaken by a vet.
UndertheEUHygieneRegulation,theFSAisrequired to inspect dairy farms. Because of the robustnessoftheRedTractorScheme,dairyfarmsinEngland,WalesandnorthernIreland
fARM ASSURANCE
16
have had the frequency of inspection by the FSAreducedfromonceayeartoonceevery10 years, in recognition of the lower level of risk associated with farms complying with the farm assurance scheme.
Theindustryalsorunsaninitiativetomanageand reduce the incidence of Johne’s Disease inthedairyherd.TheinitiativeisoverseenbytheActionGrouponJohne’swhichhasdevelopedthenationalJohne’sManagementPlan.Theplanrequiresfarmerstoimplementone of the six control strategies developed by theActionGroupandforcompliancetobecertifiedexternallybyvets.Theinitiativehasbeen successful in raising farmer awareness and engagement with the issue.
OthersignificantinitiativesincludetheprogrammetoeliminateBVD(BovineViralDiarrhoea)andimprovementsincowgenetics.
Thefuturedevelopmentofwelfarestandardsfor dairy cows is set out in the industry’s Dairy CowWelfareStrategywhichhasbeenjointly
developedbythenationalFarmers’UnioninconjunctionwithAHDB,theRoyalAssociationofBritishDairyFarmers,BritishVeterinaryAssociation,BritishCattleVeterinaryAssociationandDairyUK.
In combination, this range of initiatives is producing improvements in dairy cow longevity and cow fertility. Industry progress is recorded as the regular reports compiled byCHAWGwiththelatestbeingpublishedinnovember2016.
3.AnIMALHEALTHAnDWELFARE
17
DAIRyUKISCALLInGOnTHEGOVERnMEnTTO;
• Recognisetheachievementsoftheindustryindrivingforwardimprovementsinanimalhealthandwelfare;
• GivedueacknowledgementtoRedTractorstandardsinpublicprocurementdecisions;• Supportthesector’sinitiativestotacklespecificanimaldiseaseissues.

Dairy UK | The White Paper 2017
18
DAIRY fARMINg4.
19

Dairy UK | The White Paper 2017
UKdairyfarmersareprofessional,dedicatedandefficient.UKdairyfarming is internationally competitive with a considerable latent capacity forgrowth.Thisputstheindustryinastrongpositiontoexploitgrowingexport opportunities and to make a major contribution to global food security. Dairy farming is constantly restructuring and relocating to optimiseefficiency.Inresponsetotheglobalisedpriceenvironment,theindustryhasdevelopeduniquecontractualrelationships.ThestrengthofUK dairy farming is the UK dairy industry’s foundation for the future.
DAIRY fARMER NUMbERS
Theprocessoffarmrestructuringiscontinuousinthedairysector.Historicallythisgeneratesan annual rate of decline in farm numbers of around 4%, but with some variation depending onpricelevels.In2012therewereasignificantnumber of new entrants into the industry which reduced the rate of exit.
Thenumberofanimalsinthenationalherdhas
Table3-AverageHerdSizeintheUK-asatJune
been falling, but an offsetting rise in average milk yield per cow has eliminated any impact onproduction.Theaveragefarmsizehasalsobeen rising.
Thetrendtowardsfewer,largerfarmsisalmost universal throughout the developed world,buttherateofexitintheUK(-3.2%)islowcomparedtotheEU27average(-6.5%).
2010
2011
2012
2013
2014
2015
2016
Holdings
15,300
14,793
14,413
14,276
13,922
13,570
13,227
DairyHerd(000Head)
1,830
1,796
1,796
1,782
1,841
1,895
1,897
AverageHerdSize
120
121
125
125
132
140
143
21
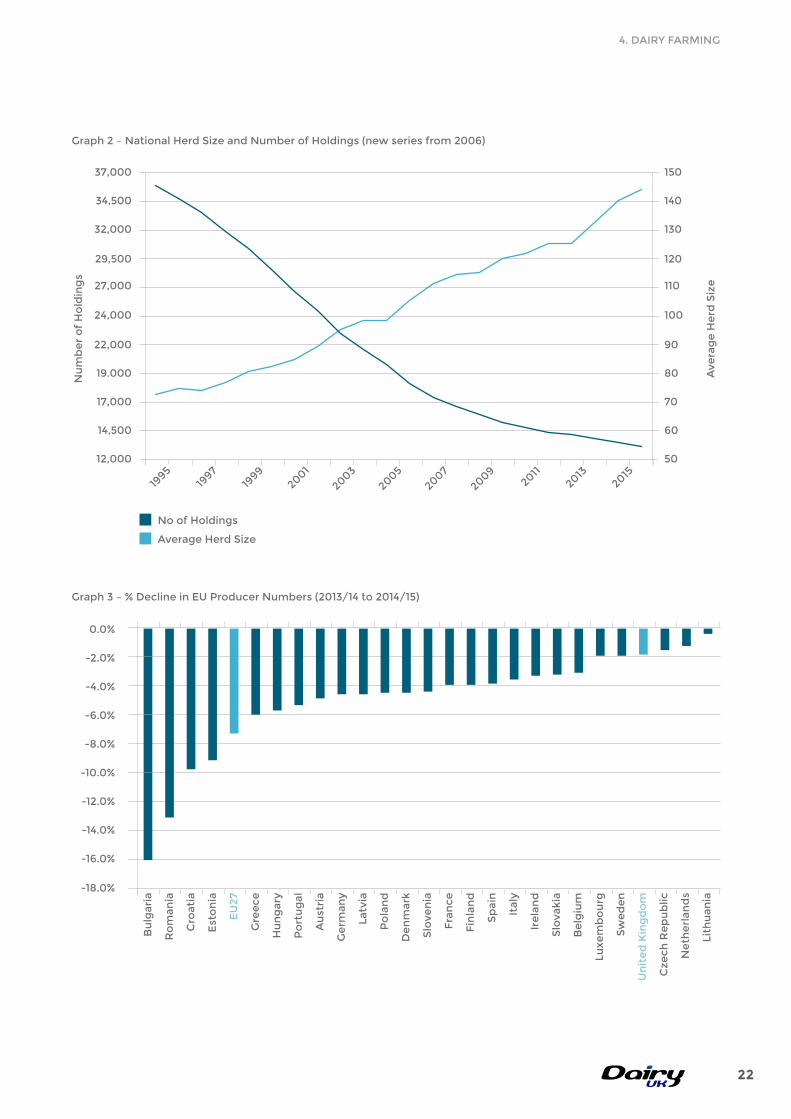
Graph2–nationalHerdSizeandnumberofHoldings(newseriesfrom2006)
nu
mb
er
of
Ho
ldin
gs
27,000
24,000
22,000
19.000
14,500
29,500
17,000
12,000
Ave
rag
eH
erd
Siz
e
1995
1997
1999
2001
2003
20052007
2009
201120
132015
32,000
34,500
37,000
110
100
90
80
60
120
70
50
130
140
150
noofHoldings
AverageHerdSize
Graph3–%DeclineinEUProducernumbers(2013/14to2014/15)
Bu
lgar
ia
Ro
man
ia
Cro
atia
EU
27
Gre
ece
Hu
ng
ary
Po
rtu
gal
Au
stri
a
Ge
rman
y
Latv
ia
Po
lan
d
De
nm
ark
Slo
ven
ia
Fra
nce
Fin
lan
d
Sp
ain
Ital
y
Ire
lan
d
Slo
vaki
a
Be
lgiu
m
Luxe
mb
ou
rg
Sw
ed
en
Un
ite
d K
ing
do
m
Cze
chR
ep
ub
lic
ne
the
rlan
ds
Lith
uan
ia
-18.0%
-16.0%
-14.0%
-12.0%
-8.0%
-4.0%
0.0%
-10.0%
-6.0%
-2.0%
Est
on
ia
4.DAIRyFARMInG
22

Dairy UK | The White Paper 2017
MIlK OUTPUT
MilkproductionintheUKrespondsrapidlytomarketcircumstance.MilkproductionreachedhistoricallyhighlevelsinMarch2015dueto
MIlK PRICES
ThepriceofrawmilkintheUKisdrivenby the world market for dairy products. Thederegulationoftherawmilkmarketmeans that prices are set by commercial negotiations between individuals, or groups of farmers, and milk buyers in a freeandcompetitivemarket.Thishasgiven internationally traded commodities a prominent role in the determination of milk price trends, along with movements in the valueofsterling.Commodityproductssuchasbutter,powder,andmildCheddarsettheunderlying trend in the farm gate price of raw milk in the UK.
When commodity prices fall, operators selling raw milk for commodities have an incentive to offer this milk into higher returning markets, so the price of raw milk used in other products thenfallstoremaincompetitive.Likewise,whencommodity prices rise, milk buyers have to raise the premiums they pay over commodity milk in order to secure their supply of milk.
Theinherentvolatilityofglobalmilksupplymeansthatcommoditypricesarecyclical.Short-term price cycles can mask the long term price trends upon which the industry needs to base investment decisions.
high prices but fell quickly when the market situation reversed. It has since started to recover as prices have risen.
2014/15 2015/16 2016/17 2017/18
1,300
1,100
1,400
1,200
Mill
ion
litr
es
Graph4–UKWholesaleMilkDeliveries
Source:RuralPaymentsAgency
April1,000
May June July Aug Sept Oct nov Dec Jan Feb Mar
22

CURRENT MIlK PRICES
Currentlyprices,asofAugust2017areonanupward trend. Prices weakened in 2014 due to rising global milk supplies, particularly in Europefollowingtheabolitionofquotas,aslow-downinpurchasingbyChinaduetothe build-up of stocks in that country and the
importbanonEUproductsimposedbyRussia.Thisgeneratedaprolongedpriceslump.Howevermarketssubsequentlyre-balancedthrough the curtailment of production growth and the underlying upward trend in global demand.
Commodityprice
180
160
140
120
80
200
100
Graph5–FarmGatePriceVersusCommodityPrice(butter/SMP/mildCheddar)–Movingannualmean
Source:DairyUK
60
Farm gate
Jan0
3
Jan 0
4
Jan 0
5
Jan 0
6
Jan 0
7
Jan 0
8
Jan0
9
Jan 10
Jan 11
Jan 12
Jan13
Jan 14
Jan 15
Jan 16
Jan 17
2014/15
32
22
36
28
Pe
nce
pe
r lit
re
Graph 5 – UK Farm Gate Price
Source:Defra
April18
May June July Aug Sept Oct nov Dec Jan Feb Mar
2015/16 2016/17 2017/18
34
24
30
20
26
4.DAIRyFARMInG
23

Dairy UK | The White Paper 2017
Over the past few years, several major retailers have put in place ‘integrated supply arrangements’. In many respects these arrangements are unique to the British dairy industry.
Under these systems, a retailer obtains their supply of liquid milk exclusively from a specificgroupoffarmers.Therawmilkfromthese farms is processed under segregated arrangements and delivered to the retailer as liquid drinking milk.
Table4–IntegratedSupplyChainRelationshipsfortheLiquidMarket
CONTRACTUAl ARRANgEMENTS IN THE DAIRY INDUSTRY
Farmers generally receive a higher price under these arrangements, which vary from retailer to retailer(seetablebelow).Assuch,farmersonsupermarket contracts are partially insulated from the price trends in commodity markets.
In exchange for participating in integrated supply arrangements, farmers may be required to deliver different welfare requirements, meet particular environmental standards set by the retailer, or share detailed information on farm performance data.
ContractualrelationshipsintheUKdairyindustry are highly developed and, in many ways, unique across the world.
INTEgRATED SUPPlY ARRANgEMENTS
Retailer
Marks&Spencer
Waitrose
Asda
Sainsbury’s
Co-op
Tesco
Morrisons
Booths
noof
Farmers
40
60
250
290
200+
800
300
-
PricingSystem
Formula taking account of costs and market returns
negotiationtakingaccountofcapitalinvestmentrequirements
FarmersengageasAsdapathfindergrouptoimproveonfarmefficiency
Quarterlyreviewofkeyfarminputcosts
Marketrelatedpricesreviewedquarterly
Formula taking account of costs
CompensationtocovercostsincurredtoachievestandardsoverandaboveRedTractor
Guaranteed‘FairMilk’price
fINANCIAl POSITION
Onaverage,UKdairyfarmersareprofitableeven in challenging market situations but with ahighdegreeofvariationbetweenyears.Thevariationinprofitabilitycreatesenormouschallenges for dairy farmers not least in deciding
longterminvestmentdecisions.Profitabilitypeaked in the two years to February 2014 and 2015 but subsequently fell back as milk prices fell.ThesituationfortheyeartoFebruary2018isexpected to improve considerably.
24

Table5–AverageFarmBusinessIncomeperDairyFarm(£)
England
Wales
Scotland
n.Ireland
2011/12
86,500
68,000
82,000
58,000
2013/13
52,500
45,000
45,500
28,000
2013/14
88,000*
77,000*
78,000
61,500*
2014/15
84,000*
70,000*
69,000
45,500*
2015/16
44,000*
33,000*
2,000*
12,000*
2016/17(prov)
22,500*
24,500*
n.a.
14,000*
*newseries|Source:Defra
EffICIENCY
ThediversityoffarmingsystemsandtherangeofefficiencybeingachievedishighlightedbytheevidencecollectedbyAHDBDairyfrom328farm accounts with year ends falling between December2015andJune2016.Thekeyfindingsofthisanalysisare;
• Fullinvestmentcostsofproductionwere20%lower in the top quartile compared with the bottomquartileofGBdairyfarms;
• ThetopquartileofGBproducersachievedapositivenetmarginof4pplin2015/16.Incontrast, the bottom quartile made a loss after all costs of 7.6ppl, a range of over 11ppl, similar to2014/15.
Thisshowsthesignificantlatentpotentialforproduction increases available to the industry throughimprovingefficiency.
ThekeyfindingsfromthemoreextensiveMilkbench+reportin2013wasthat;
• Thekeydeterminantofprofitistotalcostofproduction;
• Averageyieldpercowisnotthemaindriverofprofit;
• Therightbalancebetweeninputuseandmilkoutput(herdsizeandaverageyield)isessentialforhighnetmargin;
• Milkcanbeproducedefficientlyfromanyofthesystemsidentifiedandatalmostanyscaleof production.
Table6–AnalysisbyProductionSystem
Top5%
Top25%
Bottom 25%
Bottom 5%
Full investment net margin:
PencePerLitre
7.3
4.0
-7.6
-12.0
ThekeyconclusionsdrawnbyDairyCo(nowAHDBDairy)were;
• Thereisnosilverbulletwhichensuresprofitability;costcontrolthrougheffectivemanagementisthekey;
• Achievingthemostcost-effectiveperformance levels in terms of milk yield and feed use and in the resulting total costs of production, requires regular recording, monitoring of performance and effective use oftheresultingdata;
• Thereisnoidealherdreplacementrate,understanding the reasons for replacements aremoreimportantthanthenumber.Realistictargets should be set as a part of strategic managementofindividualdairyenterprises;
• Itisimportanttomaintainaleveloffixedcosts appropriate to the level of output. Investment should be aimed at improving productionefficiencyanddecreasingunitcostof production.
4.DAIRyFARMInG
25

Dairy UK | The White Paper 2017
RESTRUCTURINg AND EffICIENCY
Once dairy farmers have maximised their efficiencyforanygivenscaleofproduction,they need the opportunity to expand their businessestocontinuetoimproveefficiencythrough achieving economies of scale by spreadingfixedcostsoveralargerscaleofproduction.Thismeansthatthereisastrongcorrelationbetweenfarmsizeandefficiency.
Herdsize(cows)
TotalDairyOutput
TotalVariableCosts
TotalGrossMargin
<80
1,541
777
765
80-130
1,734
823
911
>130
1,973
950
1,023
Source:Universityofnottingham
“FarmBusinessSurvey2015/2016–DairyFarminginEngland”
Table7–AnalysisofEfficiencybyHerdSize
LowlandHerds(£percow)
Milkproductionfollowsaseasonaltrend,withatraditionalpeakproductioninMayafter the calving season and a trough in October/novemberasgrassbecomespoorer. Weather conditions can have a big impact, and the level of butterfat and protein in milk also varies seasonally.
Theseasonalityofmilkproductionhassignificantlyimprovedsincethe1980s,whichreflectsasustainedeffortbytheindustrytoincentiviseaflatterprofileofproduction.Thisreflectstheimportanceofmaintaining a continuous supply of milk for the UK fresh product markets, particularly liquid milk, which accounts for half of milk utilisation.
SEASONAlITY Of MIlK PRODUCTION
1984/85
40
55
Mill
ion
litr
es
pe
rd
ay
Graph7–Seasonalityofmilkproduction
Source:DairyUK
April30
May June July Aug Sept Oct nov Dec Jan Feb Mar
2016/17
50
35
26

Production is becoming increasingly concentrated in the southwest and northwest ofEngland,mainlyDevon,Somerset,CheshireandCumbria.Thereisalsoasignificant
Figure1–MapofUKWholesale
DeliveriesMarch2014
gEOgRAPHICAl DISTRIbUTION Of MIlK PRODUCTION
> 600 million litres
300-600millionlitres
100-300millionlitres
50 -100 million litres
20 - 50 million litres
< 20 million litres
movementinvolumefromEnglandtoWales,ScotlandandnorthernIreland,indicatingincreasingproductioninthesecountries.Thisprocess can be expected to continue.
4.DAIRyFARMInG
27
DAIRyInDEVELOPInGFUTUREAGRICULTURALPOLICy,DAIRyUKISCALLInGOnTHEGOVERnMEnTTO;
• Ensurethatifthefinancialresourcesallocated to direct payments are reduced, these reductions be compensated by resources being moved to schemes that improve the competitiveness of the sector, in order to offset the loss of direct payments;
• Recognisethenecessityforcontinuedfarmrestructuring;
• Recognisetherangeanddiversityoffarming systems and not give undue preference to any particular management system;
• Placeprotectingandenhancingthecompetitiveness of the dairy sector at the coreofallaspectsofagriculturalpolicy;
• Toworkcollaborativelytodeveloppolicyinstruments which help to mitigate the effects of pricevolatilityonfarmincomes;
• Ensurethatrealisticandcomprehensiveassessments of income forgone should remain the basis for calculating aid for the supply of publicgoods;
• Seektominimisecompetitivedistortionsthatcould result from differences in the agricultural policiesofthecountriesoftheUK;
• Ensureappropriatetransitionperiodsifthecurrent range and balance of agricultural policy instrumentsistoberadicallyaltered;
• Recognisethegrowingchallengeofensuringanadequate supply of trained labour to the dairy farming sector.

Dairy UK | The White Paper 2017
28

MIlK COllECTION5.
29
Dairy UK | The White Paper 2017
Milkiscollectedfromfarmsbymilkhauliersusingafleetofapproximately1,300vehiclesdriven by over 2,000 drivers.
Milkcollectionvehiclesaretypicallyoperatedby hauliers contracted by milk purchasers, but around15%ofthevehiclefleetisownedandoperated directly by milk purchasers.
Over90%ofthemilkhaulagecapacityintheUKiscoveredbytheDairyTransportAssuranceScheme(DTAS),theindustry’sassuranceschemeformilktransport.Thescheme provides assurance to milk purchasers that the transport of raw milk and milk fractions meets food safety requirements, recognisedindustrygoodpracticeandspecificcustomer needs.
Theschemeisbasedonannualinspectionsofthe milk haulage depots operated by scheme members and the assessment is conducted againstarangeofstandardscoveringfleetandequipment, milk quality, hygiene and security, out-based reload sites, personnel, training and general management and further checks are carried out by a system of random audits.
TheUKmilkcollectionindustryisefficient,flexibleanddynamicandcommitted to operating to the high professional standards demanded by the industry’s assurance scheme for milk haulage.
AllmembersmusthaveadocumentedHazardAnalysisandCriticalControlPoint(HACCP)system in place that fully covers all aspects of milk collection and delivery.
TheScheme’sstandardsarereviewedannuallyandtheSchemeisadministeredbyDairyUKandoverseenbyaManagementCommitteedrawn from major milk purchasers and milk hauliers in the UK.
AlongsidetheRedTractorAssuranceDairySchemeforonfarmproductionandtheBritishRetailConsortiumstandardsforfoodprocessing,theDTASschemecompletesthepropositionbehindtheRedTractorlogooffarm to fork assurance of the dairy supply chain.Confidenceintherobustnessofthescheme is demonstrated by the fact that from April2015ithasbeenarequirementthatalldairyproductscarryingtheRedTractorlogohavetousemilkhauledbyaDTASapprovedhaulier.
Details of the scheme, along with all relevant documentation, can be found at www.dairytransport.co.uk.
30
DAIRyUKISCALLInGOnTHEGOVERnMEnTTO;
• LiaisecloselywithDTASonanyemergenciesaffectingthenationaltransportinfrastructurethat affects the collection of raw milk
5.MILKCOLLECTIOn
31

Dairy UK | The White Paper 2017
32

MIlK PROCESSINg6.
33

Dairy UK | The White Paper 2017
MilkpurchasingandprocessingintheUKisledbywell-established,highly-invested, dynamic operations. UK processors have a proven track record of meeting the demands of major domestic and international retailers and food service companies.
Asignificantinternationalcomponentintheownershipofprocessingcapacity gives the industry a strong global dimension, and farm ownershipofprocessingcapacityissignificant.Theindustryboastsparticularstrengthintheefficientprocessinganddistributionoffreshproducts, and the variety and diversity of its cheese sector.
INDUSTRY ORgANISATIONS
AlphabeticallythesixmajororganisationsleadingtheUKdairyindustryare;
• ArlaFoodsUK,aEuropeanfarmerownedco-op(www.arlafoods.co.uk);
• DairyCrest,apublicUK-basedPLC (www.dairycrest.co.uk);• FirstMilk,aUK-baseddairyfarmingco-op
(www.firstmilk.co.uk);• GlanbiaCheese,ajointventurebetween
GlanbiaplcandLeprinoFoodsCompany(www.glanbiacheese.co.uk/);
• MüllerUK&Ireland,aGerman-basedprivately owned dairy company
(www.muller.co.uk);• DaleFarmCo-op,aUK-baseddairy
co-op(www.dalefarm.co.uk).
With a relatively low level of industry concentrationcomparedtootherEuropeansectors further opportunities for industry rationalisation and merger still exist.
INTERNATIONAl INVESTMENT
ManyUKmilkprocessorsare,orareownedby,internationally-based companies. In addition toArlaFoodsUKandMüllerUK&Ireland,othercompaniesintheUKwithasignificantinternationaldimensioninclude;
• GlanbiaCheese,ajointventurebetweenGlanbiaplcofIrelandandLeprinoFoodsofUSA(www.glanbiacheese.co.uk);
• CaledonianCheeseCompany,whoareownedbyLactalisofFrance
(www.grouplactalis.co.uk).
By providing additional access to capital and foreign markets this international dimension complements the strength of UK based operators.
34

Theoverwhelmingmajorityofdairyfarmersare contracted to sell their milk to either private dairy companies or to co-operatives. Only a small fraction is marketed directly to consumers by farmers through on farm processing facilities.
Similarlyprocessorsonlysellasmallportionoftheir output direct to consumers through the doorstepdeliveryservice.Themajorityissoldto intermediary organisations such as retailers who then sell the product to consumers.
ArecentinnovationinthesupplychainistheadventofProducerOrganisations.These
THE SUPPlY CHAIN
1%
Farmers
Producers99%
Processors
Privatedairies64.9%
Co-opprocessing
35.1%
Customers
Doorstep3%
Retailers70%
Food Processors, Catering
16%
Exports11%
Consumers
UK
EU
non-EU
Livestock
Producer organisations
5.7%
Farmers selling direct to consumers
Figure2.IndustrySupplyChain
organisationsarepermittedunderEUlawtorepresent dairy farmers in price negotiations withprivatedairycompanies.Thelegalfoundation for Producer Organisations is providedbytheEU‘DairyPackageof2012’.
SofarDairyCrestDirectisthesoleexampleof a PO in the UK but other organisations are expected to emerge. In addition to negotiating prices, POs can provide the basis for a much closer working relationship between farmers and processors and can potentially address a whole range of issues from production standards to benchmarking.
6.MILKPROCESSInG
35
Dairy UK | The White Paper 2017
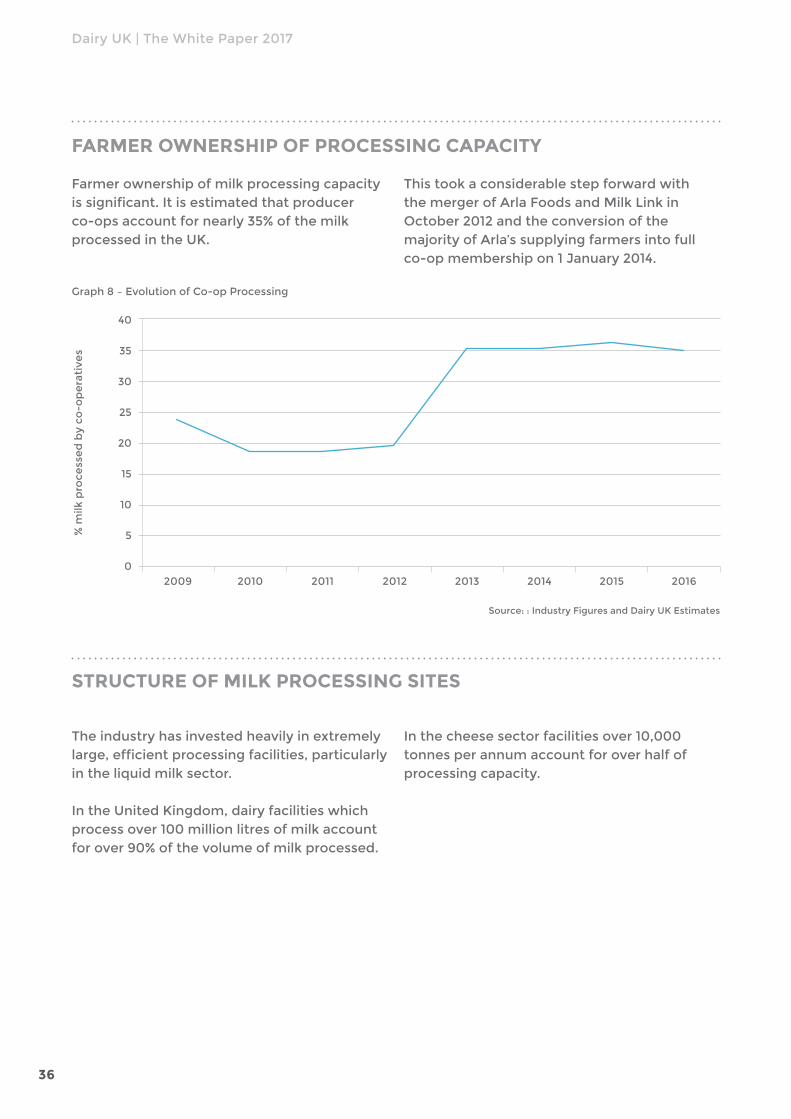
Farmer ownership of milk processing capacity issignificant.Itisestimatedthatproducerco-opsaccountfornearly35%ofthemilkprocessed in the UK.
fARMER OWNERSHIP Of PROCESSINg CAPACITY
ThistookaconsiderablestepforwardwiththemergerofArlaFoodsandMilkLinkinOctober 2012 and the conversion of the majorityofArla’ssupplyingfarmersintofullco-op membership on 1 January 2014.
STRUCTURE Of MIlK PROCESSINg SITES
Theindustryhasinvestedheavilyinextremelylarge,efficientprocessingfacilities,particularlyin the liquid milk sector.
In the United Kingdom, dairy facilities which process over 100 million litres of milk account forover90%ofthevolumeofmilkprocessed.
In the cheese sector facilities over 10,000 tonnes per annum account for over half of processing capacity.
15
40
30
% m
ilk p
roce
sse
d b
y co
-op
era
tive
s
Graph8–EvolutionofCo-opProcessing
Source::IndustryFiguresandDairyUKEstimates
20090
2010 2011 2012 2013 2014 2015 2016
20
35
5
25
10
36

Under 5,000
5,001 – 20,000
20,001 – 50,000
50,001 – 100,000
100,001–300,000
Over300,000
Total
87
3
2
2
3
2
100
130
157
256
675
1,728
10,851
13,797
number %ofTotal Thousandtonnes
318
12
8
9
11
9
367
% of total
1
1
2
5
13
79
100
Source:Defra
Sizeband(tonnesperyear)
numberofenterprises Volumecollected
*SomesmallercompaniesdonotparticipateinthesurveyThesesizedistributionstablesareproducedeverythreeyearsunderCouncilDirective96/16/EC
Table8.SizeDistributionofDairyEnterprisesbyVolumeofAnnualMilkCollection,UnitedKingdom2015*
1,000 and under
1,001 – 10,000
10,001–30,000
30,001–100,000
Over 100,000
Total
3
2
19
109
162
295
Table9.SizeDistributionofDairyCompaniesbyAnnualProductionofDrinkingMilk,UnitedKingdom2015*
number %ofTotal Thousandtonnes
209
15
5
6
7
242
% of total
1
1
6
37
55
100
Source:Defra
Sizeband(tonnesperyear)
numberofenterprises Volumeofmilkproduction
*SomesmallercompaniesdonotparticipateinthesurveyThesesizedistributionstablesareproducedeverythreeyearsunderCouncilDirective96/16/EC
100 and under
101 – 1,000
1,001 – 4,000
4,001 – 10,000
Over 10,000
Total
86
6
2
3
3
100
60
48
104
404
5,874
6,490
Table10.SizeDistributionofDairyCompaniesbyAnnualProductionofCheese,UnitedKingdom2015*
number %ofTotal Thousandtonnes
61
10
10
9
5
95
% of total
1
1
2
6
91
100
Source:Defra
Sizeband(tonnesperyear)
numberofenterprises Volumeofmilkproduction
*SomesmallercompaniesdonotparticipateinthesurveyThesesizedistributionstablesareproducedeverythreeyearsunderCouncilDirective96/16/EC
6.MILKPROCESSInG
37
64
11
11
9
5
100

Dairy UK | The White Paper 2017
Dairy processors, both cooperative and private, have undertaking a high level of investment in the UK. In the time period for which data is available annual capital investment by the top fivedairyorganisationsintheUKexceeded£100mperannumfrom2006to2013.
INVESTMENT bY DAIRY PROCESSORS
Source:DairyUK
Table11.CapitalInvestmentbytheTopFiveUKDairyBusinesses
yeartoMarch
2006
2007
2008
2009
2010
2011
2012
2013
104.5
119.1
139.2
131.2
126.9
133.6
209.9
265.9
Capitalinvestment(£m)
TheUKdairysectorcontinuestoinvestheavilyin the future of the industry and some of the recentsignificantinvestmentprojectshaveincluded;
• ArlaFoodsUKisinvesting£37.5minitsUKsites and logistics, including £5m to develop capacityattheTawValleyCreamery,£5mattheStourtondairy(includinganewpackingfacility),£3matWestburyand£3.5matAylesburytoallowthesitetobeginproductionoffat-freeskimmedmilk;
• MüllerMilk&Ingredientsisinvesting£60mto upgrade its network of fresh milk and ingredients dairies in Britain, including a newfillinglineatFoston,enhancementto facilities at Droitwich and Bridgwater and the creation of a centre of excellence forflavouredmilkandfreshcreamatSevernside.
38

Availabilityofrawmilk
Imports
Totalavailable
for liquid consumption
for manufacture
Butter
Cheese
Cream
CondensedMilk
MilkPowders
yogurt
Other
Wastage and stock change
Exports
-3.4
-48.2
-3.8
-1.5
-7.7
-6.4
+1.9
-9.3
-0.7
-36.2
+6.6
-5.6
+33.6
+7.2
Table12.Average2015dairyconsumptionperpersonperweek
(Millionlitres)% change
2015-16
Source:Defra
2015
14,366
82
14,447
6,627
6,887
278
4,143
289
247
1,040
318
572
208
725
2016
14,865
158
15,023
6,727
7,464
297
4,066
319
249
1,629
298
605
156
677
PRODUCTION Of PRODUCT
AlmosthalfofthemilkpurchasedbyUKdairycompanies and co-operatives is processed intoliquidmilkand29%isusedforcheeseproduction.Afterthesethekeyproductsaremilkpowders(7%)thencream,butterandcondensed milk.
MostUKdairyproduceisultimatelyintendedfor human consumption, and over 70% is produced in consumer packs for sale. Of this the majority are fresh dairy products, either liquid milk or yogurt, that are distributed throughachilleddistributionchain.Ensuringthe rapid, timely and safe distribution of perishable food products throughout the UK, whilst simultaneously responding to change in consumption trends, is one of the core strengths of the UK dairy industry.
TheUKdairyindustryhastomeettheneeds of a range of different customer types, the most important of which are retailers. Other major customer segments
INDUSTRY CUSTOMERS
include wholesale distributors, catering outlets,institutionalcustomers(hospitals,schools,prisons),foodprocessors,tradersand export customers.
6.MILKPROCESSInG
39
Dairy UK | The White Paper 2017
RETAIlERS
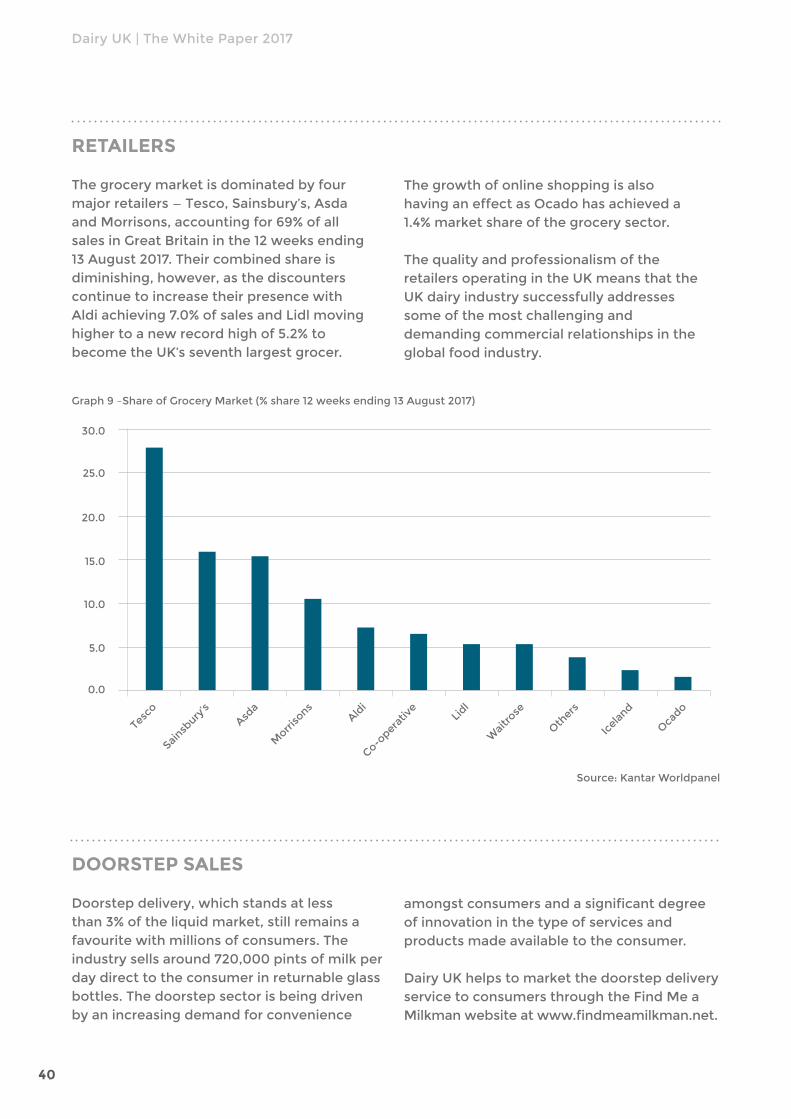
Thegrocerymarketisdominatedbyfourmajorretailers—Tesco,Sainsbury’s,AsdaandMorrisons,accountingfor69%ofallsales in Great Britain in the 12 weeks ending 13August2017.Theircombinedshareisdiminishing, however, as the discounters continue to increase their presence with Aldiachieving7.0%ofsalesandLidlmovinghigher to a new record high of 5.2% to become the UK’s seventh largest grocer.
Graph9–ShareofGroceryMarket(%share12weeksending13August2017)
Thegrowthofonlineshoppingisalsohaving an effect as Ocado has achieved a 1.4% market share of the grocery sector.
Thequalityandprofessionalismoftheretailers operating in the UK means that the UK dairy industry successfully addresses some of the most challenging and demanding commercial relationships in the global food industry.
Source:KantarWorldpanel
Tesc
o
Sainsb
ury’s
Asda
Co-oper
ativ
eLi
dl
Waitr
ose
Oth
ers
Icela
nd
Oca
do
Morri
sons
0.0
5.0
10.0
15.0
20.0
25.0
30.0
Aldi
DOORSTEP SAlES
Doorstep delivery, which stands at less than3%oftheliquidmarket,stillremainsafavouritewithmillionsofconsumers.Theindustry sells around 720,000 pints of milk per day direct to the consumer in returnable glass bottles.Thedoorstepsectorisbeingdrivenby an increasing demand for convenience
amongstconsumersandasignificantdegreeof innovation in the type of services and products made available to the consumer.
Dairy UK helps to market the doorstep delivery servicetoconsumersthroughtheFindMeaMilkmanwebsiteatwww.findmeamilkman.net.
40

OUT Of HOME CONSUMPTION
Thesaleoffoodanddrinkforconsumptionoutside the home slowed during the recession but emerging fast food concepts, coffee shops and the proliferation of the street food movement are some of the contributory
INgREDIENTS SECTOR
Thiscoverstheuseofmilkproductsasaningredientinfoodprocessing.Thiscanrangefrom biscuits, cakes and confectionery to ready-made meals. It is an enormously diverse
factors behind an estimated 2.1% growth in value for the UK’s eating out sector in 2016, accordingtoIGD.Theprospectsfortheoutof home sector remain good, with the market forecasttogrowat0.9%annuallyto2021.
sector and the fragmented nature of this marketmeansthatlittledataisavailable.Thissector continues to grow as consumers eat more processed and prepared foods.
6.MILKPROCESSInG
41
DAIRyUKISCALLInGOnTHEGOVERnMEnTTO;
• RecognisethatdairyprocessingintheUKisdynamicandinnovative,providingUKandglobalconsumerswithhighquality,nutritious,safeandsustainabledairyfoodsandingredients;
• EnhancetheremitoftheGroceryCodeAdjudicatortocoversmallerretailersandthefoodservicesector;
• ToworkwiththeindustrytoensurethatcompetitionlawcansupportthedynamicandentrepreneurialnatureoftheUKdairysector,givingittheflexibilitytothrive.

Dairy UK | The White Paper 2017
42

fOOD SAfETY, QUAlITY AND INTEgRITY
7.
43

Dairy UK | The White Paper 2017
Maintainingconsumerconfidenceandtrustinthehealthinessandwholesomeness of dairy products is at the heart of all industry activity. Strictrulesandregulations,aswellascomprehensiveduediligence,ensuresthat the British dairy industry has measures in place to guarantee that the products it sells to the public are free from harmful contaminants and that they are of the highest quality.
In fact, the British dairy industry has put in place one of the most stringent safetyandqualitysystemsinEurope.Thisisaresultoftheimportancethatthe sector places on the excellence of dairy products sold in the UK and abroad.
ANTIbIOTICS
Given the challenge posed by antimicrobial resistance, the British dairy industry is particularly focused on ensuring that antibiotic exposure through the dairy supply chain is kept to a minimum.
Therearemanyapproachestothecontrolofantibioticresiduesinmilk.Theprimarycontrol is on farms and begins with the correct prescription and administration of antibiotics and the careful adherence to withdrawal periods. In short, milk producers must ensure that milk from animals under treatment or in the withdrawal period does not enter the food chain.
Thiscontrolatfarmleveliscomplementedbythe testing of milk for antibiotics undertaken by food businesses at various points in the supplychain.Thisincludestestingoftankersarriving at the dairy processing centres, as well as a representative number of samples from farm bulk tanks.
TheVeterinaryMedicinesDirectorate(VMD)- the UK Government agency responsible for monitoring foods for veterinary medicine residues–hasfoundthat99.9%ofmilksamples have been free of antibiotic residues
overthepastthreeyears.Thisisatestamentto the effectiveness of the industry’s internal safety checks.
nevercomplacent,theBritishdairyindustrycontinues to work hard to minimise the risk of antibiotic residues in milk and does so through a number of cross-sectoral working groups. Ongoingactivitiestoachievethisinclude;
• Deliveringtraining,educationandinformationtofarmersandvets;
• Strengtheningtestingpractices,includingliaising with diagnostic companies to optimise individual test kits.
Forexample,MilkSureisatrainingprogrammedevelopedbyDairyUKandtheBritishCattleVeterinaryAssociationwhichwaslaunchedin2016.ThiscourseisaimedatBritishdairyfarmers and their employees and is provided by vets for their own clients, using a workbook andotherlearningmaterials.Thecoursecovers all the technical and practical aspects necessary to safeguard residue free milk, and aCertificateofAchievementisawardedtothose who complete the training and pass an online test.
44

ANTIMICRObIAl RESISTANCE
Parallel to minimising the risk of medicines residues in milk, to proactively address the issueofAntimicrobialResistanceinApril2017theindustryformedtheDairyAntimicrobialStewardshipGroup.Thegrouphastheremitto create an overarching strategy for achieving the targets for the reduced used of antibiotics beingdevelopedbytheRUMA(ResponsibleUseofMedicinesinAgricultureAlliance)TargetsTaskForce.Thestrategywillidentifythe responsibilities and actions required from organisations participating in the group and other actors within the dairy industry supply chaintoreduce,refineandreplaceantibioticsuse in the dairy herd.
THE DUE DIlIgENCE SCHEME
Anumberofdairyprocessingcompaniesparticipate in the Dairy UK Due Diligence Scheme,whichregularlytestsmilkforarange of substances including heavy metals, mycotoxins, pesticides, veterinary medicines and biocides.
TheSchemeisagreatsuccessamongstdairy companies, and provides them with an effective tool to satisfy themselves, as well as officialinspectorsandcustomers,thatmilkdelivered to consumers is always safe and of the highest quality.
TheSchemeisconstantlyreviewedinordertoensure that the scope of the testing is up-to-dateandinlinewithrelevantnationalandEUlegislation,traderequirementsandfindings
from horizon scanning activities. If abnormal results are detected, further testing is carried out and corrective actions are implemented.
PROTECTED fOOD NAMES AND COMPOSITIONAl STANDARDS
In terms of food quality, the British dairy sector strives to achieve the highest possible standards for its consumers.
AnumberofBritishcheeses-suchasWestCountryFarmhouseCheddar,WhiteandBlueStilton,andSingleGloucester–arelistedintheEUregisterofprotectedfoodnames;thisprovidesthepublicwiththeconfidencethateach one of these products is made in the same geographical area and respecting the same methods of production. Protected food names are important tools for protecting great British products from imitations.
In the UK, the nutritional composition of a wide variety of British cheeses and different types of creams are also currently protected through standards contained in theFoodLabellingRegulations1996.TheannouncementthattheseRegulationswillbe revoked in December 2018 has caused concern amongst the dairy sector as it is believed that, over time, the quality of the cheeses and creams could be affected. For this reason, the industry is working towards thedevelopmentofanIndustryCodeofPractice, which will build on the existing standards in order to ensure the consumer continues to have access to high-quality dairy products in the UK.
7.FOODSAFETy,QUALITyAnDInTEGRITy
45

Dairy UK | The White Paper 2017
fOOD INTEgRITY
Followingthehorsemeatscandalin2013,theElliotReviewwaspublishedin2014toreviewthe integrity of the UK food supply chain and to make recommendations to prevent food fraud and protect consumers.
TheBritishdairysectorhasalreadytakenmajor steps towards restoring consumer confidenceandprotectingbusinessesfromfood crime, including product and ingredient testing, horizon scanning activities and information sharing with a wide range of stakeholders.
Dairy companies in the UK will continue to strengthen their engagement in this area to guarantee the integrity and authenticity of their products.
46
DAIRyUKISCALLInGOnTHEGOVERnMEnTTO;
• Workcollaborativelywiththeindustrytounderstandcurrentpracticesforminimisingantibioticresiduesinmilk,andhelpbuildontheseinaneffectiveandconstructiveway;
• Retainthecompositionalstandardsoncreamandcheesepost-2018,andworkcloselywiththe industry to identify the appropriate actions and next steps in achieving this.
HEAlTH & SAfETY AND TRAININg
8.
47
Dairy UK | The White Paper 2017
Thedairysectoriscommittedtotheprotectionanddevelopmentofitsstaff.
HEAlTH & SAfETY
HealthandSafetyinthedairyprocessingindustry continues to improve, with an accidentratein2014/15of451/100,000workers,whichislessthanhalfthefigureofthree years ago, but the industry’s aim is to improve this further.
Thetoptwoaccidentsinthedairyprocessingindustryremainslips&tripsandmanualhandling which represent almost two thirds ofthetotal.Thedairyprocessingindustryemploys23,000people,whoworkfor400 companies, both a mixture of large employersandSME’s,andapartfromthe health and safety considerations in processing they are also a large distributor ofproducts,whichinitselfprovidesspecifichealth and safety risks in retail, wholesale and doorstep delivery businesses.
Due to the improved safety of the dairy industry,itwasmovedbytheHealthandSafetyExecutive(HSE)in2015fromitshighestcategoryA(proactiveintervention/inspection)intocategoryB(targetedproactive intervention on particular processes, occupational groups or duty holders).
TheHSEprovidessupporttotheDairyUKOccupationalHealthandSafetyCommittee(OHSC),whichismakingstringenteffortstofurtherreduceaccidentratesby;
• Providingoccupationalhealthandsafetyleadership and direction to its members through engagement with large and small tomediumsizedorganisations;
• Promotingcompetenceacrosstheindustrythrough the application of good practice andHSEguidance,togetherwithsafebehaviours;
• Includingthewholesupplychainfromfarm collection to customer distribution, encompassing the work of third party contractors, employees and trade unions.
• Ensuringriskstohealtharewellknownandprovide a focus to reduce occupational ill healthinkeyriskareas;
• Identifyingandpromotingmeasureswhichcan help dairy companies to improve their healthandsafetyculture;
• Deliveringgoodpracticeguidesforthebenefitofallmembers.
ThecurrentfocusisonpromotionoftheFoodandDrinkManufactureForum’sCommonStrategydocument2016-2021andencouragingmembers to sign up to the voluntary pledges to support the health and safety improvement objectivesoutlinedwithinit.Theseinclude;
• ReducingtheHSERIDDOR(Reportingof Injuries, Diseases and Dangerous OccurrencesRegulations2013)reportableill-health and injury rate for the food and drink manufacturing sector by 10% year-on-year;
• EffectivemanagementofMusculoskeletalDisorder risks and slip and trip risks by member companies, including introduction ofactionplansandtask-specifictraining;
• MembercompaniesdeployinganeffectiveOccupationalHealthmanagementsystemanddevelopingcloserlinkswithOHproviders.
48

TRAININg
Atbothafarmingandprocessinglevel,theUK dairy sector is undertaking a range of training and knowledge transfer initiatives, to better equip future farmers and employees with skills for the future.
PROjECT EDENWith a skills shortage within the technical areas of production and developments in technology changing employee skill sets, the industry decided to invest in recruiting and training young people and help equip them for a rewarding and varied career in thedairyindustry.Asaresulttheindustryhelped set up a world-class, three year degreecourseatReaseheathCollege,calledProjectEden.
ThecoursewasdevelopedbyDairyUKmembers,alongwithReaseheathCollegeandthenationalSkillsAcademyforFoodandDrink.Studentsonthecoursebenefitfrom state-of-the-art dairy facilities, built in 2010 and costing around £2.7m, meaning they can work with cutting edge technology and research while they train.
TheinvolvementofDairyUKmembersalong with other key industry bodies in the development of the course has meant that students graduate with the full range of skills the industry needs, regardless of the company they go on to work for.
ReaseheathhasoneofitsbiggeststudentintakeseverfortheProjectEdencoursethis year, with over 40 students enrolling to begin study.
THE AgRICUlTURE AND HORTICUlTURE DEVElOPMENT bOARD (AHDb) AND DAIRY PROAspartoftheirremit,AHDBDairyseektodeliver sector-tailored knowledge transfer programmes, based on evidence from targeted research and development and third-partyscience.Theiraimisultimatelyto improve business performance and the efficiencyofmilkproductionsystems.
AHDBresearchdemonstratesthatthosewhokeep up-to-date with industry knowledge, best practice and management skills, and encouragetheirstafftofollowsuit,findthebenefitsofdoingsoreflectedintheprofitabilityoftheirbusinesses.Inrecognitionofthebenefitsofprofessionallearninganddevelopment,in2012DairyProwaslaunched;a specialist professional development schemeforthedairyindustry.Createdforthe industry, by the industry, Dairy Pro recognises that professional learning is linked to improved motivation, greater productivity and ultimately better business success.
Dairy Pro supports those working in the dairy sector to access key learning and development materials, providing information on training events, online courses, access to information such as journals and a place to record and store all learningactivities.Memberscanbuilduppointsandbecome‘DairyProEndorsed’,using this hallmark to publically demonstrate to those in the industry and outside of it that theyhaveafirmcommitmenttoprofessionaldevelopment.
8.HEALTH&SAFETyAnDTRAInInG
49
Dairy UK | The White Paper 2017
DairyPro;• Aimstobeaonestopshopforquality
traininginformation;• Providesanonlinerecordofprofessional
skillsandlearning;• Promotesanefficientandprofitable
industry;• Supportsandencourageslife-longlearning;• Demonstratesprofessionalismwithinthe
industry to both consumers and legislators.
With the scheme’s membership now exceeding 1,400 members and with over 110 training partners UK wide, Dairy Pro as a brand is becoming ever more recognisable as a quality standard to industry companies and farm workers.
Further information on the scheme is available at: www.dairypro.co.uk.
50
DAIRyUKISCALLInGOnTHEGOVERnMEnTTO;
• SupporttheworkoftheHealthandSafetyExecutiveinitsengagementwiththedairysectorto implement strategies that will help companies improve health and safety culture and furtherreduceinjuryaccidentrates;
• Recognisetheimportanceofensuringacontinuedsupplyoftrainedlabourtothesectorandto support industry initiatives that address this issue.

CONSUMERS AND MARKETINg
9.
51

Dairy UK | The White Paper 2017
TheUKdairyindustry’scoreexpertiseisinmeetingtheneedsofconsumermarkets.Themajorityofoutputispre-packedgoodsintendedfor direct consumption. UK dairy products are integral to the diet of thenation,butconsumerpreferencesareconstantlyevolving.TheUKdairy industry has responded to this dynamic market environment with sustained product development, innovation and branding, backed up with successful marketing initiatives.
MARKET PENETRATION
Dairy products can be found in almost every householdintheUK.Thisgivesthedairyindustry one of the highest degrees of market penetration of any consumer product and makes dairy foods extremely important to the health and well-being of the nation.
ThemostrecentMintelmarketresearchreportsshowthat;
• 87%ofrespondentshaveusedcow’smilkinthethreemonthstoFebruary2017;
• 94%ofUKadultsbuycheese,demonstrating that it is well established as ahouseholdstaple;
• 78%ofadultseatspoonableyogurt/fromagefraiswithoverhalfofthose(51%)doing so twice a week or more.
(Sources:Mintel)
PRODUCT CONSUMPTION TRENDS
Prospects seem bright for the liquid and cheese sectorswiththelatestfiguresshowinggrowthfor both volume and value over the past year.
AccordingtoDefra’sauthoritativebuthistoricFamily Food publication, consumption of cheese, cream, yogurt and butter all increased during 2015.
Totalcheese
Hardcheese–Cheddar
Hardcheese–otherUK
Hardcheese–foreign
Cottage,softnaturalor
processed cheese
Cream
yogurtandFromageFrais
Condensedmilk
Dairy desserts – fresh
Butter
+1.5
+2.4
-3.3
+3.1
+0.6
+2.4
+1.9
-16.6
-3.2
+5.1
Table13.Average2015DairyConsumptionPerPersonPerWeek
Product% change
vs 2014
Source:‘FamilyFood’publishedbyDefra
112g
62g
7g
7g
36g
24ml
194ml
14ml
37ml
43g
Quantity
52
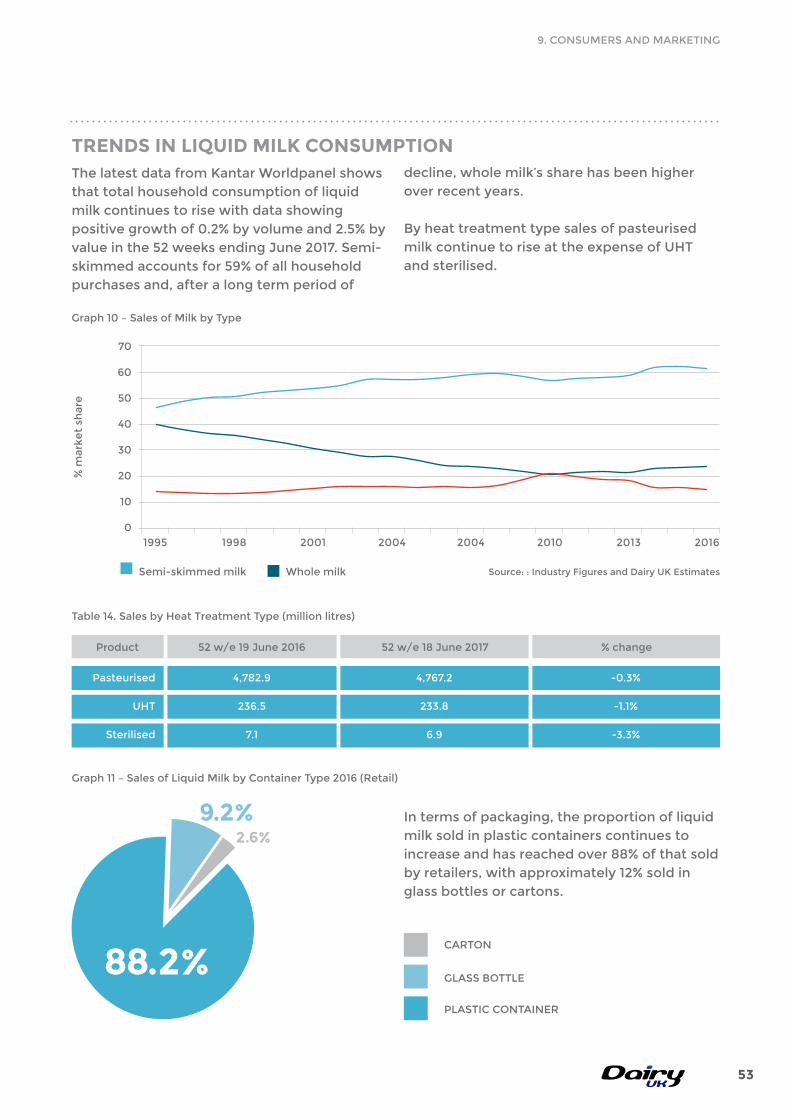
Pasteurised
UHT
Sterilised
-0.3%
-1.1%
-3.3%
Product % change
4,767.2
233.8
6.9
52w/e18June201752w/e19June2016
4,782.9
236.5
7.1
In terms of packaging, the proportion of liquid milk sold in plastic containers continues to increase and has reached over 88% of that sold by retailers, with approximately 12% sold in glass bottles or cartons.
CARTOn
GLASSBOTTLE
PLASTICCOnTAInER
88.2%
9.2%2.6%
Table14.SalesbyHeatTreatmentType(millionlitres)
Graph11–SalesofLiquidMilkbyContainerType2016(Retail)
ThelatestdatafromKantarWorldpanelshowsthat total household consumption of liquid milk continues to rise with data showing positive growth of 0.2% by volume and 2.5% by valueinthe52weeksendingJune2017.Semi-skimmedaccountsfor59%ofallhouseholdpurchases and, after a long term period of
decline, whole milk’s share has been higher over recent years.
By heat treatment type sales of pasteurised milkcontinuetoriseattheexpenseofUHTand sterilised.
TRENDS IN lIQUID MIlK CONSUMPTION
70
30
% m
arke
t sh
are
Graph10–SalesofMilkbyType
Source::IndustryFiguresandDairyUKEstimates
0
20
50
40
10
1995 1998 2001 2004 2004 2010 2013 2016
60
Semi-skimmedmilk Whole milk
9.COnSUMERSAnDMARKETInG
53

Dairy UK | The White Paper 2017
CHEESE
GB retail sales of cheese continue to grow year-on-year with 2016 recording an increase of2.8%involumeterms.Aslightfallintheaveragepricehasledtoamarginal(0.3%)fallin value to £2.75bn.
Allcategoriescontributedtotheoverallgrowth,Cheddar(+0.9%),HardContinental
(+4.0%),SoftContinental(+9.9%),Territorials(+5.1%)andProcessed(+3.1%).
Cheddarretainsitsshareofthesector,accounting for just over half of all purchases, but the proportion of mild varieties continues todecline,reflectingconsumer’spreferencefor more mature varieties.
OTHER fRESH DAIRY PRODUCTS
yogurtisthestarperformer,asfreshdairyproductscontinuetogrowsteadily.Akeydriver of growth in this sector has been the rise in consumption of functional foods, such as probiotic and prebiotic yogurts and yogurt drinks.LatestdatafromMintelshowthataquarter of all adults eat spoonable yogurt and aquarterdrinkyogurt/fermentedmilkdrinks.
Minteldata(May2017)showsthatyogurtappeals to the health-conscious with 58% of spoonableyogurtbuyersbeinginfluencedbyhealthconsiderations.Allnaturalingredientsand no added sugar also denote healthiness formanyyogurt/yogurtdrinksusers/buyers.
Source:‘FamilyFood’publishedbyDefra
yogurt
Fromage Frais
Cream
Dairy desserts
599
59
83
127
Table15.UKAnnualConsumptionPerPersonofFreshDairy Products
598
68
85
140
585
67
68
136
Product 2005/6 2012 2013 2014 2015
626
52
84
129
607
55
80
132
Sugarconcernshaveprompted40%ofspoonableyogurteaters/buyerstoswitchto yogurt in place of other desserts. Consumptionisalsounderpinnedbytherisingnumbers of children and older people that are traditionally strong purchasers of yogurts.
Tota
l
Cheddar
Mild
Ched
dar
Med
ium
Ched
dar
Mat
ureC
heddar
Extra
Mat
ureC
heddar
Oth
erC
heddar
Terri
toria
ls(e
x.b
lue)
SoftContin
enta
l
HardC
ontinen
tal
Proce
ssed
Chee
se
Oth
erC
heese
Branded
Ched
dar
Privat
eLa
belC
heddar
500,000
450,000
400,000
350,000
300,000
250,000
200,000
150,000
100,000
50,000
0
ton
ne
s
2015
2016
Graph12–HouseholdSalesofCheesebyTypein2015and2016
54

CONSUMER CHOICE
Income pressures affect consumer choice with the industry adapting its product proposition and pricing strategies.
Thisisreflectedbypriceremaining,bysome distance, the main consideration in purchasing patterns, with familiarity with the product also being a determining factor inselection.Thefreshnessoftheproductalso rates highly with the use or sell by dateandqualitystronginfluencesbehindconsumer choices.
Source:IGD
Table16.MacroDriversofProductChoice
DriversofConsumerChoiceRankings2016
1
2
3
4
5
6
7
8
Price
Familiarity with product
Use or sell by date
Quality
Healthyoption
Tasteorsmell
Brand
Specialoffers
Healthyeatingisdrivingdairyproductdemand. In response to public concern about obesity and calorie intake the industry has generated a comprehensive range of lower fat varietiesofdairyproducts.Thisbegandecades
ago with semi-skimmed and skimmed milks, and it is still continuing for liquid milk with the developmentof1%andbelowfatmilks.Lowfatandreducedfat“lighter”cheeseshavealsoseen positive growth.
HEAlTHY EATINg AND DAIRY PRODUCTS
INNOVATION
Theindustryinvestsinproduct innovation and ranks alongside major Europeancompetitorsincommitment to this area.
Graph13–Top10EuropeancountriesinDairyProductLaunchActivity–
%ofTotalResultset(Q32016–Q22017)
France
Germany
Spain
United K
ingdom
Russia
Italy
net
herla
nds
Belgiu
m
Austria
Poland
0.0%
0.0%
0.0%
0.0%
0.0%
0.0%
0.0%
0.0%
11.5%10.8%
8.9%
7.5% 7.2%6.1% 5.7%
3.8%3.1% 2.7%
Source:InnovaMarketInsights
9.COnSUMERSAnDMARKETInG
55
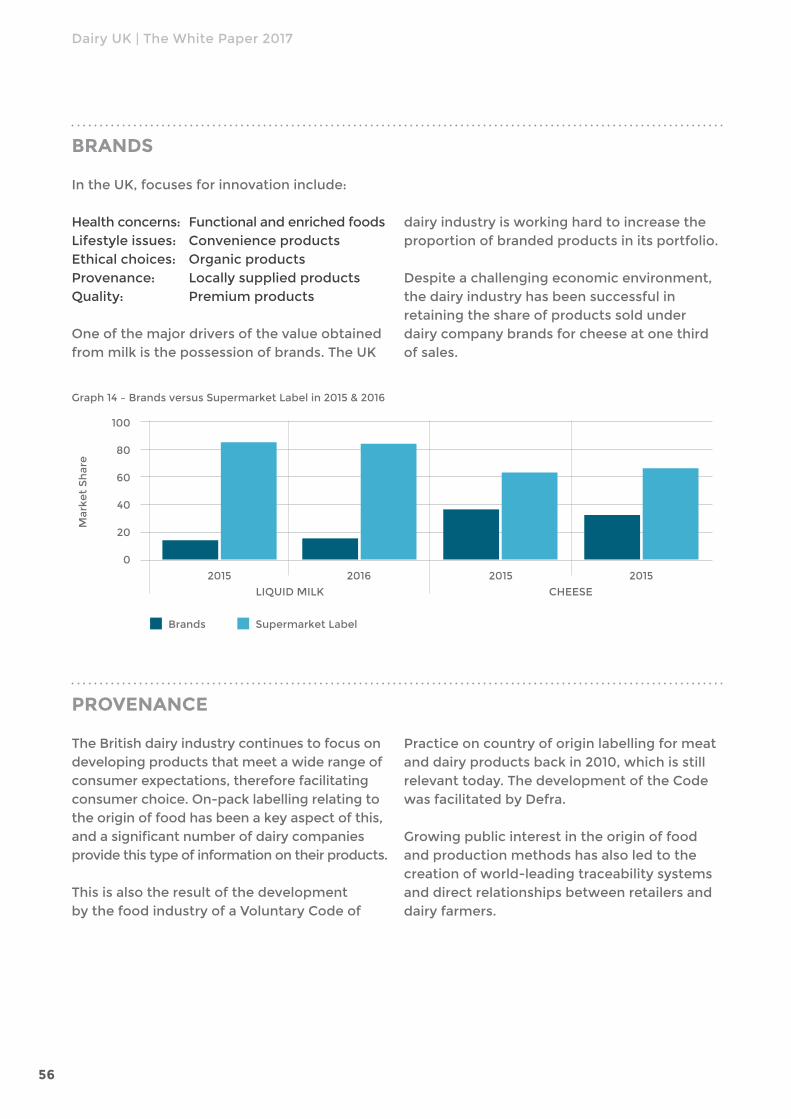
Dairy UK | The White Paper 2017
bRANDS
In the UK, focuses for innovation include:
Healthconcerns:FunctionalandenrichedfoodsLifestyleissues: ConvenienceproductsEthicalchoices: OrganicproductsProvenance: LocallysuppliedproductsQuality: Premiumproducts
One of the major drivers of the value obtained frommilkisthepossessionofbrands.TheUK
Graph14–BrandsversusSupermarketLabelin2015&2016
dairy industry is working hard to increase the proportion of branded products in its portfolio.
Despite a challenging economic environment, the dairy industry has been successful in retaining the share of products sold under dairy company brands for cheese at one third of sales.
0
20
40
60
80
100
2015 2016 2015 2015
LIQUIDMILK CHEESE
Mar
ket
Sh
are
Brands SupermarketLabel
PROVENANCE
TheBritishdairyindustrycontinuestofocusondeveloping products that meet a wide range of consumer expectations, therefore facilitating consumer choice. On-pack labelling relating to the origin of food has been a key aspect of this, andasignificantnumberofdairycompaniesprovide this type of information on their products.
ThisisalsotheresultofthedevelopmentbythefoodindustryofaVoluntaryCodeof
Practice on country of origin labelling for meat and dairy products back in 2010, which is still relevanttoday.ThedevelopmentoftheCodewas facilitated by Defra.
Growing public interest in the origin of food and production methods has also led to the creation of world-leading traceability systems and direct relationships between retailers and dairy farmers.
56

AccordingtotheOrganicMilkMarketReport2017, dairy is the largest organic food and drinksector,worth£344minretailsalesandrepresenting29%ofallUKorganicfoodanddrink sales.
Salesoforganicdairygrewby2.2%in2016and this was mainly driven by organic milk (3.3%to£150m)andyogurt(0.5%to£149m),
2012
2013
2014
2015
2016
2.58
2.69
2.51
2.43
2.72
Table17.RetailSalesofAllMilkandOrganicMilk(MillionLitres)
% of total sales
133.9
141.8
135.9
133.6
149.1
OrganicAllmilk
5,179.9
5,273.0
5,419.9
5,495.7
5,476.7
Source:AHDBDairy,KantarWorldpanel
ORgANIC MIlK AND DAIRY PRODUCTS
withcheese(3.8%to£25m)andbuttersandfats(4.2%to£20m),alsocontributingtothegrowth, albeit from lower bases.
Organic retail milk sales have recovered (4.4%overthelastyear)andtherehasbeenasignificantincreaseinhouseholdpenetrationwith 1 in 4 households now purchasing organic milk.
9.COnSUMERSAnDMARKETInG
57
Dairy UK | The White Paper 2017
EU SCHOOl MIlK SCHEME
Thedairyindustrypayscarefulattentiontotheschool and nursery milk market as it helps to cultivate consumption habits that last a lifetime. TheEUandtheUKauthoritiesprovidesupportformilkconsumptionatthisage;freemilkisavailabletounder-fivesinregisterednurseriesand subsidised milk is available for a number of pupils in primary and secondary education.
TheEUgivesamodestsubsidyforliquidmilkand yogurt consumed by school children throughitsSchoolMilkSubsidyScheme(thevolume was 25,282 tonnes in the UK during the 2015/16schoolyear).Thecurrentsubsidyratesare€0.19perlitrefromtheEUandafurther4pperlitre“top-up”fromtheGovernmentforchildreninprimaryeducation.InnorthernIreland,the4p“top-up”isalsopayableonmilksupplied to children in secondary education. In Wales, the Welsh Government funds an additional top-up to provide free milk to childreninKeyStage1education.
newEURegulationsbecameapplicablefromthe2017/18schoolyear.ChangestoUKscheme arrangements have been minimised as far as practicable pending review to ensure a smoothtransitionfollowingEU-exit.
DAIRyUKISCALLInGOnTHEGOVERnMEnTTO;
• SupporttheworkoftheHealthandSafetyExecutiveinitsengagementwiththedairysectorto implement strategies that will help companies improve health and safety culture and furtherreduceinjuryaccidentrates;
• Recognisetheimportanceofensuringacontinuedsupplyoftrainedlabourtothesectorandto support industry initiatives that address this issue.
58

DAIRY AND NUTRITION10.
59

Dairy UK | The White Paper 2017
TheBritishdairyindustryhasalreadyinvestedsignificantlyinreformulatingexistingproductsand developing new ones in order to support consumer choice, and will continue to do so through rigorous product research and development.
MilkanddairyproductsprovideauniquearrayofnutrientstotheBritishdiet.Milkishighinqualityprotein,calcium,iodine,B12,riboflavinand is a source of phosphorus, B5 and potassium.Thedairyfoodgroupasawholecontributesasignificantamountofnutrientsto the British diet.
ThelatestnationalDietandnutritionSurvey(nDnS)showsthatmilkandmilkproductscontribute35%-40%ofcalciumintakesto adult and teen diets, respectively, and over47%tochildren’sdiets.Around15%ofadult and teen protein intakes come from milk and milk products, and contributes a significantlyhigheramount(22%-35%)tothe diets of children under 10 years. Dairy alsocontributestoabout30%ofadultandteenriboflavinintakes,andcontributes42-58% to children’s diets. Whilst milk and milk products are not classed as a source ofvitaminA(exceptforfull-fatcheese)or
Milkanddairyproductsnaturallycontainauniquearrayofprotein,vitamins and minerals, and have an important role to play in the improvement of the British diet. It is crucial that Government takes into accountthebenefitsofconsumingdairyproductswhendevelopingnutritional strategies and recommendations.
zinc,nDnSdatashowstheystillcontributeasignificantamountofthesenutrientstotheBritish diet.
Milkandmilkproductsalsocontributeasignificantamountofiodinetochildren’s(54-67%),teen(67%)andadult(54%)diets,alike.Iodine is a little known nutrient, it makes up part of the thyroid hormones which help to release energy from food and regulate growth. Iodine also contributes to brain and nerve function, and helps maintain healthy skin. However,TheWorldHealthOrganisationhasstated that sections of the British population have‘mildtomoderate’iodinedeficiency.Surveydatashows1in4teenagegirlsand11%of adult women do get enough iodine from their food. Furthermore, research from the UniversityofSurreylinkedpooriodineintakeinschoolgirlsandyoungwomentolowIQscoresinchildren.Theroleofmilkanddairyinpreventingiodinedeficiencyisstartingtoreceiveattention.Similarly,researchsuggestsVitaminB12maybeasimportantasfolicacidin the prevention of neural tube defects during pregnancy.Aglassofmilkprovides41%oftheUK’s recommendation for iodine, 74% of B12, 35%riboflavin,31%calcium,23%B5and28%phosphorous.
60

THE CHIlDHOOD ObESITY PlAN
TotacklerisingobesitytheUKGovernmentistaking steps towards addressing poor dietary choices.TheGovernment’sChildhoodObesityPlanlaunchedin2016aimstosignificantlyreduceEngland’srateofchildhoodobesitywithin the next ten years. Key measures include the introduction of a sugar levy on soft drinks and of a sugar reduction programme for a number of food categories, and the revisionofthenutrientprofilingmodelusedfor determining which foods can be advertised to children on broadcast and non-broadcast channels.
Milkanddairyproductshaveanimportantpart to play in the improvement of the nation’s diet, and the dairy industry strives to produce nutritious products, making sure that the highest quality research informs its efforts. It is crucial that Government initiatives and other campaignstakeintoaccountthebenefitsof consuming dairy products when making dietary recommendations.
THE SOfT DRINKS INDUSTRY lEVY
Toencourageproducersandimportersofsugar-sweetened soft drinks to reformulate their products to reduce the added sugar contentalevywillapplyfromApril2018tosugar-sweetenedsoftdrinks.Alowerratewill apply to sugar-sweetened drinks with a totalsugarcontentofatleast5g/100mlanda higher rate will apply to drinks with at least 8g/100ml.
In light of milk’s natural nutrient-richness, milk-based drinks with over 75% milk contentwillbeexemptfromthetax.Thisisan important step towards recognising the significantcontributionsthatthesedrinksmaketo children and teenagers’ intakes of protein, calcium, phosphorus, potassium, iodine, riboflavinandvitaminB12.Thesenumbers
acquire particular importance when considering thatsignificantproportionsofthosesameagegroups do not meet recommended intakes for a number of those essential nutrients from the food they eat. For children who do not consume plain milk, these products can be an important source of essential nutrients in their diets and it is important for national legislation to recognise this.
SUgAR REDUCTION PROgRAMME
Thefoodanddrinksindustryhasbeenchallenged to reduce overall sugar across a range of products by at least 20% by 2020.
TheBritishdairyindustryhasalreadyinvestedsignificantlyintoreformulatingexistingproducts and developing new ones in order to support consumer choice, and will continue todoso.Continuousproductresearchanddevelopment is at the core of this effort.
However,thedairyindustrywelcomesthefactthat the naturally-occurring sugar lactose has been excluded from the Government’s sugar reduction programme in recognition of the fact that – contrary to other types of sugar - it has not been shown to cause any adverse effect onhealth.Thedistinctionbetweendifferenttypes of sugars is fundamental and needs to be included in Government strategies.
THE DEPARTMENT Of HEAlTH NUTRIENT PROfIlINg MODEl
TheGovernmentisintheprocessofreviewingtheDepartmentofHealthnutrientprofilingmodel for determining which foods can be advertised to children in the UK via broadcast andnon-broadcastchannels.Themodelachieves this by using thresholds for calories, salt, sugars and fat.
10.DAIRyAnDnUTRITIOn
61

Dairy UK | The White Paper 2017
Currently,thevastmajorityofcheeseswouldnot be able to be advertised due to their saturatedfatcontent.However,cheeseisanutrient-rich food which contains a number of essential minerals and vitamins such as calcium. Calciumisestablishedasbeingessentialduringthe critical phases of growth of childhood and adolescence, as it helps achieve peak bone mass and reduce risk of osteoporosis later inlife.Researchalsopointstothebeneficialeffects of cheese on oral health, which is vital considering that so many children in the UK suffer from poor dental health.
Thecheeseindustrycannotmeetthecurrentnutrientprofilingmodelrequirementsregardless of whether it reformulates its productsornot.Ahardcheese,evenwiththelowest achievable fat content, does not qualify under the current model, owing also to the fact it is based on 100g rather than on portion size.
Given the nutrient-richness of cheese and the fact that it contributes only 2% to the calorie intake of children and adolescents aged 4-18 years, the dairy industry is advocating that the nutrientprofilingmodelexemptthecheesecategory.Thisisalreadythecaseincountriessuch as Ireland.
SACN AND SATURATED fAT
TheGovernmentwillconsiderwhethertoimplement a saturated fat reduction programme infoodssoldintheUKoncetheScientificAdvisoryCommitteeonnutrition(SACn)-theofficialscientificadvisorybodytotheUKGovernment on nutritional and dietary issues - publishes its updated recommendations on saturated fat intake in late 2017.
TheDairyCouncilhassubmittedevidencetoSACn’sreviewwhichhighlightsthattheeffectof saturated fat consumption cannot be studied in isolation, but is instead highly dependent on thetypeoffooditiscontainedin.Althoughdairyproducts contain saturated fat, the weight of evidence suggests that certain dairy products may be protective against cardiometabolic disease and that other components in dairy may actually counteract the presence of saturated fat. For example, calcium and bioactive peptides mayhavebeneficialeffectsonbloodpressure.Itis therefore important to consider the complex interplay of nutrients within a food and the effects of whole foods rather than individual nutrients.
62
DAIRyUKISCALLInGOnTHEGOVERnMEnTTO;
• EnsuretheeffectiveimplementationoftheSoftDrinksIndustrylevyonceinforce,andensure that naturally nutrient rich products like milk and yogurt based drinks remain exempt fromthetax;
• Engagewiththedairyindustrytounderstanditstechnicalcapabilitiesintheareaofreformulationandwhatcanandcannotbeachieved;
• Takeintoaccountthewiderangeofessentialnutrientsthatdairyproductssuchasmilk,canprovidetochildrenintheUK;
• EnsurethattheDepartmentofHealthnutrientProfilingModelexcludescheeseinviewofitsnutrient-richnessandthehealthbenefitsitprovides;
• Ensurethattherichinterplayofnutrientsinwholefoodsandtheirpositiveeffectonhealthoutcomes are taken into account in any national dietary advice to consumers.

UK DAIRY AND THE ENVIRONMENT
11.
63

Dairy UK | The White Paper 2017
TheUKdairyindustryrecognisesitsresponsibilitytominimiseitsenvironmental footprint wherever possible so as to ensure the continued sustainability of the sector and to ensure that dairy products can remain apartofthenation’sdietforyearstocome.TheUKdairyindustryhasledthewiderAgri-foodindustryintermsofenvironmentalcommitmentandaction and will continue to work to ensure that it retains its leadership position.Theindustryundertakesamyriadofenvironmentalandsustainabilityinitiatives,foremostofwhichisTheDairyRoadmapwhichprovided a template mirrored by several other countries around the world.
THE DAIRY ROADMAP
TheDairyRoadmapisacross-industryinitiativebetweenDairyUK,AHDBDairy,thenFUandDefrabringingtogetherthedairysupplychain.ThroughtheDairyRoadmap,the UK dairy industry has led the world in committing itself to a plan which aims to reduce the industry’s environmental footprint.
TheDairyRoadmapbeganin2008,settingout a series of targets to tackle the major environmental impacts of producing liquid milk.In2011theRoadmapwasexpandedtoinclude all dairy products.
Overthepastdecade,theRoadmaphasreported success against its targets for 2010 and 2015, whilst setting ambitious targets for 2020 and 2025, which will ensure that the initiative remains at the fore front of the sustainability agenda.
AstheDairyRoadmapapproachesits10-yearanniversary in 2018, we are committed to continuingitsachievements.The2018reportwill aim to celebrate the successes of the past tenyears,whilstreaffirmingourcommitmentto and reporting progress against the targets for2020and2025.Moreinformationcanbefound at www.dairyroadmap.com.
64
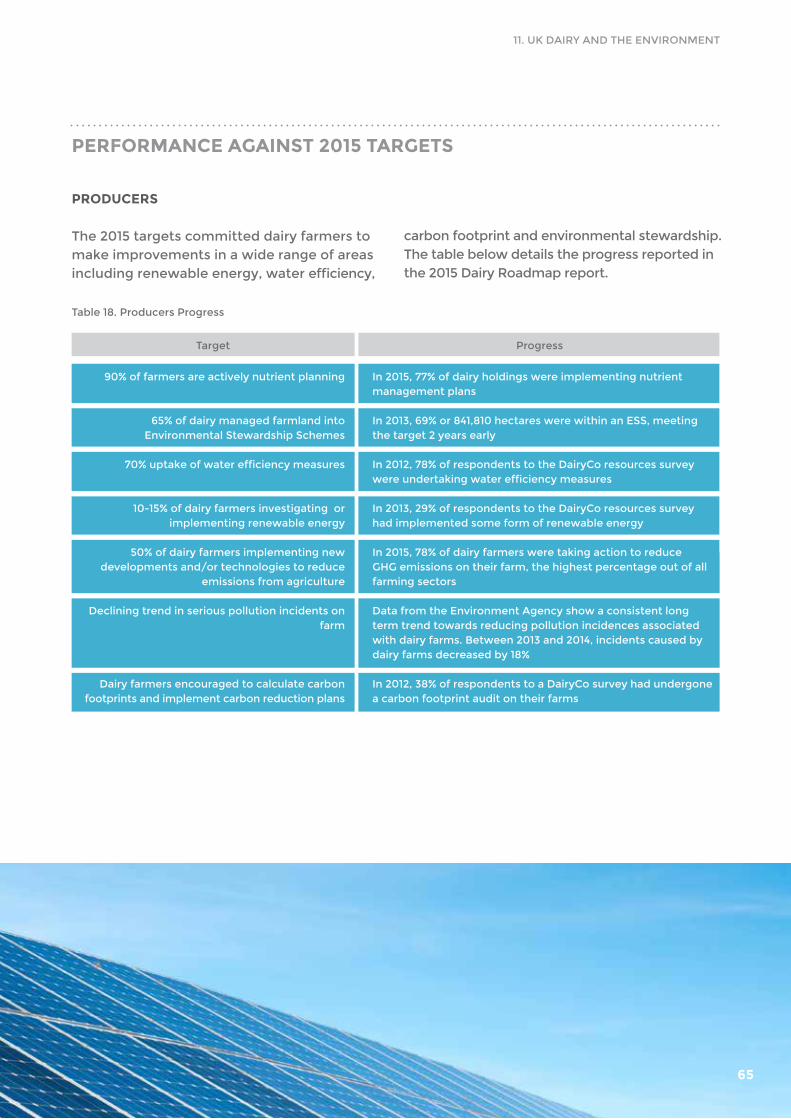
90%offarmersareactivelynutrientplanning
65% of dairy managed farmland into EnvironmentalStewardshipSchemes
70%uptakeofwaterefficiencymeasures
10-15% of dairy farmers investigating or implementing renewable energy
50% of dairy farmers implementing new developmentsand/ortechnologiestoreduce
emissions from agriculture
Declining trend in serious pollution incidents on farm
Dairy farmers encouraged to calculate carbon footprints and implement carbon reduction plans
In 2015, 77% of dairy holdings were implementing nutrient management plans
In2013,69%or841,810hectareswerewithinanESS,meetingthe target 2 years early
In2012,78%ofrespondentstotheDairyCoresourcessurveywereundertakingwaterefficiencymeasures
In2013,29%ofrespondentstotheDairyCoresourcessurveyhad implemented some form of renewable energy
In 2015, 78% of dairy farmers were taking action to reduce GHGemissionsontheirfarm,thehighestpercentageoutofallfarming sectors
DatafromtheEnvironmentAgencyshowaconsistentlongterm trend towards reducing pollution incidences associated withdairyfarms.Between2013and2014,incidentscausedbydairy farms decreased by 18%
In2012,38%ofrespondentstoaDairyCosurveyhadundergonea carbon footprint audit on their farms
Table18.ProducersProgress
ProgressTarget
PERfORMANCE AgAINST 2015 TARgETS
PRODUCERS
The2015targetscommitteddairyfarmerstomake improvements in a wide range of areas includingrenewableenergy,waterefficiency,
carbon footprint and environmental stewardship. Thetablebelowdetailstheprogressreportedinthe2015DairyRoadmapreport.
11.UKDAIRyAnDTHEEnVIROnMEnT
65
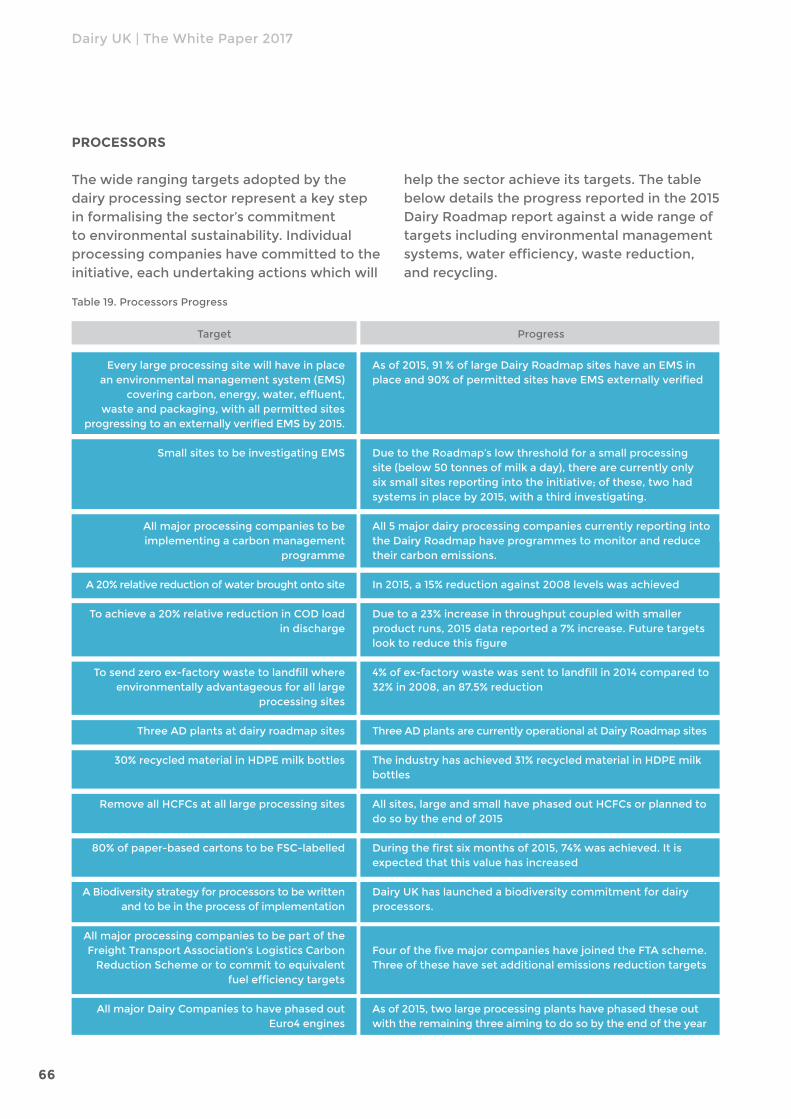
Dairy UK | The White Paper 2017
Everylargeprocessingsitewillhaveinplaceanenvironmentalmanagementsystem(EMS)
coveringcarbon,energy,water,effluent,waste and packaging, with all permitted sites
progressingtoanexternallyverifiedEMSby2015.
SmallsitestobeinvestigatingEMS
Allmajorprocessingcompaniestobeimplementing a carbon management
programme
A20%relativereductionofwaterbroughtontosite
Toachievea20%relativereductioninCODloadin discharge
Tosendzeroex-factorywastetolandfillwhereenvironmentally advantageous for all large
processing sites
ThreeADplantsatdairyroadmapsites
30%recycledmaterialinHDPEmilkbottles
RemoveallHCFCsatalllargeprocessingsites
80%ofpaper-basedcartonstobeFSC-labelled
ABiodiversitystrategyforprocessorstobewrittenand to be in the process of implementation
AllmajorprocessingcompaniestobepartoftheFreightTransportAssociation’sLogisticsCarbon
ReductionSchemeortocommittoequivalentfuelefficiencytargets
AllmajorDairyCompaniestohavephasedoutEuro4engines
Asof2015,91%oflargeDairyRoadmapsiteshaveanEMSinplaceand90%ofpermittedsiteshaveEMSexternallyverified
DuetotheRoadmap’slowthresholdforasmallprocessingsite(below50tonnesofmilkaday),therearecurrentlyonlysixsmallsitesreportingintotheinitiative;ofthese,twohadsystems in place by 2015, with a third investigating.
All5majordairyprocessingcompaniescurrentlyreportingintotheDairyRoadmaphaveprogrammestomonitorandreducetheir carbon emissions.
In 2015, a 15% reduction against 2008 levels was achieved
Duetoa23%increaseinthroughputcoupledwithsmallerproduct runs, 2015 data reported a 7% increase. Future targets looktoreducethisfigure
4%ofex-factorywastewassenttolandfillin2014comparedto32%in2008,an87.5%reduction
ThreeADplantsarecurrentlyoperationalatDairyRoadmapsites
Theindustryhasachieved31%recycledmaterialinHDPEmilkbottles
Allsites,largeandsmallhavephasedoutHCFCsorplannedtodo so by the end of 2015
Duringthefirstsixmonthsof2015,74%wasachieved.Itisexpected that this value has increased
Dairy UK has launched a biodiversity commitment for dairy processors.
FourofthefivemajorcompanieshavejoinedtheFTAscheme.Threeofthesehavesetadditionalemissionsreductiontargets
Asof2015,twolargeprocessingplantshavephasedtheseoutwith the remaining three aiming to do so by the end of the year
Table19.ProcessorsProgress
ProgressTarget
PROCESSORS
Thewiderangingtargetsadoptedbythedairy processing sector represent a key step in formalising the sector’s commitment to environmental sustainability. Individual processing companies have committed to the initiative, each undertaking actions which will
helpthesectorachieveitstargets.Thetablebelow details the progress reported in the 2015 DairyRoadmapreportagainstawiderangeoftargets including environmental management systems,waterefficiency,wastereduction,and recycling.
66

RETAIlERS
Retailersareanimportantandinfluentialpart of the supply chain, forming the link to consumers, but also working increasingly closer with their supplying dairy farmers. Retailers,Asda,theCo-operative,Marks&Spencer,MorrisonsandTescohaveall
provided statements of commitment to theDairyRoadmapanditsaims.newopportunities for engagement with retailers are being explored which will contribute towards to progress being made by producers and processors to meet targets.
fUTURE ROADMAP TARgETS
UndertheDairyRoadmapdairyproducersandprocessors have set wide reaching targets for both2020and2025.Thereisnoendpoint,no
finishlineonenvironmentalsustainabilityandthe sector will continue to challenge itself to keep progressing and innovating in this area.
Toachievea15%improvementinenergyefficiency
20% relative reduction in water brought onto site
A20%relativereductioninChemicalOxygenDemand(COD)inpre-primarytreatmenteffluent
Tosendzeroex-factorywastetolandfill
50%recycledmaterialinHDPEmilkbottles,oritscarbon equivalent reduction
Alltertiarypackagingtobereusableorrecyclable100%ofpaperbasedcartonstobeFSClabelled
100%ofpaperbasedcartonstobeFSClabelled
30%relativereductionincarbonrelatedtoenergyuseatprocessing sites 30%relativereductioninnetwaterbroughtontosite
30%reductioninfoodwastefromsite(basedonsolids)inlinewiththeEUFusionsfoodwastedefinition
Dairy sites to exhibit an increase in biodiversity
Dairy industry to develop and implement an industry standard for sustainability training
Improve design for dairy packaging to maximise recycled content as appropriate, improve recyclability and deliver product protection to reduce food waste, while minimising carbon impact.
Table21.FutureTargets-Processors
20252020
Table20.FutureTargets-Producers
20252020
30%reductioninGHG(includingcarbondioxide,methaneandnitrousoxide)emissionsfromdairy
farmsbetween1990and2020
70% of non-natural waste is recycled or recovered as standard practice
90%uptakeofwateruseefficiencymeasures
40% of energy used on dairy farms is from renewable resources
90%ofdairyfarmersimplementingtechnologies/practicestoreduce emissions from agriculture
85% of farmers using expert advice to optimise feed plans, which is directly linked to reduced emissions
Dairy farmers to enhance and promote action being taken to improve biodiversity
95%uptakeofwateruseefficiencymethods
11.UKDAIRyAnDTHEEnVIROnMEnT
67

Dairy UK | The White Paper 2017
MEASURINg THE INDUSTRY’S CARbON fOOTPRINT
TheUKdairyindustryhascommittedtomeasuring, monitoring and reducing carbon within the entire dairy supply chain. Dairy UK workedincollaborationwithDairyCoandtheCarbonTrusttoproduceacommonapproachto produce a carbon footprint of dairy in the UK.Throughthiscollaboration,theindustrydevelopeddairysectorspecificguidanceontheapplicationofPAS(PublicallyAvailableSpecification)2050thatsetsoutbroadrulesfor carbon footprinting.
ThismethodologywasusedbyDairyCoaspart of a three-year carbon footprinting studybetween2011and2013whichaimedtoprovidearobustandexternallyverifiedcarbonfootprintofBritishmilk.Thefinalreport,publishedinMay2014showedthatoverthethree year period the average on-farm carbon footprintforalitreofmilkfellyearonyear.Theresultsof1,293,1,227and1,177kgCO2e/litreof
milkforyear1to3respectivelyequatedtoa9.0%reductionovertheperiodoftheproject.
Sincethedevelopmentofthisguidanceprocessors and rretailers have conducted their own carbon footprinting studies of dairy farms. CarbonfootprintingconductedbyMorrisonsin2011at105DairyCrestfarmsacrosstheUKandcertifiedbytheCarbonTrustputthegreenhouse gas emissions associated with UKmilkproductionat1,220gCO2e/litreofmilk. Given the process of farm restructuring andimprovementsinproductiveefficiencyitcan be expected that there would have been afurtheradvanceonthisfiguretodate.Thisvalue sits below the average emissions in WesternEuropeat1,500gCO2e/kgofmilkandtheWorldat2,400kgCO2e/kgofmilkasreportedbytheFAOin2010.ItalsoplacesUK dairy amongst the leading nations when comparedtotheoverallrange,1,300–7,500kgCO2e/kgofmilk.
68

Thedairyindustryiscarryingoutresearchandconsidering cost effective ways to reduce the greenhousegas(GHG)emissionsfromdairyfarms.ThekeyGHGemissionsfromdairyfarmingaremethaneandammonia.Methaneis a by-product of the enteric fermentation of grass, forage and other feed within the cow’s rumen, the largest of its four stomachs. Ammoniaisproducedbythebacterialdegradation of the unabsorbed nitrogen discarded in ruminant manure.
UndertherevisedtargetsoftheEU’snationalEmissionCeilingDirective,theUKhaspledged to reduce ammonia emissions by 8%and16%by2020and2030respectively(against2005levels).ResearchintowaystoreduceGHGemissionsfromdairyfarmsis considering a number of opportunities thatmayhelptomeettheseandotherGHGemissiontargets.Theseinclude;
• low emission animal housing;• Improved manure and slurry storage:The
use of covers, slurry bags and sheeting couldhelptoreduceammoniaemissions;
DAIRY fARMINg AND gREENHOUSE gAS (gHg) EMISSIONS
• Improved slurry application:Targetedapplicationthroughimprovedtechnology;
• Anaerobic Digesters (AD): Thesecanbeusedto produce biogas from stored manure and slurry.ADalsoofferasourceoflowcarbonelectricitythancanoffsettheoverallGHGbalance;
• Nutrient planning:Toensurethattheuseof nitrogen on farms is optimised, reducing the overall emissions of nitrous oxide and methane;
• biofuels in agricultural vehicles;• Improving the efficiency of rumen microbial
action:Thiscouldbeachievedthroughchanges in diet or the use of feed additives in ordertoreducemethaneproduction;
• Avoidance of low-quality feed that encourages the production of methane;
• Cow longevity: Increased cow longevity may help to improve the ratio of methane emission perunitofproduction;
• Increased yield per cow: Whilst increased yields would help reduce emission footprint, it must be recognised that on many units yield may already be at optimum levels in terms of economic viability and animal welfare.
11.UKDAIRyAnDTHEEnVIROnMEnT
69
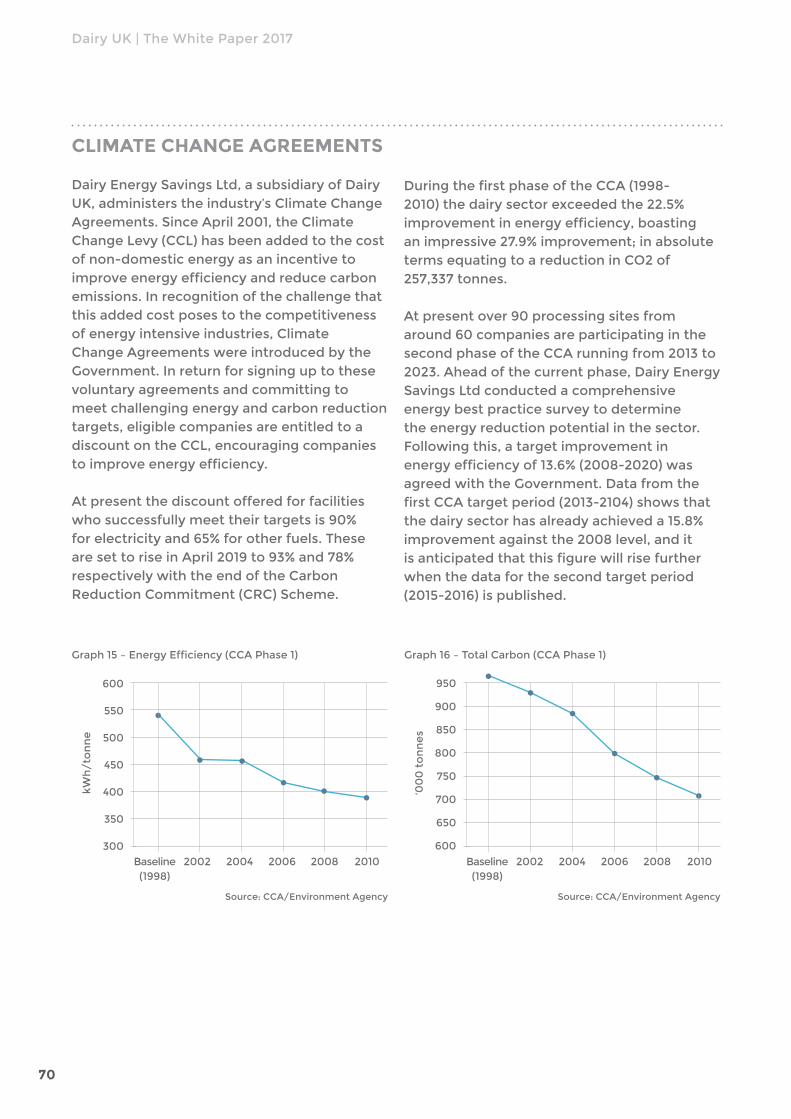
Dairy UK | The White Paper 2017
ClIMATE CHANgE AgREEMENTS
DairyEnergySavingsLtd,asubsidiaryofDairyUK,administerstheindustry’sClimateChangeAgreements.SinceApril2001,theClimateChangeLevy(CCL)hasbeenaddedtothecostof non-domestic energy as an incentive to improveenergyefficiencyandreducecarbonemissions. In recognition of the challenge that this added cost poses to the competitiveness ofenergyintensiveindustries,ClimateChangeAgreementswereintroducedbytheGovernment. In return for signing up to these voluntary agreements and committing to meet challenging energy and carbon reduction targets, eligible companies are entitled to a discountontheCCL,encouragingcompaniestoimproveenergyefficiency.
Atpresentthediscountofferedforfacilitieswhosuccessfullymeettheirtargetsis90%forelectricityand65%forotherfuels.ThesearesettoriseinApril2019to93%and78%respectivelywiththeendoftheCarbonReductionCommitment(CRC)Scheme.
DuringthefirstphaseoftheCCA(1998-2010)thedairysectorexceededthe22.5%improvementinenergyefficiency,boastinganimpressive27.9%improvement;inabsolutetermsequatingtoareductioninCO2of257,337tonnes.
Atpresentover90processingsitesfromaround 60 companies are participating in the secondphaseoftheCCArunningfrom2013to2023.Aheadofthecurrentphase,DairyEnergySavingsLtdconductedacomprehensiveenergy best practice survey to determine the energy reduction potential in the sector. Following this, a target improvement in energyefficiencyof13.6%(2008-2020)wasagreed with the Government. Data from the firstCCAtargetperiod(2013-2104)showsthatthe dairy sector has already achieved a 15.8% improvement against the 2008 level, and it isanticipatedthatthisfigurewillrisefurtherwhen the data for the second target period (2015-2016)ispublished.
900
850
800
750
650
950
700
600
‘00
0 t
on
ne
s
Graph16–TotalCarbon(CCAPhase1)
Baseline(1998)
2002 2004 2006 2008 2010
Source:CCA/EnvironmentAgency
••
•
••
•
550
500
450
400
350
600
300
kWh
/to
nn
e
Graph15–EnergyEfficiency(CCAPhase1)
Baseline(1998)
2002 2004 2006 2008 2010
Source:CCA/EnvironmentAgency
•
• •• • •
70
TheIndustrialDecarbonisationandEnergyEfficiencyRoadmapsareaseriesof documents developed in collaboration between Government and industry which aim to assist industry in improving their energyefficiencywithoutcompromisingtheircompetitiveness. Dairy UK recently helped develop and pledged commitment to the UK FoodandDrinkSectorDecarbonisationandEnergyEfficiencyActionPlan.
TheActionPlanbuildsupontheevidencebaselaidoutinPhase1oftheIndustrialRoadmapsproject. It provides a voluntary framework of actions to deliver decarbonisation and energy efficiencyimprovementswithinthefoodanddrinksectorbetweennowand2050.Thekeyactionslaidoutintheactionplanareasfollows;1. IncreasecollaborativeR&Dundertakenby
thefoodanddrinksector;2. Increase the adoption of state-of-the-art
(SAT)technologies;3. Improvethefoodanddrinksector’s
awarenessofexistingfundingandfinanceoptionsforbothmatureenergyefficiencyanddecarbonisationtechnologies;
4. IncreasethesupplyofScience,Technology,EngineeringandMaths(STEM)graduateswith the skill and knowledge needed to deliver a low-carbon competitive future for thefoodanddrinksector;
5. Identify additional opportunities for using bioenergyinthefoodanddrinksector;
6. Identify and implement industrial heat recoveryprojectsthatrealisebenefitsforthe sector.
INDUSTRIAl ROADMAP fOR DECARbONISATION AND ENERgY EffICIENCY
11.UKDAIRyAnDTHEEnVIROnMEnT
71
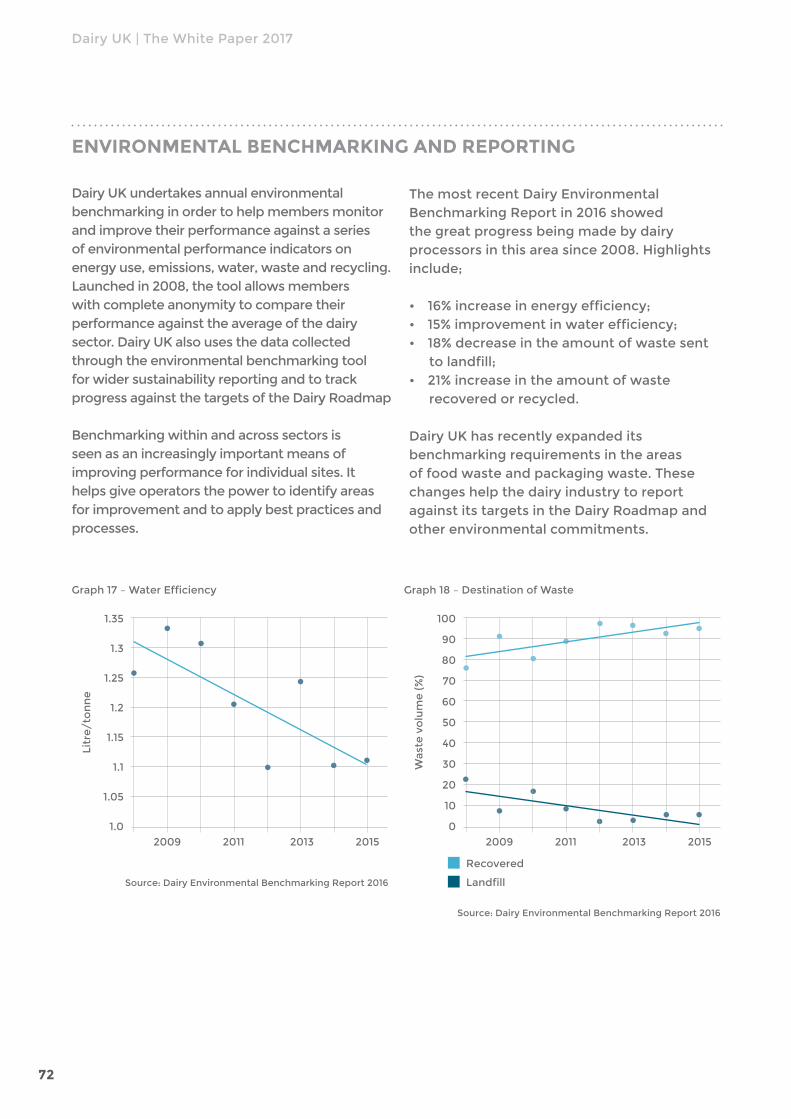
Dairy UK | The White Paper 2017
Dairy UK undertakes annual environmental benchmarking in order to help members monitor and improve their performance against a series of environmental performance indicators on energy use, emissions, water, waste and recycling. Launchedin2008,thetoolallowsmemberswith complete anonymity to compare their performance against the average of the dairy sector. Dairy UK also uses the data collected through the environmental benchmarking tool for wider sustainability reporting and to track progressagainstthetargetsoftheDairyRoadmap
Benchmarking within and across sectors is seen as an increasingly important means of improving performance for individual sites. It helps give operators the power to identify areas for improvement and to apply best practices and processes.
ENVIRONMENTAl bENCHMARKINg AND REPORTINg
ThemostrecentDairyEnvironmentalBenchmarkingReportin2016showedthe great progress being made by dairy processorsinthisareasince2008.Highlightsinclude;
• 16%increaseinenergyefficiency;• 15%improvementinwaterefficiency;• 18%decreaseintheamountofwastesent
tolandfill;• 21%increaseintheamountofwaste
recovered or recycled.
Dairy UK has recently expanded its benchmarking requirements in the areas offoodwasteandpackagingwaste.Thesechanges help the dairy industry to report againstitstargetsintheDairyRoadmapandother environmental commitments.
50
40
30
20
10
60
0
Was
tev
olu
me
(%
)
Graph 18 – Destination of Waste
2011 2013 2015
Source:DairyEnvironmentalBenchmarkingReport2016
•
• ••
•
90
80
70
100
2009
Recovered
Landfill
••
•• • • •
• • • •
1.25
1.2
1.15
1.1
1.05
1.3
1.0
Litr
e/t
on
ne
Graph17–WaterEfficiency
2011 2013 2015
Source:DairyEnvironmentalBenchmarkingReport2016
•
1.35
2009
••
•
•
•
• •
72

DairyUKisasignatoryofTheCourtauldCommitment2025,aWRAP(TheWasteandResourcesActionProgramme)ledcampaignaimed at tackling waste in the food and drinksector.Launchedin2015,underthisvoluntary agreement Dairy UK has pledged its commitment to make food and drink production more sustainable and reduce the resources required to produce food and drink by 20%. In order to achieve this it has been calculated that by 2025 the entire food and drinksectormustmeetthefollowingtargets;
bREf
BRefstandsforBestAvailableTechniquesReferenceDocument.TheFoodDrinkandMilk(FDM)BRefsetsoutthetechniques,technologies, performance levels and emissions levelsthatallpermittedsitesintheEUmustmeet in order to be allowed to operate.
AreviewoftheFDMBRefwasconductedbetween2014and2016,withthefirstdraftof the revised guidelines published in early 2017.SincethispublicationDairyUKhasworkedwiththeEnvironmentAgencyandtheEuropeanDairyAssociationtoprovide
comments and suggest amendments. Under the current timeline for review, it is anticipated thatthefinaliseddraftwillbedeliveredinearly2018.
TherevisedBRefisofgreatsignificanceandwill likely form the basis of future decision and policy making on crucial topics like water and energy use in the sector. Brexit is not expected to impact the outcomes of the review, and sites in the UK processing over 200 tonnes of milk a day will need to be compliant with the new standards by 2020.
THE COURTAUlD COMMITMENT 2025
• 20%reductioninfood&drinkwastearisingintheUK;
• 20%reductioninGHGintensityoffood&drinkconsumedintheUK;
• Areductioninimpactassociatedwithwateruse in the supply chain.
In order to meet these commitments and the respective targets established in the Dairy Roadmap,DairyUKhassetupaDairyWorkingGroupinassociationwithWRAPtotargetwaste hotspots across the supply chain.
11.UKDAIRyAnDTHEEnVIROnMEnT
73

Dairy UK | The White Paper 2017
Dairy UK has developed a biodiversity commitment for dairy processors. Whilst dairy farms present the greatest opportunities for improving biodiversity within the dairy supply chain, dairy processors recognise that they too can play a small but crucial role by promoting biodiversityatprocessingsites.Thecommitment recognises the heterogeneity in dairysitelocationsandprovidestheflexibilitytoencouragebiodiversitywherefeasible.Thestrategycommitsdairyprocessingsitesto;
* Developing and implementing appropriate measures on site that make
DAIRY UK bIODIVERSITY COMMITMENT
acontributiontoenhancingbiodiversity;Thesemayincludebutnotbelimitedto:complementary planting of native plant species, erecting bird nesting facilities, allowing natural regeneration, removing invasive species and avoiding light pollution
* Alternatively,siteswillendeavourtoengage in biodiversity projects in their local communities.Thesemayincludebutnotbelimited to: working with local conservation groups,nGOs,charitiesandschools;
* Moderateimpactonbiodiversitywherepossible in the ways that sites use energy and water, dispose of waste and run their transport operations.
DAIRY DEClARATION Of ROTTERDAM
LaunchedattheIDFWorldDairySummitinRotterdaminOctober2016,theDairyDeclarationofRotterdamactsasacommitment from the dairy community to the continued sustainable development ofthedairysector.TheIDFandFoodandAgricultureOrganisation(FAO)havealready been joined by countries from around the world in signing the declaration, and it is the intention of Dairy UK and the DairyRoadmaptosignthedeclarationonbehalf of the United Kingdom.
TheDeclarationrecognisestheUn2030Agendaforsustainabledevelopmentasthe overarching framework that guides actions towards sustainable development, and the vital role that dairy plays in sustainable development through food security, poverty reduction, environmental management, and as an important livelihood around the world.
UK DAIRY INDUSTRY AND INTERNATIONAl ENVIRONMENTAl COMMITMENTS
In signing the declaration, the signatories agree to;• Takeanintegratedapproachtopromotethe
sustainability of dairy systems, jointly taking into consideration social, economic, health and environmentaldimensions;
• Giveparticularattentiontotheneedsoffamilyfarmers small holders and pastoralists
• Build,implementanddisseminatetoolsandguidelinestofacilitatetheidentificationandadoption of sustainable practices in the dairy sector;
• Buildcapacityinsupportofsustainablepracticeandprovideenablingconditions;
• Measureandreportonsustainabilityoutcomes;
• Strengthenmulti-stakeholderdialogueforconsensus building, reviewing progress and continuous improvement.
TheDairyDeclarationofRotterdamcanbeviewedonline at www.dairydeclaration.org.
74

DairyUKisanAffiliateMemberoftheDairySustainabilityFramework(DSF),acollaborativeglobalindustryledconsortium.TheDSFprovidesa shared framework that allows the international dairy sector to work collaboratively in improving global sustainability within the sector.
Theframeworkincludeselevenkeysustainabilitycategories,identifiedasrelevant
DAIRY SUSTAINAbIlITY fRAMEWORK
tothedairysectorglobally.Eachofthesehas an associated high-level objective which membersoftheDSFhavecommittedtoworking towards.
Dairy UK is currently considering becoming an AggregateMemberoftheDSF,andjoininginthe reporting against all eleven criteria set out bytheDSFusingtheagreedindicators.
Greenhouse Gas EmissionsSoilnutrientsWasteWaterSoil
Biodiversity MarketDevelopmentRuralEconomiesWorkingConditionsProductSafety&QualityAnimalCare
DAIRY SUSTAINAbIlITY fRAMEWORK glObAl CRITERIA
11.UKDAIRyAnDTHEEnVIROnMEnT
75
DAIRyUKISCALLInGOnTHEGOVERnMEnTTO;
• RecognisetheambitiouscommitmentsthedairyindustryhasmadetoimproveitsenvironmentalfootprintthroughTheDairyRoadmap;
• RecognisetheUKdairyindustry’sroleinhelpingtodeliveronthecommitmentsofthejointFoodandAgricultureOrganisation(FAO)andtheInternationalDairyFederation’s(IDF)DairyDeclarationofRotterdam.TheDairyDeclarationiskeyinhelpingtothedairysectordeliveragainstanumberoftheUnitednationsSustainableDevelopmentGoals;
• EngagewiththedairyindustryinfurtherensuringthecontinuedenvironmentalsustainabilityoftheentiredairysupplychainwithintheUnitedKingdom;
• Engagewiththedairyindustrytounderstandthefeasibilitiesofagriculturetominimisegreenhousegasemissions,andprovidesupportinachievingemissionsreductiontargets;
• Recognisethestrongperformanceofthedairyprocessingsectorsclimatechangeagreementsandtoprovidefurthersupporttohelpimplementlow-carbonorenergyefficienttechnologiesandinnovations;
• UpholdthecommitmentsoftheIndustrialDecarbonisationandEnergyEfficiencyRoadmap2050:Food&DrinkActionPlan,andtofurtherengagewiththedairyindustryinthedevelopmentofdecarbonisationandenergyefficiencypolicy;
• EnsuretheUnitedKingdomscontinuedparticipationwithintheEUEmissionsTradingSchemeuntilatearliestthecompletionofPhase3,andtocontinuetoengagewiththedairyindustry in the development of post-Brexit Industry emissions policy.

Dairy UK | The White Paper 2017
76

WORlD DAIRY TRADE AND fUTURE PROSPECTS
12.
77

Dairy UK | The White Paper 2017
Growing demand is putting world milk production on an upward trend. Internationaltradeindairyproductsisalsogrowing.TradeinallmajordairyproductsisexpectedtogrowwiththeexceptionofWMP.TheEU’sexposure to the world market through exports means that the trend inworldmarketpricesdrivesEUandUKprices.TheGlobalDairyTradeoperated on behalf of Fonterra sets benchmark prices for the world market.ThepatternofUKtradeindairyproductsisdeterminedbyarange of structural factors but within these constraints the UK’s export performance is considerable. Future prospects for global demand are strongly positive with prices expected to rise.
WORlD MIlK PRODUCTION
Over the past nine years the average annual rate of growth has been 2.2%.
Around38%ofworldmilkoutputcontinuestobefromthe‘informalsector’(IFCnDairyReport2016)wheremilkproducedbyverysmall farmers is either consumed on the farm ormarketedlocally.Theshiftawayfromtheinformal sector towards milk being delivered to dairies for processing is one of the main underlying trends in the global dairy industry.
Production growth during 2016 is estimated at 0.9%,alowerratethaninpreviousyears,withexpansioninAsia,northandCentralAmerica,EuropeandAfricaoffsettosomeextentbydeclinesinAustralia(hitbyharshpricecutsandharshseasonalconditions)andnewZealand.MostoftheglobalincreaseoriginatesinAsia,principallyIndia,whereproductionis forecast to expand by 4.2%, or 6.1 million tonnes, to 152 million tonnes, fuelled by rising incomes and increased urbanisation.
700
680
660
640
620
600
580
560
540
520
500
Mill
ion
ton
ne
s
Graph19–WorldMilkProduction(milliontonnes)
2007 2008 2009 2010 2011 2012 2013 2014 2015 2016
year
+2.2%+1.9% +1.4%
+2.0%+3.0%
+2.3% +0.6%+2.9%
+2.0%+0.9%
Source:FAO
78

Overall global production during 2017 is forecast to rise by 1.7%, slightly lower than the average over the past decade, with output
MIlK PRODUCTION bY COUNTRY
Australia
EU-28
China
newZealand
UnitedStates
Total
146,500
37,250
21,893
93,485
308,8
28
150,200
37,550
21,587
94,619
313,7
56
151,000
36,020
21,224
96,343
313,93
7
-4.8
+0.5
-4.2
-1.7
+1.8
+0.1
9,100
151,300
35,500
21,900
98,112
315,912
Table22.SummaryofMajorMilkProductionForecastsfor2016and2017(millionmetrictons)
-2.7
+0.2
-1.4
+3.2
+1.8
+0.6
2014
9,700
2015
9,800
2016
9,350
% change
15/16
2017
forecast
% change
16/17
expectedtoexpandinnorthandSouthAmerica,showlittlechangeinEuropeandAfricaanddeclineagaininAustralia.
Source:USDA
ExPORTS
Milkanddairyproductsarelargelyconsumedintheregionwheretheyareproduced.Thetradable surplus for any country is generally a fraction of total production, with the exceptionsofAustraliaandnewZealand.Consequently,theworldmarketremainsrelatively small compared to total global production, but the strong level of demand fromChinacontributedtotheproportionofworldoutputtradedrisingto9%.
newZealand
EU
USA
Belarus
Australia
Argentina
World
19.4
18.5
10.0
3.9
3.3
1.8
71.1
90
11
10
55
34
18
9
Table23.PatternofWorldTrade2016(volumeofproductexportedand%ofmilkproduction)
VolumeofProductExported(MillionTonsMilkEquivalent)
% of Domestic Production
Source:FAOFoodOutlook
STRUCTURE Of THE WORlD MARKET
12.WORLDDAIRyTRADEAnDFUTUREPROSPECTS
79

Dairy UK | The White Paper 2017
IMPORTS
AccordingtotheFAO,globaltradeofdairyproducts is expected to record a second, successive year of modest growth in 2017, withrenewedgrowthbyChina,followingasignificantdropin2015,forecasttobeoneofthemaindriversbehindtherise.TheEU,theUnitedStates,ArgentinaandCanadaarethemaincountries also expected to see their exports rise.
WiththeexceptionofWMP,worldtradeinallmajor dairy commodity products is forecast to rise.SMPisexpectedtorecoverfromadropof -2.4% in 2016, returning to the pattern of growth that had been seen for the majority of the previous decade. Butter is forecast to seeasecondyearofgrowth,reflectingstrongdemand(especiallyfromChinaandAustralia)andlimitedsupplies.Cheese,howeverisexpected to move higher to a record level,
China
RussianFederation
Mexico
SaudiArabia
Algeria
Indonesia
12.0
4.2
3.7
3.2
2.6
2.5
17
6
5
4
4
4
Table24.MajorDairyCommodityImportingCountriesin2016
VolumeofProductImported(MillionTonsMilkEquivalent)
% of World Imports
Source:FAOFoodOutlook
with growth in imports expected from all majormarkets,inparticularChina,theRussianFederation,Australia,JapanandtheUnitedStates.WorldtradeinWMPisforecasttoseeathird year of decline, with a slight fall of -0.5%.
TRADE POlICIES AND DAIRY PRICES
Theunderlyingriseinworlddairypricessince2007hasmeantthatEUandworldmarketpriceshavenowlargelyconverged.Thishasmeantthatthetradepolicies(tariffs,exportsubsidiesetc)pursuedby the major producing regions have become less important in determining world prices. Whilst the USAandEUstillmaintainrelativelyhighimporttariffs, the relatively large exportable surplus generated by these regions, and the declining use of export subsidies, means that these regions are now directly subject to world market price trends.
AfurtherWTOagreementonmulti-lateraltradeliberalisation for agriculture would have further reduced the importance of trade policies on the world dairy market, but the talks have stalled and it is uncertain when they will resume, if ever. HoweverinDecember2015attheWorldTradeOrganization’s(WTO)10thMinisterialConferenceinnairobi,membersfinallyagreedthatexportsubsidies for agriculture would be abolished.
ThislocksintheexposureoftheEUtoworldmarketpricetrendsbecausetheEU’sexportable surplus will have to continue to be priced competitively with the world market, whichwillinfluencethepriceprevailingthroughoutthebloc.Continuedexposuretothe world market will bring with it further price volatility compared to the stability previously createdbytheCAP.
However,atthelowerboundsofpricevolatilitythissituationisqualifiedbythewillingnessoftheEUtosustainEUpricesthrough the intervention system. By placing afloorpriceonEUexportstheinterventionsystem also acts to limit the fall of world prices. ThecostofplayingthisrolefortheEUhasbeentheaccumulationof350,000tonnesofSMPinpublicstocksduringtherecentdownturn.SofartheCommissionhasenjoyedlittlesuccessinreleasing the stock back on to the market.
80

Butter
SMP
6,000
5,000
4,000
3,000
1,000
7,000
2,000
0
$/t
on
ne
Graph20–WorldDairyCommodityPrices
July‘06
Source:AHDBDairy
Jan‘07
July‘07
Jan‘08
July‘08
Jan‘09
July‘09
Jan‘10
July‘10
Jan‘11
July‘11
Jan‘12
July‘12
Jan‘13
July‘13
Jan‘14
July‘14
Jan‘15
July‘15
Jan‘16
July‘16
Jan‘17
Jul‘17
WMP
Cheddarcheese
EU25
Virtualworldmilkprice
30
25
20
15
5
40
10
Eu
rop
er
100
kg
Graph21–EUandWorldMarketPrices
Source:ZMB
1991
35
01993 1995 1997 1999 2001 2003 2005 2007 2009 2011 2013 2015 2017a
12.WORLDDAIRyTRADEAnDFUTUREPROSPECTS
81

Dairy UK | The White Paper 2017
WORlD MARKET PRICES
Theelectronicauctionsystemfordairyproducts,operatedbyGlobalDairyTradeonbehalf of Fonterra, is seen to set the benchmark priceforworlddairyproducts.TheauctionstartedwithWholeMilkPowderinJuly2006and since then the range of products offered has been expanded with the addition of AnhydrousMilkFat(AMF),SkimMilkPowder
(SMP),ButterMilkPowder(BMP),MilkProteinConcentrate(MPC),RennetCasein,CheddarCheese,lactoseandbutter.ItwasannouncedinApril2017thattheonlinedairytradingplatform,GDTEvents,haspassedthemilestoneofUS$20billion cumulative value of products sold and, now,inits9thyear,hastradedmorethan5.8million metric tonnes of dairy ingredients.
fUTURES CONTRACTS fOR DAIRY
Price volatility means that there is growing interest in the development of futures markets for dairy products to help the industry manage price risk.
Futures contracts for dairy products are alreadywellestablishedintheUSAontheChicagoMercantileExchange.TwoEuropeanexchanges have launched futures contracts for dairyproducts,butatpresentonlytheEurexexchange is showing any degree of liquidity. InadditionsignificantactivityintheEUforOverTheCounter(OFC)productsfordairy
priceriskmanagementprovidedbyfinancialinstitutionshasbeenreported.TheFonterraauctionhasalsoallowedthenewZealandstock exchange to develop futures contracts for dairy products.
UK dairy companies are developing farmer contracts that provide the option of greater price certainty by linking into futures markets. Howeveritisrecognisedthatfuturesarenotapanacea and represent one strategy amongst many for addressing price risk.
$U
S/M
t,F
AS
Graph22–FonterraAuctionSystemResults
Source:GlobalDairyTrade
12,000
10,000
8,000
6,000
2,000
14,000
4,000
0
WMP BMP Cheddar
AMF MPC Butter
SMP
REn
DTDPriceindexG
TD
pri
cein
de
x
1,400
1,000
800
600
200
1,800
400
0
1,200
1,600
02/01/
13
02/04/
13
02/07/
13
01/10
/13
07/01/
14
01/04/
14
01/07/
14
01/10
/14
06/01/
15
01/04/
15
01/07/
15
06/10
/15
05/01/
16
05/04/
16
05/07/
16
04/10
/16
03/01/
17
04/04/
17
04/07/
17
82

UK DAIRY TRADE
UK dairy companies export to the world market, and in particular the industry in northernIrelandisheavilyengagedindoingso.
TheactualpatternofUKtradeindairyproductsisshapedbythefollowing;
• UKmilkproductionisinsufficienttomeetdomesticconsumption;
• Freshpasteurisedliquidmilkcannotnormallybeexportedcompetitively;
• SalesofhighvaluedairyproductsinGreatBritain are focused on the market for direct consumptionbydomesticshoppers;
• Aportionofthebutterfatgeneratedfrom the manufacture of low fat milks is exportedfromtheUKasbulkcream;
• RawmilkisexportedfromnorthernIrelandtotheRepublicofIreland,anda range of milk powders is exported to destinationswithintheEUandtothirdcountries.
ThesestructuralfactorsmeanthattheUK’s exports inevitably tend to be of lower unit value than imports into the UK. nevertheless,giventhatliquidmilkisnotreadily tradeable, the export performance of the UK dairy industry is considerable. Around20%ofUKrawmilkproductionisexported in the form of processed dairy products.
Both in respect of imports and exports the EUistheUK’smajortradingpartner.
11
0
1
1
1
1,364
2
6,025
15
4,584
116,395
27,770
36,515
23,441
44,924
145,693
64,823
471,984
54,532
96,449
Table25.UKDairyImportsin2016–tonnes
EU non-EU TotalProduct
116,385
27,770
36,515
23,441
44,924
144,329
64,821
465,960
54,516
91,866
Liquidmilk
Cream
Skimmedmilkpowder
Whole milk powder
Evaporatedandcondensedmilk
yogurt
Butter
Cheese
of which processed cheese
ofwhichCheddar
Source:HMRC
12.WORLDDAIRyTRADEAnDFUTUREPROSPECTS
83

Dairy UK | The White Paper 2017
Liquidmilk–bulk
Liquidmilk-packaged
Cream
SMP
Whole milk powder
Evaporatedandcondensedmilk
yogurt
Butter
Cheese
of which processed cheese
ofwhichCheddar
4,783
65,470
744
9,809
23,317
2,437
2,006
7,898
34,855
456
21,511
539,029
81,618
20,939
40,924
73,246
19,094
21,422
41,766
160,661
11,073
75,316
Table26.UKDairyExportsin2016–tonnes
EU non-EU TotalProduct
534,246
16,149
20,195
31,116
49,929
16,657
19,417
33,867
125,806
10,617
53,805
% of UK production
3.6
1.2
13.8
89.2
117.5
8.2
9.1
11.5
32.6
47.8
18.5
Source:HMRC
Thegrowthprospectsfordairyarestronglypositive. Demand is being driven by population sizeandeconomicgrowth.Thereisalsoastrong desire on the part of the dairy industry
fUTURE gROWTH PROSPECTS fOR THE WORlD MARKET
to move production into new and innovative products that respond to new consumer needs andgrowvaluetothebenefitofthewholesupply chain.
CONSUMPTION gROWTH
World consumption of fresh dairy products and processed dairy products is expected to grow annually by 2.1% and 1.7% over the next decade.
Developing countries are expected to consume around 67% of fresh dairy products, mostofwhichisconsumedinAsia,withthissharerisingto73%overthedecade.In
developed countries, increasing per-capita consumption of processed dairy products, mainlycheeseandWMP,isexpectedandathigher rates than over the past decade.
Consumptionofdairyproductsindevelopingcountries is forecast to increase on average at around 2.0% whilst, in developed countries, the rate is projected to increase on average by 1.2%.
84
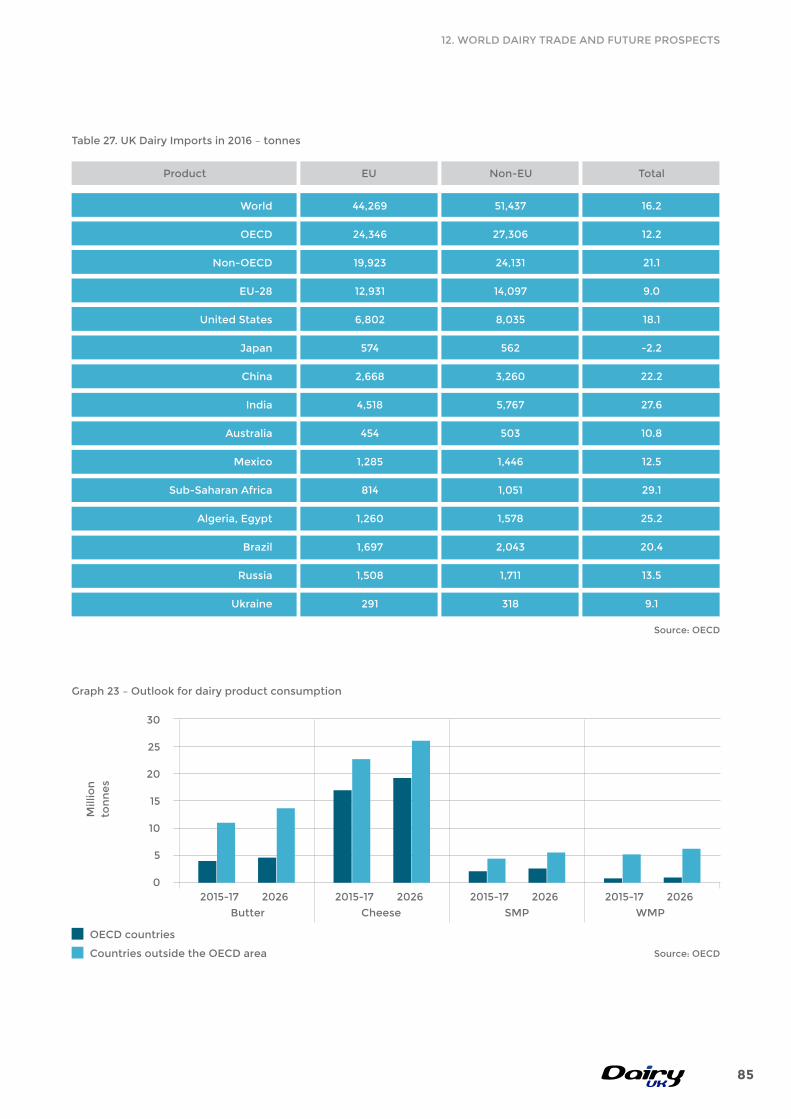
World
OECD
non-OECD
EU-28
UnitedStates
Japan
China
India
Australia
Mexico
Sub-SaharanAfrica
Algeria,Egypt
Brazil
Russia
Ukraine
51,437
27,306
24,131
14,097
8,035
562
3,260
5,767
503
1,446
1,051
1,578
2,043
1,711
318
16.2
12.2
21.1
9.0
18.1
-2.2
22.2
27.6
10.8
12.5
29.1
25.2
20.4
13.5
9.1
Table27.UKDairyImportsin2016–tonnes
EU non-EU TotalProduct
44,269
24,346
19,923
12,931
6,802
574
2,668
4,518
454
1,285
814
1,260
1,697
1,508
291
Source:OECD
30
25
20
15
10
5
0
Mill
ion
ton
ne
s
OECDcountries
CountriesoutsidetheOECDarea
Graph23–Outlookfordairyproductconsumption
2015-17 2026 2015-17 2026 2015-17 2026 2015-17 2026
Butter Cheese SMP WMP
Source:OECD
12.WORLDDAIRyTRADEAnDFUTUREPROSPECTS
85

Dairy UK | The White Paper 2017
AccordingtotheOECD-FAOAgriculturalOutlook 2017–2026 it is expected that real price of butter will decrease slightly over thereferenceperiod,whilethoseofSMP,
WMPandcheesewillincrease.Priceswillbesupported by strong demand for milk and milk products but nominal prices are not expected toreturntothepeaklevelsof2013.
US
$/
to
nn
e
Graph24–TrendsinWorldDairyPrices
Source:OECD-FAOAgriculturalOutlook2017-2026
5,000
4,000
3,000
2,000
1,500
500
1,000
0
1987
1989
1991
1993
1995
1997
1999
2001
2003
20052007
2009
201120
132015
201720
192021
2023
2025
3,500
2,500
4,500
SMP
WMP
Butter
Cheese
86
DAIRyUKISCALLInGOnTHEGOVERnMEnTTO;
• WorkcollaborativelywiththeindustrytoFacilitatetheindustryinexploitingexportopportunitiesaroundtheworld;
• EnsurethattheUK’sreputationforfoodsafetyisproperlysafeguardedandenhanced;• Streamlinetheadministrationofexporthealthcertificatesbydevelopingasystembased
on authorisation of processing plants, instead of the current system of authorisation by consignment;
• Consolidatetheadministrationofthediverserangeofexportcertificatesrequiredbyexportersintoasingle‘onestopshop’;
• Ensureforeigninspectiontoursareadequatelyresourcedandthatanyresultingissuesidentifiedareaddressedinatimelymanner;
• EnsurethatanyFTAscreategenuinemarketaccessopportunitiesfortheUKdairysectorwhilst ensuring that it is not subject to unfair import competition in its own domestic market.
NUTRITIONAl EDUCATION AND PROTECTION
13.
87

Dairy UK | The White Paper 2017
TheDairyCouncilistheonlyorganisationinthe dairy industry with a dedicated remit of protecting and promoting the human health benefitsofdairyproducts.
TheDairyCouncilplacesastrongemphasisonproviding information to health professionals which both promotes dairy nutrition within a healthy balanced diet and active lifestyle and dispels misconceptions around the role of dairy in the diet.
In addition to its work with health professionals,theDairyCouncilprovidesevidence based nutrition information to consumers and is the only organisation within thedairyindustrywhichiscertifiedtocarrytheInformationStandardonthematerialsitproduces for the public.
NUTRITION EDUCATION AND PROTECTION
TheInformationStandardwasdevelopedbytheDepartmentofHealthinresponsetothelarge amount of health and care information availabletothepublicandpatients.AnyorganisationwhichachievescertificationundertheInformationStandard’sruleshasundergone a rigorous assessment to check that their information production process generates high quality information that the public can trust.
TheDairyCounciloperatesanextensiveoutreach programme for health professionals and those involved in industries allied to health. In the last year it has disseminated information on a diverse range of topics including: healthy aging, saturated fat, obesity, iodine and sport to name but a few.
DAIRY NUTRITION AND HEAlTH: TAlKINg TO THE PROfESSIONAlS
Disseminationwasachievedby;• OrganisingconferencesallovertheUKfor
healthprofessionalsandhealthwriters;• Presentingwithinacademicdepartments;• Attendinghealthrelatedtradeshows;• Publishingreportsandpapers;• Publishingnewsletters.
88

Tiny teeth! A short guide to healthy teeth for the under fives
A short guide to healthy eating for one-to-fives
Tiny Tums!
MilkItForAllIt’sWorthisTheDairyCouncil’ssocial media based campaign for active young people.Withover230,000youTubeviews,11,000Facebooklikesand10,000Twitterfollowersthiscampaignpromotesthebenefitsof drinking milk and being physically active to teenagers.
Thepublicwantsinformationitcanrelyon.TheDairyCouncilhasarangeofpublicationswhich span all life stages and provide accurate informationon;• dietinpregnancyandearlychildhood;• calcium;
A short guide to healthy eating for one-to-fives
Baby Nosh!
A short guide to eating well during pregnancy and breastfeeding
Baby Bump2
IF YOU ARE
LOSING WEIGHT
YOU CAN DO SOMETHING ABOUT IT!
AND YOU SHOULD TELL SOMEBODY ABOUT IT!
EATING AND DRINKING ENOUGH IS IMPORTANT TO MAINTAIN YOUR HEALTH
DAIRY AND BODY WEIGHT
DAIRY NUTRITION AND HEAlTH: TAlKINg TO THE PUblIC
• iodine;• thecompositionofdairyfoods;• dairyandbodyweight;• saturatedfat;• milk;cheese;• yogurt.
TAlKINg TO TEENAgERS VIA SOCIAl MEDIA
13.nUTRITIOnALEDUCATIOnAnDPROTECTIOn
89

Dairy UK | The White Paper 2017