the wdc gold standards for product feature...
TRANSCRIPT
The WDC Gold Standards for Product FeatureExtraction and Product Matching
Petar Petrovski, Anna Primpeli, Robert Meusel, and Christian Bizer
Data and Web Science Group, University of Mannheim, Germany{petar,anna,robert,chris}@informatik.uni-mannheim.de
Abstract. Finding out which e-shops offer a specific product is a centralchallenge for building integrated product catalogs and comparison shop-ping portals. Determining whether two offers refer to the same productinvolves extracting a set of features (product attributes) from the webpages containing the offers and comparing these features using a match-ing function. The existing gold standards for product matching have twoshortcomings: (i) they only contain offers from a small number of e-shopsand thus do not properly cover the heterogeneity that is found on theWeb. (ii) they only provide a small number of generic product attributesand therefore cannot be used to evaluate whether detailed product at-tributes have been correctly extracted from textual product descriptions.To overcome these shortcomings, we have created two public gold stan-dards: The WDC Product Feature Extraction Gold Standard consistsof over 500 product web pages originating from 32 different websites onwhich we have annotated all product attributes (338 distinct attributes)which appear in product titles, product descriptions, as well as tablesand lists. The WDC Product Matching Gold Standard consists of over75 000 correspondences between 150 products (mobile phones, TVs, andheadphones) in a central catalog and offers for these products on the 32web sites. To verify that the gold standards are challenging enough, weran several baseline feature extraction and matching methods, resultingin F-score values in the range 0.39 to 0.67. In addition to the gold stan-dards, we also provide a corpus consisting of 13 million product pagesfrom the same websites which might be useful as background knowledgefor training feature extraction and matching methods.
Key words: e-commerce, product feature extraction, product matching
1 Introduction
The Web has made it easier for organizations to reach out to their customers,eliminating barriers of geographical location, and leading to a steady growthof e-commerce sales.1 Beside of e-shops run by individual vendors, comparisonshopping portals which aggregate offers from multiple vendors play a central
1 Retail e-commerce sales worldwide from 2014 to 2019 - http://www.statista.com/statistics/379046/worldwide-retail-e-commerce-sales/
2 Petar Petrovski et al.
role in e-commerce. The central challenge for building comparison shopping por-tals is to determine with high precision which e-shops offer a specific product.Determining whether two offers refer to the same product involves extractinga set of features (product attributes) from the web pages containing the of-fers and comparing these features using a matching function. The extractionof detailed product features from the HTML pages is challenging, as a singlefeature may appear in various surface forms in headlines, the product name,and free-text product descriptions. Product matching is difficult as most e-shopsdo not publish product identifiers, such as global trade item number (GTIN) orISBN numbers, but heterogeneous product descriptions have different levels ofdetail [8].
To evaluate and compare product matching methods a comprehensive goldstandard is needed. The most widely known public gold standard for productmatching was introduced by Kopcke et al. [3]. However, this gold standard hastwo shortcomings: First, the gold standard only contains offers from four sources(Amazon.com, GoogleProducts, Abt.com and Buy.com) and thus only partlycovers the heterogeneity of product descriptions on the Web. Moreover the goldstandard contains only four attributes: product title, description, manufacturerand price; with more detailed product attributes (such as screen size or amount ofmemory) being part of free-text product titles and descriptions. These attributesneed to be extracted from the free-text before they can be exploited by sophisti-cated matching methods. A more recent gold standard for product matching wasintroduced by Ristoski and Mika [14]. Their gold standard contains offers froma large number of websites which employ Microdata and schema.org markup.Their gold standard thus overcomes the shortcoming that data is gathered onlyfrom a small number of e-shops. However, their gold standard provides only twotextual product attributes (name and description) and can thus not be used toevaluate feature extraction methods.
In order to overcome both above mentioned shortcomings, this paper presentstwo publicly accessible gold standard datasets and a product data corpus whichcan be used to train and evaluate product feature extraction and product match-ing methods:
Gold Standard for Product Feature Extraction containing over 500 an-notated product web pages. On each web page, we manually annotated allproduct features which appear within: (i) the name of the product marked upwith Microdata, (ii) description of the product marked up with Microdata,(iii) specification tables, and (iv) specification lists.
Gold Standard for Product Matching containing over 75 000 correspon-dences (1 500 positive, and 73 500 negative) between products from a productcatalog, containing 150 different products from three different product cat-egories, and products described on web pages.
Product Data Corpus containing over 13 million product-related web pagesretrieved from the same web sites. This corpus might be useful as back-ground knowledge for the semi-supervised training of feature extraction andmatching methods.
WDC Gold Standards 3
All artefacts presented in this paper as well as the detailed results of theexperiments are published as part of the WebDataCommons (WDC) project2
and can be downloaded from the WDC product data corpus page3.The paper is structured as follows: Section 2 describes the selection of the
websites and the products that are used for the gold standards. In Section 3and 4 the creation of the two gold standard datasets is described and statisticsabout the datasets are presented. Section 5 briefly describes the corpus consist-ing of product web pages and the way it was crawled from the Web. The baselineapproaches and their results based on the corresponding gold standard are pre-sented in the subsequent section. The last section gives an overview of relatedwork.
2 Product Selection
In the following, we describe the process which was applied to select the productsused in the gold standards. Namely, we explain how the products from the threedifferent product categories: headphones, mobile phones and TVs. were selected.
Table 3 shows the 32 most frequently visited shopping web sites, based onthe ranking provided by Alexa4, which we use for the product selection. Wecollected first the ten most popular products from the different web sites, foreach of the three chosen product categories. We further complemented this listby similar products (based on their name). As example, we found the productApple iPhone 6 64GB to be one of the most popular amongst all shopping websites. We therefore included also the products Apple iPhone 6 128GB as well asApple iPhone 5 into our product catalog. Especially for the product matchingtask, this methodology introduces a certain level of complexity, as the productnames only differ by one or two characters. All in all, for each product categorywe selected 50 different products.
3 Gold standard for Product Feature Extraction
This section describes the process that we used to create the gold standard forproduct feature extraction from product web pages. First, we explain how thegold standard was curated and then state statistical insights.
Gold Standard Curation We randomly selected 576 web pages, each contain-ing a product description for one of the products selected in Section 2, from theproduct corpus detailed in Section 5. From the 576 product descriptions, 158 arebelonging to the headphones category, 254 to the phones category and 164 tothe TVs category.
2 http://webdatacommons.org3 http://webdatacommons.org/productcorpus/4 http://www.alexa.com/
4 Petar Petrovski et al.
From each page we identified four key sources of attributes: As we havealready shown in former research [12], information annotated using the markuplanguage Microdata5 has proven to be a good source of product features. Makinguse of the open-source library Any23 6, we extracted the product name, as wellas the product description, marked up with Microdata with the schema.orgproperties schema:name and schema:description from each product web page.Further, as the research presented in [13] has shown promising results extractingfeatures from tables and lists, we used a similar approach to identify specificationlists and specification tables on the product pages.
For each extracted source, we label the contained features with an appropri-ate feature name. As example, if the name of the product is the string AppleiPhone 6, we label the sub-string Apple as brand and iPhone 6 as model. Twoindependent annotators in parallel annotated the web pages. In case of a conflict,a third annotator solved them.
We also mapped the list of annotated product features to the list of featurescontained in our product catalog (see Section 4.1). This mapping as well as thegold standard dataset is available on the gold standard web page.
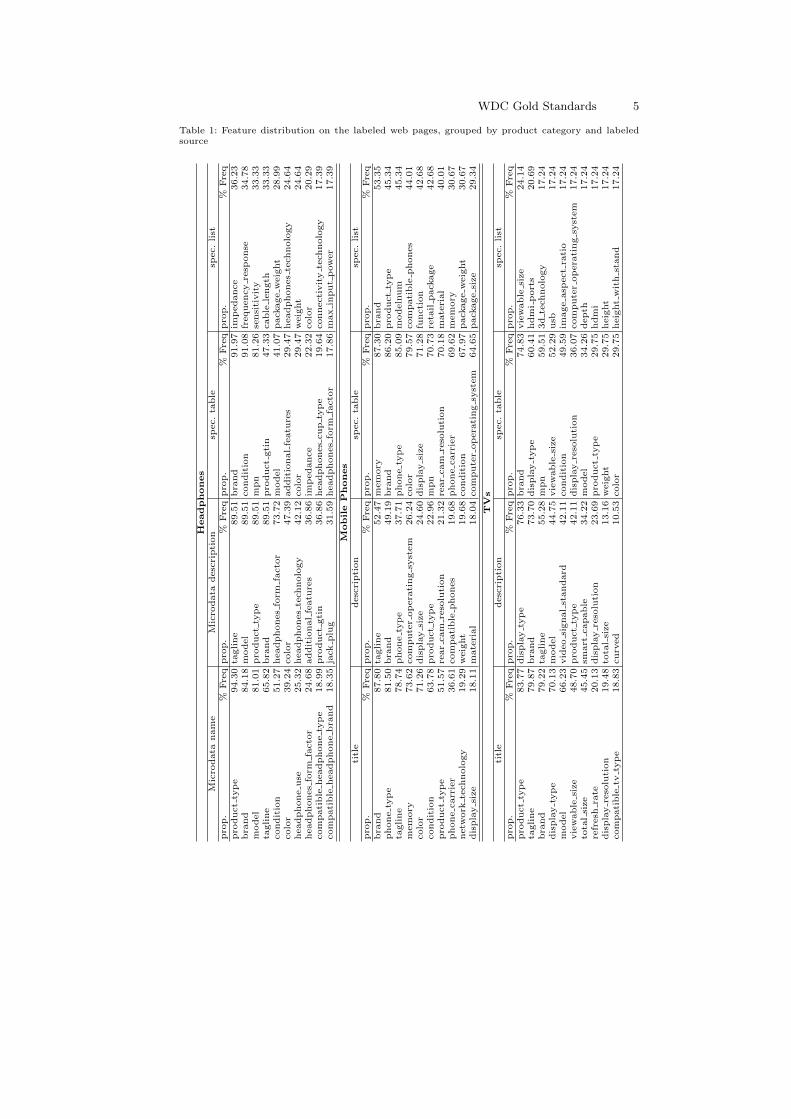
Distribution of Annotated Features In total, we were able to annotate 338distinct features. Table 1 presents the frequency of properties per category foreach of the labeled sources of attributes: Microdata name, Microdata description,specification table and specification list. The percent of frequency distribution iscalculated from the total number of products of a product category. The tabledoes not include a comprehensive list of the properties, but selects only thosecommonly occurring in each of the different annotation tasks. For the title anddescription we found a lot of tagline properties. Tagline was used for properties,which are not product specification related. As an example, when we found thetitle amazing iPhone, the sub-string amazing is annotated with the propertytagline. Moreover, expected properties like model, brand and product type
can be seen amongst the top. For the specification table and specification list arelatively low frequency of properties, with even distribution, can be seen in thethree different categories, suggesting a diversity of descriptors used by vendors.
The findings underline that features extracted from the four sources of prod-uct web pages contain valuable feature information. The identification of thosefeatures with a high precision is essential in order to perform further integrationtasks, like the matching of products.
4 Gold standard for Product Matching
In this section, we describe the process which was applied to curate the goldstandard for product matching. Further we present valuable statistics about thecreated gold standard.
5 https://www.w3.org/TR/microdata/6 http://any23.apache.org/
WDC Gold Standards 5
Table 1: Feature distribution on the labeled web pages, grouped by product category and labeledsource
Headphones
Mic
rodata
nam
eM
icro
data
desc
ripti
on
spec.
table
spec.
list
pro
p.
%Fre
qpro
p.
%Fre
qpro
p.
%Fre
qpro
p.
%Fre
qpro
duct
typ
e94.3
0ta
gline
89.5
1bra
nd
91.9
7im
pedance
36.2
3bra
nd
84.1
8m
odel
89.5
1condit
ion
91.0
8fr
equency
resp
onse
34.7
8m
odel
81.0
1pro
duct
typ
e89.5
1m
pn
81.2
6se
nsi
tivit
y33.3
3ta
gline
65.8
2bra
nd
89.5
1pro
duct
gti
n47.3
3cable
length
33.3
3condit
ion
51.2
7headphones
form
facto
r73.7
2m
odel
41.0
7pack
age
weig
ht
28.9
9colo
r39.2
4colo
r47.3
9addit
ional
featu
res
29.4
7headphones
tech
nolo
gy
24.6
4headphone
use
25.3
2headphones
tech
nolo
gy
42.1
2colo
r29.4
7w
eig
ht
24.6
4headphones
form
facto
r24.6
8addit
ional
featu
res
36.8
6im
pedance
22.3
2colo
r20.2
9com
pati
ble
headphone
typ
e18.9
9pro
duct
gti
n36.8
6headphones
cup
typ
e19.6
4connecti
vit
yte
chnolo
gy
17.3
9com
pati
ble
headphone
bra
nd
18.3
5ja
ckplu
g31.5
9headphones
form
facto
r17.8
6m
ax
input
pow
er
17.3
9
Mobil
eP
hones
titl
edesc
ripti
on
spec.
table
spec.
list
pro
p.
%Fre
qpro
p.
%Fre
qpro
p.
%Fre
qpro
p.
%Fre
qbra
nd
87.8
0ta
gline
52.4
7m
em
ory
87.3
0bra
nd
53.3
5phone
typ
e81.5
0bra
nd
49.1
9bra
nd
86.2
0pro
duct
typ
e45.3
4ta
gline
78.7
4phone
typ
e37.7
1phone
typ
e85.0
9m
odeln
um
45.3
4m
em
ory
73.6
2com
pute
rop
era
ting
syst
em
26.2
4colo
r79.5
7com
pati
ble
phones
44.0
1colo
r71.2
6dis
pla
ysi
ze
24.6
0dis
pla
ysi
ze
71.2
8fu
ncti
on
42.6
8condit
ion
63.7
8pro
duct
typ
e22.9
6m
pn
70.7
3re
tail
pack
age
42.6
8pro
duct
typ
e51.5
7re
ar
cam
reso
luti
on
21.3
2re
ar
cam
reso
luti
on
70.1
8m
ate
rial
40.0
1phone
carr
ier
36.6
1com
pati
ble
phones
19.6
8phone
carr
ier
69.6
2m
em
ory
30.6
7netw
ork
tech
nolo
gy
19.2
9w
eig
ht
19.6
8condit
ion
67.9
7pack
age
weig
ht
30.6
7dis
pla
ysi
ze
18.1
1m
ate
rial
18.0
4com
pute
rop
era
ting
syst
em
64.6
5pack
age
size
29.3
4
TV
sti
tle
desc
ripti
on
spec.
table
spec.
list
pro
p.
%Fre
qpro
p.
%Fre
qpro
p.
%Fre
qpro
p.
%Fre
qpro
duct
typ
e83.7
7dis
pla
yty
pe
76.3
3bra
nd
74.8
3vie
wable
size
24.1
4ta
gline
79.8
7bra
nd
73.7
0dis
pla
yty
pe
60.4
1hdm
ip
ort
s20.6
9bra
nd
79.2
2ta
gline
55.2
8m
pn
59.5
13d
tech
nolo
gy
17.2
4dis
pla
yty
pe
70.1
3m
odel
44.7
5vie
wable
size
52.2
9usb
17.2
4m
odel
66.2
3vid
eo
signal
standard
42.1
1condit
ion
49.5
9im
age
asp
ect
rati
o17.2
4vie
wable
size
48.7
0pro
duct
typ
e42.1
1dis
pla
yre
solu
tion
36.0
7com
pute
rop
era
ting
syst
em
17.2
4to
tal
size
45.4
5sm
art
capable
34.2
2m
odel
34.2
6depth
17.2
4re
fresh
rate
20.1
3dis
pla
yre
solu
tion
23.6
9pro
duct
typ
e29.7
5hdm
i17.2
4dis
pla
yre
solu
tion
19.4
8to
tal
size
13.1
6w
eig
ht
29.7
5heig
ht
17.2
4com
pati
ble
tvty
pe
18.8
3curv
ed
10.5
3colo
r29.7
5heig
ht
wit
hst
and
17.2
4
6 Petar Petrovski et al.
In order to generate the gold standard for product matching, we create aproduct catalog containing the same 150 products described in Section 2. More-over we make use of the web pages, we crawled based on the names of theproducts (Section 3).
4.1 Product Catalog
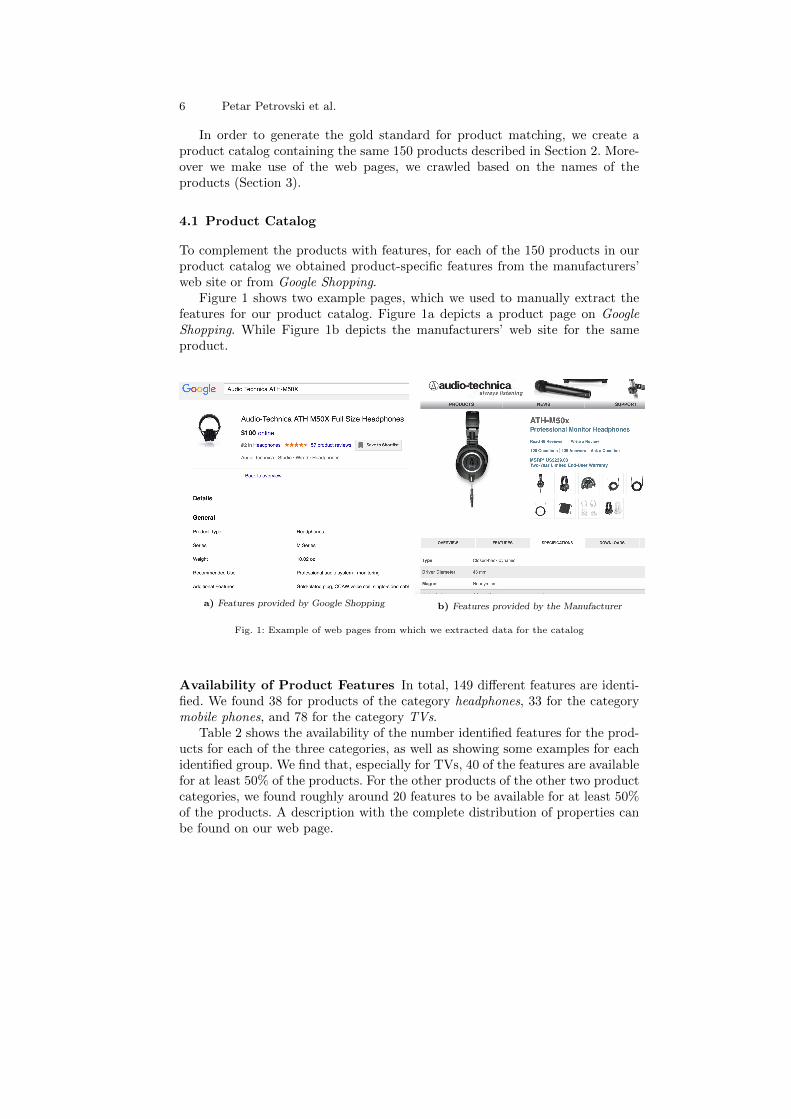
To complement the products with features, for each of the 150 products in ourproduct catalog we obtained product-specific features from the manufacturers’web site or from Google Shopping.
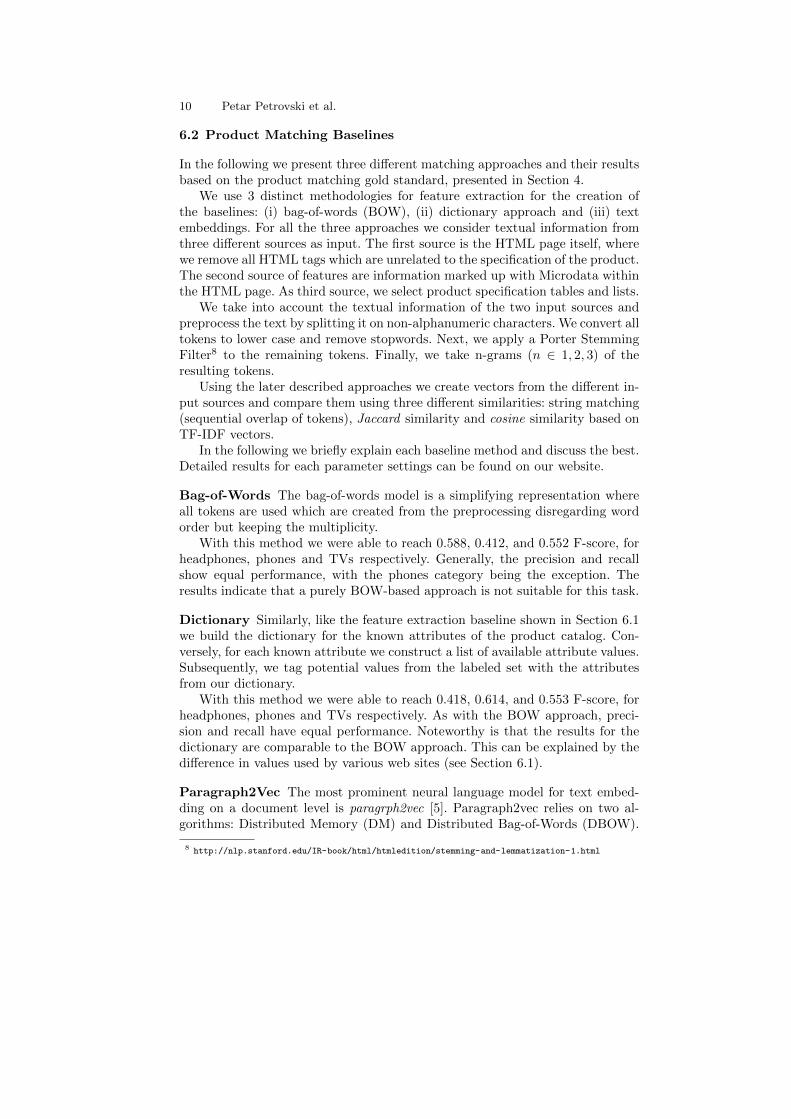
Figure 1 shows two example pages, which we used to manually extract thefeatures for our product catalog. Figure 1a depicts a product page on GoogleShopping. While Figure 1b depicts the manufacturers’ web site for the sameproduct.
a) Features provided by Google Shopping b) Features provided by the Manufacturer
Fig. 1: Example of web pages from which we extracted data for the catalog
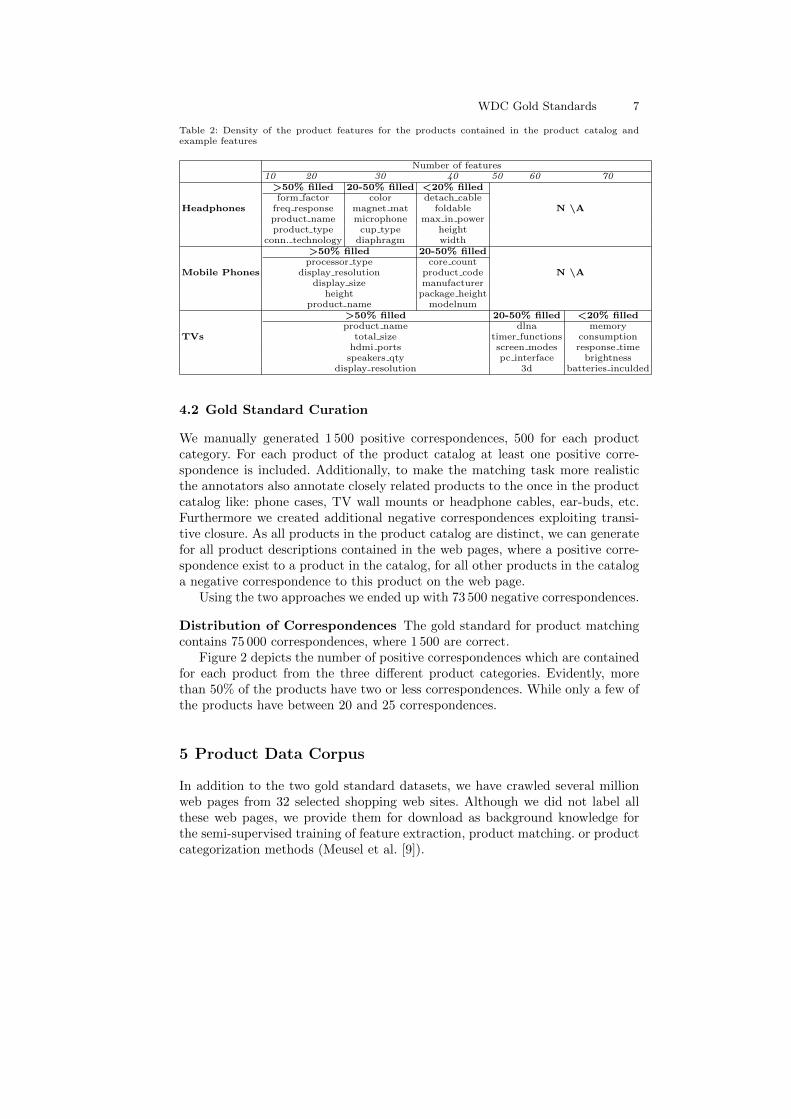
Availability of Product Features In total, 149 different features are identi-fied. We found 38 for products of the category headphones, 33 for the categorymobile phones, and 78 for the category TVs.
Table 2 shows the availability of the number identified features for the prod-ucts for each of the three categories, as well as showing some examples for eachidentified group. We find that, especially for TVs, 40 of the features are availablefor at least 50% of the products. For the other products of the other two productcategories, we found roughly around 20 features to be available for at least 50%of the products. A description with the complete distribution of properties canbe found on our web page.
WDC Gold Standards 7
Table 2: Density of the product features for the products contained in the product catalog andexample features
Number of features10 20 30 40 50 60 70
Headphones
>50% filled 20-50% filled <20% filled
N \Aform factor color detach cable
freq response magnet mat foldableproduct name microphone max in powerproduct type cup type height
conn. technology diaphragm width
Mobile Phones
>50% filled 20-50% filled
N \Aprocessor type core count
display resolution product codedisplay size manufacturer
height package heightproduct name modelnum
TVs
>50% filled 20-50% filled <20% filledproduct name dlna memory
total size timer functions consumptionhdmi ports screen modes response time
speakers qty pc interface brightnessdisplay resolution 3d batteries inculded
4.2 Gold Standard Curation
We manually generated 1 500 positive correspondences, 500 for each productcategory. For each product of the product catalog at least one positive corre-spondence is included. Additionally, to make the matching task more realisticthe annotators also annotate closely related products to the once in the productcatalog like: phone cases, TV wall mounts or headphone cables, ear-buds, etc.Furthermore we created additional negative correspondences exploiting transi-tive closure. As all products in the product catalog are distinct, we can generatefor all product descriptions contained in the web pages, where a positive corre-spondence exist to a product in the catalog, for all other products in the cataloga negative correspondence to this product on the web page.
Using the two approaches we ended up with 73 500 negative correspondences.
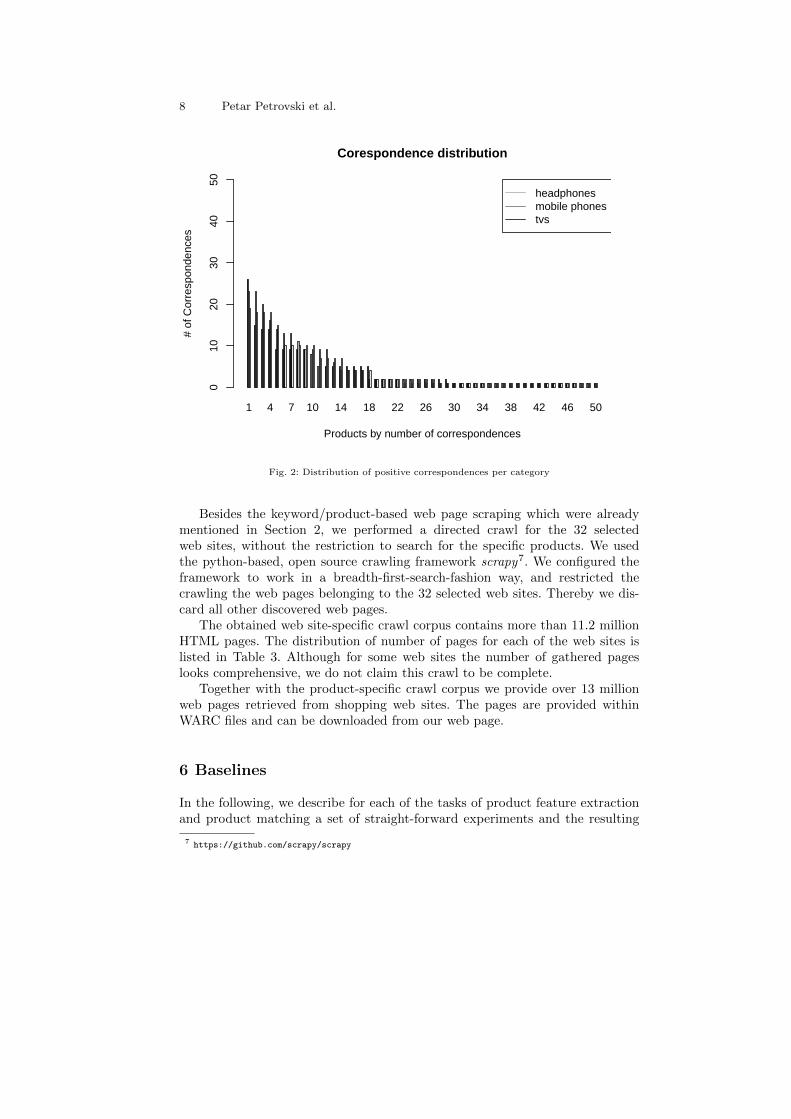
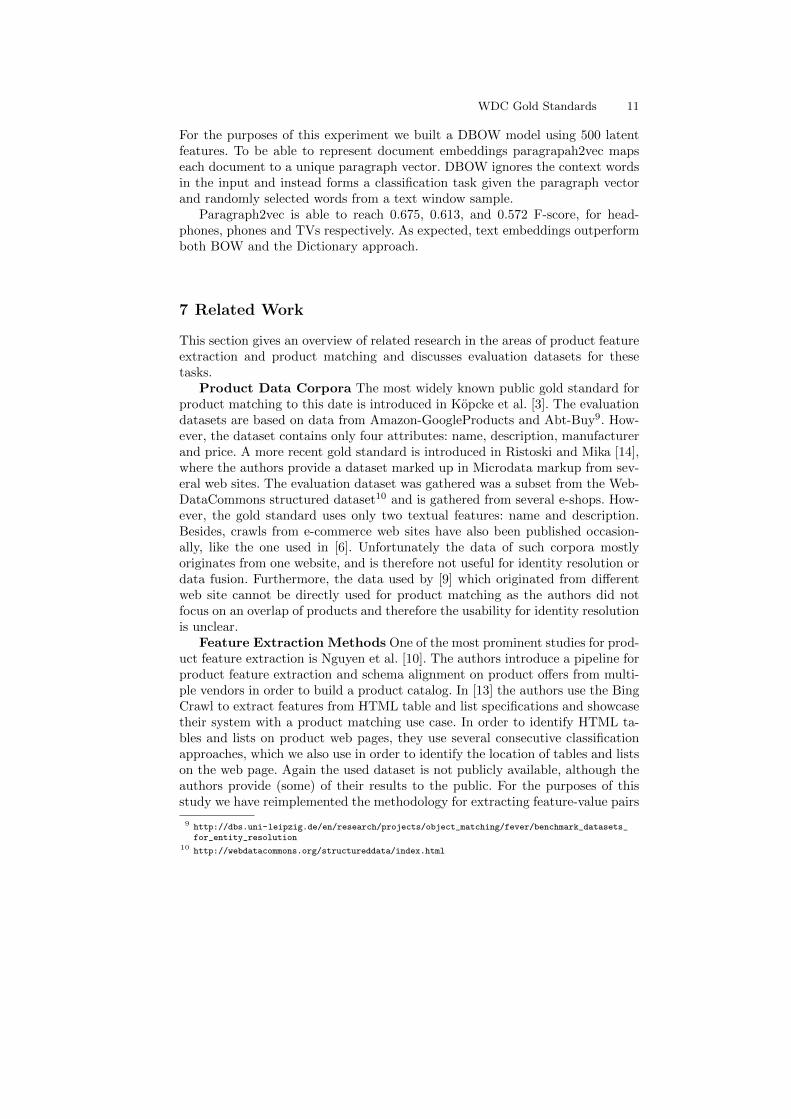
Distribution of Correspondences The gold standard for product matchingcontains 75 000 correspondences, where 1 500 are correct.
Figure 2 depicts the number of positive correspondences which are containedfor each product from the three different product categories. Evidently, morethan 50% of the products have two or less correspondences. While only a few ofthe products have between 20 and 25 correspondences.
5 Product Data Corpus
In addition to the two gold standard datasets, we have crawled several millionweb pages from 32 selected shopping web sites. Although we did not label allthese web pages, we provide them for download as background knowledge forthe semi-supervised training of feature extraction, product matching. or productcategorization methods (Meusel et al. [9]).
8 Petar Petrovski et al.
1 4 7 10 14 18 22 26 30 34 38 42 46 50
Corespondence distribution
Products by number of correspondences
# of
Cor
resp
onde
nces
010
2030
4050
headphonesmobile phonestvs
Fig. 2: Distribution of positive correspondences per category
Besides the keyword/product-based web page scraping which were alreadymentioned in Section 2, we performed a directed crawl for the 32 selectedweb sites, without the restriction to search for the specific products. We usedthe python-based, open source crawling framework scrapy7. We configured theframework to work in a breadth-first-search-fashion way, and restricted thecrawling the web pages belonging to the 32 selected web sites. Thereby we dis-card all other discovered web pages.
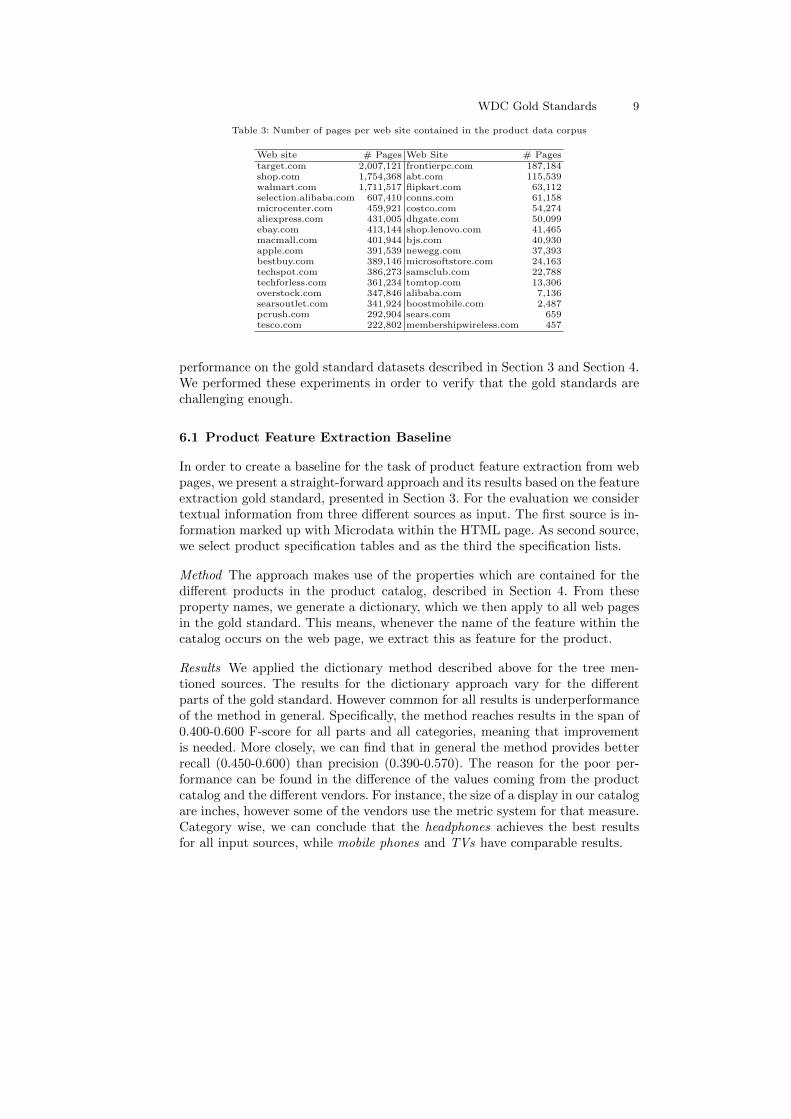
The obtained web site-specific crawl corpus contains more than 11.2 millionHTML pages. The distribution of number of pages for each of the web sites islisted in Table 3. Although for some web sites the number of gathered pageslooks comprehensive, we do not claim this crawl to be complete.
Together with the product-specific crawl corpus we provide over 13 millionweb pages retrieved from shopping web sites. The pages are provided withinWARC files and can be downloaded from our web page.
6 Baselines
In the following, we describe for each of the tasks of product feature extractionand product matching a set of straight-forward experiments and the resulting
7 https://github.com/scrapy/scrapy
WDC Gold Standards 9
Table 3: Number of pages per web site contained in the product data corpus
Web site # Pages Web Site # Pagestarget.com 2,007,121 frontierpc.com 187,184shop.com 1,754,368 abt.com 115,539walmart.com 1,711,517 flipkart.com 63,112selection.alibaba.com 607,410 conns.com 61,158microcenter.com 459,921 costco.com 54,274aliexpress.com 431,005 dhgate.com 50,099ebay.com 413,144 shop.lenovo.com 41,465macmall.com 401,944 bjs.com 40,930apple.com 391,539 newegg.com 37,393bestbuy.com 389,146 microsoftstore.com 24,163techspot.com 386,273 samsclub.com 22,788techforless.com 361,234 tomtop.com 13,306overstock.com 347,846 alibaba.com 7,136searsoutlet.com 341,924 boostmobile.com 2,487pcrush.com 292,904 sears.com 659tesco.com 222,802 membershipwireless.com 457
performance on the gold standard datasets described in Section 3 and Section 4.We performed these experiments in order to verify that the gold standards arechallenging enough.
6.1 Product Feature Extraction Baseline
In order to create a baseline for the task of product feature extraction from webpages, we present a straight-forward approach and its results based on the featureextraction gold standard, presented in Section 3. For the evaluation we considertextual information from three different sources as input. The first source is in-formation marked up with Microdata within the HTML page. As second source,we select product specification tables and as the third the specification lists.
Method The approach makes use of the properties which are contained for thedifferent products in the product catalog, described in Section 4. From theseproperty names, we generate a dictionary, which we then apply to all web pagesin the gold standard. This means, whenever the name of the feature within thecatalog occurs on the web page, we extract this as feature for the product.
Results We applied the dictionary method described above for the tree men-tioned sources. The results for the dictionary approach vary for the differentparts of the gold standard. However common for all results is underperformanceof the method in general. Specifically, the method reaches results in the span of0.400-0.600 F-score for all parts and all categories, meaning that improvementis needed. More closely, we can find that in general the method provides betterrecall (0.450-0.600) than precision (0.390-0.570). The reason for the poor per-formance can be found in the difference of the values coming from the productcatalog and the different vendors. For instance, the size of a display in our catalogare inches, however some of the vendors use the metric system for that measure.Category wise, we can conclude that the headphones achieves the best resultsfor all input sources, while mobile phones and TVs have comparable results.
10 Petar Petrovski et al.
6.2 Product Matching Baselines
In the following we present three different matching approaches and their resultsbased on the product matching gold standard, presented in Section 4.
We use 3 distinct methodologies for feature extraction for the creation ofthe baselines: (i) bag-of-words (BOW), (ii) dictionary approach and (iii) textembeddings. For all the three approaches we consider textual information fromthree different sources as input. The first source is the HTML page itself, wherewe remove all HTML tags which are unrelated to the specification of the product.The second source of features are information marked up with Microdata withinthe HTML page. As third source, we select product specification tables and lists.
We take into account the textual information of the two input sources andpreprocess the text by splitting it on non-alphanumeric characters. We convert alltokens to lower case and remove stopwords. Next, we apply a Porter StemmingFilter8 to the remaining tokens. Finally, we take n-grams (n ∈ 1, 2, 3) of theresulting tokens.
Using the later described approaches we create vectors from the different in-put sources and compare them using three different similarities: string matching(sequential overlap of tokens), Jaccard similarity and cosine similarity based onTF-IDF vectors.
In the following we briefly explain each baseline method and discuss the best.Detailed results for each parameter settings can be found on our website.
Bag-of-Words The bag-of-words model is a simplifying representation whereall tokens are used which are created from the preprocessing disregarding wordorder but keeping the multiplicity.
With this method we were able to reach 0.588, 0.412, and 0.552 F-score, forheadphones, phones and TVs respectively. Generally, the precision and recallshow equal performance, with the phones category being the exception. Theresults indicate that a purely BOW-based approach is not suitable for this task.
Dictionary Similarly, like the feature extraction baseline shown in Section 6.1we build the dictionary for the known attributes of the product catalog. Con-versely, for each known attribute we construct a list of available attribute values.Subsequently, we tag potential values from the labeled set with the attributesfrom our dictionary.
With this method we were able to reach 0.418, 0.614, and 0.553 F-score, forheadphones, phones and TVs respectively. As with the BOW approach, preci-sion and recall have equal performance. Noteworthy is that the results for thedictionary are comparable to the BOW approach. This can be explained by thedifference in values used by various web sites (see Section 6.1).
Paragraph2Vec The most prominent neural language model for text embed-ding on a document level is paragrph2vec [5]. Paragraph2vec relies on two al-gorithms: Distributed Memory (DM) and Distributed Bag-of-Words (DBOW).
8 http://nlp.stanford.edu/IR-book/html/htmledition/stemming-and-lemmatization-1.html
WDC Gold Standards 11
For the purposes of this experiment we built a DBOW model using 500 latentfeatures. To be able to represent document embeddings paragrapah2vec mapseach document to a unique paragraph vector. DBOW ignores the context wordsin the input and instead forms a classification task given the paragraph vectorand randomly selected words from a text window sample.
Paragraph2vec is able to reach 0.675, 0.613, and 0.572 F-score, for head-phones, phones and TVs respectively. As expected, text embeddings outperformboth BOW and the Dictionary approach.
7 Related Work
This section gives an overview of related research in the areas of product featureextraction and product matching and discusses evaluation datasets for thesetasks.
Product Data Corpora The most widely known public gold standard forproduct matching to this date is introduced in Kopcke et al. [3]. The evaluationdatasets are based on data from Amazon-GoogleProducts and Abt-Buy9. How-ever, the dataset contains only four attributes: name, description, manufacturerand price. A more recent gold standard is introduced in Ristoski and Mika [14],where the authors provide a dataset marked up in Microdata markup from sev-eral web sites. The evaluation dataset was gathered was a subset from the Web-DataCommons structured dataset10 and is gathered from several e-shops. How-ever, the gold standard uses only two textual features: name and description.Besides, crawls from e-commerce web sites have also been published occasion-ally, like the one used in [6]. Unfortunately the data of such corpora mostlyoriginates from one website, and is therefore not useful for identity resolution ordata fusion. Furthermore, the data used by [9] which originated from differentweb site cannot be directly used for product matching as the authors did notfocus on an overlap of products and therefore the usability for identity resolutionis unclear.
Feature Extraction Methods One of the most prominent studies for prod-uct feature extraction is Nguyen et al. [10]. The authors introduce a pipeline forproduct feature extraction and schema alignment on product offers from multi-ple vendors in order to build a product catalog. In [13] the authors use the BingCrawl to extract features from HTML table and list specifications and showcasetheir system with a product matching use case. In order to identify HTML ta-bles and lists on product web pages, they use several consecutive classificationapproaches, which we also use in order to identify the location of tables and listson the web page. Again the used dataset is not publicly available, although theauthors provide (some) of their results to the public. For the purposes of thisstudy we have reimplemented the methodology for extracting feature-value pairs
9 http://dbs.uni-leipzig.de/en/research/projects/object_matching/fever/benchmark_datasets_for_entity_resolution
10 http://webdatacommons.org/structureddata/index.html
12 Petar Petrovski et al.
used in this study and we reached 0.724 F-score for tables and 0.583 F-score forlists.
In our previous works [11, 12], we showed the usability of product-relatedMicrodata annotations for product feature extraction. In particular the worksunderline that it is possible learning product-category-specific regular expres-sions to extract features particular from titles and descriptions of the products.
The work by Ristoski and Mika [14] uses the Yahoo product data ads to trainconditional random fields for extracting product features from the titles as wellas the descriptions product offers that were annotatated using the Microdatasyntax. A similar work that employs conditional random fields for chunkingproduct offer titles is [7].
Product Matching Methods Recent approaches by [2] match unstruc-tured product offers retrieved from web pages to structured product specificationusing data found in the Microsoft Bing Product catalog. A work focusing on theexploitation of product specific identifiers, like the manufacturer part number(MPN) or the GTIN for product matching is presented in [4]. In [1] the authorsintroduce a novel approach for product matching by enriching product titleswith essential missing tokens and calculate the importance score computationthat takes context into account.
All those works make use of proprietary data for the task of product match-ing, which on the one hand side makes it hard to validate their results. On theother hand side it is also not possible to compare results of different approaches,as the heavily depend on the used data.
All of the artifacts and results from this paper are available for download athttp://webdatacommons.org/productcorpus/.
References
1. V. Gopalakrishnan, S. P. Iyengar, A. Madaan, R. Rastogi, and S. Sengamedu.Matching product titles using web-based enrichment. In Proceedings of the21st ACM International Conference on Information and Knowledge Management,CIKM ’12, pages 605–614, New York, NY, USA, 2012. ACM.
2. A. Kannan, I. E. Givoni, R. Agrawal, and A. Fuxman. Matching unstructuredproduct offers to structured product specifications. In 17th ACM SIGKDD in-ternational conference on Knowledge discovery and data mining, pages 404–412,2011.
3. H. Kopcke, A. Thor, and E. Rahm. Evaluation of entity resolution approaches onreal-world match problems. Proceedings of the VLDB Endowment, 3(1-2):484–493,2010.
4. H. Kopcke, A. Thor, S. Thomas, and E. Rahm. Tailoring entity resolution formatching product offers. In Proceedings of the 15th International Conference onExtending Database Technology, pages 545–550. ACM, 2012.
5. Q. V. Le and T. Mikolov. Distributed representations of sentences and documents.arXiv preprint arXiv:1405.4053, 2014.
WDC Gold Standards 13
6. J. McAuley, C. Targett, Q. Shi, and A. van den Hengel. Image-based recommen-dations on styles and substitutes. In Proceedings of the 38th International ACMSIGIR Conference on Research and Development in Information Retrieval, pages43–52. ACM, 2015.
7. G. Melli. Shallow semantic parsing of product offering titles (for better automatichyperlink insertion). In Proceedings of the 20th ACM SIGKDD International Con-ference on Knowledge Discovery and Data Mining, KDD ’14, pages 1670–1678,New York, NY, USA, 2014. ACM.
8. R. Meusel, P. Petrovski, and C. Bizer. The Semantic Web – ISWC 2014: 13thInternational Semantic Web Conference, Riva del Garda, Italy, October 19-23,2014. Proceedings, Part I, chapter The WebDataCommons Microdata, RDFa andMicroformat Dataset Series, pages 277–292. Springer International Publishing,Cham, 2014.
9. R. Meusel, A. Primpeli, C. Meilicke, H. Paulheim, and C. Bizer. Exploiting mi-crodata annotations to consistently categorize product offers at web scale. In Pro-ceedings of the 16th International Conference on Electronic Commerce and WebTechnologies (EC-Web2015/T2), Valencia, Spain, 2015.
10. H. Nguyen, A. Fuxman, S. Paparizos, J. Freire, and R. Agrawal. Synthesizingproducts for online catalogs. Proceedings of the VLDB Endowment, 4(7):409–418,2011.
11. P. Petrovski, V. Bryl, and C. Bizer. Integrating product data from websites offeringmicrodata markup. In Proceedings of the companion publication of the 23rd inter-national conference on World wide web companion, pages 1299–1304. InternationalWorld Wide Web Conferences Steering Committee, 2014.
12. P. Petrovski, V. Bryl, and C. Bizer. Learning regular expressions for the extractionof product attributes from e-commerce microdata. 2014.
13. D. Qiu, L. Barbosa, X. L. Dong, Y. Shen, and D. Srivastava. Dexter: large-scalediscovery and extraction of product specifications on the web. Proceedings of theVLDB Endowment, 8(13):2194–2205, 2015.
14. P. Ristoski and P. Mika. Enriching product ads with metadata from html annota-tions. In Proceedings of the 13th Extended Semantic Web Conference. (To Appear),2015.