the volunteer spirit in canada : motivations and - imagine canada
TRANSCRIPT
2
Volunteer Spirit 07/23 THIS ONE 7/28/04 12:30 PM Page 2

© 2004 Canadian Centre for Philanthropy
Copyright for the National Survey of Giving, Volunteering and Participating (NSGVP) material is waived forcharitable and voluntary organizations for non-commercial use. All charitable and voluntary organizations areencouraged to copy and distribute any and all NSGVP publications.
For more information about the 2000 National Survey of Giving, Volunteering and Participating, including fulltext of the highlights report, Caring Canadians, Involved Canadians, please visit www.givingandvolunteering.ca.
Canadian Centre for Philanthropy425 University Avenue, Suite 700Toronto, OntarioCanada M5G 1T6Tel: 416.597.2293Fax: 416.597.2294Email: [email protected]
www.ccp.ca www.givingandvolunteering.ca
ISBN# 1-55401-083-7
This research was supported by funding from the Voluntary Sector Initiative (VSI)through the Social Development Partnerships Program of Social Development Canada(SDC). The views expressed in this publication do not necessarily reflect those of theGovernment of Canada.
Volunteer Spirit 07/23 THIS ONE 7/28/04 12:30 PM Page 3
Acknowledgements
i
The author is grateful to Michael Hall, Cathy Barr, and Barbara Brownlee of the Canadian Centre for Philanthropyfor their contributions to the review and data analysis of this research, and to Lisa Hartford for managing design andproduction services. This report was edited by Norah McClintock.
The NSGVP is the result of a partnership of federal government departments and voluntary sector organizations thatincludes the Canadian Centre for Philanthropy, Canadian Heritage, Health Canada, Human Resources DevelopmentCanada, Statistics Canada, and Volunteer Canada.
Volunteer Spirit 07/23 THIS ONE 7/28/04 12:30 PM Page 5
Acknowledgements . . . . . . . . . . . . . . . . . . . . . . . . . . . . . . . . . . . . . . . . . . . . . . . . . . . . . . . . . . . . . . . . . . . . . i
I. About the NSGVP . . . . . . . . . . . . . . . . . . . . . . . . . . . . . . . . . . . . . . . . . . . . . . . . . . . . . . . . . . . . . . . . . . 1
II. Introduction . . . . . . . . . . . . . . . . . . . . . . . . . . . . . . . . . . . . . . . . . . . . . . . . . . . . . . . . . . . . . . . . . . . . . . . . . 2
III. The personal and economic characteristics of volunteers . . . . . . . . . . . . . . . . 3
IV. Motivations for volunteering . . . . . . . . . . . . . . . . . . . . . . . . . . . . . . . . . . . . . . . . . . . . . . . . . . . . 6
Motivations for volunteering and the personal and economic characteristics of volunteers . . . . . . . . . . . . . . . . . 6
Motivations for volunteering and level of support . . . . . . . . . . . . . . . . . . . . . . . . . . . . . . . . . . . . . . . . . . . . . . . . . 8
V. Barriers to volunteering . . . . . . . . . . . . . . . . . . . . . . . . . . . . . . . . . . . . . . . . . . . . . . . . . . . . . . . . . 9
Barriers to volunteering and the personal and economic characteristics of volunteers . . . . . . . . . . . . . . . . . . . . . 9
Barriers to volunteering more . . . . . . . . . . . . . . . . . . . . . . . . . . . . . . . . . . . . . . . . . . . . . . . . . . . . . . . . . . . . . . . . . 11
Barriers to volunteering more and level of support . . . . . . . . . . . . . . . . . . . . . . . . . . . . . . . . . . . . . . . . . . . . . . . . 11
VI. Early life experiences and volunteering . . . . . . . . . . . . . . . . . . . . . . . . . . . . . . . . . . . . . . . 12
Early life experiences as a predictor of volunteering . . . . . . . . . . . . . . . . . . . . . . . . . . . . . . . . . . . . . . . . . . . . . . . 12
Early life experiences and their effect on motivations and barriers to volunteering . . . . . . . . . . . . . . . . . . . . . . . 12
VII. Conclusion . . . . . . . . . . . . . . . . . . . . . . . . . . . . . . . . . . . . . . . . . . . . . . . . . . . . . . . . . . . . . . . . . . . . . . . . . . . 14
Table of contents
ii
Volunteer Spirit 07/23 THIS ONE 7/28/04 12:30 PM Page 6

About the NSGVPIThe National Survey of Giving, Volunteering and Participating (NSGVP) provides the most comprehensive look at thecontributions of Canadians to one another and their communities ever undertaken in Canada.
The NSGVP asks Canadians a series of questions about how they give money and other resources to individuals and tocharitable and nonprofit organizations; volunteer time to charitable and voluntary organizations and directly to individuals;and participate in organizations by becoming members. First conducted in 1997 as a special survey by Statistics Canada,the NSGVP was repeated in 2000 as part of the federal government's Voluntary Sector Initiative (VSI). The 2000 surveywas conducted by Statistics Canada as a supplement to the Labour Force Survey (LFS). The 2000 NSGVP is based on arepresentative sample of 14,724 Canadians aged 15 and older who were asked about their giving and volunteering for aone-year period from October 1, 1999 to September 30, 2000.
A renamed and redesigned Canada Survey of Giving, Volunteering and Participating (CSGVP) will be conducted everythree years beginning in 2004. Although Statistics Canada will continue to conduct the CSGVP, it will be a stand-alonesurvey that is independent of the Labour Force Survey. Following national consultations with voluntary sector organiza-tions, federal and provincial agencies, and the academic research community, the CSGVP content was modified. The newsurvey instrument was tested and will go into the field in the fall of 2004.
For more information on the NSGVP and CSGVP, please continue to visit www.givingandvolunteering.ca.
1
Volunteer Spirit 07/23 THIS ONE 7/28/04 12:30 PM Page 1

IntroductionII
2
More than one quarter (27%) of Canadians aged 15 and overvolunteered for a charitable or nonprofit organization during2000, according to the National Survey of Giving,Volunteering and Participating (NSGVP). These volunteerscontributed an average of 162 hours each, for a total of 1.05billion hours. This is equivalent to approximately 549,000 full-time year-round jobs and makes Canada’s volunteer forcelarger than the total labour force of most provinces. However,much continues to come from the few. As was the case withthe 1997 NSGVP, the lion’s share of all volunteer hours werecontributed by a minority of volunteers. Almost three quarters(73%) of all volunteer hours came from the 25% of volunteerswho contributed 188 hours or more (see Figure 1). This concentration of support is even more startling when viewed in terms of the general population. The vast majority (73%) of volunteer hours were contributed by only 7% of Canadiansaged 15 and over.
Who are Canada’s volunteers? What personal and economicfactors (e.g., age, level of education, household income, religious affiliation) are associated with higher rates of volunteering? What motivated more than one quarter ofCanadians to volunteer their time? What prevented nearlythree quarters of Canadians from doing likewise? What dothese findings mean for Canadians charitable and nonprofitorganizations that hope to attract and retain volunteers?
This report draws on data from the 2000 National Survey of Giving, Volunteering and Participating, which surveyed14,724 Canadians aged 15 and older about their charitable giving and volunteering over a one-year period. It presents asnapshot of Canada’s volunteers, highlighting the personal andeconomic characteristics of Canadians who were most likely toparticipate in volunteer activities. It then examines volunteers’motivations for getting involved, and the barriers that preventvolunteers from giving more time and non-volunteers fromcontributing at all. It then explores the relationship betweenearly life experiences and volunteering in later life. The report concludes by suggesting what these findings may mean for charitable and nonprofit organizations that rely on volunteer effort.
Readers should note that this report presents findings onCanadian volunteers as a whole. Readers seeking informationabout volunteering in one or more of Canada’s provinces aredirected to www.givingandvolunteering.ca, which houses aseries of provincial fact sheets on volunteering, as well as adownloadable version of Caring Canadians, Involved
Canadians: Highlights from the 2000 National Survey of
Giving, Volunteering and Participating. Readers will also findon this Web site Understanding Canadian Volunteers: Using
the National Survey of Giving, Volunteering and Participating
to Build Your Volunteer Program, a manual that provides someguidance in applying NSGVP data to the volunteer programsof charitable and nonprofit organizations.
Figure 1. Much comes from the few
% of volunteers% of total hours
0%
40%
80%
25%
73%
25%
19%
25%
7%
25%
1%
20 to 71 hours 188 hours or more
72 to 187 hours19 hours or less
Volunteer Spirit 07/23 THIS ONE 7/28/04 12:30 PM Page 2
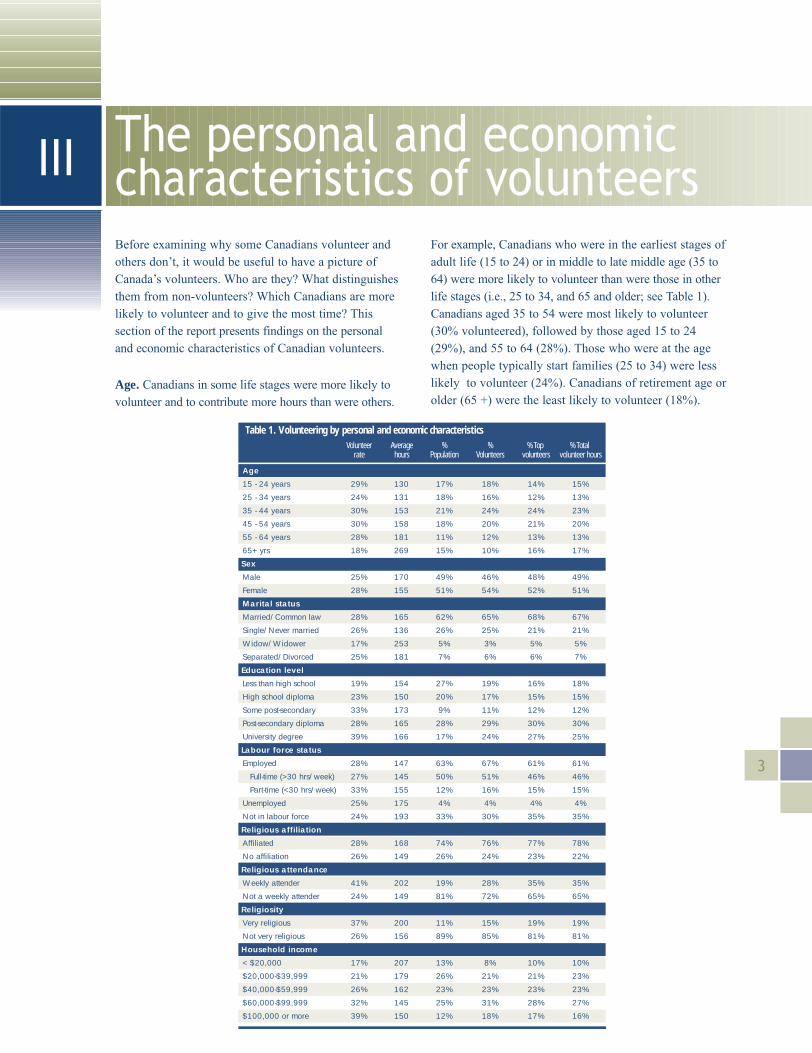
The personal and economiccharacteristics of volunteersIIIBefore examining why some Canadians volunteer andothers don’t, it would be useful to have a picture ofCanada’s volunteers. Who are they? What distinguishesthem from non-volunteers? Which Canadians are morelikely to volunteer and to give the most time? This section of the report presents findings on the personal and economic characteristics of Canadian volunteers.
Age. Canadians in some life stages were more likely tovolunteer and to contribute more hours than were others.
For example, Canadians who were in the earliest stages ofadult life (15 to 24) or in middle to late middle age (35 to64) were more likely to volunteer than were those in otherlife stages (i.e., 25 to 34, and 65 and older; see Table 1).Canadians aged 35 to 54 were most likely to volunteer(30% volunteered), followed by those aged 15 to 24(29%), and 55 to 64 (28%). Those who were at the agewhen people typically start families (25 to 34) were lesslikely to volunteer (24%). Canadians of retirement age orolder (65 +) were the least likely to volunteer (18%).
3
Table 1. Volunteering by personal and economic characteristics Volunteer Average % % % Top % Total
rate hours Population Volunteers volunteers volunteer hours
Age
15 - 24 years 29% 130 17% 18% 14% 15%
25 - 34 years 24% 131 18% 16% 12% 13%
35 - 44 years 30% 153 21% 24% 24% 23%
45 - 54 years 30% 158 18% 20% 21% 20%
55 - 64 years 28% 181 11% 12% 13% 13%
65+ yrs 18% 269 15% 10% 16% 17%
Sex
Male 25% 170 49% 46% 48% 49%
Female 28% 155 51% 54% 52% 51%
Marital status
Married/Common law 28% 165 62% 65% 68% 67%
Single/Never married 26% 136 26% 25% 21% 21%
Widow/Widower 17% 253 5% 3% 5% 5%
Separated/Divorced 25% 181 7% 6% 6% 7%
Education level
Less than high school 19% 154 27% 19% 16% 18%
High school diploma 23% 150 20% 17% 15% 15%
Some post-secondary 33% 173 9% 11% 12% 12%
Post-secondary diploma 28% 165 28% 29% 30% 30%
University degree 39% 166 17% 24% 27% 25%
Labour force status
Employed 28% 147 63% 67% 61% 61%
Full-time (>30 hrs/week) 27% 145 50% 51% 46% 46%
Part-time (<30 hrs/week) 33% 155 12% 16% 15% 15%
Unemployed 25% 175 4% 4% 4% 4%
Not in labour force 24% 193 33% 30% 35% 35%
Religious affiliation
Affiliated 28% 168 74% 76% 77% 78%
No affiliation 26% 149 26% 24% 23% 22%
Religious attendance
Weekly attender 41% 202 19% 28% 35% 35%
Not a weekly attender 24% 149 81% 72% 65% 65%
Religiosity
Very religious 37% 200 11% 15% 19% 19%
Not very religious 26% 156 89% 85% 81% 81%
Household income
< $20,000 17% 207 13% 8% 10% 10%
$20,000-$39,999 21% 179 26% 21% 21% 23%
$40,000-$59,999 26% 162 23% 23% 23% 23%
$60,000-$99,999 32% 145 25% 31% 28% 27%
$100,000 or more 39% 150 12% 18% 17% 16%
Volunteer Spirit 07/23 THIS ONE 7/28/04 12:30 PM Page 3

4
Although the percentage of Canadians who volunteereddeclined after age 54, the average number of hours contributedincreased steadily with age, from a low of 130 hours annuallyfor volunteers aged 15 to 24, to a high of 269 hours for thoseaged 65 and older.
Canadians in some age groups contributed a disproportionatelysmall percentage of total volunteer hours, given their represen-tation in the Canadian population, while others contributed adisproportionately large percentage. For example, Canadiansaged 25 to 34 made up 18% of the Canadian population and16% of volunteers, but contributed only 13% of the total hoursvolunteered. Conversely, those aged 65 and older made up15% of the population and 10% of volunteers, but contributed17% of all volunteer hours.
Sex. Women were more likely to volunteer than were men (28% vs. 25%; see Table 1), but male volunteers contributedmore hours, on average (170 hours for men vs. 155 for women).In terms of total volunteer hours, however, the contribution ofwomen and men appears to be equal. Women represented51% of the Canadian population and contributed 51% of allvolunteer hours; men represented 49% of the Canadian popula-tion and contributed 49% of all volunteer hours. However,men were somewhat more likely to be top volunteers; theyaccounted for 46% of volunteers, but 48% of top volunteers.
Marital status. Canadians who were married or in common-law relationships were more likely to volunteer than werethose who were single, divorced, or widowed. Twenty-eightpercent of married Canadians volunteered, compared to only17% of those who were widowed (see Table 1). Those whowere single and had never been married, or were divorced fellbetween these two extremes (26% and 25%, respectively).
Although those who were widowed were least likely to volunteer,these volunteers contributed by far the largest number of hours,on average (253). Volunteers who were divorced contributedmore hours, on average (181), than did those who were married(165) or single (136).
Canadians who were married were more likely than those who were single, divorced or widowed, to be top volunteers.This group represents 62% of the population and 65% ofvolunteers, but 68% of top volunteers.
Education. Generally speaking, Canadians with higher levelsof formal education were more likely to volunteer than werethose with lower levels, but there were some important devia-tions from this pattern. University graduates were the mostlikely to volunteer (39% volunteered), followed by those withsome post-secondary education (33%; see Table 1). Those who had completed some high school were the least likely tovolunteer (19%), somewhat behind those who possessed a highschool diploma (23%). However, those who had completed apost-secondary diploma were less likely to volunteer (28%)than were those with only some post-secondary education.
Volunteers who had completed only some post-secondary education contributed the largest number of hours, on average(173), followed by those with a university degree (166) or apost-secondary diploma (165). Those with a high school diploma or less volunteered somewhat fewer hours, onaverage (150 hours and 154 hours respectively).
Canadians in some education groups contributed a dispropor-tionately small percentage of total volunteer hours, given theirrepresentation in the Canadian population, while others con-tributed a disproportionately large percentage. For example,those with less than a high school diploma made up 27% ofthe population and 19% of volunteers, but contributed 18% oftotal volunteer hours; and those who graduated from highschool made up 20% of the population and 17% of volunteers,but contributed 15% of total volunteer hours. On the otherhand, Canadians with a university degree represented 17% ofthe population and 24% of volunteers, but contributed 25% oftotal volunteer hours.
Labour force status. The likelihood of volunteering variedsignificantly with labour force status. Canadians who wereemployed, particularly on a part-time basis, were more likelyto volunteer than were those who were unemployed or not inthe labour force.1 One third (33%) of those employed part-timevolunteered, compared to 27% of those who were employedfull-time, 25% of those who were unemployed, and 24% ofthose who were not in the labour force (see Table 1).
Perhaps not surprisingly, the amount of time that people devoted to volunteering increased as the time spent in employment decreased. Those who were not in the labourforce volunteered the most hours, on average (193), followedby those who were unemployed (175). Those who were
1 “Not in the labour force” refers to Canadians over the age of 15 who were not working and not actively seeking work. It includes people who are retired,full-time homemakers, full-time students, etc. It does not include those who are unemployed, i.e., not working but available for and actively seeking employ-ment. Full-time employment refers to employment for 30 or more hours per week.
Volunteer Spirit 07/23 THIS ONE 7/28/04 12:30 PM Page 4

employed part-time volunteered more hours, on average(155), than did those who were employed full-time (145).
Canadians who were not in the labour force and those whowere employed part-time contributed a disproportionatelylarge percentage of total volunteer hours, given theirrepresentation in the Canadian population, while thosewho were employed full-time contributed a disproportion-ately small percentage.
Those who are employed part-time made up 12% of the population and 16% of volunteers and contributed 15% oftotal volunteer hours; those who were not in the labourforce made up 33% of the population and 30% of volun-teers, but accounted for 35% of top volunteers and of totalvolunteer hours. Conversely, those who were employedfull-time constituted 50% of the population and 51% ofvolunteers, but contributed 46% of total volunteer hours.
Religious affinity. The NSGVP uses three measures of religious affinity: affiliation with an established religioustradition or place of worship, frequency of attendance at religious services, and self-identified degree of religiosity. All three of these measures suggest that those who are more religious are more likely to volunteer. For example,more than four in ten (41%) of those who attended weeklyreligious services volunteered, compared to only 24% ofthose who did not attend weekly services (see Table 1).Similarly, those who identified themselves as very religiouswere significantly more likely to volunteer than those whoidentified themselves as not very religious (37% vs. 26%).Those who are affiliated with a religious tradition of somekind were somewhat more likely to volunteer than werethose with no religious affiliation (28% vs. 26%).
Volunteers who were more religious also volunteeredmore hours, on average, than those who were not. Thosewho attended weekly religious services contributed far morehours, on average, than did those who attended services lessfrequently or did not attend services at all (202 hours vs. 149hours). Similarly, those who identified themselves as veryreligious contributed more hours than did those who did notidentify themselves in this way (200 vs. 156), and thosewho were affiliated with a religious tradition contributedmore hours than did those with no affiliation (168 vs. 149).
More religious Canadians contributed a disproportionatelylarge percentage of total volunteer hours. Canadians whoattended religious services weekly made up slightly less than one fifth (19%) of the Canadian population and 28% of volunteers, but accounted for more than onethird (35%) of top volunteers and of total volunteer hours.Similarly, Canadians who identified themselves as veryreligious represented 11% of the population and 15% ofvolunteers, but accounted for 19% of top volunteers andof total volunteer hours.
Household income. Canadians with higher householdincomes were more likely to volunteer and to contribute more hours on average than were those with lower house-hold incomes. Those with annual household incomes of$100,000 or more were the most likely to volunteer (39%volunteered; see Table 1), while fewer than half as manyof those with annual household incomes of less than$20,000 (17%) volunteered. However, volunteers withlower household incomes tended to volunteer more hours,on average, than did those with higher household incomes.Volunteers with annual household incomes of less than$20,000 volunteered the most volunteer hours (207), whilethose with household incomes of $60,000 to $99,999 volunteered the fewest (145), followed closely by thosewith household incomes of $100,000 or more (150).
Canadians with the lower household incomes contributeda disproportionately small percentage of total volunteerhours, while those with higher household incomes con-tributed a disproportionately large percentage. Those withannual household incomes of less than $20,000 made up13% of the Canadian population, but contributed 10% ofthe total hours volunteered. Conversely, those with house-hold incomes of $100,000 or more made up 12% of thepopulation, but accounted for 16% of volunteer hours.
5
Volunteer Spirit 07/23 THIS ONE 7/28/04 12:30 PM Page 5

IVThe NSGVP asked volunteers whether any of eight potentialfactors motivated them to volunteer (see Figure 2). The moti-vation cited most commonly (by 95% of volunteers) was abelief in the cause supported by the organization for whichrespondents volunteered. The majority of volunteers also saidthat they volunteered because they wanted to use their skillsand experiences (81%), were personally affected, or knewsomeone who was personally affected, by the cause the organization supports (69%), or wanted to explore their ownstrengths (57%). Somewhat fewer volunteers got involvedbecause their friends volunteered (30%), in order to fulfill religious obligations or beliefs (26%), or to improve their jobopportunities (23%). A small percentage (8%) were requiredto volunteer by their school or employer, or as part of theterms of a community service order.
Motivations for volunteering and the personal and economic characteristics of volunteersThe motivations of volunteers varied, sometimes dramatically,according to their personal and economic characteristics, suchas age, education, and household income.
Age. Volunteers aged 15 to 24 were far more likely than those 25 and older to volunteer in order to improve their jobopportunities (55% of young volunteers cited this reason forvolunteering; see Table 2) and to explore their strengths (71%of young volunteers). Volunteers aged 65 and older were morelikely than their younger counterparts to volunteer in order tofulfill religious obligations or beliefs (50% of volunteers aged
65 and older cited this motivation). This is perhaps unsurpris-ing, given that older people tend to be more religious thanyounger people.
Both the youngest and the oldest volunteers were more likely than those between these two extremes to say that they volunteered because their friends volunteered (42% ofvolunteers aged 15 to 24; 34% of volunteers 65 and older).Conversely, these groups were the least likely to say that theyvolunteered because they or someone that they know wasdirectly affected by the cause the organization supports (59%of volunteers aged 15 to 24; 65% of volunteers 65 and older).
Sex. Female volunteers were more likely to cite almost all motivations for volunteering than were their male counter-parts, with one exception: men were more likely to volunteeredbecause their friends volunteered (33% of male volunteers vs.28% of female volunteers; see Table 2).
Marital Status. Much of the variation in the pattern ofresponses according to marital status seems to be at least partially related to age, rather than marital status per se. For example, volunteers who were widowed, who tend to be older on average, were significantly more likely to cite religious obligations or beliefs as a reason for volunteering(45% cited this reason) than were volunteers who were singleand never married (21%; see Table 2). Similarly, single andnever married volunteers, who tend to be younger on average,were more likely than those with any other marital status tosay that they volunteered to improve their job opportunities(46%) and to explore their strengths (68%).
Education. The motivations for volunterring remained fairlyconsistent across education groups, with the exception of volunteers with less than a high school diploma. These volunteers were significantly more likely than other volunteersto say that they volunteered because their friends volunteered(44%), or because they wished to improve job opportunities(37%). They were also more likely to say that they wererequired to volunteer (13%; see Table 2).
Labour force status. Labour force status appears to be linkedto some volunteer motivations. For example, volunteers whowere unemployed or employed part-time were more likely than
6
Motivations for volunteering
Figure 2. Motivations for volunteering, all volunteers
0%
50%
100%
30%
Friendsvolunteer
26%
Fulfill religiousobligationsor beliefs
23%
Improve jobopportunities
8%
Requiredto volunteer
57%
Explore ownstrengths
69%
You/someoneyou know
affected by cause
81%
Use skills orexperiences
95%
Believe incause
Volunteer Spirit 07/23 THIS ONE 7/28/04 12:30 PM Page 6
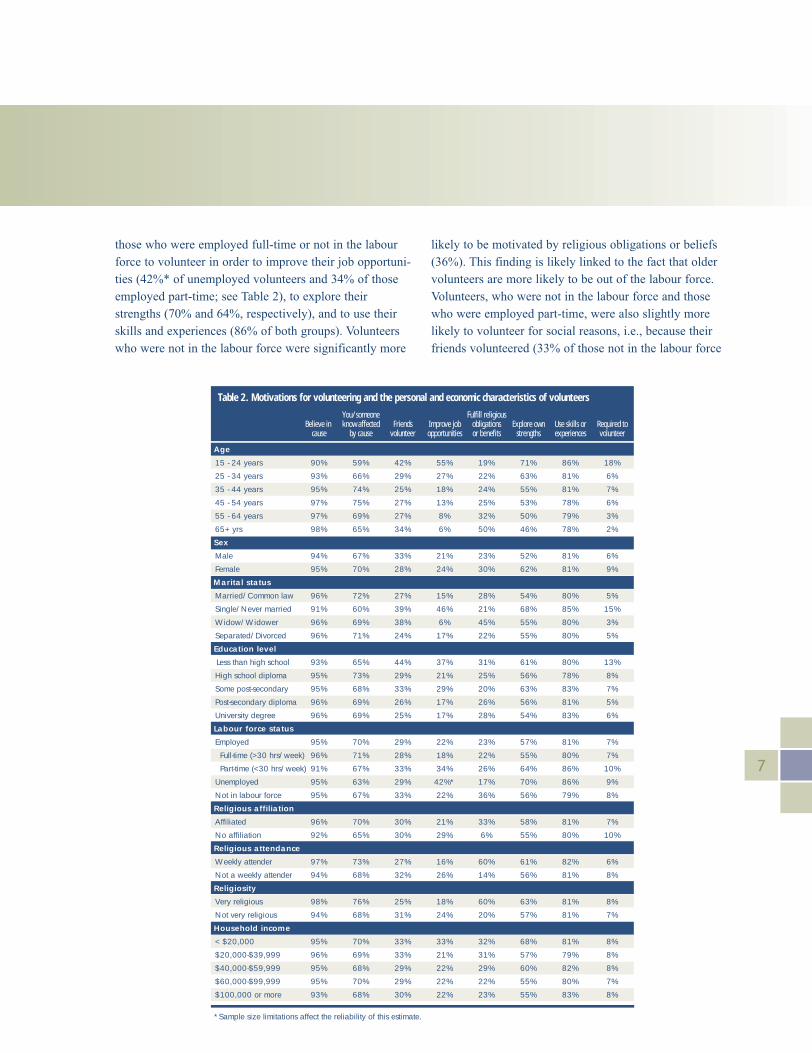
those who were employed full-time or not in the labourforce to volunteer in order to improve their job opportuni-ties (42%* of unemployed volunteers and 34% of thoseemployed part-time; see Table 2), to explore theirstrengths (70% and 64%, respectively), and to use theirskills and experiences (86% of both groups). Volunteerswho were not in the labour force were significantly more
likely to be motivated by religious obligations or beliefs(36%). This finding is likely linked to the fact that oldervolunteers are more likely to be out of the labour force.Volunteers, who were not in the labour force and thosewho were employed part-time, were also slightly morelikely to volunteer for social reasons, i.e., because theirfriends volunteered (33% of those not in the labour force
7
Table 2. Motivations for volunteering and the personal and economic characteristics of volunteers
You/someone Fulfill religiousBelieve in know affected Friends Improve job obligations Explore own Use skills or Required to
cause by cause volunteer opportunities or benefits strengths experiences volunteer
Age
15 - 24 years 90% 59% 42% 55% 19% 71% 86% 18%
25 - 34 years 93% 66% 29% 27% 22% 63% 81% 6%
35 - 44 years 95% 74% 25% 18% 24% 55% 81% 7%
45 - 54 years 97% 75% 27% 13% 25% 53% 78% 6%
55 - 64 years 97% 69% 27% 8% 32% 50% 79% 3%
65+ yrs 98% 65% 34% 6% 50% 46% 78% 2%
Sex
Male 94% 67% 33% 21% 23% 52% 81% 6%
Female 95% 70% 28% 24% 30% 62% 81% 9%
Marital status
Married/Common law 96% 72% 27% 15% 28% 54% 80% 5%
Single/Never married 91% 60% 39% 46% 21% 68% 85% 15%
Widow/Widower 96% 69% 38% 6% 45% 55% 80% 3%
Separated/Divorced 96% 71% 24% 17% 22% 55% 80% 5%
Education level
Less than high school 93% 65% 44% 37% 31% 61% 80% 13%
High school diploma 95% 73% 29% 21% 25% 56% 78% 8%
Some post-secondary 95% 68% 33% 29% 20% 63% 83% 7%
Post-secondary diploma 96% 69% 26% 17% 26% 56% 81% 5%
University degree 96% 69% 25% 17% 28% 54% 83% 6%
Labour force status
Employed 95% 70% 29% 22% 23% 57% 81% 7%
Full-time (>30 hrs/week) 96% 71% 28% 18% 22% 55% 80% 7%
Part-time (<30 hrs/week) 91% 67% 33% 34% 26% 64% 86% 10%
Unemployed 95% 63% 29% 42%* 17% 70% 86% 9%
Not in labour force 95% 67% 33% 22% 36% 56% 79% 8%
Religious affiliation
Affiliated 96% 70% 30% 21% 33% 58% 81% 7%
No affiliation 92% 65% 30% 29% 6% 55% 80% 10%
Religious attendance
Weekly attender 97% 73% 27% 16% 60% 61% 82% 6%
Not a weekly attender 94% 68% 32% 26% 14% 56% 81% 8%
Religiosity
Very religious 98% 76% 25% 18% 60% 63% 81% 8%
Not very religious 94% 68% 31% 24% 20% 57% 81% 7%
Household income
< $20,000 95% 70% 33% 33% 32% 68% 81% 8%
$20,000-$39,999 96% 69% 33% 21% 31% 57% 79% 8%
$40,000-$59,999 95% 68% 29% 22% 29% 60% 82% 8%
$60,000-$99,999 95% 70% 29% 22% 22% 55% 80% 7%
$100,000 or more 93% 68% 30% 22% 23% 55% 83% 8%
*Sample size limitations affect the reliability of this estimate.
Volunteer Spirit 07/23 THIS ONE 7/28/04 12:30 PM Page 7

or employed part-time, vs. 28-29% of those employed full-time or unemployed).
Religious affinity. All three measures of religiosity indicatethat those with a greater religious affinity were much morelikely to volunteer to fulfill religious beliefs or obligations(e.g., 33% of those with a religious affiliation cited this reasonvs. 6% of those with no affiliation; see Table 2). Indeed, volunteers with significant religious affinities were more likely to cite most motivations to volunteering. The mostnoticeable exceptions to this pattern were decreased tendenciesto volunteer in order to improve job opportunities, and becausetheir friends volunteered.
Household Income. The motivations of volunteers did notvary dramatically according to household income. However,volunteers with annual household incomes of less than $20,000were noticeably more likely than were other volunteers to saythat they volunteered in order to improve their job opportunities(33%; see Table 2) and to explore their strengths (68%).Volunteers with higher household incomes were less likelythan those in other income groups to say that they volunteered in order to fulfill religious obligations or beliefs (23% of vol-unteers with annual household incomes of $100,000 or more;22% of those with incomes between $60,000 and $99,999).
Motivations for volunteering and level of supportTop volunteers (i.e., volunteers who contributed 188 hours ormore annually) were more likely than other volunteers to citecertain motivations. Similarly, volunteers who cited certainmotivations were more likely to contribute more volunteerhours than were volunteers with no specific motivation.
Top volunteers were more likely than were other volunteers to say that they volunteered in order to use their skills andexperiences (89% of top volunteers vs. 78% of other volun-teers; see Figure 3), to fulfill religious obligations of beliefs(32% vs. 25%), and to explore their own strengths (62% vs.56%). Top volunteers were less likely to say that they volun-teered because their friends volunteered (26% top volunteersvs. 32% other volunteers), to improve their job opportunities(22% vs. 23%), OR because they were required to volunteer(7% vs. 8%).
It is worth noting that the motivations cited least commonly by top volunteers are those that are more commonly cited byyounger volunteers, which appears to reinforce the role of agein volunteering.
8
Figure 3. Motivations for volunteering, top volunteers vs. other volunteers
Other volunteersTop volunteers
0%
50%
100%
32%26%
56%62%
68%72%
78%
89%94% 96%
25%32%
Fulfill religiousobligations or beliefs
Friends volunteer
23% 22%
8% 7%
Required to volunteer
Improve job opportunities
Use skills or experiences
Explore own strengths
You/someoneyou know
affected by cause
Believe in cause
Volunteer Spirit 07/23 THIS ONE 7/28/04 12:30 PM Page 8
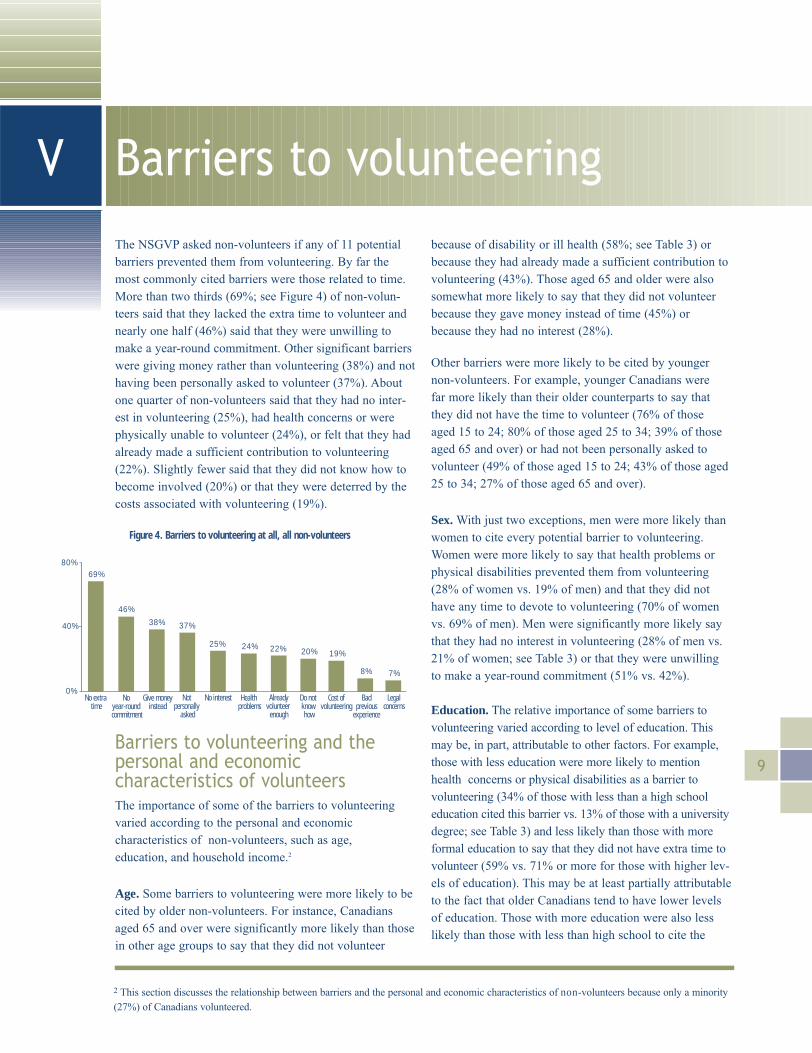
Barriers to volunteeringVThe NSGVP asked non-volunteers if any of 11 potential barriers prevented them from volunteering. By far themost commonly cited barriers were those related to time.More than two thirds (69%; see Figure 4) of non-volun-teers said that they lacked the extra time to volunteer andnearly one half (46%) said that they were unwilling tomake a year-round commitment. Other significant barrierswere giving money rather than volunteering (38%) and nothaving been personally asked to volunteer (37%). Aboutone quarter of non-volunteers said that they had no inter-est in volunteering (25%), had health concerns or werephysically unable to volunteer (24%), or felt that they hadalready made a sufficient contribution to volunteering(22%). Slightly fewer said that they did not know how tobecome involved (20%) or that they were deterred by thecosts associated with volunteering (19%).
Barriers to volunteering and the personal and economic characteristics of volunteersThe importance of some of the barriers to volunteeringvaried according to the personal and economic characteristics of non-volunteers, such as age, education, and household income.2
Age. Some barriers to volunteering were more likely to becited by older non-volunteers. For instance, Canadiansaged 65 and over were significantly more likely than thosein other age groups to say that they did not volunteer
because of disability or ill health (58%; see Table 3) orbecause they had already made a sufficient contribution tovolunteering (43%). Those aged 65 and older were alsosomewhat more likely to say that they did not volunteerbecause they gave money instead of time (45%) orbecause they had no interest (28%).
Other barriers were more likely to be cited by younger non-volunteers. For example, younger Canadians were far more likely than their older counterparts to say thatthey did not have the time to volunteer (76% of those aged 15 to 24; 80% of those aged 25 to 34; 39% of thoseaged 65 and over) or had not been personally asked to volunteer (49% of those aged 15 to 24; 43% of those aged25 to 34; 27% of those aged 65 and over).
Sex. With just two exceptions, men were more likely thanwomen to cite every potential barrier to volunteering. Women were more likely to say that health problems orphysical disabilities prevented them from volunteering(28% of women vs. 19% of men) and that they did nothave any time to devote to volunteering (70% of womenvs. 69% of men). Men were significantly more likely saythat they had no interest in volunteering (28% of men vs.21% of women; see Table 3) or that they were unwillingto make a year-round commitment (51% vs. 42%).
Education. The relative importance of some barriers tovolunteering varied according to level of education. Thismay be, in part, attributable to other factors. For example,those with less education were more likely to mentionhealth concerns or physical disabilities as a barrier to volunteering (34% of those with less than a high schooleducation cited this barrier vs. 13% of those with a universitydegree; see Table 3) and less likely than those with moreformal education to say that they did not have extra time to volunteer (59% vs. 71% or more for those with higher lev-els of education). This may be at least partially attributableto the fact that older Canadians tend to have lower levelsof education. Those with more education were also lesslikely than those with less than high school to cite the
9
Figure 4. Barriers to volunteering at all, all non-volunteers
0%
40%
80%
24%
Health problems
25%
No interest
20%
Do not know how
19%
Cost ofvolunteering
8%
Badprevious
experience
7%
Legalconcerns
22%
Alreadyvolunteer
enough
37%
Not personally
asked
38%
Give moneyinstead
46%
No year-round commitment
69%
No extra time
2 This section discusses the relationship between barriers and the personal and economic characteristics of non-volunteers because only a minority(27%) of Canadians volunteered.
Volunteer Spirit 07/23 THIS ONE 7/28/04 12:30 PM Page 9

financial costs associated with volunteering as a barrier (10% of those with a university degree vs. 21% of those withless than a high school education). This may be at least partiallyattributable to the fact that Canadians with higher levels of education tend to have higher household incomes.
Labour force status. The importance of some barriers to volunteering varied significantly according to Canadians’labour force status. It is perhaps no surprise that Canadianswho were employed, particularly on a full-time basis, were morelikely than those who were unemployed or not in the labour forceto say that they did not volunteer because they had no time (81%of those who were employed cited this barrier, compared toapproximately half of those who were unemployed or not inthe labour force; see Table 3) or because they were unwillingto make a year-round commitment (49% of those who were
employed vs. approximately four in ten of those who wereunemployed or not in the labour force).
Canadians who were not in the labour force were more likelythan others to say that they did not volunteer because of ill healthor disability (46%). This may be because many of those who arenot in the labour force are retired or medically unable to seekemployment. Perhaps not surprisingly, those who were unem-ployed were significantly less likely to say that they gave moneyinstead of volunteering (23%) and significantly more likely(33%) to cite the costs associated with volunteering as a barrier.
Those who were unemployed were also more likely to say thatthey did not volunteer because they had not been personallyasked (51% of unemployed non-volunteers vs. 39% ofemployed non-volunteers and 31% of those not in the labour
10
Table 3. Barriers to volunteering more and the personal and economic characteristics of volunteersAlready Not
volunteer No Health personally Do not Cost of Legal No Give money No year-round Bad previousenough extra time problems asked know how volunteering concerns interest instead commitment experience
Age
15 - 24 years 11% 76% 15% 49% 29% 20% 6% 24% 24% 24% 11%
25 - 34 years 11% 80% 9% 43% 22% 19% 8% 21% 37% 47% 7%
35 - 44 years 17% 78% 15% 33% 18% 19% 7% 21% 405 50% 7%
45 - 54 years 27% 72% 22% 34% 17% 18% 7% 27% 41% 48% 8%
55 - 64 years 27% 64% 35% 31% 16% 19% 8% 27% 40% 43% 8%
65+ yrs 43% 39% 58% 27% 15% 17% 6% 28% 45% 41% 8%
Sex
Male 23% 69% 19% 39% 21% 20% 9% 28% 39% 51% 9%
Female 21% 70% 28% 34% 18% 17% 5% 21% 37% 42% 7%
Marital status
Married/Common law 23% 73% 22% 35% 18% 17% 7% 25% 42% 47% 7%
Single/Never married 16% 70% 18% 45% 25% 20% 8% 25% 30% 47% 10%
Widow/Widower 43% 33% 58% 24% 18% 21% 9% 25% 42% 40% 7%
Separated/Divorced 18% 64% 33% 28% 13% 24% 6% 22% 31% 44% 5%
Education level
Less than high school 26% 59% 34% 33% 22% 21% 7% 28% 33% 39% 8%
High school diploma 21% 74% 24% 38% 20% 21% 10% 25% 39% 46% 7%
Some post-secondary 13% 75% 20% 45% 26% 20% 7% 21% 35% 47% 10%
Post-secondary diploma 20% 75% 20% 37% 17% 19% 7% 23% 42% 52% 8%
University degree 22% 71% 13% 35% 16% 10% 4% 22% 38% 50% 8%
Labour force status
Employed 18% 81% 12% 39% 19% 17% 7% 24% 40% 49% 8%
Full-time(>30 hrs/week) 18% 82% 11% 38% 18% 16% 7% 24% 41% 50% 7%
Part-time(<30 hrs/week) 20% 75% 18% 40% 21% 20% 5% 20% 32% 46% 10%
Unemployed 10% 50% 18% 51% 37% 33% 6% 24% 23% 42% 5%
Not in labour force 29% 51% 46% 31% 20% 20% 8% 26% 36% 41% 9%
Religious affiliation
Affiliated 23% 69% 26% 36% 21% 19% 7% 25% 40% 46% 8%
No affiliation 17% 71% 18% 39% 17% 19% 7% 24% 34% 47% 9%
Religious attendance
Weekly attender 30% 64% 33% 35% 24% 18% 11% 21% 42% 43% 7%
Not a weekly attender 20% 71% 22% 37% 20% 19% 7% 25% 38% 48% 8%
Religiosity
Very religious 34% 64% 34% 30% 22% 20% 11% 18% 39% 40% 10%
Not very religious 20% 70% 22% 38% 20% 19% 7% 25% 39% 48% 8%
Household income
< $20,000 29% 51% 42% 34% 22% 30% 10% 25% 28% 39% 9%
$20,000-$39,999 23% 64% 32% 36% 22% 22% 6% 27% 34% 44% 8%
$40,000-$59,999 19% 73% 20% 38% 21% 16% 8% 27% 40% 51% 7%
$60,000-$99,999 18% 78% 13% 37% 18% 14% 7% 21% 42% 49% 9%
$100,000 or more 24% 81% 11% 36% 12% 10% 5% 22% 45% 44% 6%
Volunteer Spirit 07/23 THIS ONE 7/28/04 12:30 PM Page 10

11
force) or because they did not know how to get involved(37% vs. 19% of employed non-volunteers and 20% ofthose who are not in the labour force).
Religious affinity. Religious non-volunteers were lesslikely than their less religious counterparts to say that theydid not volunteer because they had no extra time, were notinterested in volunteering, or were unwilling to make ayear-round commitment (see Table 3). They were morelikely to say that they did not volunteer because they hadalready made a sufficient contribution to volunteering or had health problems or were physically unable to volunteer. These findings are likely related to the fact that religious Canadians are likely to be older than lessreligious Canadians.
Household income. The relative importance of some barriers to volunteering appears to be directly related to the availability of discretionary funds. For example, non-volunteers with higher household incomes were less likelythan were those with lower household incomes to say thatthey did not volunteer because of the costs associated withvolunteering (10% of those with annual household incomesof $100,000 or more cited this barrier, compared to 30% ofthose with incomes of less than $20,000; see Table 3) and more likely to say that they gave money instead ofvolunteering (45% vs. 28%).
Other variations relating to household income may belinked to other personal characteristics. For example,those with higher household incomes were also more likely to say that they did not volunteer because they did not have extra time (81% of those with incomes of$100,000 or more vs. 51% of those with incomes of lessthan $20,000). This may be related to their employmentstatus (i.e., higher earners are more likely to be employedfull-time). Similarly, those with higher household incomeswere less likely to say that they did not volunteer becauseof ill health or disability (11% of those with householdincomes of $100,000 or more vs. 42% of those withincomes of less than $20,000). This is perhaps not surpris-ing, given the well-known link between poor health andlower incomes.
Barriers to volunteering moreThe NSGVP asked volunteers whether any of the same 11 potential barriers kept them from volunteering moretime. By far the most commonly cited barrier to volunteer-ing more was having no extra time (cited by 76% of vol-unteers; see Figure 5). A second significant barrier, citedby more than one third (34%) of volunteers, was alsotime-related: unwillingness to make a year-round commit-
ment. Other barriers to volunteering more were havingalready made a sufficient contribution to volunteering(29%) and giving money instead of volunteering (24%).Fewer volunteers said that they did not volunteer morebecause they had not been asked (17%), had no interest(16%), had health concerns or were physically unable(16%), or were concerned about the costs of volunteering(13%). One in ten volunteers or fewer did not volunteermore because they did not know how (10%), had had abad previous experience with volunteering (8%), or were concerned that they could be sued because of theirvolunteer activities (5%).
Barriers to volunteering more and level of supportTop volunteers (i.e., volunteers who contributed 188 hoursor more annually) were less likely than other volunteers tosay that they did not volunteer more because they wereunwilling to make a year-round commitment (21% of topvolunteers vs. 38% of other volunteers; see Figure 6), gavemoney instead of volunteering more (16% vs. 26%), orhad not been personally asked to volunteer more (11% vs.19%). However, top volunteers were more likely than wereother volunteers to say that they thought they had alreadymade a sufficient contribution to volunteering (39% of topvolunteers vs. 26% of other volunteers). This is perhapsunderstandable, given the large proportion of total volun-teer hours that come from top volunteers.
Figure 5. Barriers to volunteering more, all volunteers
0%
45%
90%
16%
Health problems
17%
No interest
13%
Do not knowhow
10%
Cost ofvolunteering
8%
Bad previousexperience
5%
Legalconcerns
16%
Alreadyvolunteer
enough
24%
Not personally
asked
29%
Give moneyinstead
34%
No year-round commitment
76%
No extra time
Figure 6. Barriers to volunteering more, top volunteers vs. other volunteers
0%
45%
90%
19%
11%
26%16%
26%
39%38%
21%
75%76%
17%13% 15%17%
12%15%
Other volunteersTop volunteers
No interestNot personally asked
Cost of volunteering
Healthproblems
11%6% 8% 7%
Bad previousexperience
5% 7%
Legal concernsDo notknow how
No year-round
commitment
Give mone instead
Alreadyvolunteerenough
No extra time
Volunteer Spirit 07/23 THIS ONE 7/28/04 12:30 PM Page 11

VI
12
Early life experiences and volunteeringIn an attempt to identify predictors of donating and volunteering,the NSGVP asked respondents whether they had had any of arange of nine early life experiences that are thought to be relatedto giving and volunteering later in life. The most commonly citedearly life experience was participation in an organized team sport(66% of respondents; see Figure 9), followed by seeing a rolemodel help others in some way (53%). About half of respondentssaid that they had been helped in the past by others (50%), hadbeen members of a youth group (49%), or had participated indoor-to-door canvassing to raise money (48%). Relatively fewrespondents said that they had been active in a religious group(28%), or in student government (18%).
Early life experiences as a predictor of volunteeringCanadians who had had any of the early life experiences cov-ered by the survey were more likely to volunteer than werethose who had not. Those whose parent(s) had volunteeredwere more likely to volunteer (39% vs. 20% of those whoseparents had not volunteered; see Figure 8). Similarly, thosewho had been active in student government were more likelyto volunteer (42% vs. 24%), as were those who had beenactive in a religious group (38% vs. 23%), those who volun-teered in their youth (36% vs. 21%), or those who belonged toa youth group (35% vs. 20%). Some youth experiences hadless effect, including door-to-door canvassing (33% of thosewho had this experience when young volunteered later in lifevs. 22% of those who had not had this experience) and partici-pating in an organized sport (31% vs. 21%). It is interesting tonote that there is a tendency for the less common early lifeexperiences to have a greater effect on the likelihood of volun-
teering. For example, only 18% of respondents had been activein student government, but 42% of those who had had thisexperience volunteered later in life.
Early life experiences and their effect on motivations and barriers to volunteering Some motivations for volunteering were more affected thanothers by the early life experiences covered in the NSGVP(see Table 4). Those who had had one of these experienceswere more likely than those who had not to say that they volunteered because they or someone they knew was personallyaffected by the cause the organization supports, because theywanted to use their skills or experience, or because they wanted to explore their own strengths.
In comparison, the early life experiences covered in the survey had little impact on the likelihood of volunteeringbecause your friends volunteer or to improve job opportunities.These motivations are, presumably, affected more by currentcircumstances. Some life experiences had a major impact onparticular motivations. Most notable in this regard is the factthat those who were active in a religious organization whenyoung were much more likely than those who were not to say that they volunteered to fulfill religious obligations.
Figure 7. Early life experiences, all respondents
0%
40%
80%
50% 49%53%
66%
Saw role model
help others
Belonged to youth
group
Helped by others
Participated inteam sports
45%40%
28%
18%
48%
Didvolunteer
work
Active inreligiousgroup
Active instudent gov't
Parent(s)volunteered
Door-to-doorcanvassing
Figure 8. Volunteer rate, respondents with and without specific early life experiences
0%
31%21%
33%22%
34%
30% 60%
20%
35%20%
35%20%
21%36%
38%23%
39%20%
42%24%
Belonged to youth group
Helped by others
Saw role model help others
Door-to-door canvassing
Participated in team sports
Active in student gov'tParent(s)volunteered
Active in religious group
Did volunteer work
Without youth experienceWith youth experience
Volunteer Spirit 07/23 THIS ONE 7/28/04 12:30 PM Page 12
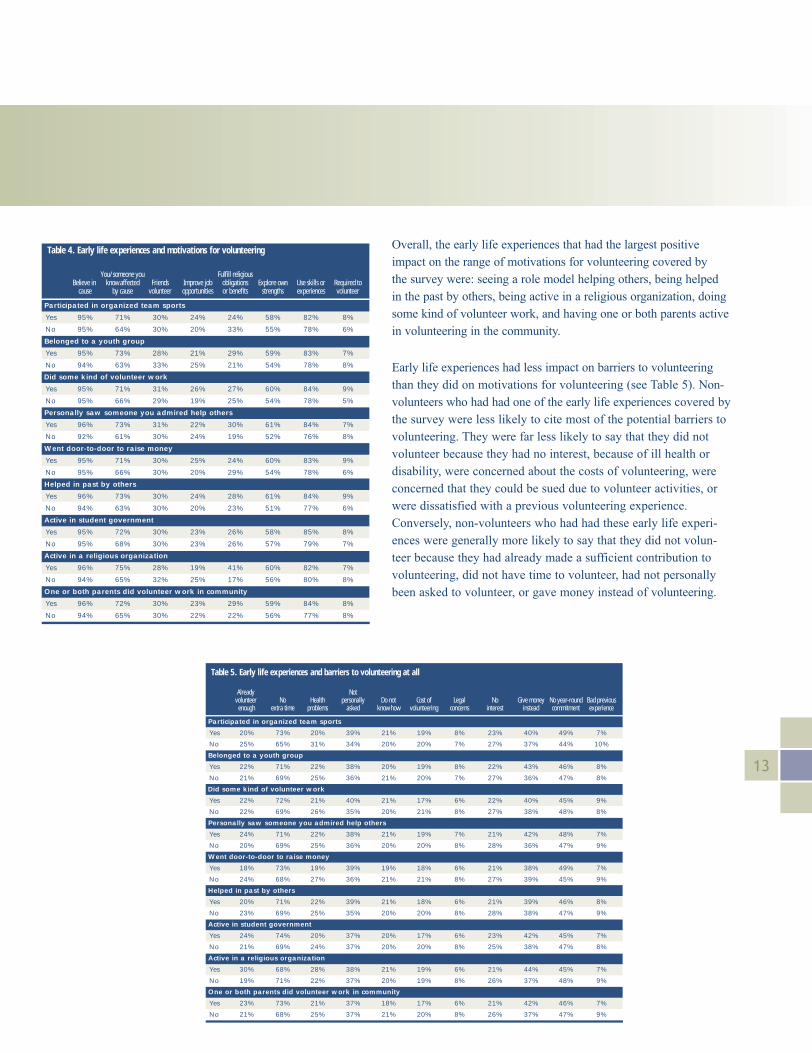
Overall, the early life experiences that had the largest positiveimpact on the range of motivations for volunteering covered by the survey were: seeing a role model helping others, being helpedin the past by others, being active in a religious organization, doingsome kind of volunteer work, and having one or both parents activein volunteering in the community.
Early life experiences had less impact on barriers to volunteeringthan they did on motivations for volunteering (see Table 5). Non-volunteers who had had one of the early life experiences covered bythe survey were less likely to cite most of the potential barriers tovolunteering. They were far less likely to say that they did notvolunteer because they had no interest, because of ill health ordisability, were concerned about the costs of volunteering, wereconcerned that they could be sued due to volunteer activities, orwere dissatisfied with a previous volunteering experience.Conversely, non-volunteers who had had these early life experi-ences were generally more likely to say that they did not volun-teer because they had already made a sufficient contribution tovolunteering, did not have time to volunteer, had not personallybeen asked to volunteer, or gave money instead of volunteering.
13
Table 4. Early life experiences and motivations for volunteering
You/someone you Fulfill religiousBelieve in know affected Friends Improve job obligations Explore own Use skills or Required to
cause by cause volunteer opportunities or benefits strengths experiences volunteer
Participated in organized team sports
Yes 95% 71% 30% 24% 24% 58% 82% 8%
No 95% 64% 30% 20% 33% 55% 78% 6%
Belonged to a youth group
Yes 95% 73% 28% 21% 29% 59% 83% 7%
No 94% 63% 33% 25% 21% 54% 78% 8%
Did some kind of volunteer work
Yes 95% 71% 31% 26% 27% 60% 84% 9%
No 95% 66% 29% 19% 25% 54% 78% 5%
Personally saw someone you admired help others
Yes 96% 73% 31% 22% 30% 61% 84% 7%
No 92% 61% 30% 24% 19% 52% 76% 8%
Went door-to-door to raise money
Yes 95% 71% 30% 25% 24% 60% 83% 9%
No 95% 66% 30% 20% 29% 54% 78% 6%
Helped in past by others
Yes 96% 73% 30% 24% 28% 61% 84% 9%
No 94% 63% 30% 20% 23% 51% 77% 6%
Active in student government
Yes 95% 72% 30% 23% 26% 58% 85% 8%
No 95% 68% 30% 23% 26% 57% 79% 7%
Active in a religious organization
Yes 96% 75% 28% 19% 41% 60% 82% 7%
No 94% 65% 32% 25% 17% 56% 80% 8%
One or both parents did volunteer work in community
Yes 96% 72% 30% 23% 29% 59% 84% 8%
No 94% 65% 30% 22% 22% 56% 77% 8%
Table 5. Early life experiences and barriers to volunteering at all
Already Notvolunteer No Health personally Do not Cost of Legal No Give money No year-round Bad previous
enough extra time problems asked know how volunteering concerns interest instead commitment experience
Participated in organized team sports
Yes 20% 73% 20% 39% 21% 19% 8% 23% 40% 49% 7%
No 25% 65% 31% 34% 20% 20% 7% 27% 37% 44% 10%
Belonged to a youth group
Yes 22% 71% 22% 38% 20% 19% 8% 22% 43% 46% 8%
No 21% 69% 25% 36% 21% 20% 7% 27% 36% 47% 8%
Did some kind of volunteer work
Yes 22% 72% 21% 40% 21% 17% 6% 22% 40% 45% 9%
No 22% 69% 26% 35% 20% 21% 8% 27% 38% 48% 8%
Personally saw someone you admired help others
Yes 24% 71% 22% 38% 21% 19% 7% 21% 42% 48% 7%
No 20% 69% 25% 36% 20% 20% 8% 28% 36% 47% 9%
Went door-to-door to raise money
Yes 18% 73% 19% 39% 19% 18% 6% 21% 38% 49% 7%
No 24% 68% 27% 36% 21% 21% 8% 27% 39% 45% 9%
Helped in past by others
Yes 20% 71% 22% 39% 21% 18% 6% 21% 39% 46% 8%
No 23% 69% 25% 35% 20% 20% 8% 28% 38% 47% 9%
Active in student government
Yes 24% 74% 20% 37% 20% 17% 6% 23% 42% 45% 7%
No 21% 69% 24% 37% 20% 20% 8% 25% 38% 47% 8%
Active in a religious organization
Yes 30% 68% 28% 38% 21% 19% 6% 21% 44% 45% 7%
No 19% 71% 22% 37% 20% 19% 8% 26% 37% 48% 9%
One or both parents did volunteer work in community
Yes 23% 73% 21% 37% 18% 17% 6% 21% 42% 46% 7%
No 21% 68% 25% 37% 21% 20% 8% 26% 37% 47% 9%
Volunteer Spirit 07/23 THIS ONE 7/28/04 12:30 PM Page 13

ConclusionVIIThe reasons why Canadians volunteer and the barriers that prevent them from giving more time or from volunteering at allvary according to such factors as age, education, employmentstatus, and income. Charitable and nonprofit organizations thatrely on volunteer effort and that hope to encourage higher levelsof volunteering can benefit from understanding these variationsand giving some thought to their practical implications.
The top three reasons why people volunteer are: belief in thecause supported by the organization (95% of volunteers), adesire to use their skills and experiences (81%), and beingpersonally affected or knowing someone who has been person-ally affected by the cause (69%). This suggests that successfulrecruitment efforts may be those that focus on communicatingthe mission of the organization and what it has accomplishedthrough voluntary effort; clearly identify the skills that organi-zations are seeking in their volunteers; and start close to home,with those who have been touched by the organization andhave some familiarity with its work.
Different volunteers have different needs and expectations. For example, volunteers aged 15-24 were more likely to say that they volunteered to explore their strengths (71%), to improve their job opportunities (55%), and because theirfriends volunteered (42%). Accommodating these differencescan increase not only the pool of volunteers, but also the number of hours volunteered. Canadians who volunteeredto improve their job opportunities or because their friendsvolunteered tended to give more time on average than thosewho did not volunteer for these reasons.
Time is the biggest barrier to volunteering. More than two thirds(69%) of non-volunteers said that lack of time prevented themfrom getting involved. Nearly half (46%) were unwilling tomake a year-round commitment to volunteering. This jumped to81% and 49% respectively for employed Canadians. Involvingthese individuals may require more short-term volunteer assign-ments, more flexible hours for volunteer assignments, and moreemployer involvement in and support for volunteering.
More than three quarters (76%) of current volunteers said that they had no time to volunteer more; nearly one-third(29%) felt that they had made a sufficient contribution tovolunteering. This jumped to 39% among top volunteers who gave 188 hours annually.
Special efforts and accommodations may have to be made if certain groups are to be drawn into the volunteer experience.For example, nearly 6 in 10 Canadians (58%) aged 65 andolder said that they did not volunteer because of ill-health ordisability. One third (33%) of unemployed Canadians cited the costs associated with volunteering as a barrier.
Encouraging youth participation in activities such as teamsports, youth groups, and student government, may pay dividends in the future. Canadians with these early life experiences were more likely to volunteer later in life.
It can be argued that volunteering demands a relatively highlevel of commitment from individuals. It is much easier towrite a cheque to a charity or to sponsor a child in a charityevent than it is to devote hours or even days of one’s time to volunteering. Yet charitable and nonprofit organizationsdepend on volunteer effort. Understanding Canadians’behaviour and attitudes as they relate to volunteering may ultimately help organizations make the adjustments that willallow them to recruit and retain a strong volunteer corps.
14
Volunteer Spirit 07/23 THIS ONE 7/28/04 12:30 PM Page 14

Volunteer Spirit 07/23 THIS ONE 7/28/04 12:30 PM Page 4

Volunteer Spirit 07/23 THIS ONE 7/28/04 12:30 PM Page 1