the vertical structure of tropical convection and its...
TRANSCRIPT

The Vertical Structure of Tropical Convection and Its Impact on the Budgets of WaterVapor and Ozone
IAN FOLKINS AND RANDALL V. MARTIN
Department of Physics and Atmospheric Science, Dalhousie University, Halifax, Nova Scotia, Canada
(Manuscript received 12 February 2004, in final form 8 September 2004)
ABSTRACT
Convective clouds in the Tropics that penetrate the boundary layer inversion preferentially detrain intoa shallow outflow layer (2–5 km) or a deep outflow layer (10–17 km). The properties of these layers arediagnosed from a one-dimensional model of the Tropics constrained by observed mean temperature andwater vapor profiles. The mass flux divergence of the shallow cumuli (2–5 km) is balanced by a mass fluxconvergence of evaporatively forced descent (downdrafts), while the mass flux divergence of deep cumu-lonimbus clouds (10–17 km) is balanced by a mass flux convergence of clear-sky radiative descent. Thepseudoadiabatic temperature stratification of the midtroposphere (5–10 km) suppresses cloud outflow inthis interval. The detrainment profile in the deep outflow layer is shifted downward by about 1.5 km fromthe profile one would anticipate based on undilute pseudoadiabatic ascent of air from the boundary layer.The main source of water vapor to most of the tropical troposphere is evaporative moistening. Below 12 km,evaporatively forced descent plays an important role in the vertical mass flux budget of the Tropics. Thisgives rise to a coupling between the water vapor and mass flux budgets, which, between 5 and 10 km,provides a constraint on the variation of relative humidity with height. Between 12 and 15 km, the observedrelative humidity profile can be reproduced by assuming a simple first-order balance between detrainmentmoistening and subsidence drying. The mean ozone profile of the Tropics can be reproduced using a simpleone-dimensional model constrained by the cloud mass flux divergence profile of the diagnostic model.
1. Introduction
It is becoming increasing clear that convective cloudsthat penetrate the tropical boundary layer inversion fallinto two broad categories (Johnson et al. 1996; Zhangand McGauley 2004). Shallow cumuli (e.g., cumuluscongestus) are most abundant below the melting level(�5 km), but can detrain as high as 8 km (May andRajopadhaya 1999; Trenberth et al. 2004). They areresponsible for about 28% of the convective rainfallover the western Pacific warm pool (Johnson et al.1999). Most of the rainfall in the Tropics comes fromdeep cumulonimbus clouds that detrain between 10 and17 km, and give rise to the deep, vertically overturningportion of the Hadley circulation.
On the local scale, it is likely that several factors playa role in determining whether or not an individual cu-mulus cloud develops into a cumulonimbus cloud.These factors include the existence of low-level windshear (LeMone et al. 1998), the humidity of the lowertroposphere (Tompkins 2001; Redelsberger et al. 2002),
low-level convergence, and, possibly, the presence ofsufficient air in the boundary layer with positive con-vective available potential energy (CAPE). This paperapplies a large-scale thermodynamic perspective to un-derstanding why tropical convective clouds spontane-ously segregate into two discrete distributions. It uses aone-dimensional model of the tropical atmosphere todiagnose the strengths of the shallow and deep circula-tions from the tropical mean budgets of water vaporand dry static energy.
Cloud-mass divergence profiles in the Tropics areusually diagnosed from arrays of vertical profiles ofwind, temperature, and humidity surrounding deepconvective regions (e.g., Betts 1973; Yanai et al. 1973),and/or radar measurements (Mapes 1995). This ap-proach gives the net mass divergence profile arisingfrom the residual of all diabatic processes inside thedomain, including precipitation, cloud radiative heat-ing, evaporative cooling, and turbulent heat transport.Although shallow cumuli can occur in association withdeep convection, it is more accurate to think of shallowcumuli as contributing to a steady background conden-sational heating of the lower troposphere, somewhatanalogous to radiative cooling (Mapes 2000). The dia-batic mass divergence profiles from arrays surroundingdeep convective regions will therefore not include a
Corresponding author address: Dr. Ian Folkins, Dept. of Physicsand Atmospheric Science, Dalhousie University, Halifax, NS B3H3J5, Canada.E-mail: [email protected]
1560 J O U R N A L O F T H E A T M O S P H E R I C S C I E N C E S VOLUME 62
© 2005 American Meteorological Society
JAS3407

representative component of the mass divergence fromshallow cumulus clouds (although the temperatures ofdeep convective regions in the interior of these arrayswill reflect the existence of shallow convection outsidethe arrays because of gravity wave propagation). Todemonstrate the existence of a distinct shallow circula-tion in a more physically transparent way, it is desirableto adopt a tropical mean approach. In principle, thisapproach should enable a better comparison of the ef-fects of shallow cumuli and deep cumulonimbus cloudson the background tropical atmosphere.
The layered aspect of tropical convection has astrong effect on the tropical water vapor budget. Therate at which saturated air detrains from convectiveclouds is weak between 5 and 10 km. Water vapor istherefore transported to this height interval primarilyeither through the subsidence of air that had detrainedfrom cumulonimbus clouds at a higher altitude, or fromthe evaporation of falling ice and water. The specifichumidity of the saturated air that detrains from cumu-lonimbus clouds is extremely low, caused by the ex-tremely cold temperatures of the upper troposphere(�10 km). This air would give rise to relative humiditiesmuch lower than the observed value of about 0.3 ifdirectly transported downward to the 5–10 km interval.The main source of water vapor to the interval musttherefore be evaporation. The effect of evaporation onthe background clear-sky atmosphere depends on thecontext within which it occurs. Evaporation of clouddroplets and ice crystals occurs when clouds entraindry air from their environment. This process decreasesthe buoyancy and detrainment height of clouds, but isotherwise not a direct source of water vapor to thebackground clear-sky atmosphere. The main mecha-nism by which evaporation directly moistens the tropi-cal atmosphere is through evaporation associated withprecipitation. This occurs, for example, in downdraftsbeneath the stratiform anvil. Dry air is drawn towarddeep convective systems beneath the stratiform anvil,and this humidified air is subsequently exported to non-actively convecting regions on a lower potential tem-perature surface. This process will be considered to bea clear-sky process because its net effect is an evapo-ratively forced descent and moistening of cloud-freeair. In the Tropics, the large-scale relative humidity be-tween 5 and 10 km will be mainly determined by howrapidly this precipitation-induced moistening and asso-ciated horizontal exchange occurs (Pierrehumbert1998).
One way to motivate a constraint on the large-scaleevaporative moistening of the midtroposphere (5–10km) by deep convection is to consider the evaporativelydriven mass flux within the context of the other sourcesof vertical motion in the Tropics. These can be consid-ered to be the mean upward mass flux occurring insideclouds, and the radiatively driven downward mass fluxoccurring in the clear-sky atmosphere. Averaged overthe Tropics, these three vertical mass fluxes must ap-
proximately sum to zero. The cloud mass flux is weaklydependent on height in the midtroposphere (5–10 km).The vertical variation of the evaporative mass flux istherefore forced to roughly offset the vertical variationof the radiative mass flux, which is itself strongly con-strained by the moist pseudoadiabatic temperaturestructure of the midtroposphere. These considerationsput restrictions on the shape of the evaporative moist-ening profile in the midtroposphere.
2. One-dimensional diagnostic model
Here we describe the tropical mean model of thetropical atmosphere and its assumptions. The modelpartitions the Tropics into cloudy and clear-sky do-mains. The cloudy portion of the Tropics is assumed tointeract with the clear-sky portion only via a convectivedetrainment rate d of saturated air, and by the produc-tion of condensate, which falls into the clear sky portionof the domain and gives rise to a rate of precipitation-induced evaporative moistening e [kg(H2O) kg�1(dryair) s�1]. The cloudy portion of the domain is not ex-plicitly modeled. The values of d and e are instead in-ferred from their effects on the clear-sky atmosphereusing the following conservation equations for drystatic energy hd and water vapor mixing ratio r in theclear-sky portion of the tropical atmosphere:
��r � �e��hd
�p� cpQr � L�e, �1�
��r � �e��r
�p� e + d�rs � r�. �2�
All variables refer to averages over the clear-sky por-tion of the tropical atmosphere (20°S–20°N). Here, �r
and �e are the mass fluxes associated with radiativecooling and precipitation-induced evaporative cooling,p is pressure, cp is the specific heat, Qr is the radiativecooling rate, L is the heat of vaporization, and rs is thesaturated water vapor mixing ratio corresponding tothe mean tropical temperature. In (1), it is assumed thatthe vertical advection of dry static energy due to radia-tive and evaporative descent is balanced by radiativeand evaporative cooling. In (2), it is assumed that thevertical advection of the water vapor mixing ratio (sub-sidence drying) is balanced by evaporative and detrain-ment moistening.
It can be shown that (1) and (2) follow from morecomprehensive closures of the tropical dry static energyand moisture budgets (e.g., Yanai et al. 1973), afterrestricting attention to the clear-sky portion of thetropical domain and employing several additional ap-proximations. These approximations include the as-sumption that hd and r are independent of time andspace, that the horizontal advection of hd and r in andout of the Tropics (here, 20°S–20°N) can be neglected,and that the air detraining from the cloudy portions of
MAY 2005 F O L K I N S A N D M A R T I N 1561
the domain is saturated with hd (and temperature)equal to the tropical mean. We assume that the tropicalmean vertical gradients of hd and r are the same forboth �r and �e. This is not strictly true, of course, sinceevaporative cooling occurs in close proximity to deepconvection, which can significantly alter both hd/pand r/p and from their mean values.
Radiative heating rates inside clouds can be substan-tially different from those in the clear-sky atmosphere(Ackerman et al. 1998), and these differences can havea dramatic effect on tropical convection (e.g., Randallet al. 1989). Although scattering from clouds can alsoaffect radiative heating rates in clear-sky regions, radia-tive heating rates were calculated (Fu and Liou 1992)without taking this effect into account. Radiative heat-ing that occurs inside clouds is considered to be a dia-batic forcing that contributes to �c.
In deriving (1) and (2), it was assumed that the frac-tional area f occupied by cloud at each height was small.Cirrus, cirrostratus, cumulus, and deep convectiveclouds cover 15.6%, 5.5%, 12.3%, and 2.7% of thetropical area, respectively (Rossow and Schiffer 1999).With the exception of deep convective clouds, the lim-ited vertical extent of most clouds would yield an f,which is probably less than 0.1 at most heights (withthe possible exception of the upper tropical tropo-sphere). The f � 0 assumption would introduce errorsof a similar magnitude. It is also difficult to explicitlyaccount for a nonzero cloudy fractional area in (1) and(2) because the height dependence of f is not well char-acterized.
Perhaps the most important approximation made inderiving (1) and (2) is that no provision has been madefor the entrainment of clear-sky air into the cloudy por-tion of the domain. It is clear that, in the Tropics, ver-tical velocities and buoyancies in convective updraftsare smaller than one would anticipate from undiluteascent (e.g., Jorgensen and LeMone 1989; Lucas et al.1994). The absence of an entrainment parameterizationcould therefore make the results less realistic. The re-sults obtained are, however, not specific to particularassumptions about how convective updrafts mix withtheir environment, assumptions that are still quitespeculative.
In deriving (1), it was assumed that the only sourcesof vertical motion in the clear-sky portion of the do-main were those associated with radiative and evapo-rative cooling (i.e., � � �e � �r). This neglects, forexample, the dynamically induced clear-sky subsidencethat occurs in response to the net upward fluxes inclouds. It is not possible to include adiabatic verticalvelocities in a one-dimensional model in which theheights of dry static energy surfaces are kept fixed. Theeffects of dynamically induced adiabatic warming are,however, included in the model because the model isconstrained by observed temperature profiles. Dynami-cally induced descent warms the tropical troposphere,increases radiative cooling rates, and increases �r.
The rate of precipitation-induced evaporative moist-ening e obtained from (1) and (2) refers only to thatcomponent of the total evaporation that contributes toan increase in the observed tropical mean r. Althoughthe entrainment of dry air into clouds can result inevaporation, the main effect of this process is to lowerthe final detrainment profile of the cloud. Evaporationof precipitation can also occur within very vigorousconvective downdrafts that directly inject midtropo-spheric air into the boundary layer. The evaporationoccurring in this type of downdraft does not play a rolein directly increasing the clear-sky water vapor mixingratio, and therefore does not contribute to e.
The set of Eqs. (1) and (2) contain eight potentiallyindependent variables. However, four of these vari-ables can be constrained by observations (hd, Qr, r, andrs), while �r and Qr, and �e and e are directly coupled.Equations (1) and (2) therefore constitute a solvablesystem of equations in two unknowns (e and d).
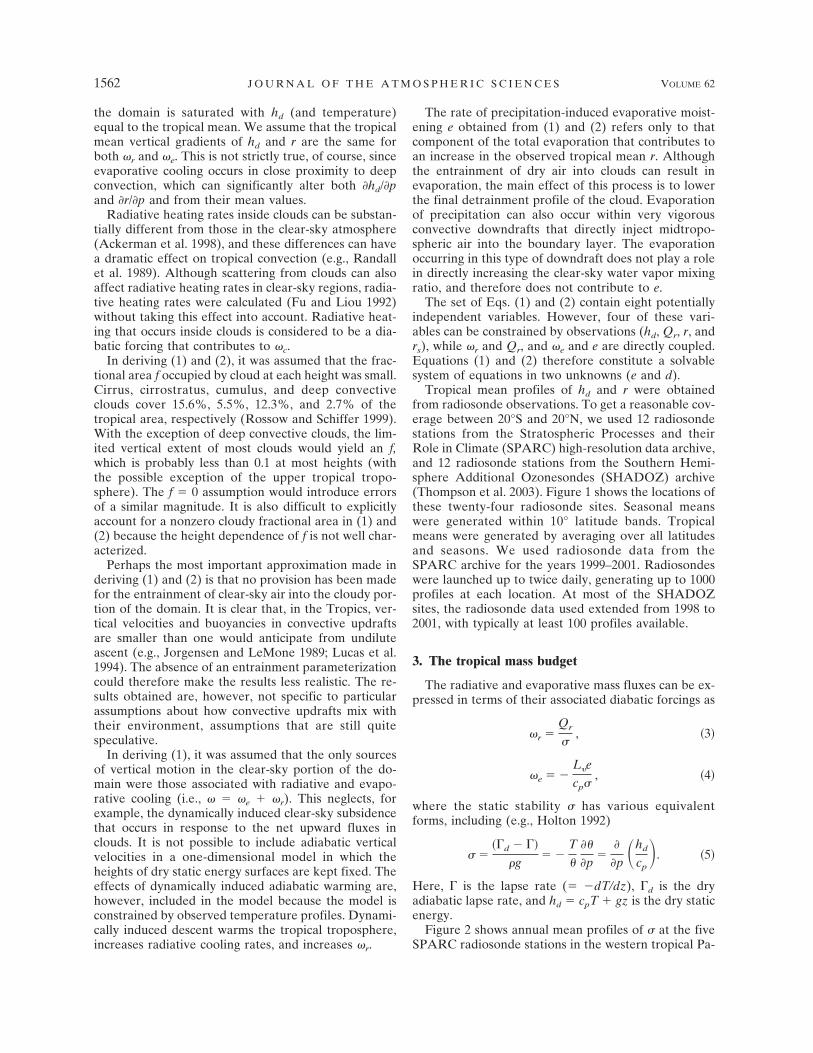
Tropical mean profiles of hd and r were obtainedfrom radiosonde observations. To get a reasonable cov-erage between 20°S and 20°N, we used 12 radiosondestations from the Stratospheric Processes and theirRole in Climate (SPARC) high-resolution data archive,and 12 radiosonde stations from the Southern Hemi-sphere Additional Ozonesondes (SHADOZ) archive(Thompson et al. 2003). Figure 1 shows the locations ofthese twenty-four radiosonde sites. Seasonal meanswere generated within 10° latitude bands. Tropicalmeans were generated by averaging over all latitudesand seasons. We used radiosonde data from theSPARC archive for the years 1999–2001. Radiosondeswere launched up to twice daily, generating up to 1000profiles at each location. At most of the SHADOZsites, the radiosonde data used extended from 1998 to2001, with typically at least 100 profiles available.
3. The tropical mass budget
The radiative and evaporative mass fluxes can be ex-pressed in terms of their associated diabatic forcings as
�r �Qr
�, �3�
�e � �L�e
cp�, �4�
where the static stability � has various equivalentforms, including (e.g., Holton 1992)
� ���d � ��
�g� �
T
�
��
�p�
�
�p �hd
cp�. �5�
Here, � is the lapse rate (� �dT/dz), �d is the dryadiabatic lapse rate, and hd � cpT � gz is the dry staticenergy.
Figure 2 shows annual mean profiles of � at the fiveSPARC radiosonde stations in the western tropical Pa-
1562 J O U R N A L O F T H E A T M O S P H E R I C S C I E N C E S VOLUME 62
cific. The dashed curve is the � of a moist pseudoadi-abat, starting at the surface with a pseudoequivalentpotential temperature ( ep) equal to 350 K. (In pseudo-adiabatic ascent, condensate is removed upon forma-tion. In reversible adiabatic ascent, condensate is re-tained by the air parcel.) The magnitude of the ob-served � has a maximum at the top of the convectiveboundary layer (2 km). It deviates significantly fromthe pseudoadiabatic � between the top of the convec-tive boundary layer and the melting level. We will referto this interval as the shallow outflow layer. The ob-served � is in good agreement with the � of the waterpseudoadiabat between the melting level and 10 km.This interval will be referred to as the pseudoadiabaticlayer. The interval between 10 km and the top of upperlimit of deep convective outflow will be referred to asthe deep outflow layer.
The dotted curve in Fig. 2 shows the ice pseudoadi-abat, in which water vapor condenses to ice rather thanwater above the melting level. Ice nucleation is ex-pected to occur within marine tropical deep convectiveupdrafts soon after updrafts cross the melting level(e.g., Zipser 2003). It is therefore somewhat surprisingthat the observed � matches the water pseudoadiabatmuch more closely than the ice pseudoadiabat.
Figure 3 shows the profiles of Qr and Qe generated bythe one-dimensional model (Qe � �Le/cp). Above 12
km, saturated water vapor pressures are sufficientlysmall that evaporative cooling is unable to competewith radiative cooling. This decouples the water vaporand dry static energy budgets. The rate of precipitation-induced evaporative cooling is larger at higher tem-peratures of the lower troposphere and, in particular, islarger than radiative cooling in most of the shallow out-flow layer (2–5 km).
The tropical mean clear-sky radiative mass flux gen-erated by the model is shown in Fig. 4. The peak in �r
at 11 km is due to the weakness of the static stability inmuch of the upper troposphere (10–13 km; Mapes2001).
In the model, the downward mass fluxes from clear-sky radiative cooling and precipitation-induced evapo-rative cooling are offset by an upward mass flux occur-ring inside clouds. The sum of all three vertical massfluxes should therefore equal zero. (This assumes thatthe net exchange of mass between the Tropics and mid-latitudes can be assumed small, the validity of whichwill be addressed in a later section.) Let f refer to thefractional area of the Tropics occupied by clouds at agiven height, and let �c� refer to the average mass fluxoccurring in the cloudy portion of the domain. One canthen write
�1 � f ��r � �1 � f ��e � f��c � 0. �6�
FIG. 1. Locations of the tropical NOAA/NCDC radiosondes used in this paper. Eachlocation has been identified by a three letter code: BEL (Belize), CAY (Grand Cayman), HIL(Hilo, Hawaii), JUA (San Juan/Isla Verde, USA), KOR (Koror/Palau Island), LIH (Lihue/Kauai, Hawaii), MAJ (Majuro/Marshall Islands), PAG (Pago Pago International Airport,Samoa), PON (Ponape Island), SEA (Seawell, Barbados), TRU (Truk International Airport/Moen Island), and YAP (Yap Island). Shown in stars are the locations of the SHADOZradiosonde/ozonesonde sites: NAI (Nairobi), MAL (Malindi), WAT (Watukosek), IRE(Irene), REU (La Reunion), PAG (American Samoa), FIJ (Fiji), TAH (Tahiti), CRI (SanCristobal), PAR (Paramaribo), NAT (Natal), and ASC (Ascension Island).
MAY 2005 F O L K I N S A N D M A R T I N 1563

It is convenient to define �c � �c� f/(1 � f ), so that �c
represents the cloud mass flux averaged over the clear-sky portion of the Tropics. This gives
�r � �e � �c � 0. �7�
Figure 4 shows the vertical variation of the cloud massflux �c obtained from the solutions for �r and �e. Be-tween 6 and 10 km, the vertical variation of �e offsetsthe vertical variation of �r, so that the cloud-mass flux�c is weakly dependent on height.
The mass flux divergence associated with clear-skyradiative cooling is defined as
r � ���r
�p. �8�
The mass flux divergences �c and �e associated with thecloud heating and precipitation-induced evaporativecooling can be defined in an analogous way. Using (7),one can show that the mass flux divergences associatedwith the tropical mean clear-sky radiative cooling, pre-
cipitation-induced evaporative cooling, and cloud heat-ing, sum to zero,
r � e � c � 0. �9�
The vertical variation of each of these mass divergencesis shown in Fig. 5. Deep cumulonimbus clouds are as-sociated with an enhanced cloud divergence �c in thedeep outflow layer, while shallow cumuli are associatedwith enhanced �c in the shallow outflow layer.
Figure 5 shows that the mass flux divergence fromclouds in the deep outflow layer is balanced mainly bya mass flux convergence from clear-sky radiative cool-ing. Temperatures are sufficiently cold in most of thislayer that �e � 0. This implies �r � �c � 0. The massflux divergence from clouds in the shallow outflowlayer is balanced mainly by the evaporative mass fluxdivergence. Within this layer, the tropical mean staticstability � and clear-sky radiative cooling have a similardependence on height, so that �r is roughly constantand �r � 0. This implies �e � �c � 0. The mass fluxdivergence from clouds is weak within the pseudoadi-abatic layer (5–10 km).
Cloud-mass flux divergence profiles diagnosed frommeasurements are sensitive to the spatial scale of theregion under consideration. Divergence profiles diag-nosed from arrays of radiosonde measurements in ac-
FIG. 2. Annual mean profiles of static stability � at five radio-sonde locations in the western tropical Pacific. The thick dashedline represents the static stability of a 350-K moist pseudoadiabat.The dotted line is the static stability of a 350-K moist pseudoadi-abat in which water vapor is assumed to condense to ice above themelting level. The pseudoadiabatic layer has been defined as theinterval between 5 and 10 km, where the observed static stabilitymost closely approximates a moist pseudoadiabat.
FIG. 3. Here, Qr and Qe refer to the tropical mean (20°S–20°N)clear-sky radiative and evaporative cooling rates predicted by theone-dimensional diagnostic model, and Qex refers to the effectivetropical mean cooling associated with eddy transport of dry staticenergy to the extratropics.
1564 J O U R N A L O F T H E A T M O S P H E R I C S C I E N C E S VOLUME 62

tively convecting regions are typically bimodal, with adeep convective “hot tower” mass divergence peak inthe upper troposphere, reduced mass divergence in themidtroposphere, and enhanced mass divergence in theboundary layer (e.g., Yanai 1973). Divergence profilesobtained using radar measurements in the immediatevicinity of deep convective mesoscale systems tend tobe convergent below 400 mb (Mapes and Houze 1993;Mapes 1995). We presume this is mainly because theevaporative mass flux convergence within these systemsis not being offset by a larger-scale mass flux divergencefrom shallow cumuli. The cloud-mass flux divergenceprofiles of deep convective systems also change shapeas the systems evolve from the vigorously convectingstage toward the stratiform anvil stage. Mean diver-gence profiles from the vigorously convecting stage,during which the relative importance of precipitation-induced evaporative mass fluxes is likely to be reduced,also show near-zero divergence between 5 and 10 km(Fig. 6 of Houze 1997).
Figure 6 gives an overview of the vertical structure ofthe tropical troposphere, motivated by the cloud-massflux divergence profile shown in Fig. 5 and the staticstability profiles shown in Fig. 2.
4. The tropical water vapor budget
The tropical mean relative humidity profile used bythe model is shown in Fig. 7. Below 11 km, the mean
profile was obtained by averaging over the 12 SPARCand 12 SHADOZ humidity profiles. Relative humiditymeasurements from radiosondes are considered to beinaccurate in the upper troposphere, and are not shownabove 12 km. Figure 7 also shows a tropical mean rela-tive humidity profile obtained from the MicrowaveLimb Sounder (MLS; Read et al. 2001). Differencesamong the datasets underline the importance of obtain-ing additional water vapor measurements in the uppertropical troposphere.
Figure 8 shows the relative humidity profile gener-ated by setting e � 0 in Eqs. (1) and (2). In this case,r can be obtained from
�r
�r
�p� dr�rs � r�, �10�
where dr � �r � �r /p. In this profile, detrainmentmoistening (calculated from the radiative mass diver-gence) is balanced by subsidence drying (calculatedfrom the radiative mass flux). The e � 0 relative hu-midity profile is very similar to the aircraft climatologybetween 12 and 15 km, suggesting that the mean watervapor budget in this interval assumes a particularlysimple first-order balance (Dessler and Sherwood 2000;Folkins et al. 2002b).
The height dependence of the subsidence drying,evaporative moistening, and detrainment moisteningterms in the water vapor budget are shown in Fig. 9.Each term has been normalized by r to give it units ofinverse time. For example, the precipitation-induced
FIG. 4. Tropical mean (20°S–20°N) vertical velocities associatedwith diabatic processes in clouds (�c), clear-sky radiative cooling(�r), and clear-sky evaporative cooling (�e).
FIG. 5. Tropical mean (20°S–20°N) vertical profiles of cloud-mass divergence �c, clear-sky radiative mass divergence �r, andevaporative mass divergence �e. Here, �ex refers to the tropicalmean divergence associated with transport between the Tropicsand extratropics. A positive mass divergence refers to a source ofmass to the clear-sky atmosphere while a negative mass diver-gence refers to a sink of mass from the clear-sky atmosphere.
MAY 2005 F O L K I N S A N D M A R T I N 1565
evaporative moistening source (e/r) of 0.5 day�1 at 10km implies that precipitation-induced evaporation sup-plies a source of water vapor every day equal to half theambient tropical mean water vapor at that height.
5. Extratropical exchange of mass, dry staticenergy, and water vapor
In deriving (1), (2), and (9) it was assumed that theexchange of mass, dry static energy, and water vaporbetween the Tropics (here 20°S–20°N) and the extra-tropics could be neglected in comparison to other termsin these equations. In this section, we use assimilatedmeteorological data from the Goddard Earth Observ-ing System (GEOS) of the NASA Data AssimilationOffice to estimate the errors introduced by these as-sumptions. The model has a horizontal resolution of 2°latitude and 2.5° longitude. The dataset has a verticalresolution of approximately 1 km in the troposphere,and was archived every 6 h. An annual average wasobtained by averaging over January, April, July, andOctober of 1997.
Figure 5 shows the mass divergence �ex associatedwith mass exchange between the Tropics and extratrop-ics. There is a small convergent flow of mass from theextratropics into the Tropics between 7 and 10 km.(The sign convention is with respect to the cloud-freetropical atmosphere, so that a positive �ex is a source ofmass.) The direction of this net flow changes sign at thebase of the deep outflow layer (10 km) and is largest at13.5 km. Below the level of zero, clear-sky radiativeheating (�15.2 km), the divergence of mass from theTropics �ex is much smaller than the cloud-mass diver-gence �c, and (9) is a reasonable approximation.
The use of (7) assumes that any upward convectivemass flux between 20°S and 20°N is exactly offset byradiative and evaporatively induced descent. To deter-mine the accuracy of this assumption, the mass diver-gence profile �ex obtained from the GEOS output wasused, together with the assumption � � 0 at the surface,to compute the vertical variation of the tropical meanmass flux due to the exchange of mass with the extra-tropics. It reached a maximum upward mass flux of 3mb day near 10 km. This is much smaller than the tropi-cal mean vertical mass fluxes associated with diabatic
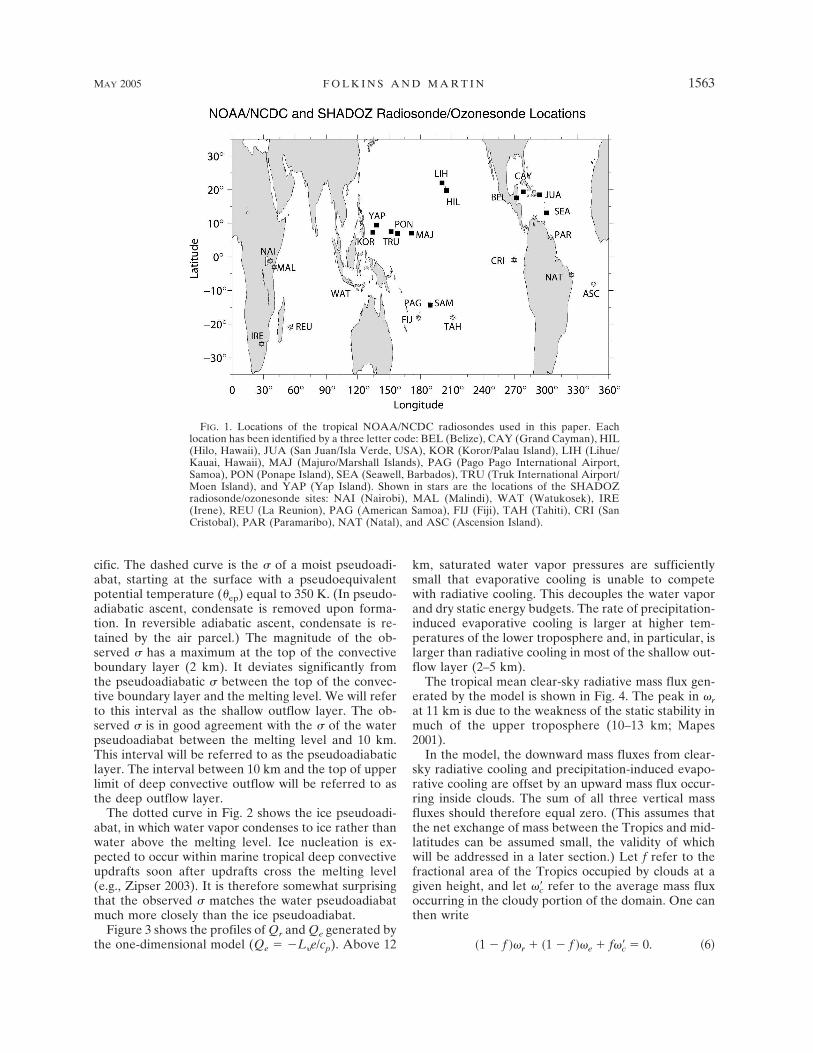
FIG. 7. The dashed curve is the tropical mean relative humidityprofile used in the diagnostic model. This mean profile was con-strained by radiosonde measurements below 11 km, and by anaircraft climatology (Folkins et al. 2002b) between 12.5 and 15 km.The annual mean relative humidity profiles from the SPARC ra-diosonde locations are shown in gray. The aircraft climatology isindicated using solid black boxes. The curve indicated using solidcircles is a 20°S–20°N relative humidity climatology from theMLS.
FIG. 6. A representation of the vertical structure of the tropicaltroposphere. The vertical mass fluxes associated with in-cloudheating, clear-sky evaporative cooling, and clear-sky radiativecooling are labeled �c, �e, and �r, respectively. The level of zeroclear-sky radiative cooling occurs near 15 km. Air parcels thatdetrain above this level have a much higher probability of ascend-ing into the stratosphere than those that do not.
1566 J O U R N A L O F T H E A T M O S P H E R I C S C I E N C E S VOLUME 62

processes, and indicates that (7) is a reasonable as-sumption.
The zonal mean export of dry static energy from theTropics can be written as a sum of contributions fromthe mean flow and transport by eddies,
�hd��� � �hd����� � �h�d������, �11�
where h�d � hd � �hd�, is the meridional velocity, and� is the density. If the diagnostic model were to allow anexport of mass from the Tropics by the mean circula-tion, the associated mean transport of dry static energywould be compensated by the detrainment of dry staticenergy from clouds. (Dry static energy is assumed to behorizontally homogeneous.) In this case, the mostphysically relevant way to estimate the effect of trans-port on the mean tropical dry static energy budget is tocompare the eddy sink of dry static energy from theTropics with radiative and evaporative cooling. An ef-
fective heating rate of the Tropics due to eddy ex-change of dry static energy was calculated by adding�h�d(�)�� from 20°S and 20°N, and normalizing the sumby the mass of the pressure interval. Figure 3 shows theresulting tropical mean effective heating rate Qex. Onaverage, eddy transport of dry static energy cools theTropics between 5 and 15 km, and warms elsewhere.The only height range where it is of comparable impor-tance with radiative cooling is in the immediate vicinityof the level of zero radiative heating (�15 km).
An estimate of the importance of extratropical ex-change on the tropical water vapor budget was ob-tained by calculating �r�� from the GEOS model, add-ing the contributions from both hemispheres, and nor-malizing the total export of water vapor from eachpressure interval by the mass of water vapor in thatinterval. The importance of this exchange relative tothe other terms in the mean tropical water vapor bud-get is shown in Fig. 9. As expected, this exchange givesrise to a net loss of water vapor from the Tropics. Itoccurs at an approximate rate of 0.025 day�1 at all
FIG. 9. Tropical mean (20°S–20°N) vertical profiles in terms inthe water vapor budget from Eq. (2). The subsidence term isdefined as (1/r)(�r � �e)�r/xp, the evaporative term as e/r, and thedetrainment term as d(rs � r)/r, where r refers to the tropicalmean water vapor mass mixing ratio at that height. The inverse ofeach term gives the time scale at which that process removes orproduces water vapor at that altitude. The extratropical exportterm is defined similarly.
FIG. 8. The dashed curve labeled �c � 0 refers to the relativehumidity profile generated by assuming that the cloud divergenceis zero, so that the precipitation-induced mass flux divergence andthe radiative mass flux divergence directly offset one another(�e � �r � 0). The relative humidity profile generated from thisassumption is in good agreement with an average of the observedprofiles between 5 and 10 km. Annual mean relative humidityprofiles of the SPARC radiosonde sites are shown in gray. Thelocations corresponding to each symbol are same as in Fig. 7. Thecurve with solid boxes is an aircraft climatology (Folkins et al.2002b). Between 12 and 15 km, it agrees quite well with the e �0 radiative relative humidity profile, shown in gray. The e � 0profile was obtained from (10), which assumes a first-order bal-ance between subsidence drying and detrainment moistening.
MAY 2005 F O L K I N S A N D M A R T I N 1567

heights (i.e., the time scale for the removal of watervapor from the 20°S–20°N latitude interval is approxi-mately 40 days). Below 15 km, this is substantiallysmaller than the other terms in the water vapor budget.
6. A simple ozone model
The cloud-mass divergence profile shown in Fig. 5 isforced by definition to generate the observed meanrelative humidity profile. It can, however, be indepen-dently tested by determining whether or not it gener-ates realistic mean profiles of other trace species.Ozone is an important constituent of the atmosphere,both from a radiative point of view, and also because itproduces the hydroxy radical OH, the main oxidant ofthe atmosphere. By analogy with (8), one can write thefollowing budget expression for the conservation ofcloud-free ozone mixing ratio O3:
��r � �e��O3
�p� P � d�O3,conv � O3�, �12�
where the term on the left-hand side of the equationrepresents the vertical advection of ozone (arising fromboth radiatively and evaporatively induced massfluxes), P is the net chemical production, and d(O3,conv
� O3) is the convective detrainment tendency (d � �c
under our assumptions). Below 15.5 km, the tropicalmean P was calculated with the Goddard Earth Ob-serving System-Chemistry (GEOS-CHEM) three-dimensional chemical transport model v4.26 (Martin etal. 2003). Above 15.5 km, it was determined from directmeasurements of ozone and its precursors (see Folkinset al. 2002a for details). Here, O3,conv represents themean ozone mixing ratio detraining from tropical con-vective clouds and is the only free parameter in themodel. In the absence of entrainment, it would approxi-mately equal the mean mixing ratio of ozone in theconvective boundary layer.
The dashed lines in Fig. 10 represent the ozone pro-files generated by the model with O3,conv � 20 ppbv andO3,conv � 30 ppbv. Mean ozone mixing ratios below 2km range from 15 to 30 ppbv. We find that O3,conv � 20ppbv is more representative of marine convection,while O3,conv � 30 ppbv is more representative of con-tinental convection. Figure 10 also shows the meanozone profiles at the ten SHADOZ sites within 20 de-grees of the equator. Each of the ten profiles has asimilar “S shape” which is well reproduced by bothmodel simulations. The broad upper tropospheric mini-mum in ozone is associated with a maximum in theconvective detrainment of low-ozone air from theboundary layer.
Ozone profiles at the four sites associated with con-tinuous or seasonally active deep marine convection(Java, Samoa, Fiji, Tahiti) are in good agreement withthe O3,conv � 20 ppbv model profile. Ozone profiles atthe four continental locations (Malindi, Nairobi, Natal,Paramaribo), and at the two island locations likely to be
strongly influenced by continental convection (Ascen-sion and San Cristobal) tend to be close to, or some-what larger than, the O3,conv � 30 ppbv model profile.
7. The undilute ascent model
The level of neutral buoyancy of an air parcel risingfrom the surface in an updraft occurs at the heightwhere the ep of the air parcel becomes equal to thesaturated pseudoequivalent potential temperature *ep
of the background atmosphere. This assumes that theair parcel experiences undilute ascent and that virtualtemperature effects can be ignored. In the upper tro-posphere, water vapor mixing ratios are sufficiently lowthat *ep � . Figure 11 shows �c using as a verticalcoordinate. The deep outflow mode extends from 340to 365 K. This roughly corresponds to the range ofpseudoequivalent potential temperatures observed inthe boundary layer of actively convecting regions. It hastherefore been suggested that, to first order, cumulo-nimbus hot towers directly transport air from theboundary layer into the upper troposphere (Riehl andSimpson 1979). This gives rise to an apparent paradox,however, since the temperatures and vertical velocities
FIG. 10. The profiles shown in gray are mean ozone climatolo-gies at the SHADOZ ozonesonde stations between 20°S and20°N. The dashed lines refer to ozone profiles generated by (12)with different values of O3,conv, which refers to the mean ozonemixing ratio of air parcels detraining from convective clouds.
1568 J O U R N A L O F T H E A T M O S P H E R I C S C I E N C E S VOLUME 62

observed within tropical convective updrafts are almostalways less than predicted by undilute parcel theory(Jorgensen and LeMone 1989; Lucas et al. 1994). In thissection, we attempt to resolve this paradox by showingthat the assumption of undilute ascent generates anupper-tropospheric mass divergence profile (�cu) thatpeaks at a higher altitude than the divergence profileobtained from the diagnostic model (�c). The amount ofentrainment implied by this height offset is roughlyconsistent with that required to reduce undilute updraftvelocities to their observed values.
Figure 12 shows probability distribution functions(PDFs) of ep in the boundary layer in various SSTranges. The PDFs have been generated from threeyears (1999–2001) of temperature, relative humidity,and pressure profiles at the SPARC radiosonde loca-tions shown in Fig. 1. Monthly sea surface temperaturesat the SPARC locations were obtained from the Reyn-olds SST analysis (Reynolds et al. 2002). Air parcelsabove the 800-mb level did not contribute to the PDFsbecause such air parcels rarely have positive CAPE andare therefore unlikely to rise into the upper tropo-sphere by undilute ascent (Folkins 2002). The dashedline in Fig. 12 is a tropical mean ep PDF, calculatedfrom an area-weighted average of the individual PDFsshown in Fig. 12.
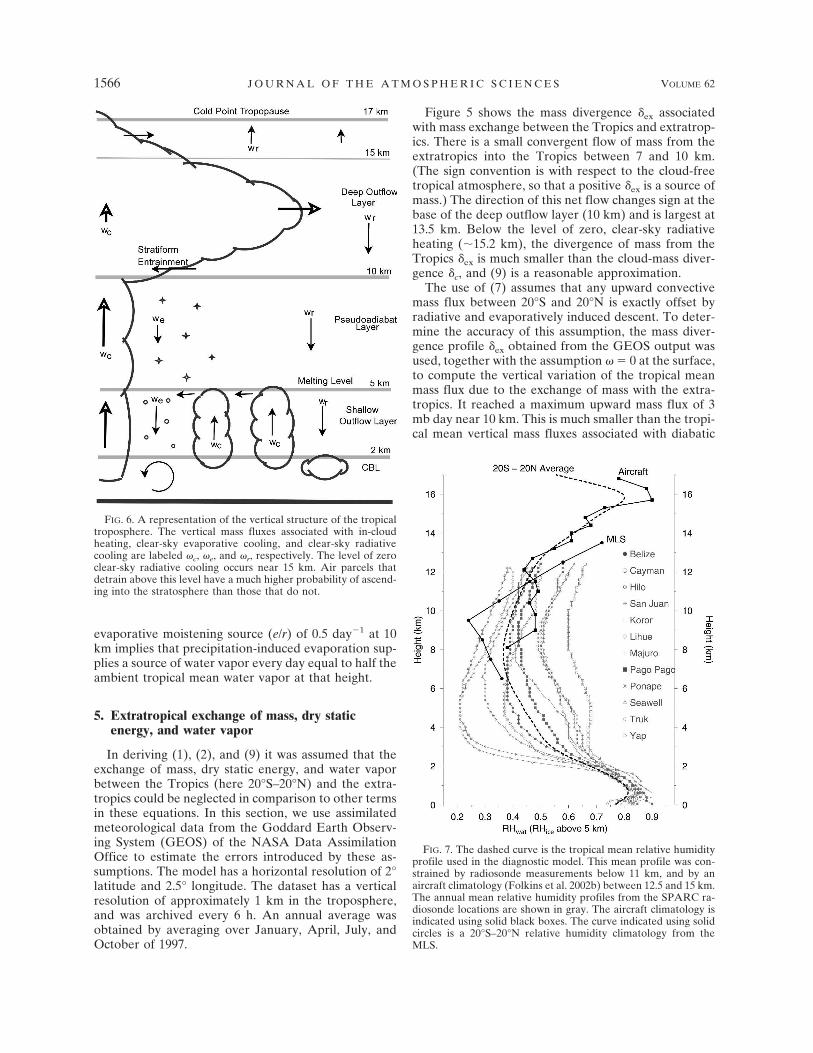
Figure 13 illustrates the procedure by which an ob-
served ep PDF was used to generate an undilute cloud-mass divergence profile. Suppose two air parcels areentrained into a convective updraft from the boundarylayer, one with ep slightly less than 345 K, and one with ep slightly greater than 345 K. In the case of undilutepseudoadiabatic ascent, the ep of the air parcels will beconserved, and they will travel upward along constant ep trajectories as indicated by the vertical lines in Fig.13. The parcels will be neutrally buoyant at the heightsat which their ep is equal to the saturated pseu-doequivalent potential temperature *ep of the back-ground atmosphere. This occurs first at the level of freeconvection and then at the level of neutral buoyancy.The tropical mean 20°S–20°N *ep climatology is indi-cated by the solid line in the upper part of Fig. 13.
If all air parcels in the boundary layer with positiveCAPE have equal probability of participating in deep
FIG. 12. Each curve is a PDF of ep in the boundary layerobtained from radiosonde profiles in a specified SST range. ThePDF is obtained by counting over all measurements between the1010- and 800-mb levels (with all pressure intervals weightedequally). The units are given as mb K�1, so that the integral ofeach PDF over all gives 210 mb. The dashed line is a tropicalmean ep PDF obtained by averaging over the PDFs in each of theSST ranges. The contribution of each PDF to the tropical meanwas weighted by the area occupied by that SST interval (20°S–20°N); qr � 0 refers to the mean potential temperature of thelevel of zero radiative heating. The area of the convective epdistribution to the right of qr � 0 is a measure of the amount ofair in the boundary layer that can detrain above the level of zeroradiative heating by undilute ascent. In this case, air parcels with ep greater than 357 K have the greatest likelihood of ascendinginto the stratosphere. The ep PDFs become insensitive to in-creases in the underlying SST for SSTs larger than 28°C.
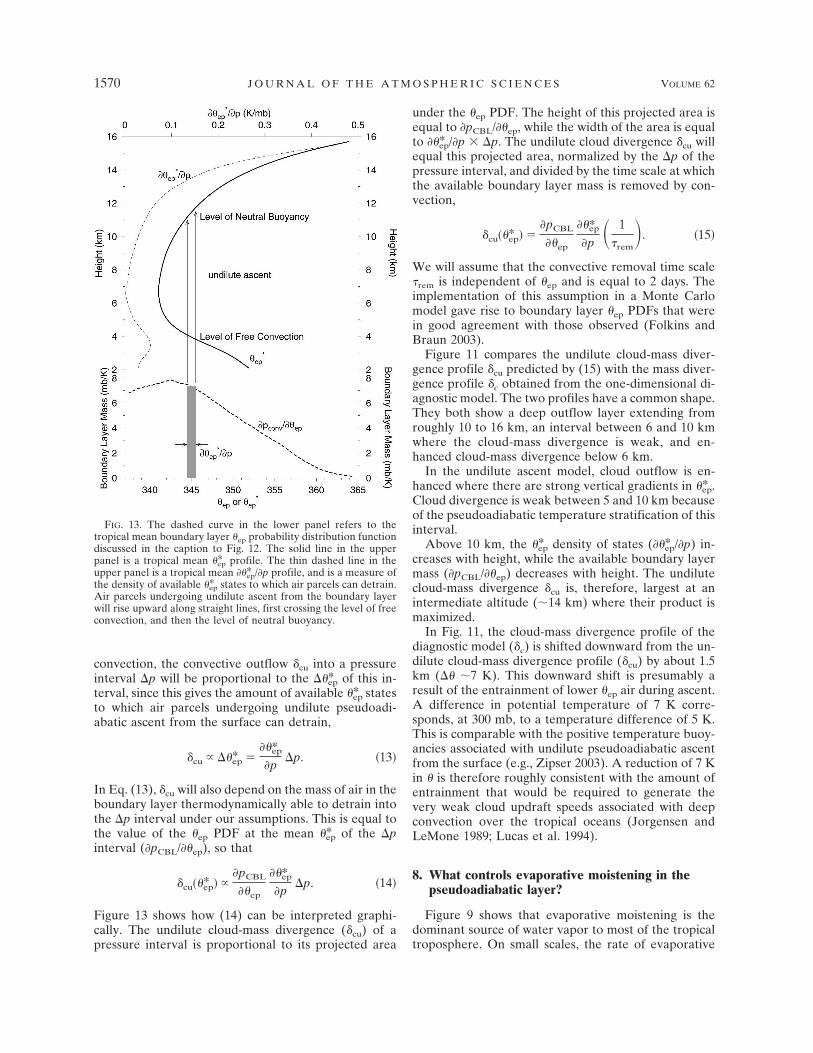
FIG. 11. The solid curve labeled �c refers to the convective massflux divergence determined from the diagnostic model (alsoshown in Fig. 5). The dashed curve labeled �cu refers to the massflux divergence profile determined from (15) using the assump-tion of undilute ascent.
MAY 2005 F O L K I N S A N D M A R T I N 1569
convection, the convective outflow �cu into a pressureinterval �p will be proportional to the � *ep of this in-terval, since this gives the amount of available *ep statesto which air parcels undergoing undilute pseudoadi-abatic ascent from the surface can detrain,
cu ��*ep ���*ep
�p�p. �13�
In Eq. (13), �cu will also depend on the mass of air in theboundary layer thermodynamically able to detrain intothe �p interval under our assumptions. This is equal tothe value of the ep PDF at the mean *ep of the �pinterval (pCBL/ ep), so that
cu��*ep� �pCBL
��ep
��*ep
�p�p. �14�
Figure 13 shows how (14) can be interpreted graphi-cally. The undilute cloud-mass divergence (�cu) of apressure interval is proportional to its projected area
under the ep PDF. The height of this projected area isequal to pCBL/ ep, while the width of the area is equalto *ep/p � �p. The undilute cloud divergence �cu willequal this projected area, normalized by the �p of thepressure interval, and divided by the time scale at whichthe available boundary layer mass is removed by con-vection,
cu��*ep� ��pCBL
��ep
��*ep
�p � 1�rem
�. �15�
We will assume that the convective removal time scale�rem is independent of ep and is equal to 2 days. Theimplementation of this assumption in a Monte Carlomodel gave rise to boundary layer ep PDFs that werein good agreement with those observed (Folkins andBraun 2003).
Figure 11 compares the undilute cloud-mass diver-gence profile �cu predicted by (15) with the mass diver-gence profile �c obtained from the one-dimensional di-agnostic model. The two profiles have a common shape.They both show a deep outflow layer extending fromroughly 10 to 16 km, an interval between 6 and 10 kmwhere the cloud-mass divergence is weak, and en-hanced cloud-mass divergence below 6 km.
In the undilute ascent model, cloud outflow is en-hanced where there are strong vertical gradients in *ep.Cloud divergence is weak between 5 and 10 km becauseof the pseudoadiabatic temperature stratification of thisinterval.
Above 10 km, the *ep density of states ( *ep/p) in-creases with height, while the available boundary layermass (pCBL/ ep) decreases with height. The undilutecloud-mass divergence �cu is, therefore, largest at anintermediate altitude (�14 km) where their product ismaximized.
In Fig. 11, the cloud-mass divergence profile of thediagnostic model (�c) is shifted downward from the un-dilute cloud-mass divergence profile (�cu) by about 1.5km (� �7 K). This downward shift is presumably aresult of the entrainment of lower ep air during ascent.A difference in potential temperature of 7 K corre-sponds, at 300 mb, to a temperature difference of 5 K.This is comparable with the positive temperature buoy-ancies associated with undilute pseudoadiabatic ascentfrom the surface (e.g., Zipser 2003). A reduction of 7 Kin is therefore roughly consistent with the amount ofentrainment that would be required to generate thevery weak cloud updraft speeds associated with deepconvection over the tropical oceans (Jorgensen andLeMone 1989; Lucas et al. 1994).
8. What controls evaporative moistening in thepseudoadiabatic layer?
Figure 9 shows that evaporative moistening is thedominant source of water vapor to most of the tropicaltroposphere. On small scales, the rate of evaporative
FIG. 13. The dashed curve in the lower panel refers to thetropical mean boundary layer ep probability distribution functiondiscussed in the caption to Fig. 12. The solid line in the upperpanel is a tropical mean *ep profile. The thin dashed line in theupper panel is a tropical mean *ep/p profile, and is a measure ofthe density of available *ep states to which air parcels can detrain.Air parcels undergoing undilute ascent from the boundary layerwill rise upward along straight lines, first crossing the level of freeconvection, and then the level of neutral buoyancy.
1570 J O U R N A L O F T H E A T M O S P H E R I C S C I E N C E S VOLUME 62

moistening will be controlled by the surface area offalling precipitation, and the relative humidity of the airin which it is falling. There is, however, a large-scaleconstraint on the magnitude of evaporative moisteningwhich arises from the role that this process plays in thevertical mass flux budget of the clear-sky atmosphere.
The temperature stratification within the pseudo-adiabatic layer favors a weak cloud-mass divergence(�c � 0), so that the cloud-mass flux �c is roughly in-dependent of height (see Fig. 4). As discussed earlier,the sum of the tropical mean vertical mass fluxes asso-ciated with clear-sky radiative cooling, precipitation-induced evaporative cooling, and all diabatic processesinside clouds must approximately sum to zero. The rateof precipitation-induced evaporation within thepseudoadiabatic layer must therefore vary in such away that
�r � �e � ��c � constant. �16�
The rate of precipitation-induced evaporation deter-mines �e through (4). It also has a significant influenceon �r, because of the sensitivity of the tropical meanclear-sky radiative rate Qr to the mean relative humid-ity profile. It is therefore most appropriate to think of(16) as a self-consistency constraint on e within thepseudoadiabatic layer. One method of determining theextent to which this constraint is obeyed in the currentclimate is to compare the relative humidity profile ob-tained from (16) with observed mean profiles. Thiscomparison is shown in Fig. 8. Within the pseudoadi-abatic layer, the relative humidity profile obtained from(16), labeled �c � 0, successfully reproduces the varia-tion of the mean relative humidity with height.
To solve for �e from (16), �c was fixed at its value at8 km obtained from the diagnostic model, and �r wasobtained from the tropical mean profile shown in Fig. 4.Then, e was obtained from �e using (4). The water va-por mixing ratio gradient r/p was then determinedfrom (2) using the assumption that d � 0 (consistentwith the assumption �c � 0). The r profile was obtainedby fixing r at its observed 8-km tropical mean value.The �c � 0 relative humidity profile shown in Fig. 8 wastherefore forced to reproduce the observed tropicalmean relative humidity at 8 km. However, the degree towhich this profile is consistent with the observed meanrelative humidity above and below 8 km gives an indi-cation of the vertical extent over which (16) is a usefulconstraint on humidity levels in the midtroposphere.
9. Conclusions
In the Tropics, deep cumulonimbus clouds coexistwith a population of ubiquitous shallow cumuli. Theoutflow from the cumulonimbus clouds is preferentiallydistributed within a deep outflow layer (�10–17 km),while the outflow from the shallow cumuli is distributedwithin a shallow outflow layer (�2–5 km). Each of thetwo cloud types imposes a mass flux divergence on the
tropical atmosphere, which by conservation of mass,must be balanced by a mass flux convergence in theclear-sky atmosphere. The tropical mean diagnosticmodel used in this paper shows that, while the mass fluxdivergence of cumulonimbus clouds is balanced by aradiative mass convergence in clear-sky regions, themass flux divergence of shallow cumuli is balanced by amass flux convergence associated with evaporativelydriven downdrafts (considered in this paper to be aclear-sky process when it moistens the backgroundclear-sky atmosphere).
While deep and shallow convection can be differen-tiated on the grounds that their mass flux divergencesare balanced by distinct physical processes, they arestrongly coupled. Shallow convection is forced by deepconvection because the downdrafts that initiate shallowconvection in the mesoscale and regional environmentarise mainly from deep convective precipitation. On theother hand, shallow convection favors the developmentof deep (and more nearly undilute) convection by di-minishing the contrast between the pseudoequivalentpotential temperature ep of deep convective updraftsand their environment. Although the relationship be-tween deep and shallow convection is complicated, itseems likely that future increases in the height of themelting level (e.g., Diaz and Graham 1996) due to in-creased tropical sea surface temperatures will increasethe height interval over which evaporative coolingdominates the tropical mean dry static energy budgetand increase the relative importance of shallow convec-tion in the Hadley circulation.
Within the shallow outflow layer, the tropical meanstatic stability is proportional to the tropical meanclear-sky heating rate. As a result, the tropical meanclear-sky radiative mass flux is independent of heightand the radiative mass flux divergence is near zero(�r � 0). The argument that the mass divergence fromshallow cumuli is offset by a mass divergence from pre-cipitation-induced evaporation (�c � �e � 0) is there-fore a direct consequence of the vertical variation of thetropical mean temperature and radiative cooling pro-files in the shallow outflow layer.
The undilute ascent model was used to generate adeep convective divergence profile from the probabilitydistribution function of ep in the boundary layer. Thepeak of this undilute deep convective divergence pro-file is near 14 km, while the peak of the deep convectivedivergence profile diagnosed from observed tempera-ture and relative humidity profiles is near 12.5 km. Thisoffset in height confirms that most deep convective up-drafts do entrain lower ep air during ascent. The mag-nitude of this offset is roughly consistent with theamount of entrainment that would be required to re-duce undilute updraft velocities to their observed val-ues. Undilute ascent is only required for those few airparcels that reach the tropical tropopause.
Although the concept of undilute ascent is of limiteduse for predicting updraft velocities in the Tropics, it is
MAY 2005 F O L K I N S A N D M A R T I N 1571
useful for understanding the overall shape of the tropi-cal mean cloud mass flux divergence profile. In particu-lar, the undilute ascent model demonstrates that theinhibition of convective outflow between 5 and 10 kmcan be attributed to the pseudoadiabatic temperaturestratification of this interval.
The dominant source of water vapor to the midtropi-cal troposphere is evaporative moistening. Below 12km, this moistening gives rise to a downward mass fluxwhich becomes increasingly comparable with the down-ward mass flux from radiative cooling. This coupling ofthe water vapor and mass budgets gives rise to a con-straint on the strength of evaporative moistening.Within the pseudoadiabatic layer (5–10 km), the weak-ness of the cloud-mass divergence implies that thecloud-mass flux �c is roughly independent of height.This, in turn, forces the sum of the mass fluxes fromradiative and evaporative cooling to be approximatelyindependent of height (�r � �e � constant). The ap-plication of this constraint gives rise to a relative hu-midity profile that is in good agreement with observa-tions between 5 and 10 km. More generally, the verticalvariation of evaporative moistening between 5 and 10km should be realistic in any model of the Tropics inwhich (i) the strength of the deep convective compo-nent of the Hadley circulation is realistic (i.e., �c isrealistic), (ii) the cloud mass flux divergence between 5and 10 km is weak, and (iii) the tropical mean clear-skyradiative mass flux has the correct dependence onheight between 5 and 10 km.
Between 12 and 15 km, the observed increase intropical mean relative humidity with height can be re-produced by the assumption of a first-order balancebetween detrainment moistening and subsidence dry-ing. However, there are not enough in situ measure-ments of water vapor in this height interval to generatea geographically representative relative humidity clima-tology. The inference that evaporative moistening doesnot play a significant role in the water vapor budgetbetween 12 and 15 km should therefore be regarded astentative.
Acknowledgments. The NOAA/NCDC high-resolu-tion radiosonde data were provided by the SPARCData Center from their Web site (available at http://www.sparc.sunysb.edu/html/hres.html). Reynolds SSTdata were provided by the NOAA–CIRES Climate Di-agnostics Center, Boulder, Colorado, from their Website (available at http://www.cdc.noaa.gov/). We thankthe Natural Sciences and Engineering Research Coun-cil of Canada, the Modeling of Global Chemistry forClimate (GCC) project, the Canadian Foundation forClimate and Atmospheric Sciences (CFCAS), and theAtmospheric Chemistry Experiment (ACE) for theirsupport. The GEOS-CHEM model is managed by theAtmospheric Modeling Group at Harvard Universitywith support from the NASA Atmospheric ChemistryModeling and Analysis Program. This paper was sub-
stantially modified by the comments of three reviewers.Their input is gratefully acknowledged.
REFERENCES
Ackerman, T. P., K.-N. Liou, F. P. J. Valero, and L. Pfister, 1988:Heating rates in tropical anvils. J. Atmos. Sci., 45, 1606–1623.
Betts, A. K., 1973: A composite mesoscale cumulonimbus budget.J. Atmos. Sci., 30, 597–610.
Dessler, A. E., and S. C. Sherwood, 2000: Simulations of tropicalupper tropospheric humidity. J. Geophys. Res., 105, 20 155–20 163.
Diaz, H. F., and N. Graham, 1996: Recent changes in tropicalfreezing heights and the role of sea surface temperature. Na-ture, 383, 152–155.
Folkins, I., 2002: Origin of lapse rate changes in the upper tropicaltroposphere. J. Atmos. Sci., 59, 992–1005.
——, and C. Braun, 2003: Tropical rainfall and boundary layermoist entropy. J. Climate, 16, 1807–1820.
——, ——, A. M. Thompson, and J. C. Witte, 2002a: Tropicalozone as an indicator of deep convection. J. Geophys. Res.,107, 4184, doi:10.1029/2001JD001178.
——, E. J. Hintsa, K. K. Kelly, and E. M. Weinstock, 2002b: Asimple explanation for the relative humidity increase be-tween 11 and 15 km in the Tropics. J. Geophys. Res., 107,4736, doi:10.1029/2002JD002185.
Fu, Q., and K. N. Liou, 1992: On the correlated k-distributionmethod for radiative transfer in nonhomogeneous atmo-spheres. J. Atmos. Sci., 49, 2139–2156.
Holton, J. R., 1992: An Introduction to Dynamic Meteorology.Academic Press, 511 pp.
Houze, R. A., 1997: Stratiform precipitation in regions of convec-tion: A meteorological paradox? Bull. Amer. Meteor. Soc.,78, 2179–2196.
Johnson, R. H., P. E. Ciesielski, and K. A. Hart, 1996: Tropicalinversions near the 0°C level. J. Atmos. Sci., 53, 1838–1855.
——, and Coauthors, 1999: Trimodal characteristics of tropicalconvection. J. Atmos. Sci., 56, 2397–2418.
Jorgensen, D. P., and M. A. LeMone, 1989: Vertical velocity char-acteristics of oceanic convection. J. Atmos. Sci., 46, 621–640.
LeMone, M. A., E. J. Zipser, and S. B. Trier, 1998: The role ofenvironmental shear and CAPE in determining the structureand evolution of mesoscale convective systems during TOGACOARE. J. Atmos. Sci., 55, 3493–3518.
Lucas, C., E. J. Zipser, and M. A. LeMone, 1994: Vertical velocityin oceanic convection off tropical Australia. J. Atmos. Sci., 51,3183–3193.
Mapes, B. E., 1995: Diabatic divergence profiles in western Pacificmesoscale convective systems. J. Atmos. Sci., 52, 1807–1828.
——, 2000: Convective inhibition, subgrid-scale triggering energy,and stratiform instability in a simple tropical wave model. J.Atmos. Sci., 57, 1515–1535.
——, 2001: Water’s two height scales: The moist adiabat and theradiative troposphere. Quart. J. Roy. Meteor. Soc., 127, 2353–2366.
——, and R. A. Houze, 1993: An integrated view of the 1987Australian monsoon and its mesoscale convective systems. II:Vertical structure. Quart. J. Roy. Meteor. Soc., 119, 733–754.
Martin, R. V., D. J. Jacob, R. M. Yantosca, M. Chin, and P.Ginoux, 2003: Global and regional decreases in troposphericoxidant from photochemical effects of aerosols. J. Geophys.Res., 108, 4097, doi:10.1029/2002JD002622.
May, P. T., and D. K. Rajopadhaya, 1996: Wind profiler observa-tions of vertical motion and precipitation microphysics of atropical squall line. Mon. Wea. Rev., 124, 621–633.
Pierrehumbert, R. T., 1998: Lateral mixing as a source of sub-tropical water vapor. Geophys. Res. Lett., 25, 151–154.
Randall, D. A., Harshvardan, D. A. Dazlich, and T. G. Corsetti,1989: Interactions among radiation, convection, and large-
1572 J O U R N A L O F T H E A T M O S P H E R I C S C I E N C E S VOLUME 62

scale dynamics in a general circulation model. J. Atmos. Sci.,46, 1943–1970.
Read, W. G., J. W. Waters, D. L. Wu, E. M. Stone, and Z. Ship-pony, 2001: UARS Microwave Limb Sounder upper tropo-spheric humidity measurement: Method and validation. J.Geophys. Res., 106, 32 207–32 258.
Redelsberger, J. L., D. B. Parsons, and F. Guichard, 2002: Recov-ery processes and factors limiting cloud-top height followingthe arrival of a dry intrusion observed during TOGACOARE. J. Atmos. Sci., 59, 2438–2457.
Reynolds, R. W., N. A. Rayner, T. M. Smith, D. C. Stokes, and W.Wang, 2002: An improved in situ and satellite SST analysisfor climate. J. Climate, 15, 1609–1625.
Riehl, H., and J. Simpson, 1979: The heat balance of the equato-rial trough zone, revisited. Contrib. Atmos. Phys., 52, 287–305.
Rossow, W. B., and R. A. Schiffer, 1999: Advances in understand-ing clouds from ISCCP. Bull. Amer. Meteor. Soc., 80, 2275–2302.
Thompson, A. M., 2001: Organization of tropical convection in
low vertical wind shears: The role of water vapor. J. Atmos.Sci., 58, 529–545.
——, and Coauthors, 2003: Southern Hemisphere AdditionalOzonesondes (SHADOZ) 1998–2000 tropical ozone clima-tology. 1. Comparison with Total Ozone Mapping Spectrom-eter (TOMS) and ground-based measurements. J. Geophys.Res., 108, 8238, doi:10.1029/2001JD000967.
Trenberth, K. E., D. P. Stepaniuk, and J. M. Caron, 2004: Theglobal monsoon as seen through the divergent atmosphericcirculation. J. Climate, 17, 3969–3993.
Yanai, M., S. Esbensen, and J. Chu, 1973: Determination of bulkproperties of tropical cloud clusters from large-scale heat andmoisture budgets. J. Atmos. Sci., 30, 611–627.
Zhang, C., and M. McGauley, 2004: Shallow meridional circula-tion in the tropical eastern Pacific. J. Atmos. Sci., 61, 133–139.
Zipser, E. J., 2003: Some views on “hot towers” after 50 years oftropical field programs and two years of TRMM data. CloudSystems, Hurricanes, and the Tropical Rainfall MeasuringMission (TRMM), Meteor. Monogr., No. 51, Amer. Meteor.Soc., 49–58.
MAY 2005 F O L K I N S A N D M A R T I N 1573