the value of superstitions - university of...
TRANSCRIPT

The Value of Superstitions
Travis Ng∗, Terence Chong†, and Xin Du ‡
October 2009
Abstract
This paper estimates the value of superstitions by studying the auctions of vehicle
license plates. We show that the value of superstitions is economically significant, which
justifies their persistence in human civilization. We also document the changes of the
value of superstitions across different types of plates, across different policy regimes,
and across different macroeconomic environments. Interestingly, some of the changes
are rather consistent with economic intuition.
Keywords: superstitions, auction
JEL classification: D44, D46
∗Corresponding author. Address: Department of Economics, 9th Floor, Esther Lee Building, ChingChi Campus, The Chinese University of Hong Kong, Shatin, New Territories, Hong Kong. Email: [email protected]. Phone (852) 2609-8184. Fax (852) 2603-5805.†Department of Economics, The Chinese University of Hong Kong, Hong Kong‡The authors would like to thank the editor and the two anonymous referees for their helpful comments.
We would also like to thank Jiahua Che and Tat-Kei Lai for their helpful comments, and thank Victor Kongfor his able research assistance. We appreciate the help of the Transport Department of Hong Kong SARGovernment for providing us the data.
1

1 Introduction
“When you believe in things that you don’t understand,
Then you suffer,
Superstition ain’t the way.”
Stevie Wonder, Superstition (1972)
By how much does one have to pay (or suffer, according to Stevie Wonder) for a super-
stition? Superstitions, rightly or wrongly, can change a variety of human behaviors. They
can also change the allocation of economic resources. It is therefore both interesting and
economically relevant to document the significance of superstitions.
Superstitions, beliefs not based on reason or knowledge, have existed as early as human
history.1 While some old ones have eventually vanished, new ones keep developing, while
many others persist. Friday the 13th, black cats, and evil eye, among others, are factors
that many consider in their everyday decisions. The habitual saying of “God bless you” after
someone sneezes, rather than showing politeness, came from a superstition.2
If people are rational, it is puzzling why superstitions persist. Many researchers in various
disciplines have touched on this issue. Economists, however, have not addressed it much,
except for Fudenberg and Levine (2006).3 The authors look into how superstitions can
persist if people are rational, and which types of superstitions would be more likely to
persist. They construct a game-theoretic model with rational learning, taking superstitions
as beliefs on events off the equilibrium path. They characterize the conditions under which
a false belief can persist. Two important implications follow. First, under the rationality
1According to the Merriam-Webster Online Dictionary, “superstition” is “a term used by critics for abelief that is not based on reason” (http://www.m-w.com/dictionary/superstition). Superstition is notexclusive to human beings. In fact, Skinner (1948) shows that trapped pigeons can develop behaviors as ifthey believe that there were a causal relation between their behavior and the presentation of food, althoughsuch a relation was lacking. The study concludes that animals also tend to develop behavior to support falsebelief, which is an act of superstition.
2Pope Saint Gregory I the Great ordered the people do so, believing that it would help prevent the spreadof the plague around AD 590.
3Along the same line, Foster and Kokko (2008) presented a simple model in which the false causalitiespeople develop survive over natural selection, therefore becoming superstitions.
2

assumption, some superstitions can persist. Second, in equilibrium, persistent superstitions
in turn do affect the behavior of people. The second implication is important, and it forms
the theoretical basis of this paper.
Numerous interesting studies lend support to the second implication. Kramer and Block
(2007) present experiments in which interviewees were requested to make risky decisions.
They found that in facing the same set of risky decisions, interviewees tended to behave
more risk-averse on Friday the 13th than they would on other neutral dates.
Consistent with their finding, casual estimates suggest that U.S. businesses lose between
$800 and $900 million every Friday the 13th. Peltzer and Renner (2003) conduct survey in-
terviews with taxi drivers in South Africa and conclude that those who are more superstitious
tend to drive less carefully, and have incurred more car accidents.
As superstitions do change behaviors, the allocation of resources would depend on su-
perstitions. As such, they must carry economic value. This paper estimates such value for a
particular type of superstitions. In addition, we examine whether superstitions, while inher-
ently irrational, would have their value respond to changes in ways consistent with economic
intuition.
To estimate the value of superstitions, we need to identify an asset that satisfies several
criteria. First, superstitions are potential price-determinants. Second, we can observe prices
over a long period of time. Third, other price-determinants can be controlled for. Fourth,
the price closely proxies the underlying social value. We select the auction data of vehicle
license plates in Hong Kong. Section 2 explains why the data fit these criteria. The data
allow us to link one particular type of superstitions to social value: having a license plate
with a lucky number brings luck, and vice versa.
Our main result shows that superstitions do carry a significant economic value. This
finding lends further support to the fact that many business practices take superstitions
seriously.4 We also show that the value of superstitions changes in response to exogenous
4For instance, Mr. Dilip Rangnekar and Miss Elizabeth Young from the Communications Departmentof Otis Elevator Company, the world’s largest elevator manufacturer, confirmed to us on November 20,
3

changes. In particular, the ways how the value changes, although based inherently on false
beliefs, are consistent with economic intuition. In addition, we find some evidence in support
of the view that people value superstitions differently in different macro-environments.
Our paper is related to two strands of literature. One strand of literature documents
that people “pay” for superstitions. Block and Kramer (2009) find that superstitituous
beliefs cause some consumers to buy things that are inconsistent with economic predictions,
for instance, buying a product set with a lower but “lucky” (versus greater but neutral)
quantity in the package. Wong and Yung (2005) show that many Chinese carefully time
their babies’ birth year; they believe that the “year of the dragon” would bring their babies
good fate. Bourassa and Peng (1999) show that beliefs in numerology affect real estate prices
in regions in New Zealand with large Chinese populations. They find that houses ending
with a “lucky” number are more expensive. Chau, Ma, and Ho (2001) investigate the lucky
number “8” in determining real estate prices. They find that houses with an “8” in their floor
numbers sell for higher prices during property booms. Doucouliagos (2004) shows that the
Australian stock prices reflect significant number preferences attributable to superstitions.
The second strand of literature, which includes Woo and Kwok (1994), Chong and Du
(2008), and Woo et al. (2008), looks into how a car license plate is priced in Hong Kong
using the same series of data but in different periods.5 This paper builds on their work by
using the same series of data in a more extended period of time and similar control variables
in the estimation.
The questions we address differentiate from those in the three papers. Instead of docu-
menting the underlying pricing mechanism of license plates, we take the price of a plate as
an equilibrium outcome that reflects its social value. We are interested in determining how
significant the value of superstitions is. In addition, beyond looking at the value of supersti-
2008 that roughly 80 percent of their elevators around the world do not have the 13th-floor button. Manyaccessories containing an evil eye are sold in Europe. Kramer and Block (2008) give more examples onsuperstition and marketing practices.
5Woo and Kwok (1994) use the data of 1,520 license plates from 1989 to 1991, Chong and Du (2008) usethe data of 15,161 license plates from 1998 to 2003, while Woo et al. (2008) use the data of 34,706 licenseplates from 1990 to 2005.
4

titions from a static point of view, we look at it from a dynamic perspective. In particular,
we ask whether the value would change across the different types of plates, different policy
regimes, and different macroeconomic environments.
Two key features in our empirical analysis enable us to address these new and interesting
questions. First, our data cover two distinct periods: before and after a major policy change
in 2006, which is the introduction of an entirely different type of license plates. It provides
us a unique opportunity to study the change in the value of superstitions in response to
the policy change. We also link the data to the stock market index and examine whether
the value of superstitions varies with the macroeconomic environment. Second, we estimate
plates of different types separately, rather than jointly as in Woo and Kwok (1994), and
Woo et al. (2008). In addition to being a strategy to disentangle the effect of superstitions
from the effect of conspicuous consumption, a point discussed in Section 3.1, our estimation
strategy allows us to ask how the value of superstitions changes across different types of
plates, a question addressed in Section 4.2.1. It is important to note that although we use a
different estimation strategy, our estimated coefficients are consistent with those in Woo and
Kwok (1994), and Woo et al. (2008), suggesting that their qualitative results are robust.
To the best of our knowledge, this paper is the first in economics to study how the value
of superstitions responds to policy changes, and how the changes per se square with economic
intuition. It is also the first one to document that the value of superstitions may vary across
different macroeconomic environments.
2 Data and Variables
This study takes advantage of one of the few datasets that makes it possible to link super-
stitions with social value: the auction data of vehicle license plates in Hong Kong. Over
95% of the Hong Kong population is of Chinese descent, and most understand Cantonese.
As the largest ethnic group in the world, the Chinese would have to be quite superstitious
5

to justify the following observations: the $888 round-trip deal from New York to Beijing by
Continental Airlines in 2005, the Beijing Olympics opening ceremony at 2008/08/08 at 8pm,
the missing 4th, 14th, and 24th floors in many apartments in Hong Kong, and the peak of
cardiac mortality of Chinese Americans and Japanese Americans (for whom “4” is unlucky)
on the 4th of the month, a striking pattern absent in White Americans.6
2.1 Institutional Background
The Hong Kong government started auctioning license plates in 1973.7 The government is
the only institution that sells plates through an open auction. Table 1 summarizes the main
features of the different types of plates available for auctions.8
Only traditional plates were available before September 2006. They consist of either no
letter prefix or two-letter prefix, followed by a number between 1 and 9999 (e.g., AB 1234,
LB 453, and 18).9
The law further groups traditional plates into two mutually-exclusive types: ordinary
and special.10 We now briefly explain their key distinctions, namely, assignment and trans-
ferability.
The government automatically assigns to Mary, for example, an ordinary plate upon
registration of her vehicle (usually by sequence). If Mary does not like the plate, she can
return it to the government and bid a plate she likes in an auction. Mary can go to an auction,
but there is no guarantee that she would find one there that she likes. Alternatively, she
can reserve one unassigned plate (including ordinary and special) in advance and go to the
6Phillips et al. (2001) examine mortality data in the U.S. and find such a striking pattern.7In 1973, the legislation whereby vehicle plates could be sold by auction was introduced. The proceeds
of the auctions go to a charity fund called Lotteries Fund.8Specifically, it is the right to put a specific number on a license plate that is sold, not the plate per se.
The buyer can put the specific number on any plates he likes.9The earliest plates contain numbers only. When the number of vehicles had used up all the plates
containing numbers only, the government added Roman alphabet such as “HK” and “XX” as prefixes. After“HK” and “XX” were exhausted, license plates starting with “AA”, “AB”, “AC”, and so on were used.
10As stated in Schedule 5 of the Road Traffic (Registration and Licensing of Vehicles) regulations (Cap.374 sub.leg. E), a plate is special if it satisfies one or more of the following criteria: (1) no letter prefix, (2)number below 100, (3) number in hundreds or thousands, (4) symmetric mark, (5) sequential mark, (6) twopairs, (7) alternate pairs, (8) mark with identical numbers.
6

particular auction to bid on the plate she has reserved. Of course, there is still no guarantee
that she will win that plate. Mary can also buy a plate from someone else.
The government does not assign special plates, which have generally more appealing
numbers. If Mary wants a special plate from the government, she can only get it through
the auction.
Owners can legally transfer their ordinary plates. If Mary likes Peter’s ordinary plate,
they can trade with each other. In contrast, if Mary likes John’s special plate, even if John
would like to sell it to her, they cannot legally make a deal.
This non-transferability restriction is intended to curb speculation. However, some
“clever” practices can get around this restriction.11 This can have implications on our
estimation strategy as we will argue in Section 3.2.
In March 2004, the Hong Kong government first proposed to introduce personalized
plates. The motivation was the fiscal budget deficit, a result of SARS in 2003 and the eco-
nomic downturn from 2002 to 2004.12 As the sales of traditional plates went to a charity fund
instead, the government proposed selling personalized plates to raise government revenue.13
Subject to certain restrictions, personalized plates allow vehicle owners to personalize their
plate numbers up to eight digits (e.g., 1 LOVE U, WWW, RELAX, etc.). The first auction
of personalized plates was held in September 2006.
2.2 The Auction
The Hong Kong government sells plates by English oral ascending auctions. Ordinary plates
have a reserve price of HKD$1,000 (HKD$7.8 = USD$1). Reserve prices vary for special
plates and are set by the government. The auctioneer can raise the minimum bid increment
11As vehicles may be registered under the name of a company, some have circumvented the restriction byassigning a special plate to a vehicle registered under the name of a company. Selling all the shares of thecompany to another party thus effectively means transferring the special plate. These “clever” practices blurthe non-transferability feature, the supposedly key distinction between ordinary and special plates.
12SARS stands for Severe Acute Respiratory Syndrome, a highly contagious disease that killed 304 peoplein Hong Kong in 2003.
13This motive was clearly documented in many Legislative Council documents, for instance, on a reviewof personalized plates dated January 2008 (document number CB(1)590/07-08(01).
7

during the auction. Auctions are usually held during weekends and Chinese Lunar New Year
holidays. There is no fixed schedule, and therefore the number of auctions in a given month
can vary. On average each auction sells more than a hundred different plates sequentially.
Auction theory suggests that in an English oral ascending auction, if there is no bind-
ing minimum bid increment and binding reserve price, and the valuations of bidders are
independent, then in equilibrium the winner pays an amount equal to the valuation of the
second highest bidder. The winning bid is thus the social opportunity cost. Controlling for
other factors, if superstitions determine the prices, the auction data would allow us to link
superstitions with social value.
Ideally, if plates are all non-transferable, as is supposedly the case for special plates, then
the assumption of independent bidders’ valuations seems plausible. As mentioned, however,
there are ways to transfer special plates that are supposedly non-transferable “cleverly”.
Ordinary plates are not subject to any transferability restriction. There are companies
bidding plates in auctions, aiming at trading them for profit.14 Their valuations of a plate,
therefore, depend on their estimates of its future price. These bidders’ valuations have a
common value component. This leads to the possibility of the winner’s curse: the winning
bidder is the most optimistic one who over-estimates the future price.15 The common value
component makes it non-trivial to map winning bids to social cost. These concerns can
constrain our empirical strategies.
14This issue should be a legitimate concern. Two pieces of evidence support this claim. First, accordingto the Official Record of Proceedings on 18 October, 2006 by the Hong Kong Legislative council, the firstauction of personalized plate numbers sold 210 plates to 159 buyers. Among whom 143 buyers (68% ofplates) only acquired one for their own use, while 16 buyers acquired more than one plates (32% of plates).One buyer acquired 22 plates, believed to be used for trading purposes. Second, one can easily find manycompanies advertising their inventory of plates for sales. Three companies that do so have their own websites:www.luckynumber.com.hk, www.xx118.com.hk, and www.car8.com.
15Garratt and Troger (2006) give a theoretical foundation on auction equilibrium in the presence of spec-ulators in auctions.
8

2.3 Data
We obtained our data from the Hong Kong Transport Department. They contain 292 auc-
tions of traditional plates from January 1997 to January 2009. The data span two very
different periods. Up to August 2006, only traditional plates were available. The introduc-
tion of personalized plates in September 2006 marked a transition in this market. There
were 46,678 traditional plates available for auction; of which 41,069 were sold. Our dataset
does not include the results of the 16 auctions of personalized plates since September 2006.
Table 2 gives the breakdown of the number of observations by year.
We observe the plate number, auction date, whether or not the plate was successfully sold
in the auction, and if so, the winning bids. We do not, however, observe the reserve prices
of the special plates (which are made known at the auction house right before the auction
begins), the number of bids, the bidders’ identities, the bid increments, and the sequence of
the auction.16 In addition, we do not observe whether the plates sold in the auctions are for
personal use or for trade.
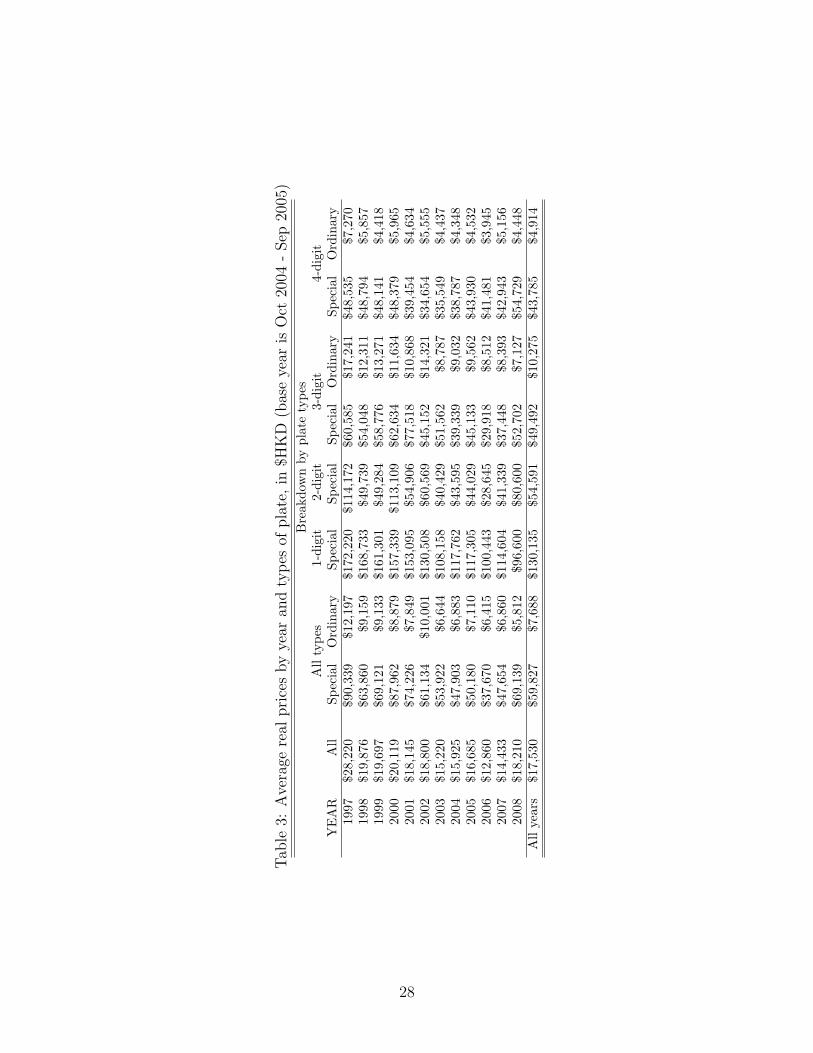
Table 3 presents the real prices of plates by types and by year. We denominate the
nominal prices by the consumer price index (CPI) of the auction month to adjust for inflation.
3 Empirical Analysis
A license plate serves no other purpose, literally, other than to legalize a car to use the
road. The plate number does not change this legal function. Huge variations in the winning
bids of plates, therefore, must have reflected some preferences on the plate numbers per se.
We hypothesize that superstitions play a role in explaining price variation, that is, having
controlled for other factors, superstitions do explain the price variation.
The particular type of superstitions that we would like to focus on is the belief that a
number that rhymes similarly to something good(bad) would bring good(bad) luck to the
16The data on reserve prices of special plates are not publicly available. For other data, the TransportDepartment claimed that they did not keep historical records.
9

owner. It is a false belief because the likelihood of one getting involved in a car accident
depends on her driving habit but not on her plate number. Such superstitions can change
the allocation of economic resources. For instance, those with “unlucky” plates drive their
cars unnecessarily slower is an economic cost. If such superstitions carry significant economic
value, their prices must reflect that.
Different numbers rhyme differently in Cantonese, but there is a universal consensus in
Hong Kong that “8” is good and “4” is bad. The number “8” rhymes similarly to the word
“prosper” or “prosperity”. Thus, the superstition is that the number “8” brings prosperity.
The number “4” rhymes similarly to the word “die” or “death”. Thus, the superstition
is that the number “4” increases the odds of dying. Given that these superstitions have
persisted for a long time, they must carry a significant economic value. Consistent with
this logic, the number “8” would carry a significant premium on a license plate, while the
number “4” would carry a significant discount. As such, we aim at empirically estimating
the premium and the discount.
3.1 Identification strategy
The estimation involves two inherent difficulties. First, license plates are publicly visible;
they are conspicuous goods (also known as Veblen good). People buy an expensive conspic-
uous good to signal high income and achieve greater social status. The plates that most
believe are expensive would serve such a purpose.17 They are sold at a higher price because
everyone expects so, and this is a self-fulfilling equilibrium. This effect, however, has nothing
to do with superstitions.
Second, plates with different numbers are visually differentiated. Some number patterns
are generally regarded as visually more appealing than others. Differences in visual appeal,
therefore, have to be controlled for.
To disentangle the conspicuous effect from the effect of superstitions, we use two strate-
17See Biddle (1991), for instance, for the study of conspicous effects of license plates in the United States.
10

gies. First, we perform estimation on plates with different numbers of digits separately. The
idea is to exploit the fact that most expect plates with fewer digits to command higher
prices. Table 3 reflects this expectation. However, not many can tell the price difference
among plates with the same number of digits. For instance, most expect “LB 36” to be more
expensive than “LB 4566” and “DR 388” to be more expensive than “DR 4598”. Not many
can tell whether “LB 4566” or “LB 3587” is more expensive. Second, in each estimation,
we control for plate numbers that most people would expect to be expensive, in particular,
those with no prefix, prefix of “HK”, and “XX”.18 Most cannot tell the price difference be-
tween “DR 3982” and “AG 1793”, but they expect “HK 3982” and “XX 1793” to be more
expensive than “DR 3982” and “AG 1793”, respectively.
To disentangle differences in visual appeal from the effect of superstitions, we control
for a variety of different combination patterns. Table 4 summarizes the variables we control
for. In particular, we assume that people do not systematically prefer any particular letter
or number in terms of their visual appeal. For example, people would not value “AB”
systematically higher than “JB”, or “KK” higher than “JJ”. However, people may value
“KK” systematically higher than “JB”, as the same-letter prefix is visually more appealing.
In addition, people would not systematically value “132” higher than “379”, but they would
value “1234” higher than “4591” because of the sequential numbers.
3.2 Empirical specification
While the structural estimation of auctions is the usual strategy for empirical auction studies,
in addition to data limitation, the presence of (i) common value component, (ii) potentially
binding reserve price, (iii) potentially binding minimum bid increment, and (iv) sequential
auctions of many plates substantially complicate the use of a structural estimation approach.
The theory has yet to draw a mapping between winning bids and the bidders’ valuations
under all these constraints. We therefore abstract away from the use of structural estimations
18The earliest plates containing numbers only and those with ”HK” and ”XX” as prefixes are substantiallymore expensive than others perhaps because of their long history.
11

and instead, use the hedonic pricing estimation.
The hedonic pricing method studies how the price of a commodity relates to its attributes.
Court (1939) first introduces the methodology, and Lancaster (1966) and Rosen (1974) fur-
ther develop it. Woo and Kwok (1994), Chong and Du (2008), and Woo et al. (2008) employ
hedonic estimations as well. McDonald and Slawson (2002) use hedonic estimations to study
the effect of a seller’s reputation in internet auction. As noted in Bajari and Hortacsu (2004),
however, using hedonic estimations requires somewhat stringent assumptions to interpret the
“implicit prices” as buyer valuations.19 Interpreting the results of hedonic estimations calls
for caution.
The regression model takes the following form, estimated by plate types:
ln(Real price) = α + β(letter prefix characteristics) + γ(number patterns)
+δ(number counts of “0” to “9”)
+λ(year-month dummies) + error. (1)
The notations β, γ, δ, and λ are vectors. The year-month dummies capture the macro-
economic environment that systematically affects the winning bids within the month.20
Although we do not observe the number and identities of the bidders, we believe that
their composition in any particular auction would influence the winning bids in that auction
in certain ways. To take this into account, the model assumes that the error terms within
an auction date are correlated in some unknown way, but that plates auctioned on different
dates do not have correlated errors. We therefore calculate the standard errors clustered by
auction date. In addition, to account for heteroscedasticity, White-corrected standard errors
19On page 474 of the article, the conditions are as follows: (i) no common value component, (ii) noasymmetric information among bidders about the marginal values of the observed product characteristics,(iii) no minimum bids or reserve prices, (iv) all bidders are ex ante symmetric, (v) all product characteristicsare observable, and (vi) entry is exogenous and a dummy variable for the number of bidders is included inthe regression.
20In another specification (which are available upon request), we use year dummies only, but we includethe month-end stock market index (i.e., the Hang Seng index) to proxy for the macro-economic variations.The results are very similar.
12

are calculated.
Our estimation differs from those in Woo and Kwok (1994), and Woo et al. (2008).
In particular, the two papers estimate the plates with different digits jointly. In addition
to disentangling the effects of conspicuous consumption from the effects of superstitions,
estimating separately has three other advantages. First, it avoids ambiguous interpretation
of some estimated coefficients.21 Second, estimating separately allows the discount of a
“4” and the preimum of an “8” to vary across plates with different digit.22 As we will see
in Section 4.2.1, the effect is not constant in general. Third, building on the two papers
and yielding consistent results under different estimation specifications in our paper help
strengthen the results in the two papers.
4 Empirical results
4.1 Superstitions carry a significant economic value
Table 5 shows the main results of the regressions of different types of plates. In particular, we
found that number “8” is associated with plates with significantly higher winning bids, while
number “4” is associated with plates with significantly lower winning bids. Controlling for
other factors, an ordinary 4-digit plate with one extra “8” was sold 63.5% higher on average,
while an ordinary 4-digit plate with one extra “4” was sold 11% lower on average (both
relative to the number “7”). The corresponding estimates for ordinary 3-digit plates are
21Estimating separately avoids the inherent difficulty of interpreting the estimated coefficients of thedummies that is possible in some but not all types of plates. For instance, in a joint estimation of platesof all digits, the interpretation of the estimated coefficient of the dummy for aabb (two pairs in parallel) isambiguous. The dummy is equal to 1 if a 4-digit plate has this aabb pattern (e.g., JK 3344). However, it isequal to 0 if either a 4-digit plate does not have this pattern or it is impossible to have this pattern as theplate not 4-digit. Suppose the estimated coefficient is, say, 40%, then it is difficult to interpret it as a 40%increase in the selling price with this pattern, or the possibility of having this pattern, together with the factthat the plate does have this pattern, commands a 40% premium.
22To be precise, Woo and Kwok (1994), and Woo et al. (2008) alleviate this concern by using the share ofa number in the plate instead of the count of the number in their specification, which instead impose a muchmilder restriction: that the effect of an increase in the share of a number on the price is constant acrossplates with different digits.
13

94.8% and 27.3%, respectively.
These figures mean on average that for an ordinary 4-digit plate, replacing the number
“7” with the number “8” would allow the plate to be sold at roughly USD$400 higher.23 On
the other hand, replacing the number “7” by the number “4” woud allow the plate to be
discounted for USD$69. If we do the same replacements in ordinary 3-digit plate, an “8”
adds USD$1,249 to the price, while a “4” reduces the price tag by USD$360. These numbers
are significant even in real economic terms.
We obtain similar results on special plates of all digits. In short, consistent with our
hypothesis, an “8” does carry a significant premium, while a “4” does carry a significant
discount. Our results on the numbers and the patterns are also consistent with those in Woo
and Kwok (1994), and Woo et al. (2008), suggesting that their qualitative results continue to
be robust under alternative econometric specifications and with data from a more extended
period of time.
4.2 The economics of superstitions
Our results also allow us to address one interesting question: to what extent would the value
of superstitions, based on beliefs that are inherently irrational, be explained by economic
intuition? We present three pieces of evidence in the next three sections that suggest that the
responses of the value of superstitions to changes square with economic intuition well. Section
4.2.4 looks at how the value of superstitions vary with the macroeconomic environment.
4.2.1 Would the premiums and discounts vary across types of plates?
We first look into the change in the premium and the discount of an “8” and a “4”, re-
spectively, across different types of plates. An analogy can explain the relevant economic
intuition. Suppose that rather than leaving next year’s health to randomness, one can buy
a healthy year from God. How much in terms of her share of wealth would she be willing to
23The amount of United States dollars are at 2005 price.
14

pay for? The sooner she expects to die, the larger the share she is willing to give up. A year
of good health weighs more in a shorter life. Analogously, one’s willingness to pay to acquire
an “8” (or to get rid of a “4”) would increase across plates with fewer digits on average. The
increase is due to the bigger share of a number in plates with fewer digits.
The results in Table 5 allow us to examine whether the estimates are consistent with this
logic. The discounts on a “4” are all statistically significant across all types of plates. More
interestingly, the size increases as we move from ordinary 4-digit plates to ordinary 3-digit
plates, with the increase from 11% to 27.3%. Estimates of special plates exhibit a similar
pattern: a larger discount when moving from 4-digit, to 3-digit, to 2-digit, and to 1-digit,
with figures of 15.6%, 20.9%, 34.5%, and 83.2% respectively. We find the exact same pattern
on the premium on an “8”. An unlucky “4” is bad, but it is the worst if it is on a 1-digit
plate than on a 2-digit plate. On the other hand, a lucky “8” is good, but it is the best if it
is on a 1-digit plate. Such a pattern is not generally true for other numbers.24
4.2.2 Would the value repond to policy change?
We also use the introduction of personalized plates as a natural experiment. After the
introduction of personalized plates in 2006, we ask whether the sizes of the premium on an
“8” and the discount on a “4” change, and if so, in which direction.
Although based on irrational beliefs, any particular superstition must have a demand
function. Economic intuition suggests that a demand would change under exogenous change:
the demand for a superstition would shift down as substitutes are introduced. Expressing
oneself by means of a personalized plate rather than having a “lucky” plate did not become
an option until 2006.
Formally, in the regressions, we hypothesize that the coefficients of “8” and “4” differ
before and after 2006. Precisely when the effect of personalized plates started is hard to say.
24Note that our estimated coefficients imply that the effect of an increase in the share of a number onthe price is not constant across plates of different digits. For instance, if the effect were the same, theestimated coefficient of num4 in column 2 would have been −11%(33/25) = 14.52% instead of 27.3% as inour estimation.
15

We believe it is more reasonable to think that it started at the beginning of 2006 when the
bill was finally passed and people started reserving for their personalized plates for auctions
rather than when the first auction for personalized plates was held.
Table 6 shows the results. The sizes of the premium on an “8” and the discount on a
“4” universally reduced after 2006 for all the 4-digit (including ordinary and special) and
3-digit ordinary plates. The results of the Wald tests on these three types of plates indicate
that the estimated coefficients of a “4” and an “8” differ significantly before and after 2006,
suggesting that the introduction of personalized plates may have changed the value people
place on superstitions. For instance, for an ordinary 4-digit plate on average, an “8” carries
a 64.8% premium before 2006 but only 61.4% after 2006. The corresponding figures for an
ordinary 3-digit plate are 98.9% before 2006 and 87% after 2006.
The significance of the differences of the estimated coefficients is marginal for 1-, 2-, and
3-digit special plates. Except for these three types of plates that comprise a little less than
10% of the data, we do see a universal pattern of the changes in the premium and discount
before and after 2006.
4.2.3 Would the response be stronger among a closer pair of substitutes?
Which types of plates should the value of superstitions be most responsive to the introduction
of personalized plates? Consumer theory suggests that the degree of substitutability is larger
in a pair of substitutes that sells at similar price ranges than in a pair that sells at very
different price ranges. For instance, introducing a new Cadillac model should affect the
demand for Mercedez E-class more than that for Honda Civic.
Although we do not have data on the price of personalized plates, we can infer its price
range as the government set their reserve price uniformly at $5,000. This is the minimum that
anyone who bids for any personalized plate would have to pay. The average price therefore
should be at least higher than $5,000 (denominated by CPI, the amount is roughly $4,950 in
16

real price).25 Table 3 shows that the average real price for ordinary 3-digit plates was around
$9,562 before 2006 and that for ordinary 4-digit plates was roughly $4,532. It is therefore
reasonable to expect that the personalized plates should be more appealing to people who
would be more inclined to buy ordinary 3-digit plates rather than ordinary 4-digit plates.
The degree of substitutability between ordinary 3-digit plates and personalized plates should
be higher. We therefore expect that the impact of the introduction of personalized plates on
the value of superstitions is larger on ordinary 3-digit plates than on 4-digit ordinary plates.
Table 6 reports the consistent results. The change we look into is the premium on
replacing a “4” with an “8” in ordinary plates. On average, such a number replacement
adds 134.8% to the price of ordinary 3-digit plates before 2006 but only 97.4% after 2006.
The percentage drop was 27.75%. Corresponding figures are 77.8% for the price of ordinary
4-digit plates before 2006 and 61.4% after 2006. The percentage drop was 22.88%. Ordinary
3-digit plates priced at a price range similar to that of personalized plates respond to the
introduction of personalized plates in a bigger magnitude compared with ordinary 4-digit
plates.
4.2.4 Would the value vary with the macro-environment?
The section addresses the dynamics of the value of superstitions. We ask whether people
value superstitions differently over time and across different macroeconomic environments.
To address this question, we run the following regression on different types of plates.
ln(Real price) = α + β(letter prefix characteristics) + γ(number patterns)
+δ(number counts of “0” to “9”)
+θ((number counts of “0” to “9”)(market condition))
+λ(year-month dummies) + error. (2)
25One price example of a personalized plate is “HAHAHAHA” that was sold for $65,000 on 16 Septmber,2006.
17

The notations β, γ, θ, δ, and λ are vectors. We use the natural log of the Hong Kong Hang
Seng Index at the end of the month the plate was auctioned to proxy for the macroeconomic
environment. The premium for each number “j” now is
∂[ln(Real Price)]/∂[num “j”] = δj + θj ln(Stock market index). (3)
This specification allows the premium or discount of superstitions to vary across different
macroeconomic environments.
If we expect people to be more superstitious in bad times, they would discount a “4”
even more in bad times. As well, they would place a higher premium on an “8” in bad times.
In terms of the estimated coefficients, θ4 should be significantly positive, and θ8 should be
significantly negative.
Columns 1 to 4 of Table 7 show the results for both special and ordinary 4-digit and
3-digit plates, which comprise 90.3% of our total observations. The results suggest that the
size of the discount on a “4” is negatively associated with the market index. People tend
to discount a “4” even more in bad times. For instance, the discount on a “4” in 4-digit
ordinary plates is on average equal to -201.1% + 19.9%ln(stock market index). A 1% drop
in the stock index adds an extra 19.9% in the size of the discount. A “4” is bad, but it is
even worse in bad times.
The results suggest that an “8” is associated with a significant premium. For ordinary
and special 4-digit plates, the premium does not change under different market conditions.
For ordinary and special 3-digit plates, however, the premium tends to be even larger during
bad times. For instance, the premium on a “8” in a 3-digit ordinary plate is on average equal
to +200.8% - 11.1%ln(stock market index). A one percent drop in the stock market index
adds an extra 11.1% in the size of the premium.
It is interesting to note that the premium on an “8” tends to be more stable than the
discount on a “4”. For 4-digit ordinary plates, the premium on an “8” does not vary with the
18

market condition, while the discount on a “4” does. For ordinary and special 3-digit plates,
the discount on a “4” varies with the market condition in a greater proportion compared with
that in the premium on an “8”. This is an interesting empirical pattern that the literature
on superstitions has not documented. We are not able to come up with a good explanation
for the asymmetric effects.
We do not, however, find a similar pattern in 2-digit and 1-digit plates, which comprise
a little less than 10% of our data.
4.3 Robustness
4.3.1 Are number preferences per se driving the results?
One may argue that the significance of our results may well be attributed to the number
preferences per se rather than to superstitions, that is, people in Hong Kong simply system-
atically prefer “8” and dislike “4”. Such preferences have nothing to do with superstitions.
To address this issue, we control for the number preferences by controlling for the numbers
that appear on a plate. We estimate the following equation on 3-digit ordinary plates:
ln(Real price) = α + β(letter prefix characteristics) + δ(ordered combinations)
+λ(year-month dummies) + error. (4)
The bottom panel of Table 4 gives the definition of the variables we use. The idea is
to exploit the fact that even for the same set of numbers, what they rhyme similarly to
depends on how they are ordered. Numbers ordered in such a way that rhymes similarly to
some good(bad) phrases would carry a significant premium(discount), which has nothing to
do with number preferences anymore. We estimate this equation on 3-digit ordinary plates
separately for four sets of number combinations, (1) “1”, “6”, and “8”, (2) “1”, “3”, and
“8”, (3) “1”, “4”, and “8”, and (4) “2”, “3”, and “8”.
The most preferred plate number is “168”, which rhymes similarly to “proper all the
19

way”.26 Controlling for the numbers, if superstitions have value, then “168” would be as-
sociated with higher winning bids. Column 1 of Table 8 shows consistent results. A “168”
plate is significantly more expensive than an “861” plate. On average, it was sold for close
to three times more expensive than that of a “861” plate because “861” is not associated
with any phrase that makes sense in Cantonese.27
The numbers “138”, “813”, “148” and “814” rhyme similarly to “I will be wealthy my
entire life.” Columns 2 and 3 of Table 8 show that they are all associated with plates with
higher winning bids.28
The numbers “238” and “328” rhyme similarly to “this life is prosperous” and “business is
profitable”, respectively. Column 4 of Table 8 shows that these numbers are again associated
with plates with higher winning bids.
The results suggest that number preferences alone cannot explain the price variations. It
is what a plate number rhymes similarly to that determines its price. Thus, plate numbers
that allude to good phrases are associated with higher winning bids.
4.3.2 Do the results hold in the secondary market?
To check whether our results also hold in the secondary market, we collect listed prices for
license plates from a secondary market seller. A caveat is that we only collect listed prices
and not the actual transacted prices.29 We managed to collect up to eight days of listed
prices of car plates spanning from June 2002 to August 2009.30
Altogether we have 16,001 plates with their listed prices across the eight days, 8,195
26The number “16” rhymes similarly to “all the way” (as an adverb); thus, “168” rhymes similarly to“prosper all the way”.
27Both “861” and “681” are not associated with any phrase that makes sense in Cantonese. However,“186”, “618”, and “816” are all variations, in terms of what they mean, of “road to propersity”.
28Again, “283”, “382”, “823”, and “832” do not rhyme similarly to any phrase that makes sense inCantonese.
29We rely on the seller’s website as well as The Internet Archive (web.archive.org) to collect the data. Wehave contacted the seller to obtain more historical data and the transacted prices, but the seller refused toprovide us with their transacted prices.
30The eight days are Jun 2, 2002, Dec 9, 2002, Aug 5, 2003, Oct 16, 2003, Feb 20, 2004, Apr 19, 2004,Aug 5, 2004, and Aug 25, 2009.
20

(51%) of them are 4-digit ordinary plates and 7,806 (49%) are ordinary 3-digit plates.31 We
estimate the same specifications as we have done in the previous sections. Table 9 gives the
estimation results.
Columns 1 and 2 of Table 9 illustrate that the results in Table 5 are robust. First, we
continue to find that “lucky” number “8” carries a significant premium, while “unlucky”
number “4” carries a significant discount. Controlling for other factors, an ordinary 4-digit
plate with one extra “8” was listed at 40.1% higher on average, while an extra “4” was listed
at 17.8% lower. The corresponding estimates for an ordinary 3-digit plate are 74.7% and
18.5%, respectively. Second, consistent with the results in Section 4.2.1, an “8” commands
a higher premium on a 3-digit plate than on a 4-digit plate. Similarly, a “4” is discounted
more in a 3-digit plate than in a 4-digit plate.32
Columns 3 to 6 of Table 9 check whether the results in section 4.2.2 are robust. The
estimates suggest that after the introduction of personalized plate in 2006, the discount of a
“4” in both ordinary 3-digit and 4-digit plates drop. The premium on an “8” in ordinary 3-
digit plates drops too. However, the premium on an “8” in ordinary 4-digit plates is roughly
the same across the two periods. Except for the premium on an “8” in 4-digit plates, the
results are consistent with those in Table 7.
Section 4.2.3 argues that the introduction of personalized plate affects the premiums
and discounts on numbers in ordinary 3-digit plates more than those in ordinary 4-digit
plates, as personalized plates are more of the closer substitutes to ordinary 3-digit plates
than to ordinary 4-digit ones. We continue to observe this in Table 9. The change we look
31Of the 16,290 listed prices we collected, surprisngly, 1.8% (or 289) of them are special plates. We deletedthese plates because, as mentioned, it is by law not legal to transfer special plates. We therefore suspectthat the prices involve not only the values of plates but also the service fees to help “get around” with thenon-transferable rule.
32In another specification, we successfully match 1,299 ordinary 4-digit plates and 1,892 ordinary 3-digitplates with the auction data (i.e., 20% of the data). We run the same specification as in Columns 1 and 2of Table 9, with the auction price as an extra control variable. Table 10 shows the estimation results. Theysuggest that controlling for all the variables, the past auction price of a plate continues to be a significantprice determinant (statistically significant at the 1% level.) A higher auction price, everything else beingequal, leads to a higher listed price in the second-hand market. However, there is still a significant premiumon an “8”. For a “4”, the discount is statistically significant for ordinary 3-digit plates but not for 4-digitplates.
21

into is the premium on replacing a “4” with an “8” on a plate. On average, such number
replacement adds 107.7% to the price of ordinary 3-digit plates before 2006 but only 52.6%
after 2006, which is a percentage drop of 51.16%. The corresponding figures are 59.9% to
the price of ordinary 4-digit plates before 2006 and 43.7% after 2006. The percentage drop
was 27.05%. Ordinary 3-digit plates respond to the introduction of personalized plates in a
bigger magnitude compared with ordinary 4-digit plates.
Columns 7 and 8 re-estimate specification (2). For ordinary 3-digit plates, we continue to
find that the people discount “4” even more in bad times and value “8” more in bad times.
This is consistent with results in Section 4.2.4. We have the right sign of the estimated
coefficients for ordinary 4-digit plates, but they are statistically insignificant.
Overall, we find that the listed prices of secondary market plate sellers exbihit very similar
statistical patterns compared with the auction data, which lends further support to our main
results.
5 Conclusion
This paper estimates the value of a particular type of superstitions: a “lucky”(“unlucky”)
number can bring good(bad) luck. We have shown that the value of superstitions can be
economically significant. We believe that the results are consistent with the fact that super-
stitions persist over time.
Although we may not be the first to document the value of superstitions, we are the first
in the economics literature to address the question of how such value changes over time, and
in response to other policy changes. Interestingly, we find that the value of superstitions
changes in ways that are consistent with economic intuition. The dataset we obtain and the
exogenous policy change provide us a unique opportunity to address this issue.
We have also shown that some results are consistent with the view that people tend
to be more superstitious in bad times. Our results suggest that people tend to discount a
22

bad number even more in bad times. However, people place a higher premium on a good
number in bad times only for a small subset of plates. We conjecture that the value people
attach to superstitions change across different macroeconomic environments, but the changes
are asymmetric in positive and negative superstitions. By positive superstitions, we mean
the false belief that some logically unrelated items or actions bring good luck. Negative
superstitions are the opposite case. We are not aware of any theory that distinguishes
positive superstitions from negative superstitions.
To conclude, while our empirical analysis documents the value of superstitions and how
it changes over time and in response to exogenous changes, it also calls for explicit modeling
of different types of superstitions in order to understand the empirical findings. We hope
that our study would motivate theoretical research on this particular issue.
References
[1] Bajari, Patrick, and Ali Hortacsu. 2004. “Economic Insights from Internet Auc-
tions.” Journal of Economic Literature, 42(2): 457-486.
[2] Block, Lauren, and Thomas Kramer. 2009. “The Effect of Superstitious Beliefs
on Performance Expectations.” Journal of the Academy of Marketing Science, 37(2):
161-169.
[3] Bourassa, Steven C., and Vincent S. Peng. 1999. “Hedonic Prices and House
Numbers: the Influence of Feng Shui.” International Real Estate Review, 2(1): 79-93.
[4] Biddle, Jeff. 1991. “A Bandwagon Effect in Personalized License Plates?” Economic
Inquiry, 29(2): 375-388.
[5] Chau, K.W., Vincent S. M. Ma, and Daniel C. W. Ho. 2000. “The Pricing of
Luckiness in the Apartment Market.” Journal of Real Estate Literature, 9(1): 31-40.
23

[6] Chong, Terence Tai-Leung, and Xin Du. 2008. “Hedonic Pricing Models for Vehicle
Registration Marks.” Pacific Economic Review, 13(2): 259-276.
[7] Court, Andrew T. 1939. “Hedonic Price Indexes with Automotive Examples.” In The
Dynamics of Automotive Demand, New York, NY: General Motors.
[8] Doucouliagos, Hristos C. 2004. “Number Preference in Australian Stocks.” Applied
Financial Economics, 14(1): 43-54.
[9] Foster, Kevin R., and Hannah Kokko. 2008. “The Evolution of Superstitious and
Superstition-like Behaviour.” Proceedings of the Royal Society of London, Series B.
[10] Fudenberg, Drew, and David K Levine. 2006. “Superstition and Rational Learn-
ing.” American Economic Review, 96(3): 630-651.
[11] Garratt, Rod, and Thomas Troger. 2006. “Speculation in Standard Auctions with
Resale.” Econometrica, 74(3): 753-769.
[12] Kramer, Thomas, and Lauren Block. 2008. “Conscious and Nonconscious Compo-
nents of Superstitious Beliefs in Judgment and Decision Making.” Journal of Consumer
Research, 34(6): 783-793.
[13] Lancaster, Kelvin J. 1966. “A New Approach to Consumer Theory.” Journal of
Political Economy, 74(2): 132-157.
[14] McDonald, Cynthia G., and V. Carlos Slawson. 2002. “Reputation in an Internet
Auction.” Economic Inquiry, 40(4): 633-650.
[15] Phillips, David P., George C. Liu, Kennon Kwok, Jason R Jarvinen, Wei
Zhang, and Ian S Abramson. 2001. “The Hound of the Baskervilles Effect: Natu-
ral Experiment on the Influence of Psychological Stress on Timing of Death.” British
Medical Journal, 323(22-29 December): 1443-1446.
24

[16] Peltzer, Karl, and Walter Renner. 2003. “Superstition, Risk-taking and Risk Per-
ception of Accidents Among South African Taxi Drivers.” Accident Analysis and Pre-
vention, 35(4): 619-623.
[17] Skinner, Burrhus F. 1948. “Superstition in the Pigeon.” Journal of Experimental
Psychology, 38(2): 168-172.
[18] Rosen, Sherin. 1974. “Hedonic Prices and Implicit Markets: Product Differentiation
in Pure Competition.” Journal of Political Economy, 82(1): 34-35.
[19] Wong, Ka-Fu, and Linda Yung. 2005. “Do Dragon Have Better Fate?” Economic
Inquiry, 43(3): 689-697.
[20] Woo, Chi-Keung, and Raymond H.F. Kwok. 1994. “Vanity, Superstition and
Auction Price.” Economics Letters, 44(4): 389-395.
[21] Woo, Chi-Keung, Ira Horowitz, Stephen Luk, and Aaron Lai. 2008. “Will-
ingness to Pay and Nuanced Cultural Cues: Evidence from Hong Kong’s License-plate
Auction Market.” Journal of Economic Psychology, 29(1): 35-53.
25

Table 1: Features of license plates by typeTraditional Personalized
Ordinary Special –Features Structure no, or 2-Letter prefix, followed by 8-digit, combinations of
a number between 1-9999 numbers, letters and spaceExamples AA 347 AA 1 1 LOVE U
DR 5689 DR 3883 RELAXExpire? No expiry date Until the holder dies 15 years
or the company dissolvesAllocation Legally transferable? Yes No No
Assigned? Yes No NoAuctioned? Yes Yes Yes
Availability Before Sep 2006 Yes Yes NoAfter Sep 2006 Yes Yes Yes
Auction Reserve price $1,000 Varies $5,000Min. Bid increment Varies Varies Varies
26

Tab
le2:
Sum
mar
yof
dat
aby
year
and
typ
esof
pla
teT
otal
Bre
akdo
wn
ofpl
ate
type
s(s
old
and
unso
ld)
Num
ber
ofN
omin
al1-
digi
t2-
digi
t3-
digi
t4-
digi
tY
ear
Auc
tion
sP
late
sSo
ldU
nsol
dSa
les
(HK
D$)
spec
ial
spec
ial
spec
ial
ordi
nary
spec
ial
ordi
nary
1997
2323
8822
5813
0$7
2,00
0,00
03.
02%
6.20
%4.
98%
37.4
4%7.
24%
37.4
4%19
9827
2605
2358
247
$54,
500,
000
2.42
%7.
37%
5.68
%37
.85%
7.18
%37
.85%
1999
2824
8721
5832
9$4
7,50
0,00
03.
10%
6.88
%5.
75%
39.2
0%6.
84%
39.2
0%20
0031
3518
3152
366
$68,
100,
000
2.42
%4.
55%
4.78
%40
.62%
6.05
%40
.62%
2001
3237
9532
7552
0$6
2,80
0,00
03.
03%
6.64
%6.
56%
38.5
5%5.
96%
38.5
5%20
0227
3100
2679
421
$51,
600,
000
3.03
%8.
26%
6.39
%36
.81%
5.84
%36
.81%
2003
3168
8558
9399
2$8
9,50
0,00
02.
88%
7.61
%6.
51%
36.8
5%6.
30%
36.8
5%20
0417
3517
3026
491
$47,
900,
000
1.93
%12
.68%
6.48
%37
.56%
6.28
%37
.56%
2005
1943
5538
4650
9$6
4,30
0,00
01.
79%
12.0
1%6.
41%
35.9
4%5.
26%
35.9
4%20
0620
4615
4088
527
$53,
800,
000
1.73
%9.
71%
6.59
%38
.70%
5.66
%38
.70%
2007
1537
0533
4536
0$5
0,50
0,00
01.
67%
8.77
%5.
34%
39.3
0%4.
83%
39.3
0%20
0821
5428
4776
652
$94,
500,
000
1.68
%10
.17%
6.74
%36
.57%
6.06
%36
.57%
2009
*1
280
215
65$2
,649
,000
1.79
%13
.57%
8.93
%30
.36%
7.86
%30
.36%
Tot
al29
246
678
4106
956
09$7
59,6
49,0
002.
33%
8.64
%6.
15%
37.7
5%6.
05%
37.7
5%*
2009
isup
toJa
nuar
yon
ly.
27
Tab
le3:
Ave
rage
real
pri
ces
by
year
and
typ
esof
pla
te,
in$H
KD
(bas
eye
aris
Oct
2004
-Sep
2005
)B
reak
dow
nby
plat
ety
pes
All
type
s1-
digi
t2-
digi
t3-
digi
t4-
digi
tY
EA
RA
llSp
ecia
lO
rdin
ary
Spec
ial
Spec
ial
Spec
ial
Ord
inar
ySp
ecia
lO
rdin
ary
1997
$28,
220
$90,
339
$12,
197
$172
,220
$114
,172
$60,
585
$17,
241
$48,
535
$7,2
7019
98$1
9,87
6$6
3,86
0$9
,159
$168
,733
$49,
739
$54,
048
$12,
311
$48,
794
$5,8
5719
99$1
9,69
7$6
9,12
1$9
,133
$161
,301
$49,
284
$58,
776
$13,
271
$48,
141
$4,4
1820
00$2
0,11
9$8
7,96
2$8
,879
$157
,339
$113
,109
$62,
634
$11,
634
$48,
379
$5,9
6520
01$1
8,14
5$7
4,22
6$7
,849
$153
,095
$54,
906
$77,
518
$10,
868
$39,
454
$4,6
3420
02$1
8,80
0$6
1,13
4$1
0,00
1$1
30,5
08$6
0,56
9$4
5,15
2$1
4,32
1$3
4,65
4$5
,555
2003
$15,
220
$53,
922
$6,6
44$1
08,1
58$4
0,42
9$5
1,56
2$8
,787
$35,
549
$4,4
3720
04$1
5,92
5$4
7,90
3$6
,883
$117
,762
$43,
595
$39,
339
$9,0
32$3
8,78
7$4
,348
2005
$16,
685
$50,
180
$7,1
10$1
17,3
05$4
4,02
9$4
5,13
3$9
,562
$43,
930
$4,5
3220
06$1
2,86
0$3
7,67
0$6
,415
$100
,443
$28,
645
$29,
918
$8,5
12$4
1,48
1$3
,945
2007
$14,
433
$47,
654
$6,8
60$1
14,6
04$4
1,33
9$3
7,44
8$8
,393
$42,
943
$5,1
5620
08$1
8,21
0$6
9,13
9$5
,812
$96,
600
$80,
600
$52,
702
$7,1
27$5
4,72
9$4
,448
All
year
s$1
7,53
0$5
9,82
7$7
,688
$130
,135
$54,
591
$49,
492
$10,
275
$43,
785
$4,9
14
28

Table 4: Definitions of independent variables
Variables Descriptions Dummy? ExamplesLetter prefix characteristicssameletter same letter prefix Y AA 345, JJ 7noletter no letter prefix Y 18, 3445hk the letter prefix is ”HK” Y HK 80, HK 71xx the letter prefix is ”XX” Y XX 73, XX 167Number patternsn911 “the” classic Porsche model Y LB 911, DR 911n100x multiple of 100 Y XX 700, JB 300n1000x multiple of 1000 Y JK 2000, ME 4000symmetric symmetric sequence Y MB 373, AK 1441aabb 2 pairs in parallel Y MB 3344, LL 4466abab 2 pairs mixed Y MB 3534, LL 4646aaab 3 of a kind in front Y AJ 1113, LA 7779abbb 3 of a kind at the back Y AJ 1333, LA 7999aaba 3 of a kind on the side I Y AG 1131, LE 7797abaa 3 of a kind on the side II Y AG 1311, LE 7977aab 1 pair in front Y NN 660, EL 773abb 1 pair at the back Y NN 677, EL 144abcd sequential sequence Y AA 1234, HB 567dcba reverse sequential Y AA 4321, HB 765aa 2 of a kind Y BB 22, AL 66aaa 3 of a kind Y BB 222, AL 666aaaa 4 of a kind Y BB 2222, AL 6666n13 “13”, “131”, “113” and “1313” Y HK 13, AL 113Number countsnum1 the count of number “1” Nnum2 the count of number “2” Nnum3 the count of number “3” Nnum4 the count of number “4” Nnum5 the count of number “5” Nnum6 the count of number “6” Nnum7 the count of number “7” Nnum8 the count of number “8” Nnum9 the count of number “9” Nnum0 the count of number “0” NOrdered combinationsnumxyz whether the 3 numbers are Y
ordered in “x”, “y”, “z” pattern
29

Table 5: Regressions of superstitions on winning bids by types of plate. Dependent variable:natural log of Winning bids, 1997-2008.
4 ordinary 3 ordinary 4 special 3 special 2 special 1 special
sameletter 0.635*** 0.749*** 0.795*** 0.869*** 0.884*** 0.955***
[0.0258] [0.0286] [0.0445] [0.0401] [0.0463] [0.0876]
noletter – – 3.475*** 3.803*** 4.569*** no obs
[0.0717] [0.125] [0.449]
hk 2.563*** 2.405*** 1.895*** 2.209*** 2.157*** no obs
[0.108] [0.0736] [0.159] [0.213] [0.153]
xx 1.900*** 1.575*** 1.077*** 1.192*** 1.023*** 0.619*
[0.0709] [0.0671] [0.142] [0.138] [0.153] [0.325]
n911 – 0.894*** – – – –
[0.0520]
n100x – – -0.231*** 0.674*** – –
[0.0817] [0.198]
n1000x – – 0.665** – – –
[0.274]
symmetric – – 1.004*** 0.530*** – –
[0.0804] [0.131]
aabb – – 1.319*** – – –
[0.0737]
abab – – 1.085*** – – –
[0.0780]
aaab 0.749*** – 0.719*** – – –
[0.0225] [0.218]
abbb 0.801*** – 0.485** – – –
[0.0222] [0.233]
aaba 0.289*** – 0.245 – – –
[0.0247] [0.172]
abaa 0.330*** – 0.506*** – – –
[0.0271] [0.158]
aab – 0.530*** – 0.505*** – –
[0.0164] [0.117]
abb – 0.424*** – 0.324** – –
[0.0162] [0.137]
abcd – – 1.014*** 1.120*** – –
[0.140] [0.136]
dcba 0.0859 0.207*** – – – –
[0.145] [0.0494]
aa – – – – 0.731***
[0.0265]
aaa – – – 1.942*** – –
[0.136]
aaaa – – 2.416*** – – –
[0.0862]
n13 – 0.221*** 0.706*** -0.337*** 0.0192 –
[0.0558] [0.240] [0.0956] [0.0678]
num1 0.332*** 0.469*** 0.0580** 0.0935*** 0.317*** 1.481***
[0.0131] [0.0131] [0.0259] [0.0221] [0.0279] [0.0697]
num2 0.321*** 0.427*** 0.128*** 0.101*** 0.244*** 0.293***
[0.0131] [0.0136] [0.0302] [0.0217] [0.0295] [0.0610]
num3 0.325*** 0.554*** 0.206*** 0.189*** 0.300*** 0.453***
[0.0136] [0.0144] [0.0278] [0.0212] [0.0293] [0.0625]
num4 -0.110*** -0.273*** -0.156*** -0.209*** -0.345*** -0.832***
[0.0191] [0.0220] [0.0592] [0.0484] [0.0510] [0.0740]
num5 -0.125*** -0.195*** -0.0312 -0.149*** -0.149*** -0.157**
[0.0195] [0.0181] [0.0386] [0.0251] [0.0337] [0.0633]
num6 0.292*** 0.365*** 0.0685** -0.0163 0.127*** 0.0762
[0.0147] [0.0147] [0.0312] [0.0254] [0.0280] [0.0574]
num8 0.635*** 0.948*** 0.365*** 0.382*** 0.655*** 0.809***
[0.0126] [0.0164] [0.0288] [0.0218] [0.0315] [0.0584]
num9 0.215*** 0.294*** 0.0351 0.0733*** 0.105*** 0.278***
[0.0140] [0.0136] [0.0298] [0.0233] [0.0278] [0.0614]
num0 0.124*** 0.300*** 0.181*** 0.232*** 0.205***
[0.0152] [0.0161] [0.0347] [0.0471] [0.0412]
Constant 6.462*** 7.234*** 7.532*** 8.151*** 9.417*** 11.09***
[0.0429] [0.0321] [0.119] [0.137] [0.0463] [0.0426]
Year-month Y Y Y Y Y Y
fixed effect
Observations 15993 17149 1809 1937 3042 924
R-squared 0.461 0.559 0.843 0.858 0.681 0.78
Note: Robust standard errors in brackets (clustered by auction date).
Key: *** p < 0.01, ** p < 0.05, * p < 0.1, – not applicable, no obs no observation.
30

Tab
le6:
Reg
ress
ions
ofsu
per
stit
ions
onw
innin
gbid
sby
typ
esof
pla
te,
pre
-an
dp
ost-
2006
.D
epen
den
tva
riab
le:
nat
ura
llo
gof
Win
nin
gbid
s,19
97-2
008.
4ord
pre
4ord
post
3ord
pre
3ord
post
4sp
epre
4sp
ep
ost
3sp
epre
3sp
ep
ost
2sp
epre
2sp
ep
ost
1sp
epre
1sp
ep
ost
sam
ele
tter
0.6
32***
0.6
31***
0.8
14***
0.6
29***
0.7
28***
0.9
28***
0.8
02***
1.0
22***
0.7
86***
1.0
54***
0.9
36***
0.9
48***
[0.0
315]
[0.0
459]
[0.0
365]
[0.0
385]
[0.0
527]
[0.0
762]
[0.0
531]
[0.0
565]
[0.0
529]
[0.0
798]
[0.0
929]
[0.2
40]
nole
tter
––
––
3.3
58***
3.8
31***
3.6
07***
4.4
51***
4.1
02***
5.9
30***
no
obs
no
obs
[0.0
724]
[0.1
13]
[0.1
22]
[0.2
05]
[0.4
22]
[0.3
86]
hk
2.4
52***
3.0
55***
2.2
94***
3.0
31***
1.7
08***
2.3
56***
2.0
04***
2.5
64***
1.8
77***
2.6
32***
no
obs
no
obs
[0.1
14]
[0.2
33]
[0.0
718]
[0.1
75]
[0.1
94]
[0.1
65]
[0.2
82]
[0.2
30]
[0.1
52]
[0.2
62]
xx
1.9
22***
1.8
70***
1.4
69***
1.9
00***
0.9
27***
1.4
51***
1.0
90***
1.3
73***
0.7
33***
1.2
83***
0.8
22**
0.4
60**
[0.0
960]
[0.0
826]
[0.0
796]
[0.1
00]
[0.1
96]
[0.1
85]
[0.1
66]
[0.1
26]
[0.1
67]
[0.2
00]
[0.3
68]
[0.2
30]
n911
––
0.8
69***
0.9
61***
––
––
––
––
[0.0
601]
[0.1
05]
n100x
––
––
-0.2
39***
-0.0
736
0.5
50**
1.0
59***
––
––
[0.0
905]
[0.1
29]
[0.2
12]
[0.3
42]
n1000x
––
––
1.0
82***
0.4
11*
––
––
––
[0.2
59]
[0.2
36]
sym
metr
ic–
––
–1.0
64***
0.9
79***
0.5
41***
0.6
89***
––
––
[0.0
845]
[0.1
36]
[0.1
32]
[0.2
15]
aabb
––
––
1.3
89***
1.2
09***
––
––
––
[0.0
823]
[0.1
15]
abab
––
––
1.1
73***
0.9
62***
––
––
––
[0.0
826]
[0.1
31]
aaab
0.7
67***
0.7
12***
––
0.6
69***
0.6
39
––
––
––
[0.0
283]
[0.0
368]
[0.2
39]
[0.4
01]
abbb
0.8
68***
0.7
08***
––
0.1
84
0.5
32**
––
––
––
[0.0
286]
[0.0
291]
[0.2
09]
[0.2
11]
aaba
0.3
21***
0.2
26***
––
0.3
53*
-0.0
567
––
––
––
[0.0
326]
[0.0
368]
[0.1
86]
[0.3
33]
abaa
0.3
86***
0.2
28***
––
0.5
83***
0.8
35***
––
––
––
[0.0
357]
[0.0
359]
[0.1
47]
[0.1
58]
aab
––
0.5
74***
0.4
41***
––
0.4
02***
0.3
29**
––
––
[0.0
201]
[0.0
249]
[0.1
39]
[0.1
43]
abb
––
0.4
31***
0.3
99***
––
0.3
21**
0.2
41
––
––
[0.0
199]
[0.0
293]
[0.1
47]
[0.2
20]
ab
cd
––
––
1.0
18***
0.9
85***
1.0
39***
1.4
39***
––
––
[0.1
54]
[0.2
12]
[0.1
46]
[0.2
21]
dcba
0.0
492
0.0
952
0.2
46***
0.1
27
––
––
––
––
[0.1
58]
[0.2
27]
[0.0
606]
[0.0
809]
aa
––
––
––
––
0.6
65***
0.8
62***
––
[0.0
277]
[0.0
490]
aaa
––
––
––
1.8
64***
2.3
15***
––
––
[0.1
39]
[0.2
22]
aaaa
––
––
2.4
69***
2.3
18***
––
––
––
[0.0
916]
[0.1
33]
n13
––
0.1
42**
0.4
11***
0.7
98***
-0.3
13*
-0.4
57***
-0.1
51
-0.0
577
0.1
09
––
[0.0
671]
[0.0
974]
[0.1
49]
[0.1
71]
[0.1
22]
[0.1
48]
[0.0
888]
[0.0
972]
num
10.3
40***
0.3
14***
0.4
81***
0.4
46***
0.0
748**
-0.0
0889
0.0
886***
0.1
30***
0.2
97***
0.3
49***
1.5
41***
1.3
26***
[0.0
163]
[0.0
185]
[0.0
165]
[0.0
209]
[0.0
316]
[0.0
426]
[0.0
274]
[0.0
346]
[0.0
338]
[0.0
484]
[0.0
770]
[0.1
47]
num
20.3
33***
0.2
97***
0.4
39***
0.4
06***
0.1
56***
0.0
0313
0.1
31***
0.0
399
0.1
97***
0.3
10***
0.3
40***
0.1
85
[0.0
162]
[0.0
185]
[0.0
168]
[0.0
216]
[0.0
353]
[0.0
510]
[0.0
248]
[0.0
423]
[0.0
374]
[0.0
447]
[0.0
673]
[0.1
65]
num
30.3
37***
0.3
10***
0.5
65***
0.5
25***
0.2
36***
0.1
14***
0.2
05***
0.1
33***
0.2
65***
0.3
75***
0.5
90***
-0.0
146
[0.0
167]
[0.0
214]
[0.0
183]
[0.0
209]
[0.0
326]
[0.0
405]
[0.0
262]
[0.0
362]
[0.0
360]
[0.0
485]
[0.0
661]
[0.1
25]
num
4-0
.130***
-0.0
468
-0.3
59***
-0.1
04***
-0.2
21***
-0.0
0554
-0.2
50***
-0.1
24
-0.3
84***
-0.2
52***
-0.7
08***
-1.1
69***
[0.0
221]
[0.0
363]
[0.0
241]
[0.0
350]
[0.0
708]
[0.0
959]
[0.0
573]
[0.0
850]
[0.0
828]
[0.0
539]
[0.0
821]
[0.1
33]
num
5-0
.123***
-0.1
26***
-0.2
21***
-0.1
29***
-0.0
172
-0.0
952*
-0.1
85***
-0.0
961**
-0.1
31***
-0.2
16***
-0.0
994
-0.3
65**
[0.0
234]
[0.0
322]
[0.0
223]
[0.0
266]
[0.0
484]
[0.0
560]
[0.0
301]
[0.0
451]
[0.0
407]
[0.0
621]
[0.0
695]
[0.1
45]
num
60.2
87***
0.3
07***
0.3
81***
0.3
36***
0.0
686*
0.0
35
-0.0
233
-0.0
175
0.0
803**
0.2
04***
0.2
01***
-0.3
51***
[0.0
182]
[0.0
220]
[0.0
178]
[0.0
245]
[0.0
393]
[0.0
495]
[0.0
290]
[0.0
493]
[0.0
327]
[0.0
488]
[0.0
622]
[0.1
21]
num
80.6
48***
0.6
14***
0.9
89***
0.8
70***
0.3
88***
0.2
92***
0.3
94***
0.3
42***
0.5
98***
0.7
37***
0.8
84***
0.5
71***
[0.0
159]
[0.0
174]
[0.0
197]
[0.0
254]
[0.0
330]
[0.0
525]
[0.0
260]
[0.0
390]
[0.0
385]
[0.0
533]
[0.0
663]
[0.1
20]
num
90.2
09***
0.2
35***
0.2
80***
0.3
25***
0.0
285
0.0
407
0.0
696**
0.0
699*
0.0
516
0.1
77***
0.3
17***
0.1
73
[0.0
166]
[0.0
252]
[0.0
167]
[0.0
213]
[0.0
346]
[0.0
556]
[0.0
314]
[0.0
355]
[0.0
354]
[0.0
395]
[0.0
680]
[0.1
39]
num
00.1
08***
0.1
72***
0.3
19***
0.2
66***
0.2
04***
0.0
747
0.2
65***
0.2
14***
0.1
04**
0.3
62***
––
[0.0
183]
[0.0
252]
[0.0
198]
[0.0
254]
[0.0
417]
[0.0
517]
[0.0
611]
[0.0
720]
[0.0
475]
[0.0
623]
Const
ant
6.4
84***
6.3
89***
7.2
62***
7.1
51***
7.5
37***
7.5
49***
8.3
38***
7.6
03***
9.6
70***
8.9
84***
11.0
5***
11.2
0***
[0.0
525]
[0.0
630]
[0.0
400]
[0.0
504]
[0.1
40]
[0.1
75]
[0.1
37]
[0.2
25]
[0.0
576]
[0.0
684]
[0.0
469]
[0.0
850]
Year-
month
YY
YY
YY
YY
YY
YY
fixed
eff
ect
Obse
rvati
ons
11328
4665
12004
5145
1312
497
1304
633
1974
1068
723
201
R-s
quare
d0.4
49
0.5
06
0.5
64
0.5
51
0.8
48
0.8
66
0.8
59
0.8
66
0.6
68
0.6
73
0.7
86
0.7
74
Wald
test∨
F(2
,281)
=6.5
4F
(2,280)
=34.4
0F
(2,284)
=2.8
7F
(2,280)
=1.0
0F
(2,284)
=0.7
8F
(2,266)
=2.2
5P
rob
>F
=0.0
017
Pro
b>
F=
0.0
000
Pro
b>
F=
0.0
585
Pro
b>
F=
0.3
701
Pro
b>
F=
0.4
591
Pro
b>
F=
0.1
069
Note
:R
obust
standard
err
ors
inbra
ckets
(clu
stere
dby
aucti
on
date
).K
ey:
***
p<
0.0
1,
**
p<
0.0
5,
*p
<0.1
,–
not
applicable
,no
obs
no
obse
rvati
on.
∨H
yp
oth
esi
s:w
heth
er
coeffi
cie
nts
of
num
4and
num
8diff
er
signfi
cantl
yb
etw
een
pre
-and
post
-2006
est
imati
ons
31
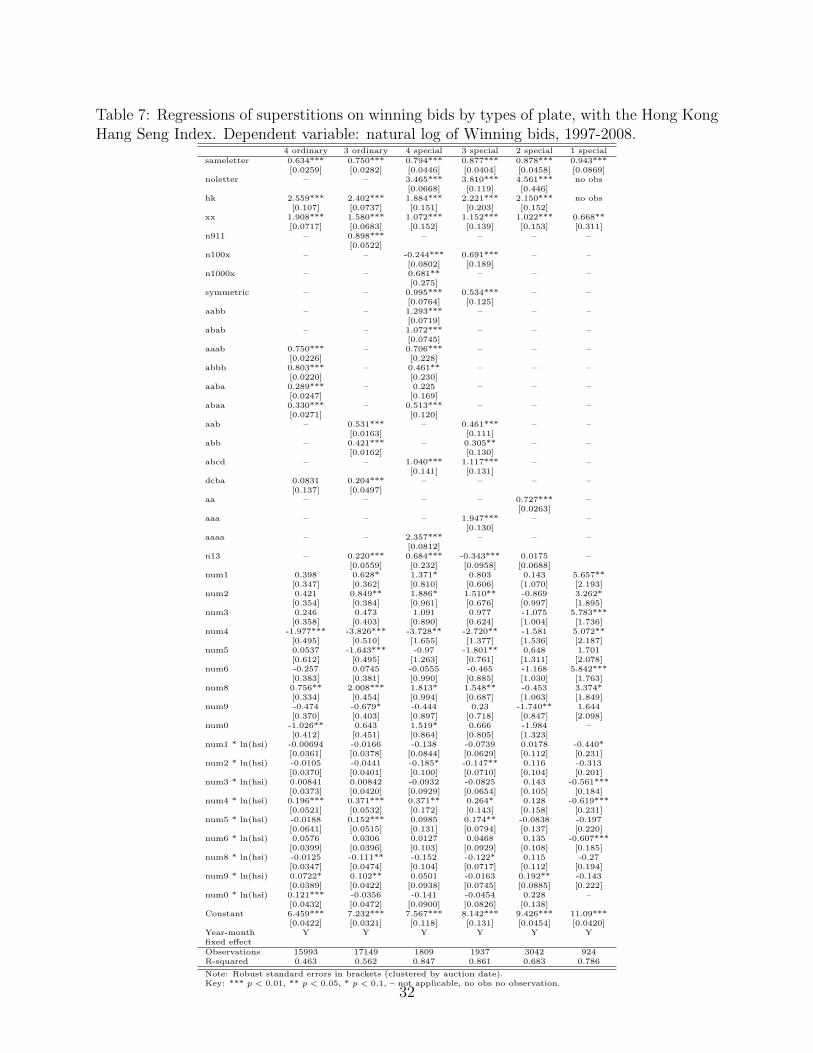
Table 7: Regressions of superstitions on winning bids by types of plate, with the Hong KongHang Seng Index. Dependent variable: natural log of Winning bids, 1997-2008.
4 ordinary 3 ordinary 4 special 3 special 2 special 1 special
sameletter 0.634*** 0.750*** 0.794*** 0.877*** 0.878*** 0.943***[0.0259] [0.0282] [0.0446] [0.0404] [0.0458] [0.0869]
noletter – – 3.465*** 3.810*** 4.561*** no obs[0.0668] [0.119] [0.446]
hk 2.559*** 2.402*** 1.884*** 2.221*** 2.150*** no obs[0.107] [0.0737] [0.151] [0.203] [0.152]
xx 1.908*** 1.580*** 1.072*** 1.152*** 1.022*** 0.668**[0.0717] [0.0683] [0.152] [0.139] [0.153] [0.311]
n911 – 0.898*** – – – –[0.0522]
n100x – – -0.244*** 0.691*** – –[0.0802] [0.189]
n1000x – – 0.681** – – –[0.275]
symmetric – – 0.995*** 0.534*** – –[0.0764] [0.125]
aabb – – 1.293*** – – –[0.0719]
abab – – 1.072*** – – –[0.0745]
aaab 0.750*** – 0.706*** – – –[0.0226] [0.228]
abbb 0.803*** – 0.461** – – –[0.0220] [0.230]
aaba 0.289*** – 0.225 – – –[0.0247] [0.169]
abaa 0.330*** – 0.513*** – – –[0.0271] [0.120]
aab – 0.531*** – 0.461*** – –[0.0163] [0.111]
abb – 0.421*** – 0.305** – –[0.0162] [0.130]
abcd – – 1.040*** 1.117*** – –[0.141] [0.131]
dcba 0.0831 0.204*** – – – –[0.137] [0.0497]
aa – – – – 0.727*** –[0.0263]
aaa – – – 1.947*** – –[0.130]
aaaa – – 2.357*** – – –[0.0812]
n13 – 0.220*** 0.684*** -0.343*** 0.0175 –[0.0559] [0.232] [0.0958] [0.0688]
num1 0.398 0.628* 1.371* 0.803 0.143 5.657**[0.347] [0.362] [0.810] [0.606] [1.070] [2.193]
num2 0.421 0.849** 1.886* 1.510** -0.869 3.262*[0.354] [0.384] [0.961] [0.676] [0.997] [1.895]
num3 0.246 0.473 1.091 0.977 -1.075 5.783***[0.358] [0.403] [0.890] [0.624] [1.004] [1.736]
num4 -1.977*** -3.826*** -3.728** -2.720** -1.581 5.072**[0.495] [0.510] [1.655] [1.377] [1.536] [2.187]
num5 0.0537 -1.643*** -0.97 -1.801** 0.648 1.701[0.612] [0.495] [1.263] [0.761] [1.311] [2.078]
num6 -0.257 0.0745 -0.0555 -0.465 -1.168 5.842***[0.383] [0.381] [0.990] [0.885] [1.030] [1.763]
num8 0.756** 2.008*** 1.813* 1.548** -0.453 3.374*[0.334] [0.454] [0.994] [0.687] [1.063] [1.849]
num9 -0.474 -0.679* -0.444 0.23 -1.740** 1.644[0.370] [0.403] [0.897] [0.718] [0.847] [2.098]
num0 -1.026** 0.643 1.519* 0.666 -1.984 –[0.412] [0.451] [0.864] [0.805] [1.323]
num1 * ln(hsi) -0.00694 -0.0166 -0.138 -0.0739 0.0178 -0.440*[0.0361] [0.0378] [0.0844] [0.0629] [0.112] [0.231]
num2 * ln(hsi) -0.0105 -0.0441 -0.185* -0.147** 0.116 -0.313[0.0370] [0.0401] [0.100] [0.0710] [0.104] [0.201]
num3 * ln(hsi) 0.00841 0.00842 -0.0932 -0.0825 0.143 -0.561***[0.0373] [0.0420] [0.0929] [0.0654] [0.105] [0.184]
num4 * ln(hsi) 0.196*** 0.371*** 0.371** 0.264* 0.128 -0.619***[0.0521] [0.0532] [0.172] [0.143] [0.158] [0.231]
num5 * ln(hsi) -0.0188 0.152*** 0.0985 0.174** -0.0838 -0.197[0.0641] [0.0515] [0.131] [0.0794] [0.137] [0.220]
num6 * ln(hsi) 0.0576 0.0306 0.0127 0.0468 0.135 -0.607***[0.0399] [0.0396] [0.103] [0.0929] [0.108] [0.185]
num8 * ln(hsi) -0.0125 -0.111** -0.152 -0.122* 0.115 -0.27[0.0347] [0.0474] [0.104] [0.0717] [0.112] [0.194]
num9 * ln(hsi) 0.0722* 0.102** 0.0501 -0.0163 0.192** -0.143[0.0389] [0.0422] [0.0938] [0.0745] [0.0885] [0.222]
num0 * ln(hsi) 0.121*** -0.0356 -0.141 -0.0454 0.228 –[0.0432] [0.0472] [0.0900] [0.0826] [0.138]
Constant 6.459*** 7.232*** 7.567*** 8.142*** 9.426*** 11.09***[0.0422] [0.0321] [0.118] [0.131] [0.0454] [0.0420]
Year-month Y Y Y Y Y Yfixed effect
Observations 15993 17149 1809 1937 3042 924R-squared 0.463 0.562 0.847 0.861 0.683 0.786
Note: Robust standard errors in brackets (clustered by auction date).Key: *** p < 0.01, ** p < 0.05, * p < 0.1, – not applicable, no obs no observation.
32

Table 8: Regressions of superstitions on winning bids, with the number combinations heldconstant. Dependent variable: natural log of Winning bids, 1997-2008.
168-Model 138-Model 148-Model 238-Model
sameletter 0.890*** sameletter 0.622*** sameletter 0.592*** sameletter 0.857***
[0.174] [0.106] [0.150] [0.124]
hk 2.330*** hk 2.478*** hk no obs hk 1.940***
[0.528] [0.0558] [0.0664]
xx 0.816*** xx 1.740*** xx no obs xx 0.940***
[0.177] [0.132] [0.164]
num168 2.730*** num138 1.991*** num148 2.702*** num238 0.630***
[0.164] [0.140] [0.292] [0.146]
num186 0.367* num183 0.745*** num184 0.880*** num283 (dropped)
[0.218] [0.186] [0.312]
num618 0.921*** num318 0.924*** num418 1.397*** num328 1.303***
[0.166] [0.131] [0.305] [0.154]
num681 -0.193 num381 (dropped) num481 0.663 num382 0.29
[0.323] [0.647] [0.367]
num816 0.379** num813 0.728*** num814 1.798*** num823 0.075
[0.184] [0.134] [0.271] [0.154]
num861 (dropped) num831 0.106 num841 (dropped) num832 -0.0371
[0.153] [0.165]
Constant 8.296*** Constant 8.384*** Constant 6.662*** Constant 9.117***
[0.144] [0.124] [0.266] [0.136]
Year-month Y Year-month Y Year-month Y Year-month Y
fixed effect fixed effect fixed effect fixed effect
Observations 339 Observations 350 Observations 185 Observations 312
R-squared 0.927 R-squared 0.873 R-squared 0.868 R-squared 0.893
Note: Robust standard errors in brackets (clustered by auction date).
Key: *** p < 0.01, ** p < 0.05, * p < 0.1, – not applicable, no obs no observation.
33

Table 9: The regressions of superstitions in the second-hand market listed prices by types ofplate. Dependent variable: natural log of real listed price.
4 ordinary 3 ordinary 4 ord pre 4 ord post 3 ord pre 3 ord post 4 ordinary 3 ordinary
sameletter 0.437*** 0.789*** 0.376*** 0.756*** 0.706*** 0.971*** 0.438*** 0.778***[0.0609] [0.0720] [0.0274] [0.0450] [0.0370] [0.0385] [0.0616] [0.0662]
noletter - - - - - - - -
hk 2.336*** 2.738*** 2.427*** 2.308*** 2.673*** no obs 2.342*** 2.705***[0.0394] [0.0720] [0.0376] [0.243] [0.0498] [0.0352] [0.0578]
xx 2.601*** 1.982*** 2.857*** 1.848*** 2.308*** 1.572*** 2.602*** 1.958***[0.220] [0.191] [0.135] [0.252] [0.0491] [0.146] [0.233] [0.200]
n911 - 0.482*** - - no obs 0.478*** - 0.537***[0.0482] [0.125] [0.0441]
n100x - - - - - - - -
n1000x - - - - - - - -
symmetric - - - - - - - -
aabb no obs - no obs no obs - - no obs -
abab no obs - no obs no obs - - no obs -
aaab 0.570*** - 0.648*** 0.364*** - - 0.565*** -[0.0816] [0.0710] [0.0628] [0.0835]
abbb 0.704*** - 0.803*** 0.420*** - - 0.701*** -[0.0936] [0.0586] [0.0645] [0.0954]
aaba 0.222* - 0.298** -0.0354 - - 0.221* -[0.100] [0.0943] [0.0694] [0.108]
abaa 0.233* - 0.335*** -0.0707 - - 0.237* -[0.107] [0.0748] [0.0660] [0.107]
aab - 0.530*** - - 0.623*** 0.324*** - 0.537***[0.0768] [0.0363] [0.0445] [0.0744]
abb - 0.431*** - - 0.473*** 0.354*** - 0.442***[0.0414] [0.0441] [0.0487] [0.0430]
abcd - - - - - - - -
dcba -0.0858 0.133** 0.296*** -0.405*** 0.133 0.223 -0.103 0.172**[0.239] [0.0478] [0.0525] [0.130] [0.0777] [0.148] [0.229] [0.0534]
aa - - - - - - - -
aaa - - - - - - - -
aaaa - - - - - - - -
n13 no obs 0.123** no obs no obs 0.148* 0.177 no obs 0.139**[0.0488] [0.0759] [0.160] [0.0467]
num1 0.269*** 0.499*** 0.267*** 0.299*** 0.532*** 0.402*** 0.444 2.738***[0.0135] [0.0326] [0.0154] [0.0441] [0.0198] [0.0396] [0.472] [0.441]
num2 0.204*** 0.490*** 0.204*** 0.250*** 0.529*** 0.393*** 0.668 2.308***[0.0221] [0.0335] [0.0268] [0.0419] [0.0144] [0.0374] [0.797] [0.584]
num3 0.224*** 0.473*** 0.227*** 0.264*** 0.515*** 0.355*** 0.564 2.576***[0.0128] [0.0361] [0.0165] [0.0416] [0.0131] [0.0390] [0.579] [0.596]
num4 -0.178*** -0.185** -0.194*** -0.0344 -0.253*** -0.0108 -1.623 -4.383***[0.0267] [0.0589] [0.0286] [0.0646] [0.0209] [0.0493] [1.216] [0.184]
num5 -0.0774*** -0.137** -0.0871*** -0.0486 -0.181*** 0.0173 0.299 -3.047***[0.0203] [0.0406] [0.0204] [0.0717] [0.0182] [0.0472] [1.014] [0.650]
num6 0.195*** 0.264*** 0.199*** 0.215*** 0.296*** 0.208*** 0.0382 1.830***[0.0102] [0.0256] [0.0128] [0.0425] [0.0123] [0.0374] [0.256] [0.206]
num8 0.401*** 0.747*** 0.405*** 0.437*** 0.824*** 0.526*** 0.791 4.880***[0.0269] [0.0663] [0.0335] [0.0446] [0.0159] [0.0398] [0.779] [0.927]
num9 0.140*** 0.217*** 0.120*** 0.268*** 0.218*** 0.219*** -0.759 0.372[0.0286] [0.0110] [0.0275] [0.0457] [0.0165] [0.0366] [1.242] [0.260]
num0 0.0804*** 0.327*** 0.0872*** 0.130** 0.338*** 0.311*** -0.747 0.827[0.0155] [0.0281] [0.0184] [0.0561] [0.0350] [0.0461] [0.614] [0.699]
num1 * ln(his) - - - - - - -0.0184 -0.236***[0.0498] [0.0454]
num2 * ln(his) - - - - - - -0.0489 -0.191**[0.0840] [0.0609]
num3 * ln(his) - - - - - - -0.0358 -0.222***[0.0611] [0.0627]
num4 * ln(his) - - - - - - 0.153 0.443***[0.128] [0.0191]
num5 * ln(his) - - - - - - -0.04 0.308***[0.108] [0.0683]
num6 * ln(his) - - - - - - 0.0167 -0.165***[0.0264] [0.0210]
num8 * ln(his) - - - - - - -0.0411 -0.435***[0.0813] [0.0979]
num9 * ln(his) - - - - - - 0.0955 -0.0163[0.132] [0.0271]
num0 * ln(his) - - - - - - 0.088 -0.0525[0.0636] [0.0723]
Constant 7.684*** 7.961*** 7.583*** 7.961*** 7.787*** 8.444*** 7.682*** 7.967***[0.0749] [0.0578] [0.0919] [0.158] [0.0305] [0.0820] [0.0757] [0.0208]
Year-month Y Y Y N Y N Y Yfixed effect
Observations 8195 7806 6593 1602 5710 2096 8195 7806R-squared 0.421 0.482 0.38 0.264 0.541 0.269 0.422 0.495
Note: Robust standard errors in brackets (clustered by date).Key: *** p < 0.01, ** p < 0.05, * p < 0.1, – not applicable, no obs no observation.
34

Table 10: The regressions of superstitions in the second-hand market listed prices by typesof plate and with auction price. Dependent variable: natural log of real listed price.
4 ordinary 3 ordinary
Auctioned price 1.90e-05*** 3.22e-05***[2.31e-06] [3.54e-06]
sameletter 0.558*** 0.453***[0.101] [0.0945]
noletter - -
hk 1.325*** -0.966*[0.0403] [0.481]
xx -0.684 -1.047***[0.420] [0.254]
n911 - no obs
n100x - -
n1000x - -
symmetric - -
aabb no obs -
abab no obs -
aaab 0.321*** -[0.0894]
abbb 0.477*** -[0.0389]
aaba -0.0385 -[0.0439]
abaa -0.163*** -[0.0253]
aab - 0.179*[0.0805]
abb - 0.162***[0.00979]
abcd - -
dcba -0.499*** 0.188***[0.0749] [0.0309]
aa - -
aaa - -
aaaa - -
n13 no obs 0.165**[0.0634]
num1 0.274*** 0.218***[0.0369] [0.0228]
num2 0.166*** 0.241***[0.0403] [0.0526]
num3 0.231*** 0.237***[0.0304] [0.0466]
num4 -0.0296 -0.190***[0.0425] [0.0489]
num5 -0.201** -0.118***[0.0683] [0.0299]
num6 0.255** 0.0979**[0.0738] [0.0398]
num8 0.434*** 0.484**[0.0532] [0.160]
num9 0.137** 0.109***[0.0400] [0.0150]
num0 0.0714* 0.0595**[0.0315] [0.0246]
Constant 8.115*** 8.758***[0.109] [0.0863]
Year-month Y Yfixed effect
Observations 1299 1892R-squared 0.597 0.692
Note: Robust S.E. clusteredby date in brackets.
35