the value of goods passing through uk ports value of goods report... · cargo also exceeds that of...
TRANSCRIPT

The value of goods passing through UK ports
by MDS Transmodal
FINAL REPORT
July 2016
Ref: 216013r8c

CONTENTS
EXECUTIVE SUMMARY ................................................................................................................. 2
1. INTRODUCTION .................................................................................................................... 4
2. SOURCES .............................................................................................................................. 5
3. RESULTS ............................................................................................................................... 8
4. SUMMARY ......................................................................................................................... 18
The value of goods passing through UK ports Page 2
Our Ref: 216013r8c
EXECUTIVE SUMMARY
The ports industry is generally measured through its physical throughput of tonnages, containers or
trailers handled. However, while such measurement informs in terms of market share and is vital
evidence in deciding on operation and design, it does not necessarily convey the role that ports play
in the wider economy, which would require a measurement of cargo value.
This report has used available trade, VAT returns and port throughput data to estimate the value of
goods passing through the major UK ports. Because around half of the value of these goods are with
the EU (and therefore do not pass through Customs) this estimate cannot be totally accurate but
does reflect the control totals that are available from the National Statistical Office and the
Department for Transport.
In 2014, UK GDP was measured by the National Office of Statistics at £1.75 trillion, of which 78%
were in services, leaving the GDP for goods produced (including construction) at just £385 billion. It
may be seen as remarkable, therefore, that the total value of goods passing through UK ports at
around £511 billion actually exceeds the total value added in the UK in the form of goods, with
exports of goods at around £227 billion. These figures are not, of course, entirely comparable. The
value of exports will include the value of imported components and raw materials while GDP is a net
figure reflecting value added. Nevertheless, it is evident that the UK port industry plays a highly
strategic role in the overall economy.
In 2014, the 7 leading export ports in the UK accounted for 77% of the value of goods exported
through all the major ports. The leading port is Southampton at £40.1 billion, the value of whose
cargo also exceeds that of non EU cargo through Heathrow if one excludes trade in precious metals
and stones. Dover and Felixstowe are the next ranked followed by Grimsby & Immingham and
Liverpool. Overall, ABP ports accounted for 2014 for 30% of the value of UK exports of goods
through seaports, equating to £68 billion, which can be compared with the total gross value added
by all manufacturing, mining and quarrying activities in Britain in 2014 of £197 billion.
The 7 leading import ports account for an estimated 76% of the value of goods imported through all
the major ports, led by Felixstowe (£44.5 billion), followed by Grimsby & Immingham, Dover, London
and Southampton. Heathrow (non EU*, excluding precious metals and stones) would rank only 6th
by the value of goods handled as a seaport. ABP ports accounted for 29% of the value of imports
through seaports.
*it is not practical to determine the value of intra EU cargo through individual ports (including
Heathrow) because no Customs entries are made although the total value of goods by country and
commodity can be determined through VAT returns. We do believe there is a substantial volume of

The value of goods passing through UK ports Page 3
Our Ref: 216013r8c
intra EU cargo through airports (excluding that interlining with long haul flights from Continental
airports and mail and parcels).
In so far as cargo groups are concerned, the overall unitised sector accounts for total trade through
seaports to the value of £354 billion, of which ABP ports accounted for 23%. By contrast, ABP ports
accounted for 62% of the value of vehicles through the ports, mainly through Southampton and
Grimsby.
Altogether, the value of goods through the ports for which ABP is the statutory harbour authority
and where ABP have active terminals amounted to an estimated £149.4 billion in 2014 or 29% of the
value of all goods through the major seaports.
That is:
UK seaports handled an estimated £511 billion worth of goods in 2014, of which £277 billion
were exports. These figures can be compared with a total GDP (including all services) of
£1.75 trillion.
The 7 leading import and export ports handled 76% and 77% respectively of the value of all
cargo through UK ports. Cargo is heavily concentrated on a handful of ports.
Of that total value of exports of £277 billion through seaports, 30% passed through ABP
ports. The leading export port was Southampton at £40 billion worth of goods. If the value
of precious metals is excluded, this also exceeded the value of all exports to non EU
countries through Heathrow.
Of the total value of imports (£334 billion), 29% passed through ABP ports. Felixstowe led
with Grimsby & Immingham 2nd and Southampton 5th.
ABP accounted for 62% of the value of new vehicles passing through UK ports.
Overall ABP ports handled 29% by value of all goods through UK seaports.
The value of goods passing through UK ports Page 4
Our Ref: 216013r8c
1. INTRODUCTION
The UK economy imported and exported an estimated total of £711 billion worth of goods in 2014 of
which £511 billion was through its seaports. This figure can be compared with an overall UK GDP in
that year of £1,750 billion. The value of goods through the seaports reflected the passage of around
400 million tonnes of goods. A further £200 billion worth of goods passed through the Channel
Tunnel and between Northern Ireland and the Irish Republic and UK airports (non EU goods only
included for airports). Our analysis excludes goods passing across the UK in transit between the Irish
Republic and Continental mainland. It also excludes domestic cargo such as coastwise movements of
petroleum products as these do not constitute ‘trade’. We have also compared the value of goods
through ports with those airports, with and without the value of precious metals and stones.
While the ports collect data on throughput tonnages and contribute those results to the DfT in a
standardised format compatible with the Maritime Statistics Directive, no attempt is made by the
DfT to capture the value of those goods. The overall value of those goods is, however, captured
through VAT returns by shippers and receivers for intra EU cargo and through HM Customs and
Revenue through Customs returns for non EU cargo. The latter is collected and is available at the
port/airport level at a detailed commodity x country level and is readily available. However, no such
equivalent regime is available for intra EU cargo.
Our approach in making estimates of value of intra EU goods at the port level has been based upon
taking the results by value available through VAT returns and Customs returns as control totals and
using whatever evidence is available to ‘share’ those values between the ports. The principle such
evidence is tonnage by commodity and mode of appearance. We have used the value of extra EU
goods to help inform this process, but always using the total value of intra EU goods as control
totals. A number of assumptions have therefore been made with respect to generating generic
values but there is no reason to suppose that they would introduce any systematic bias as between
ports. The great majority of the data used was already restructured and held in-house by MDST and
cross checked for any obvious errors.
The value of goods passing through UK ports Page 5
Our Ref: 216013r8c
2. SOURCES
For this analysis we have used in-house databases along with public domain freight statistics as
specified in the following paragraphs. The year considered for this study is 2014.
UK Custom Data
The UK Custom Data shows the value (measured in thousands of £) and the volume (measured in
tonnes) of all the commodities imported/exported into/from the UK by non-EU partner country and
by UK port. The classification used in this dataset is SITC (i.e. Standard International Trade
Classification) at 5-digit level. The port definitions do not necessarily correspond to those used by
the DfT within the Maritime Statistics Directive datasets and we have therefore mapped data across
to correspond to the MSD approach (for example, ‘Forth’ includes ‘Grangemouth, Hound Point, Leith
and Rosyth).
We have used this dataset to estimate the relationship between value and estimated unitised cargo
and value and estimated non unitised cargo by modes of appearance for the NON EU countries
trading with the UK. For each commodity (approximately 3,000) shown in the UK Custom Data, we
have estimated the volume of Unitised Tonnes and Non Unitised Tonnes using our in-house look-up
list to convert tonnes into unitised tonnes. Using the same proportions, we have estimated the value
(£’000s) for the unitised and non-unitised cargo. For each port, we have then estimated the Unit
Value (£’000s) for both Unitised and Non Unitised cargo and applied these estimated unit values to
the volumes shown in the DfT statistics.
The UK Custom Data does not group commodity cargo into mode of appearance. To make this set of
data comparable with the DfT statistics, we have grouped trade data at the SITC 5-digit level into the
same three modes of appearance used by the DfT; specifically:
Non Unitised Cargo:
Dry Bulk: Agricultural products (e.g. grain, soya, tapioca), Coal, Ores and Other dry bulk
Liquid Bulk: Crude oil, Liquefied gas, Oil products and Other liquid bulk products
Other General Cargo: Forestry products and Iron and steel products
Vehicles
Unitised Cargo:
Vehicles: Import/Export motor vehicles
All other
The value of goods passing through UK ports Page 6
Our Ref: 216013r8c
For this analysis we have assumed that the cargo category ‘Other general cargo & containers <20'' is
included in unitised cargo. In practice, this is dominated by non-unitised fruit and vegetables (e.g.
bananas).
For the port and cargo type reported in the DfT statistics but not in the Custom data, we have
applied the average unit value for the cargo type.
MDS Transmodal, World Cargo Database (updated to 01.04.2016)
The World Cargo Database (WCD) holds worldwide containerised cargo from 1996 to the present for
circa 250 countries which can be grouped into regions and sub regions. The WCD is generated by
gathering quarterly trade data (tonnes) from most of the major economies of the world (each EU28
country separately, USA, Canada, China, South Korea, Japan, Taiwan, Norway, Switzerland, South
Africa, Hong Kong, Brazil, Argentina, Chile, Indonesia, Australia, Mexico, Philippines, Russia, Turkey,
Thailand and India). This covers over 95% of unitised world trade (i.e. to or from one of these
countries). For trade between other countries, data from the UN is used, boosting our global
coverage of unitised world trade to over 99%. The WCD tonnage data is translated into unitised
tonnes and then into loaded maritime TEU using various lookup tables based on commodity, volume
and the origin and destination countries. For ‘backhaul' trades, the propensity of certain
commodities to travel in containers is boosted to take into account the lower freight rates available
(e.g. steel scrap to the Far East).
We have used this dataset to estimate the ratio of value to unitised cargo and value to non-unitised
cargo for the EU countries trading with the UK. We have then applied these estimated unit values to
the volumes shown in the DfT statistics. While for non EU countries we could estimate the unit value
at the port level, for the EU countries our estimates could not be broken down by port. For the EU
countries, therefore, we have initially applied the same unit value calculated for each cargo type to
the various UK ports shown in the DfT statistics. These have then been totalled and adjusted to
match overall control totals of the value of goods traded with EU countries. We found that when we
took EU and non EU trades together this approach produced an almost perfect match with National
Accounts figures but there was not a perfect match for EU and non EU separately. This was to be
expected because port statistics record the port of loading and not the country or origin. Some cargo
recorded in port statistics as having an EU origin has, through transhipment, a non EU origin.
Department for Transport Statistics, Port Freight Statistics
This data describes total tonnes and number of units by major port, direction, country (i.e. intra or
extra EU) and by mode of appearance. Specifically:
o For the unitised cargo we have used table PORT0499
o For the non-Unitised cargo we have used table PORT0498

The value of goods passing through UK ports Page 7
Our Ref: 216013r8c
National Accounts
Overall control totals have been drawn from the document ‘UK trade’ (produced monthly by the UK
Office of National Statistics) which includes annual summaries of the total value of trade in goods by
country group and by commodity.

The value of goods passing through UK ports Page 8
Our Ref: 216013r8c
3. RESULTS
The total value of all goods moved into and out of the UK through seaports in 2014 was £511 billion,
which is summarised below:
Table 1: UK trade in goods by value, 2014 (£ million)
Unitised & Non Unitised traffic General Cargo Category
Non EU EU(28) Grand Total
NON Unitised
Dry Bulk 5,983 3,514 9,497
Liquid Bulk 37,023 33,719 70,742
Other General Cargo 2,588 5,383 7,971
NON Unitised Total 45,594 42,616 88,210
Unitised Vehicles 26,158 42,273 68,431
All other unitised 120,871 233,285 354,155
Unitised Total 147,028 275,558 422,587
Air traffic 146,336 146,336
Euro Tunnel 49,529 49,529
ROI and N Ireland 3,960 3,960
Total port traffic 192,622 318,174 510,796
Grand Total 338,958 371,663 710,621
Air traffic excl. precious stones & metals 104,558 104,558
Grand Total excl. precious stones & metals 297,181 371,663 668,844
Source: ONS
It will be seen that of that total of £711 billion, £511 billion are through UK ports. The figure of £711
billion falls to £669 billion if all precious stones and metals are excluded from airports. In that case,
seaports can be regarded as accounting for 76% of the value of all freight moving in and out of the
UK.
Based upon the evidence available we estimate that approximately £4 billion worth of goods passed
across the Irish land boundary with Northern Ireland, £102 billion through airports (excluding
‘precious’ goods) and £50 billion of precious materials through the Channel Tunnel. Adding these
flows to the estimated £42 billion of precious materials we derive an overall total of approximately
£711 billion as reported by the UK Office for National Statistics.
The value of goods passing through UK ports Page 9
Our Ref: 216013r8c
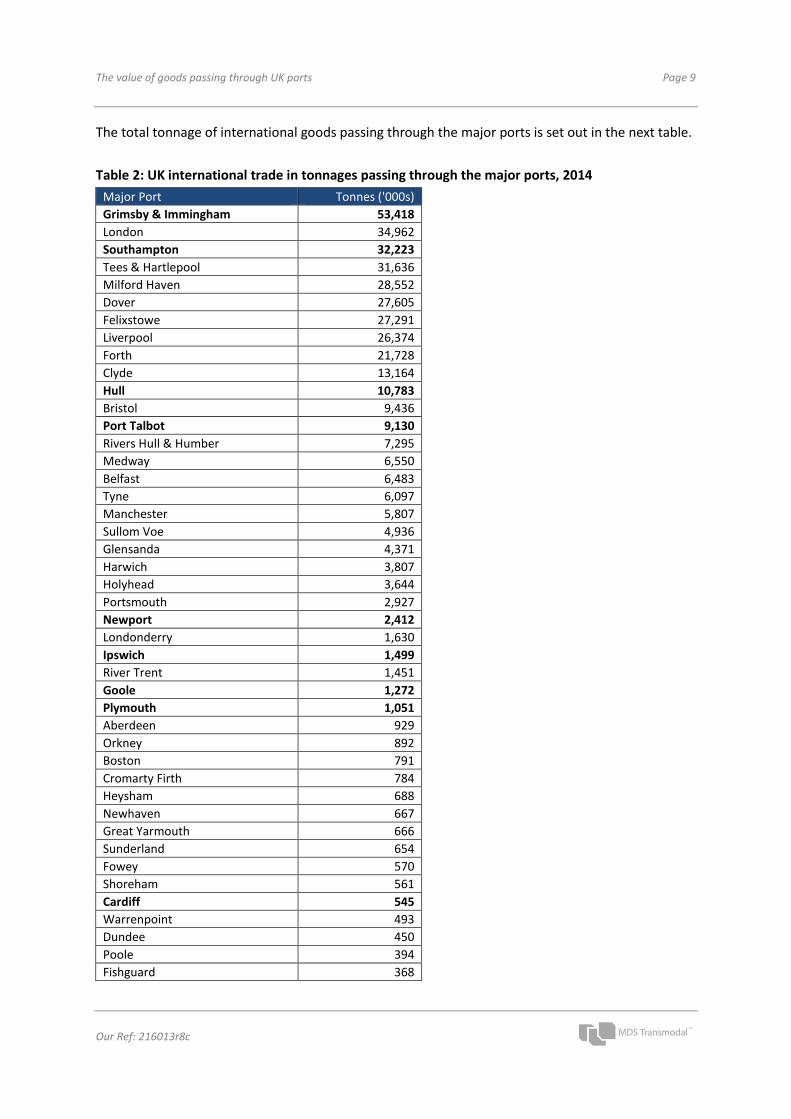
The total tonnage of international goods passing through the major ports is set out in the next table.
Table 2: UK international trade in tonnages passing through the major ports, 2014
Major Port Tonnes ('000s)
Grimsby & Immingham 53,418
London 34,962
Southampton 32,223
Tees & Hartlepool 31,636
Milford Haven 28,552
Dover 27,605
Felixstowe 27,291
Liverpool 26,374
Forth 21,728
Clyde 13,164
Hull 10,783
Bristol 9,436
Port Talbot 9,130
Rivers Hull & Humber 7,295
Medway 6,550
Belfast 6,483
Tyne 6,097
Manchester 5,807
Sullom Voe 4,936
Glensanda 4,371
Harwich 3,807
Holyhead 3,644
Portsmouth 2,927
Newport 2,412
Londonderry 1,630
Ipswich 1,499
River Trent 1,451
Goole 1,272
Plymouth 1,051
Aberdeen 929
Orkney 892
Boston 791
Cromarty Firth 784
Heysham 688
Newhaven 667
Great Yarmouth 666
Sunderland 654
Fowey 570
Shoreham 561
Cardiff 545
Warrenpoint 493
Dundee 450
Poole 394
Fishguard 368
The value of goods passing through UK ports Page 10
Our Ref: 216013r8c
Major Port Tonnes ('000s)
Swansea 348
Peterhead 139
Larne 7
Ramsgate 1
Cairnryan 0
Loch Ryan 0
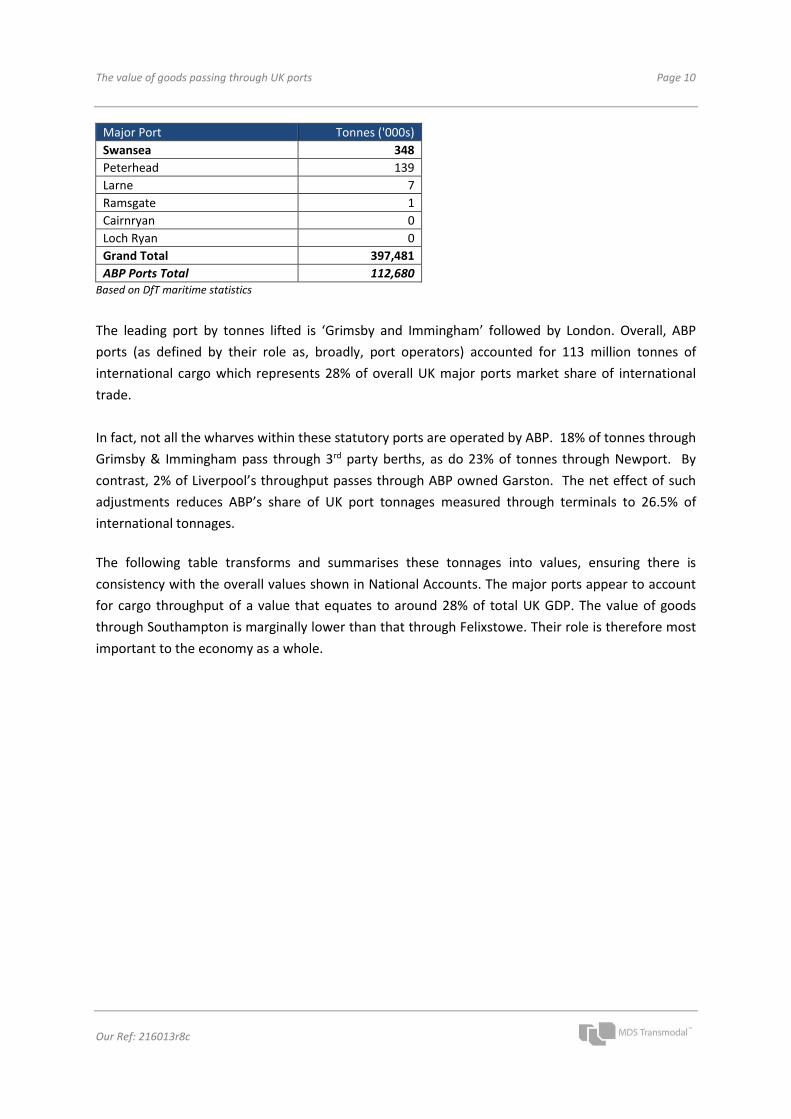
Grand Total 397,481
ABP Ports Total 112,680 Based on DfT maritime statistics
The leading port by tonnes lifted is ‘Grimsby and Immingham’ followed by London. Overall, ABP
ports (as defined by their role as, broadly, port operators) accounted for 113 million tonnes of
international cargo which represents 28% of overall UK major ports market share of international
trade.
In fact, not all the wharves within these statutory ports are operated by ABP. 18% of tonnes through
Grimsby & Immingham pass through 3rd party berths, as do 23% of tonnes through Newport. By
contrast, 2% of Liverpool’s throughput passes through ABP owned Garston. The net effect of such
adjustments reduces ABP’s share of UK port tonnages measured through terminals to 26.5% of
international tonnages.
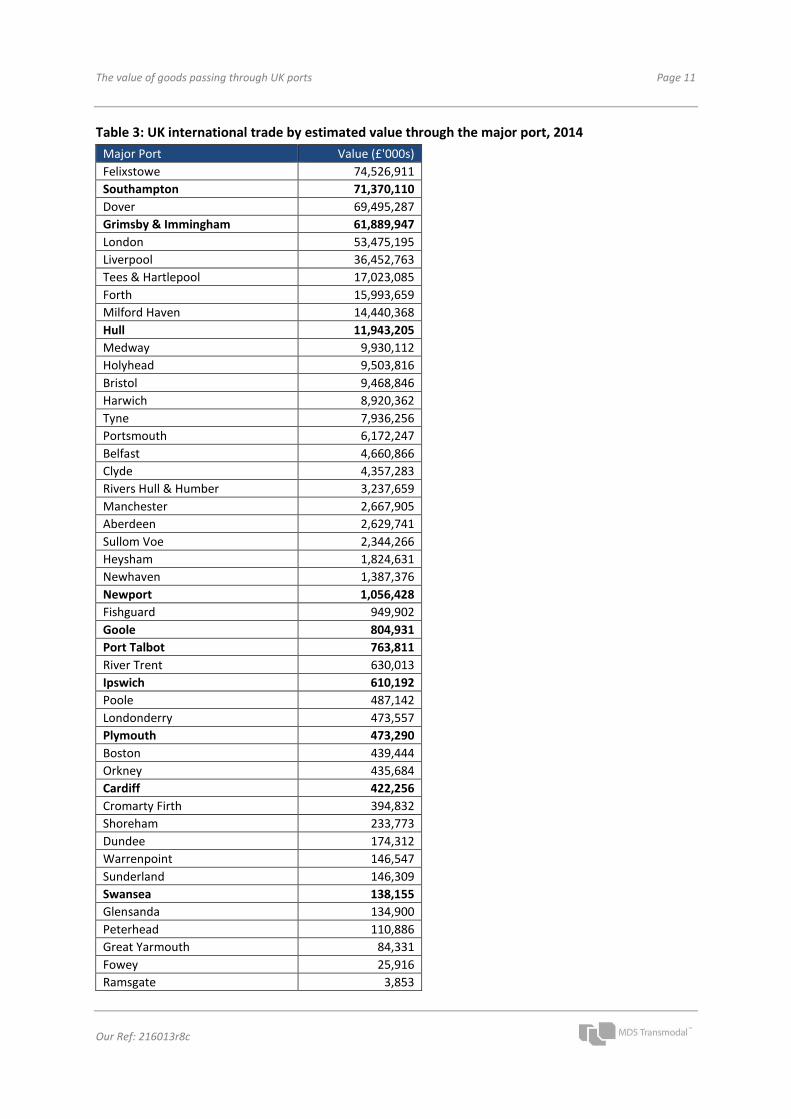
The following table transforms and summarises these tonnages into values, ensuring there is
consistency with the overall values shown in National Accounts. The major ports appear to account
for cargo throughput of a value that equates to around 28% of total UK GDP. The value of goods
through Southampton is marginally lower than that through Felixstowe. Their role is therefore most
important to the economy as a whole.
The value of goods passing through UK ports Page 11
Our Ref: 216013r8c
Table 3: UK international trade by estimated value through the major port, 2014
Major Port Value (£'000s)
Felixstowe 74,526,911
Southampton 71,370,110
Dover 69,495,287
Grimsby & Immingham 61,889,947
London 53,475,195
Liverpool 36,452,763
Tees & Hartlepool 17,023,085
Forth 15,993,659
Milford Haven 14,440,368
Hull 11,943,205
Medway 9,930,112
Holyhead 9,503,816
Bristol 9,468,846
Harwich 8,920,362
Tyne 7,936,256
Portsmouth 6,172,247
Belfast 4,660,866
Clyde 4,357,283
Rivers Hull & Humber 3,237,659
Manchester 2,667,905
Aberdeen 2,629,741
Sullom Voe 2,344,266
Heysham 1,824,631
Newhaven 1,387,376
Newport 1,056,428
Fishguard 949,902
Goole 804,931
Port Talbot 763,811
River Trent 630,013
Ipswich 610,192
Poole 487,142
Londonderry 473,557
Plymouth 473,290
Boston 439,444
Orkney 435,684
Cardiff 422,256
Cromarty Firth 394,832
Shoreham 233,773
Dundee 174,312
Warrenpoint 146,547
Sunderland 146,309
Swansea 138,155
Glensanda 134,900
Peterhead 110,886
Great Yarmouth 84,331
Fowey 25,916
Ramsgate 3,853
The value of goods passing through UK ports Page 12
Our Ref: 216013r8c
Major Port Value (£'000s)
Cairnryan 3,225
Larne 443
Loch Ryan 342
Grand Total 510,796,370
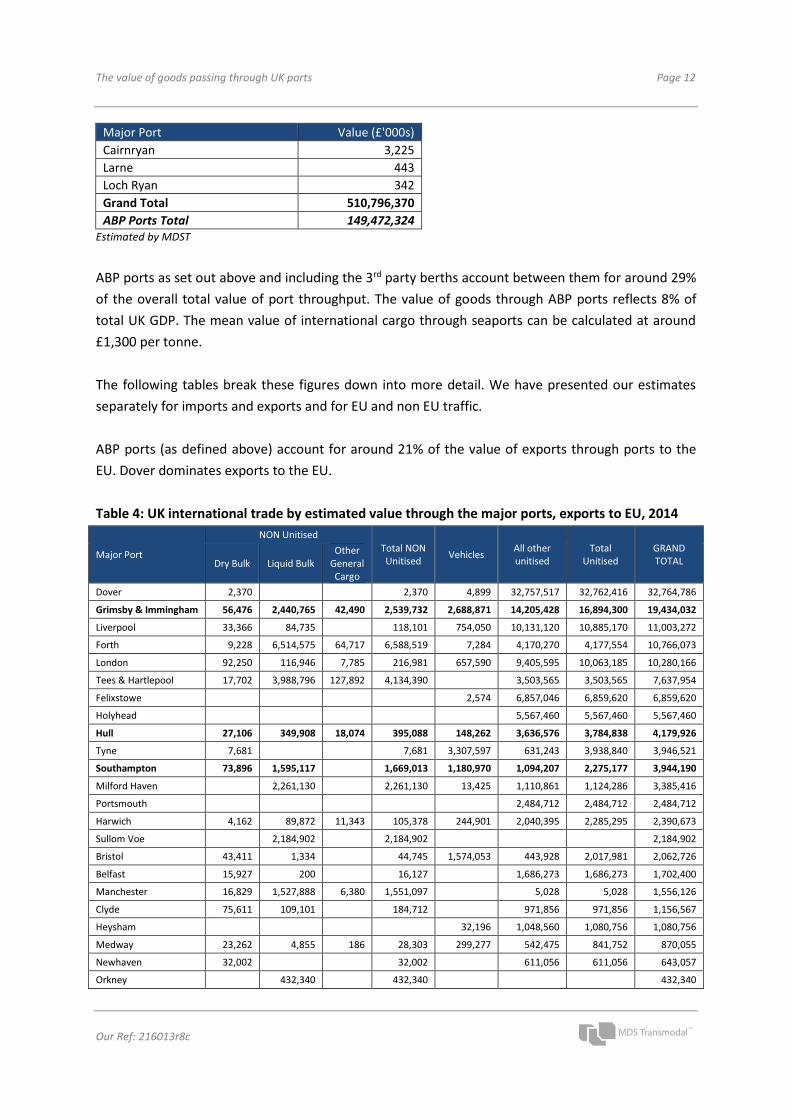
ABP Ports Total 149,472,324 Estimated by MDST
ABP ports as set out above and including the 3rd party berths account between them for around 29%
of the overall total value of port throughput. The value of goods through ABP ports reflects 8% of
total UK GDP. The mean value of international cargo through seaports can be calculated at around
£1,300 per tonne.
The following tables break these figures down into more detail. We have presented our estimates
separately for imports and exports and for EU and non EU traffic.
ABP ports (as defined above) account for around 21% of the value of exports through ports to the
EU. Dover dominates exports to the EU.
Table 4: UK international trade by estimated value through the major ports, exports to EU, 2014
Major Port
NON Unitised
Total NON Unitised
Vehicles All other unitised
Total Unitised
GRAND TOTAL Dry Bulk Liquid Bulk
Other General Cargo
Dover 2,370 2,370 4,899 32,757,517 32,762,416 32,764,786
Grimsby & Immingham 56,476 2,440,765 42,490 2,539,732 2,688,871 14,205,428 16,894,300 19,434,032
Liverpool 33,366 84,735 118,101 754,050 10,131,120 10,885,170 11,003,272
Forth 9,228 6,514,575 64,717 6,588,519 7,284 4,170,270 4,177,554 10,766,073
London 92,250 116,946 7,785 216,981 657,590 9,405,595 10,063,185 10,280,166
Tees & Hartlepool 17,702 3,988,796 127,892 4,134,390 3,503,565 3,503,565 7,637,954
Felixstowe 2,574 6,857,046 6,859,620 6,859,620
Holyhead 5,567,460 5,567,460 5,567,460
Hull 27,106 349,908 18,074 395,088 148,262 3,636,576 3,784,838 4,179,926
Tyne 7,681 7,681 3,307,597 631,243 3,938,840 3,946,521
Southampton 73,896 1,595,117 1,669,013 1,180,970 1,094,207 2,275,177 3,944,190
Milford Haven 2,261,130 2,261,130 13,425 1,110,861 1,124,286 3,385,416
Portsmouth 2,484,712 2,484,712 2,484,712
Harwich 4,162 89,872 11,343 105,378 244,901 2,040,395 2,285,295 2,390,673
Sullom Voe 2,184,902 2,184,902 2,184,902
Bristol 43,411 1,334 44,745 1,574,053 443,928 2,017,981 2,062,726
Belfast 15,927 200 16,127 1,686,273 1,686,273 1,702,400
Manchester 16,829 1,527,888 6,380 1,551,097 5,028 5,028 1,556,126
Clyde 75,611 109,101 184,712 971,856 971,856 1,156,567
Heysham 32,196 1,048,560 1,080,756 1,080,756
Medway 23,262 4,855 186 28,303 299,277 542,475 841,752 870,055
Newhaven 32,002 32,002 611,056 611,056 643,057
Orkney 432,340 432,340 432,340
The value of goods passing through UK ports Page 13
Our Ref: 216013r8c
Major Port
NON Unitised
Total NON Unitised
Vehicles All other unitised
Total Unitised
GRAND TOTAL Dry Bulk Liquid Bulk
Other General Cargo
Fishguard 13,067 412,374 425,441 425,441
Newport 15,766 324,937 340,704 340,704
Poole 12,776 12,776 183,194 183,194 195,970
Goole 670 81,188 81,858 64,734 64,734 146,592
Glensanda 120,530 120,530 120,530
Aberdeen 62,232 35,688 97,920 15,502 15,502 113,421
Cardiff 3,350 15,723 19,073 87,646 87,646 106,719
Plymouth 5,036 5,036 98,348 98,348 103,384
Ipswich 90,882 1,326 92,208 7,299 7,299 99,506
Swansea 2,806 2,806 86,965 86,965 89,771
Cromarty Firth 4,339 61,260 65,599 65,599
Great Yarmouth 27,157 27,157 2,552 2,552 29,710
Peterhead 15,175 15,175 14,412 14,412 29,587
Shoreham 22,579 2,586 25,165 25,165
Port Talbot 1,590 19,930 21,520 21,520
Boston 17,410 1,889 19,299 19,299
River Trent 2,772 15,240 18,012 18,012
Fowey 10,941 10,941 10,941
Dundee 3,608 3,608 7,216 7,216 10,825
Sunderland 7,650 1,776 9,426 9,426
Rivers Hull & Humber 5,947 5,947 5,947
Warrenpoint 4,857 4,857 4,857
Ramsgate 3,853 3,853 3,853
Londonderry 3,653 3,653 3,653
Cairnryan
Loch Ryan
Larne
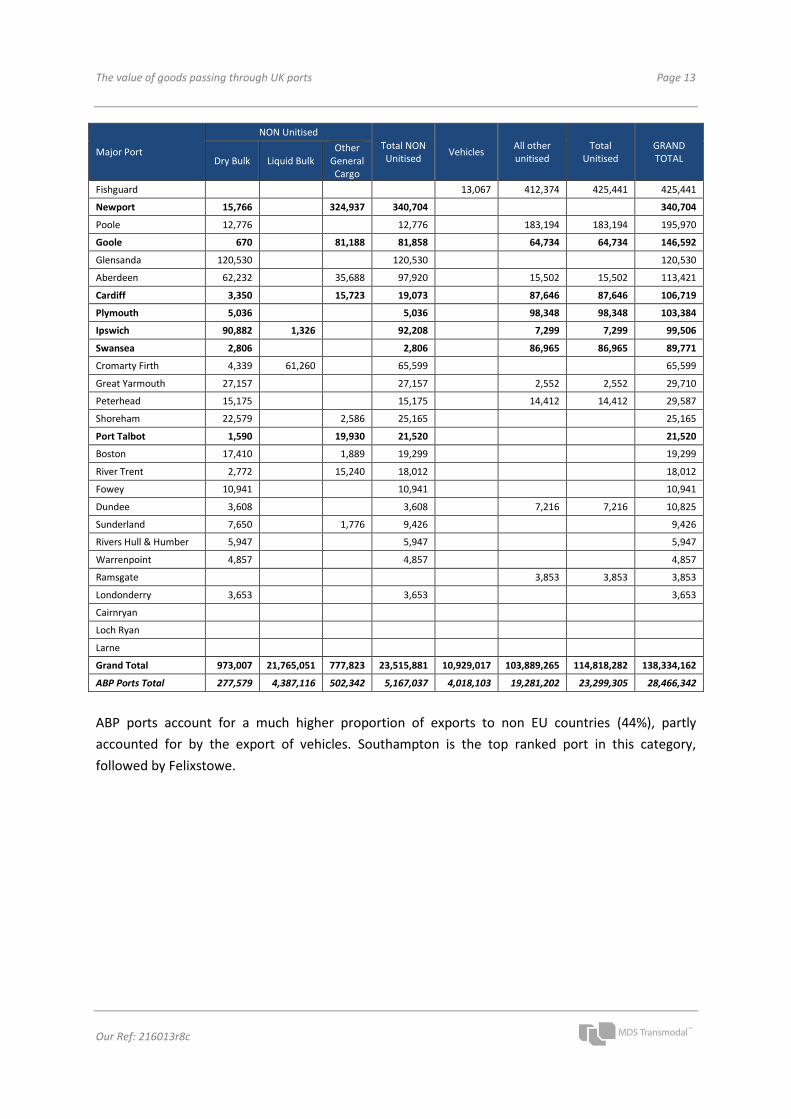
Grand Total 973,007 21,765,051 777,823 23,515,881 10,929,017 103,889,265 114,818,282 138,334,162
ABP Ports Total 277,579 4,387,116 502,342 5,167,037 4,018,103 19,281,202 23,299,305 28,466,342
ABP ports account for a much higher proportion of exports to non EU countries (44%), partly
accounted for by the export of vehicles. Southampton is the top ranked port in this category,
followed by Felixstowe.
The value of goods passing through UK ports Page 14
Our Ref: 216013r8c
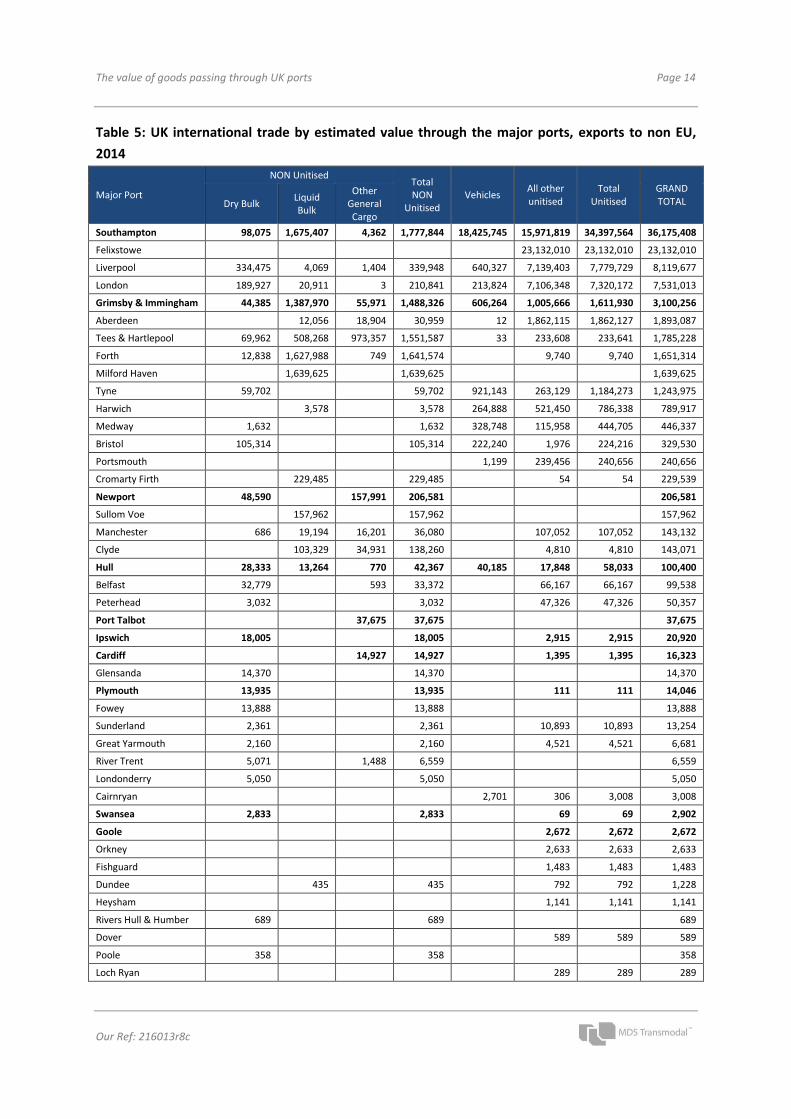
Table 5: UK international trade by estimated value through the major ports, exports to non EU,
2014
Major Port
NON Unitised Total NON
Unitised Vehicles
All other unitised
Total Unitised
GRAND TOTAL Dry Bulk
Liquid Bulk
Other General Cargo
Southampton 98,075 1,675,407 4,362 1,777,844 18,425,745 15,971,819 34,397,564 36,175,408
Felixstowe 23,132,010 23,132,010 23,132,010
Liverpool 334,475 4,069 1,404 339,948 640,327 7,139,403 7,779,729 8,119,677
London 189,927 20,911 3 210,841 213,824 7,106,348 7,320,172 7,531,013
Grimsby & Immingham 44,385 1,387,970 55,971 1,488,326 606,264 1,005,666 1,611,930 3,100,256
Aberdeen 12,056 18,904 30,959 12 1,862,115 1,862,127 1,893,087
Tees & Hartlepool 69,962 508,268 973,357 1,551,587 33 233,608 233,641 1,785,228
Forth 12,838 1,627,988 749 1,641,574 9,740 9,740 1,651,314
Milford Haven 1,639,625 1,639,625 1,639,625
Tyne 59,702 59,702 921,143 263,129 1,184,273 1,243,975
Harwich 3,578 3,578 264,888 521,450 786,338 789,917
Medway 1,632 1,632 328,748 115,958 444,705 446,337
Bristol 105,314 105,314 222,240 1,976 224,216 329,530
Portsmouth 1,199 239,456 240,656 240,656
Cromarty Firth 229,485 229,485 54 54 229,539
Newport 48,590 157,991 206,581 206,581
Sullom Voe 157,962 157,962 157,962
Manchester 686 19,194 16,201 36,080 107,052 107,052 143,132
Clyde 103,329 34,931 138,260 4,810 4,810 143,071
Hull 28,333 13,264 770 42,367 40,185 17,848 58,033 100,400
Belfast 32,779 593 33,372 66,167 66,167 99,538
Peterhead 3,032 3,032 47,326 47,326 50,357
Port Talbot 37,675 37,675 37,675
Ipswich 18,005 18,005 2,915 2,915 20,920
Cardiff 14,927 14,927 1,395 1,395 16,323
Glensanda 14,370 14,370 14,370
Plymouth 13,935 13,935 111 111 14,046
Fowey 13,888 13,888 13,888
Sunderland 2,361 2,361 10,893 10,893 13,254
Great Yarmouth 2,160 2,160 4,521 4,521 6,681
River Trent 5,071 1,488 6,559 6,559
Londonderry 5,050 5,050 5,050
Cairnryan 2,701 306 3,008 3,008
Swansea 2,833 2,833 69 69 2,902
Goole 2,672 2,672 2,672
Orkney 2,633 2,633 2,633
Fishguard 1,483 1,483 1,483
Dundee 435 435 792 792 1,228
Heysham 1,141 1,141 1,141
Rivers Hull & Humber 689 689 689
Dover 589 589 589
Poole 358 358 358
Loch Ryan 289 289 289
The value of goods passing through UK ports Page 15
Our Ref: 216013r8c
Major Port
NON Unitised Total NON
Unitised Vehicles
All other unitised
Total Unitised
GRAND TOTAL Dry Bulk
Liquid Bulk
Other General Cargo
Larne 92 92 92
Holyhead
Newhaven
Shoreham
Boston
Ramsgate
Warrenpoint
Grand Total 1,108,448 7,403,541 1,319,324 9,831,314 21,667,312 57,875,836 79,543,147 89,374,461
ABP Ports Total 254,156 3,076,642 271,696 3,602,493 19,072,195 17,002,495 36,074,691 39,677,184
In the case of imports from the EU, ABP accounts for 29% of the market by value, again with vehicles
playing an important role. Dover leads because of its role as the principal ferry port of the UK from
the Continent but the value of goods through Grimsby & Immingham is only 4% lower.
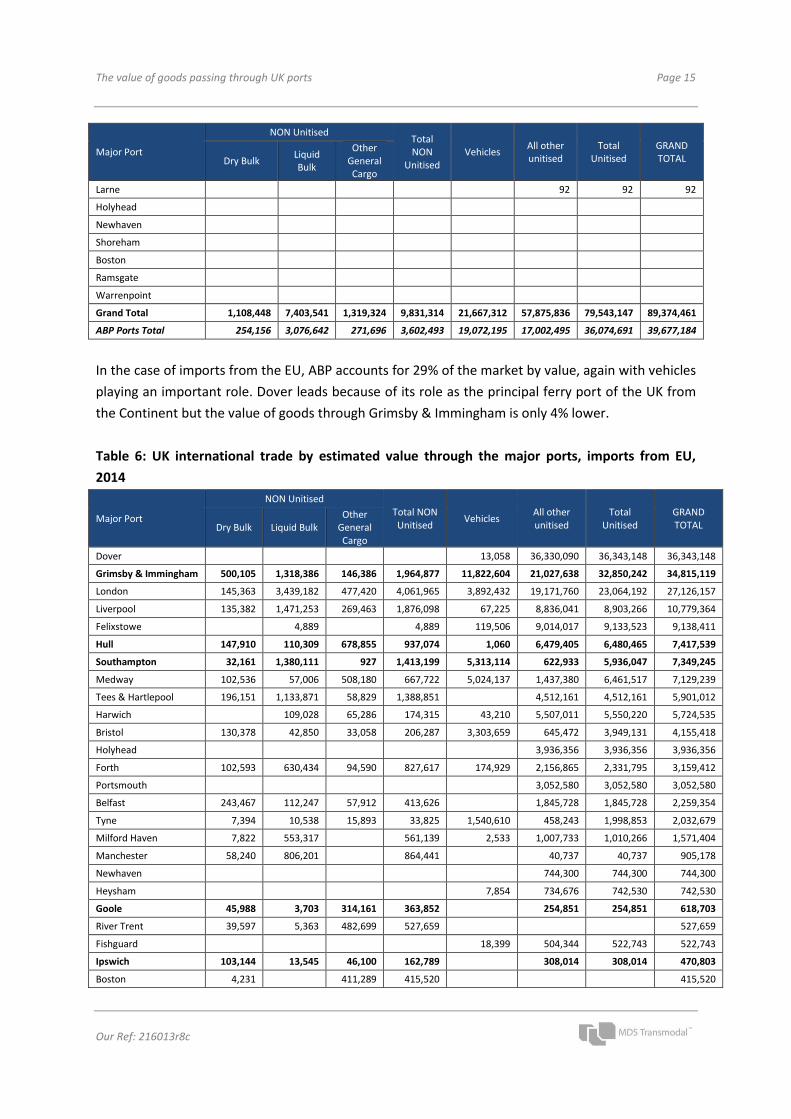
Table 6: UK international trade by estimated value through the major ports, imports from EU,
2014
Major Port
NON Unitised Total NON Unitised
Vehicles All other unitised
Total Unitised
GRAND TOTAL Dry Bulk Liquid Bulk
Other General Cargo
Dover 13,058 36,330,090 36,343,148 36,343,148
Grimsby & Immingham 500,105 1,318,386 146,386 1,964,877 11,822,604 21,027,638 32,850,242 34,815,119
London 145,363 3,439,182 477,420 4,061,965 3,892,432 19,171,760 23,064,192 27,126,157
Liverpool 135,382 1,471,253 269,463 1,876,098 67,225 8,836,041 8,903,266 10,779,364
Felixstowe 4,889 4,889 119,506 9,014,017 9,133,523 9,138,411
Hull 147,910 110,309 678,855 937,074 1,060 6,479,405 6,480,465 7,417,539
Southampton 32,161 1,380,111 927 1,413,199 5,313,114 622,933 5,936,047 7,349,245
Medway 102,536 57,006 508,180 667,722 5,024,137 1,437,380 6,461,517 7,129,239
Tees & Hartlepool 196,151 1,133,871 58,829 1,388,851 4,512,161 4,512,161 5,901,012
Harwich 109,028 65,286 174,315 43,210 5,507,011 5,550,220 5,724,535
Bristol 130,378 42,850 33,058 206,287 3,303,659 645,472 3,949,131 4,155,418
Holyhead 3,936,356 3,936,356 3,936,356
Forth 102,593 630,434 94,590 827,617 174,929 2,156,865 2,331,795 3,159,412
Portsmouth 3,052,580 3,052,580 3,052,580
Belfast 243,467 112,247 57,912 413,626 1,845,728 1,845,728 2,259,354
Tyne 7,394 10,538 15,893 33,825 1,540,610 458,243 1,998,853 2,032,679
Milford Haven 7,822 553,317 561,139 2,533 1,007,733 1,010,266 1,571,404
Manchester 58,240 806,201 864,441 40,737 40,737 905,178
Newhaven 744,300 744,300 744,300
Heysham 7,854 734,676 742,530 742,530
Goole 45,988 3,703 314,161 363,852 254,851 254,851 618,703
River Trent 39,597 5,363 482,699 527,659 527,659
Fishguard 18,399 504,344 522,743 522,743
Ipswich 103,144 13,545 46,100 162,789 308,014 308,014 470,803
Boston 4,231 411,289 415,520 415,520
The value of goods passing through UK ports Page 16
Our Ref: 216013r8c
Major Port
NON Unitised
Total NON Unitised
Vehicles All other unitised
Total Unitised
GRAND TOTAL Dry Bulk Liquid Bulk
Other General Cargo
Clyde 36,031 134,523 4,306 174,860 201,693 201,693 376,553
Plymouth 26,280 233,030 259,310 80,790 80,790 340,100
Newport 35,111 293,396 328,507 328,507
Poole 4,286 30,681 34,966 254,279 254,279 289,245
Cardiff 314 81,619 84,873 166,805 100,692 100,692 267,497
Shoreham 801 8,505 196,754 206,061 206,061
Rivers Hull & Humber 96,417 94,252 190,669 190,669
Londonderry 54,206 131,370 520 186,097 186,097
Port Talbot 182,113 182,113 182,113
Dundee 16,435 89,556 22,594 128,585 18,924 18,924 147,510
Aberdeen 6,428 46,411 27,688 80,526 24,925 24,925 105,451
Warrenpoint 22,911 76,822 99,732 99,732
Cromarty Firth 14,581 3,284 9,401 27,266 70,969 70,969 98,235
Sunderland 8,108 64,736 72,843 72,843
Swansea 20,930 23,855 44,784 44,784
Great Yarmouth 13,146 9,881 14,707 37,734 37,734
Peterhead 206 13,095 13,302 13,451 13,451 26,752
Sullom Voe 1,402 1,402 1,402
Fowey 157 157 157
Orkney
Glensanda
Ramsgate
Cairnryan
Loch Ryan
Larne
Grand Total 2,540,923 11,953,508 4,605,632 19,100,063 31,344,331 129,395,460 160,739,791 179,839,854
ABP Ports Total 1,094,055 3,140,703 1,588,552 5,823,310 17,136,778 28,874,323 46,011,101 51,834,411
Grimsby & Immingham perform almost as well as Dover for imports from the EU because of the high
proportion of vehicle imports and unitised cargo.
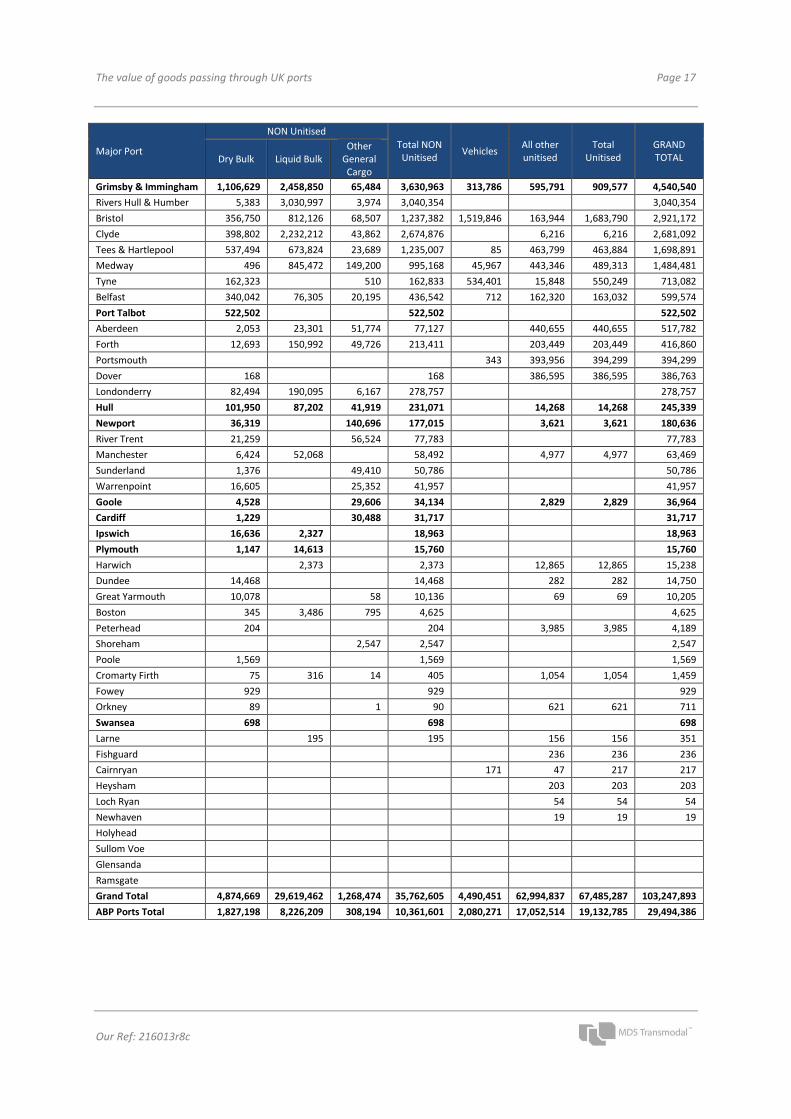
For imports from non EU countries Felixstowe dominates, followed by Southampton, reflecting the
importance of containerised imports from the Far East.
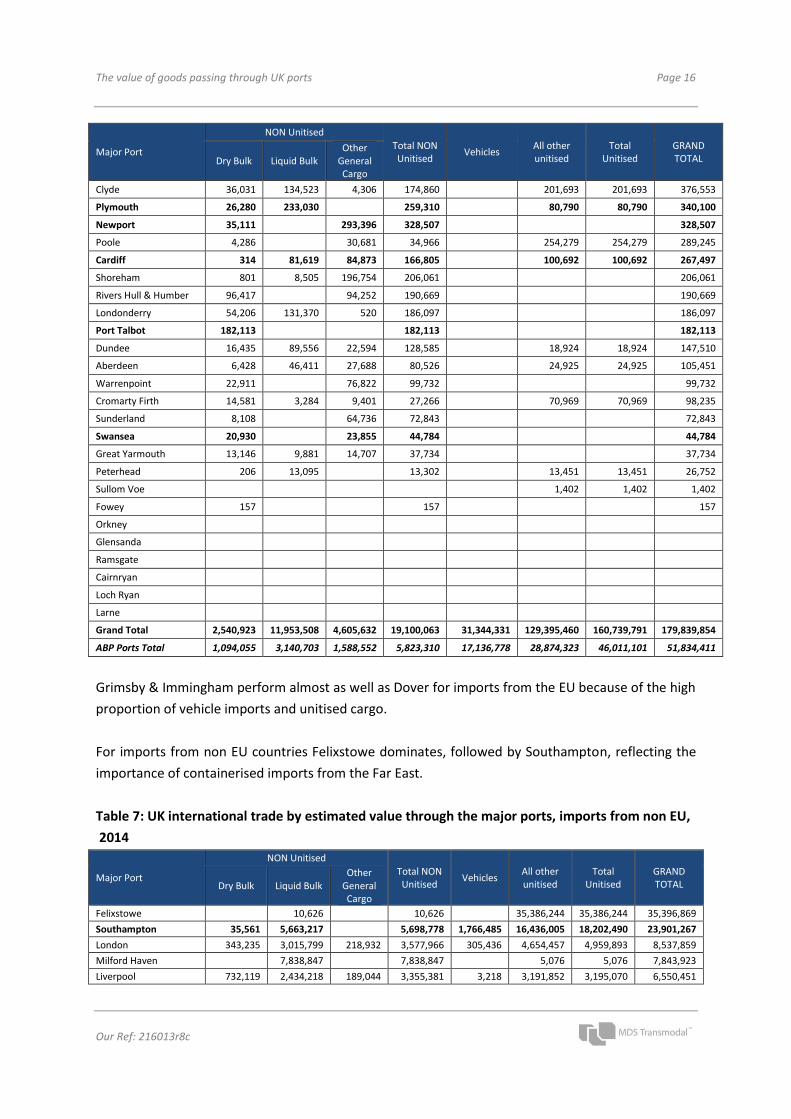
Table 7: UK international trade by estimated value through the major ports, imports from non EU,
2014
Major Port
NON Unitised
Total NON Unitised
Vehicles All other unitised
Total Unitised
GRAND TOTAL Dry Bulk Liquid Bulk
Other General Cargo
Felixstowe 10,626 10,626 35,386,244 35,386,244 35,396,869
Southampton 35,561 5,663,217 5,698,778 1,766,485 16,436,005 18,202,490 23,901,267
London 343,235 3,015,799 218,932 3,577,966 305,436 4,654,457 4,959,893 8,537,859
Milford Haven 7,838,847 7,838,847 5,076 5,076 7,843,923
Liverpool 732,119 2,434,218 189,044 3,355,381 3,218 3,191,852 3,195,070 6,550,451
The value of goods passing through UK ports Page 17
Our Ref: 216013r8c
Major Port
NON Unitised
Total NON Unitised
Vehicles All other unitised
Total Unitised
GRAND TOTAL Dry Bulk Liquid Bulk
Other General Cargo
Grimsby & Immingham 1,106,629 2,458,850 65,484 3,630,963 313,786 595,791 909,577 4,540,540
Rivers Hull & Humber 5,383 3,030,997 3,974 3,040,354 3,040,354
Bristol 356,750 812,126 68,507 1,237,382 1,519,846 163,944 1,683,790 2,921,172
Clyde 398,802 2,232,212 43,862 2,674,876 6,216 6,216 2,681,092
Tees & Hartlepool 537,494 673,824 23,689 1,235,007 85 463,799 463,884 1,698,891
Medway 496 845,472 149,200 995,168 45,967 443,346 489,313 1,484,481
Tyne 162,323 510 162,833 534,401 15,848 550,249 713,082
Belfast 340,042 76,305 20,195 436,542 712 162,320 163,032 599,574
Port Talbot 522,502 522,502 522,502
Aberdeen 2,053 23,301 51,774 77,127 440,655 440,655 517,782
Forth 12,693 150,992 49,726 213,411 203,449 203,449 416,860
Portsmouth 343 393,956 394,299 394,299
Dover 168 168 386,595 386,595 386,763
Londonderry 82,494 190,095 6,167 278,757 278,757
Hull 101,950 87,202 41,919 231,071 14,268 14,268 245,339
Newport 36,319 140,696 177,015 3,621 3,621 180,636
River Trent 21,259 56,524 77,783 77,783
Manchester 6,424 52,068 58,492 4,977 4,977 63,469
Sunderland 1,376 49,410 50,786 50,786
Warrenpoint 16,605 25,352 41,957 41,957
Goole 4,528 29,606 34,134 2,829 2,829 36,964
Cardiff 1,229 30,488 31,717 31,717
Ipswich 16,636 2,327 18,963 18,963
Plymouth 1,147 14,613 15,760 15,760
Harwich 2,373 2,373 12,865 12,865 15,238
Dundee 14,468 14,468 282 282 14,750
Great Yarmouth 10,078 58 10,136 69 69 10,205
Boston 345 3,486 795 4,625 4,625
Peterhead 204 204 3,985 3,985 4,189
Shoreham 2,547 2,547 2,547
Poole 1,569 1,569 1,569
Cromarty Firth 75 316 14 405 1,054 1,054 1,459
Fowey 929 929 929
Orkney 89 1 90 621 621 711
Swansea 698 698 698
Larne 195 195 156 156 351
Fishguard 236 236 236
Cairnryan 171 47 217 217
Heysham 203 203 203
Loch Ryan 54 54 54
Newhaven 19 19 19
Holyhead
Sullom Voe
Glensanda
Ramsgate
Grand Total 4,874,669 29,619,462 1,268,474 35,762,605 4,490,451 62,994,837 67,485,287 103,247,893
ABP Ports Total 1,827,198 8,226,209 308,194 10,361,601 2,080,271 17,052,514 19,132,785 29,494,386
The value of goods passing through UK ports Page 18
Our Ref: 216013r8c
ABP’s market share in these different sectors does vary significantly; being highest for exports to non
EU markets and lowest for exports to EU markets. Much of this is explained by its role in vehicle
exports. For the import and export summary tables we have also included the leading airports (only
Heathrow features) excluding the value of previous metals and stones.
4. SUMMARY
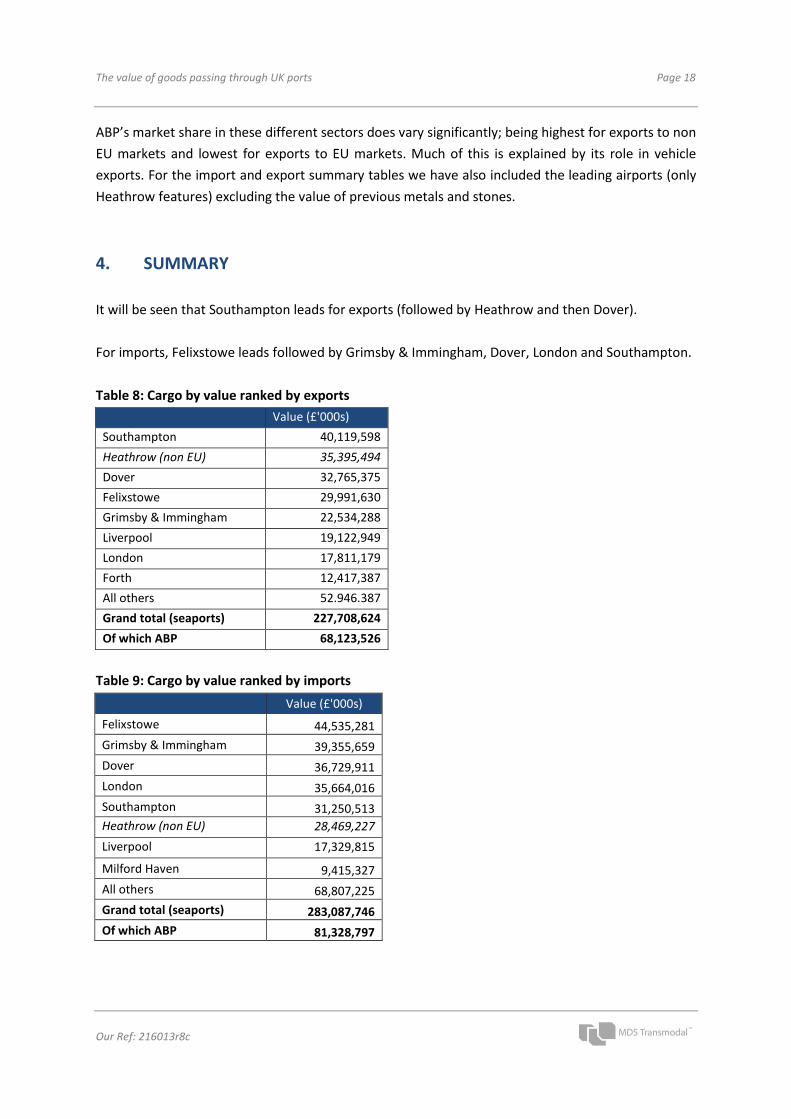
It will be seen that Southampton leads for exports (followed by Heathrow and then Dover).
For imports, Felixstowe leads followed by Grimsby & Immingham, Dover, London and Southampton.
Table 8: Cargo by value ranked by exports
Value (£'000s)
Southampton 40,119,598
Heathrow (non EU) 35,395,494
Dover 32,765,375
Felixstowe 29,991,630
Grimsby & Immingham 22,534,288
Liverpool 19,122,949
London 17,811,179
Forth 12,417,387
All others 52.946.387
Grand total (seaports) 227,708,624
Of which ABP 68,123,526
Table 9: Cargo by value ranked by imports
Value (£'000s)
Felixstowe 44,535,281
Grimsby & Immingham 39,355,659
Dover 36,729,911
London 35,664,016
Southampton 31,250,513
Heathrow (non EU) 28,469,227
Liverpool 17,329,815
Milford Haven 9,415,327
All others 68,807,225
Grand total (seaports) 283,087,746
Of which ABP 81,328,797
The value of goods passing through UK ports Page 19
Our Ref: 216013r8c
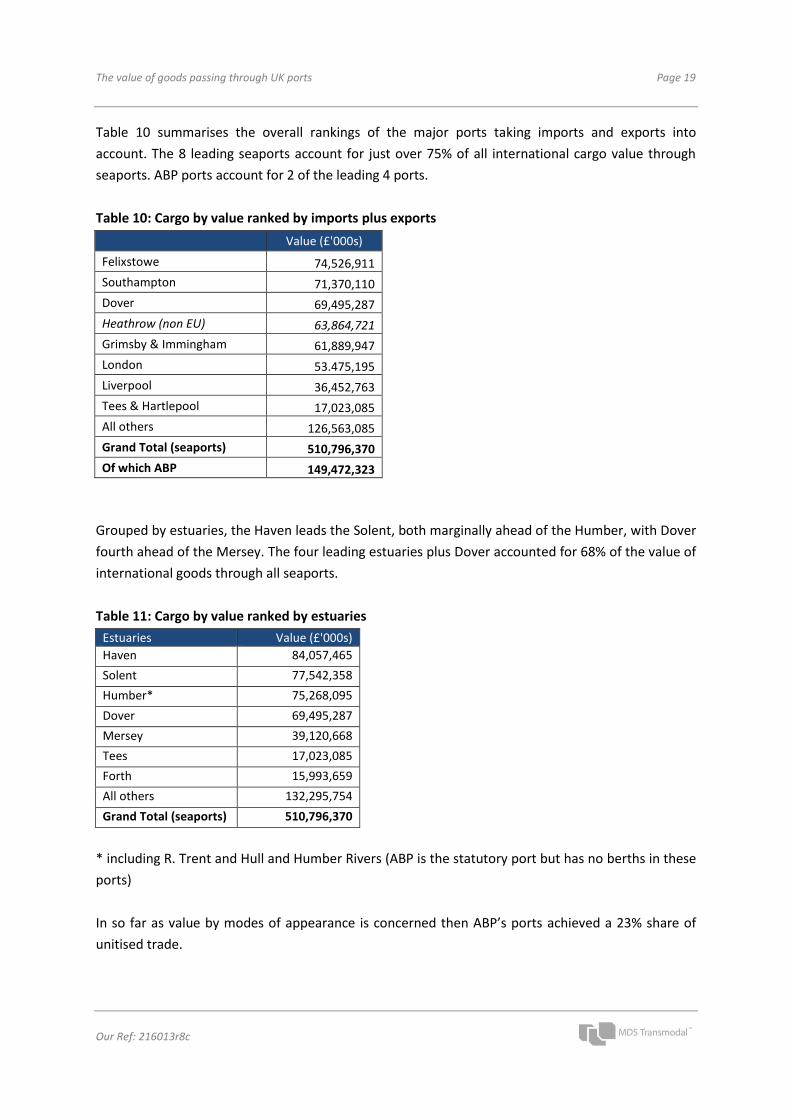
Table 10 summarises the overall rankings of the major ports taking imports and exports into
account. The 8 leading seaports account for just over 75% of all international cargo value through
seaports. ABP ports account for 2 of the leading 4 ports.
Table 10: Cargo by value ranked by imports plus exports
Value (£'000s)
Felixstowe 74,526,911
Southampton 71,370,110
Dover 69,495,287
Heathrow (non EU) 63,864,721
Grimsby & Immingham 61,889,947
London 53.475,195
Liverpool 36,452,763
Tees & Hartlepool 17,023,085
All others 126,563,085
Grand Total (seaports) 510,796,370
Of which ABP 149,472,323
Grouped by estuaries, the Haven leads the Solent, both marginally ahead of the Humber, with Dover
fourth ahead of the Mersey. The four leading estuaries plus Dover accounted for 68% of the value of
international goods through all seaports.
Table 11: Cargo by value ranked by estuaries
Estuaries Value (£'000s)
Haven 84,057,465
Solent 77,542,358
Humber* 75,268,095
Dover 69,495,287
Mersey 39,120,668
Tees 17,023,085
Forth 15,993,659
All others 132,295,754
Grand Total (seaports) 510,796,370
* including R. Trent and Hull and Humber Rivers (ABP is the statutory port but has no berths in these
ports)
In so far as value by modes of appearance is concerned then ABP’s ports achieved a 23% share of
unitised trade.
The value of goods passing through UK ports Page 20
Our Ref: 216013r8c
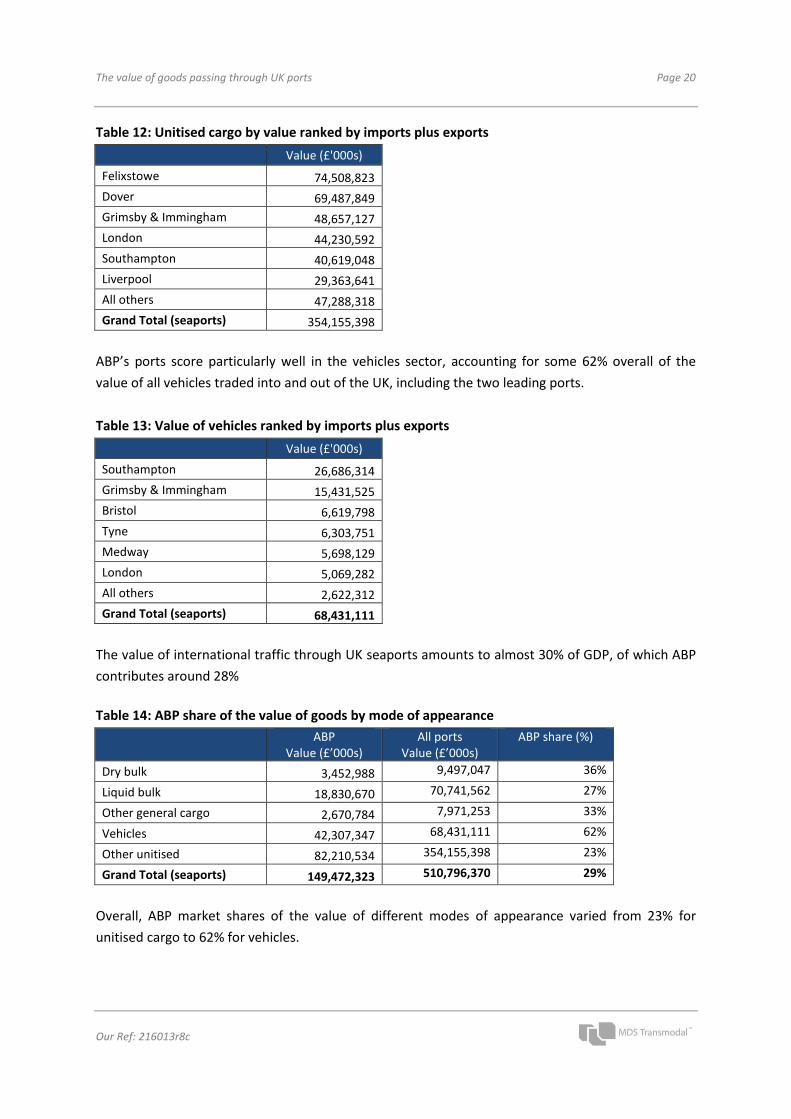
Table 12: Unitised cargo by value ranked by imports plus exports
Value (£'000s)
Felixstowe 74,508,823
Dover 69,487,849
Grimsby & Immingham 48,657,127
London 44,230,592
Southampton 40,619,048
Liverpool 29,363,641
All others 47,288,318
Grand Total (seaports) 354,155,398
ABP’s ports score particularly well in the vehicles sector, accounting for some 62% overall of the
value of all vehicles traded into and out of the UK, including the two leading ports.
Table 13: Value of vehicles ranked by imports plus exports
Value (£'000s)
Southampton 26,686,314
Grimsby & Immingham 15,431,525
Bristol 6,619,798
Tyne 6,303,751
Medway 5,698,129
London 5,069,282
All others 2,622,312
Grand Total (seaports) 68,431,111
The value of international traffic through UK seaports amounts to almost 30% of GDP, of which ABP
contributes around 28%
Table 14: ABP share of the value of goods by mode of appearance
ABP
Value (£’000s) All ports
Value (£’000s) ABP share (%)
Dry bulk 3,452,988 9,497,047 36%
Liquid bulk 18,830,670 70,741,562 27%
Other general cargo 2,670,784 7,971,253 33%
Vehicles 42,307,347 68,431,111 62%
Other unitised 82,210,534 354,155,398 23%
Grand Total (seaports) 149,472,323 510,796,370 29%
Overall, ABP market shares of the value of different modes of appearance varied from 23% for
unitised cargo to 62% for vehicles.