the vagaries of the vignette world revisited: method ... · the vagaries of the vignette world...
TRANSCRIPT

7. Juli 2015
The Vagaries of the Vignette World Revisited: Method Effects in Factorial Surveys
Katrin Auspurg (Goethe University, Frankfurt)
GESIS Vortragsreihe, Mannheim, July 07, 2015

7. Juli 2015
Applications of Factorial Surveys in Social Sciences
1951: Established by Peter H. Rossi in his dissertation1982: First introductory text book by Rossi and Nock1982 – 2006: 106 studies published in core journals of sociology
2
Sour
ce:
Thom
pson
s W
eb
of S
cien
ce
7. Juli 2015
Overview
1. Idea and Motivation of Factorial Surveys
2. Methodological Research: Nothing More Than Artifacts?
3. Recommendations
Response Scales
Experimental Design
3
7. Juli 2015
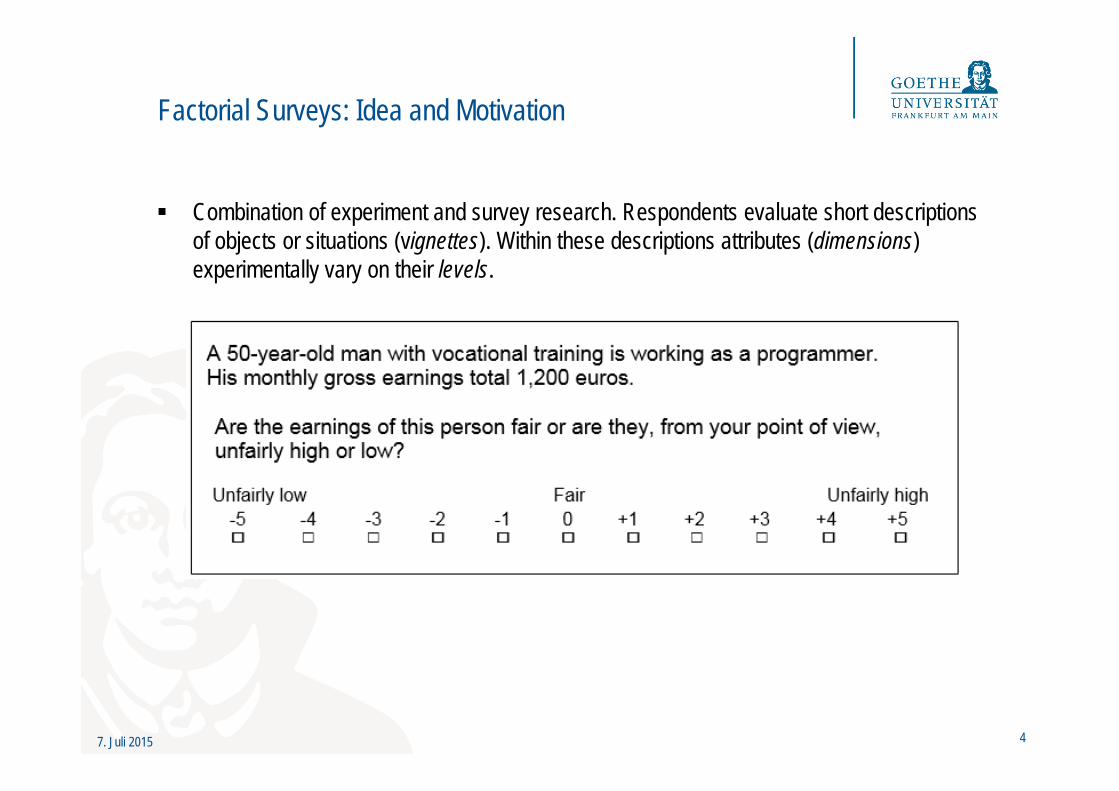
Factorial Surveys: Idea and Motivation
Combination of experiment and survey research. Respondents evaluate short descriptions of objects or situations (vignettes). Within these descriptions attributes (dimensions) experimentally vary on their levels.
4
7. Juli 2015
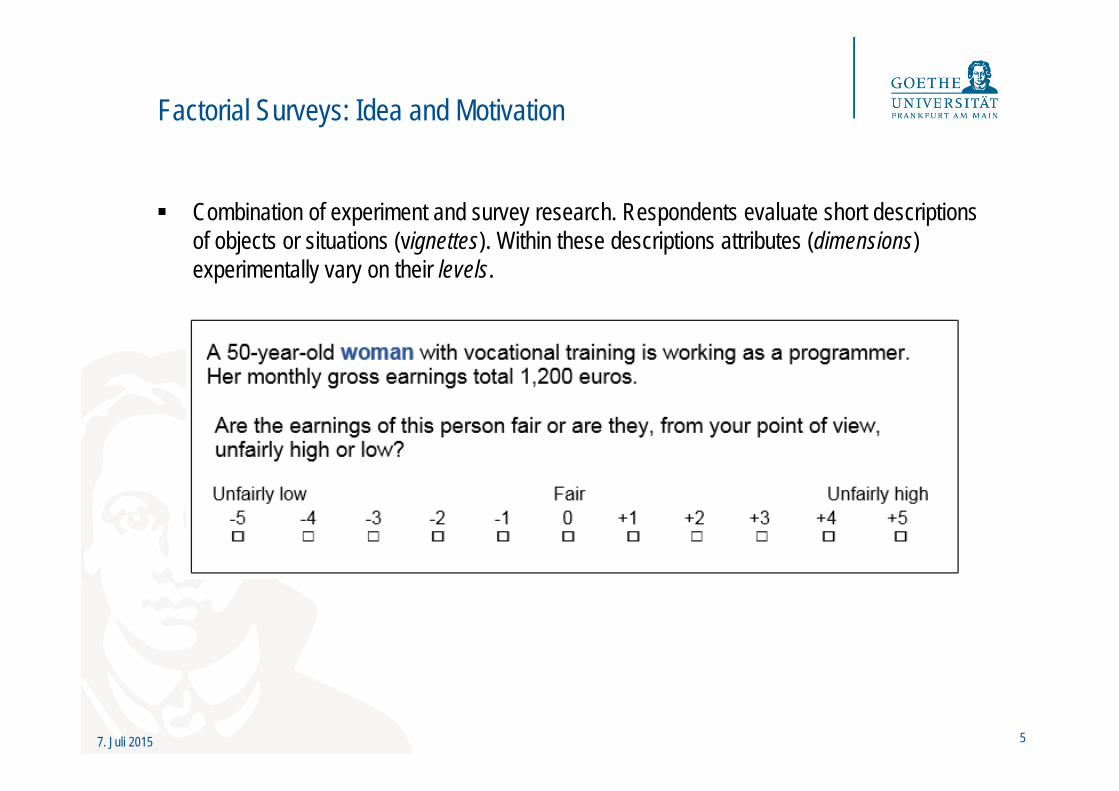
Factorial Surveys: Idea and Motivation
Combination of experiment and survey research. Respondents evaluate short descriptions of objects or situations (vignettes). Within these descriptions attributes (dimensions) experimentally vary on their levels.
5

7. Juli 2015
Factorial Surveys: Idea and Motivation
Combination of experiment and survey research. Respondents evaluate short descriptions of objects or situations (vignettes). Within these descriptions attributes (dimensions) experimentally vary on their levels.
6
7. Juli 2015
Research Aims and Advantages
Measuring influence of: Dimensions on evaluations Respondents‘ characteristics on vignette evaluations Amount of social consensus across respondents.
Advantages: Experimental design Heterogeneous respondents Less social desirability bias
7

7. Juli 2015
Example: Discrimination of Female Employees?
Caused by discrimination? Underlying mechanisms?
8
Persisting pay gaps in the US and European countries.
7. Juli 2015
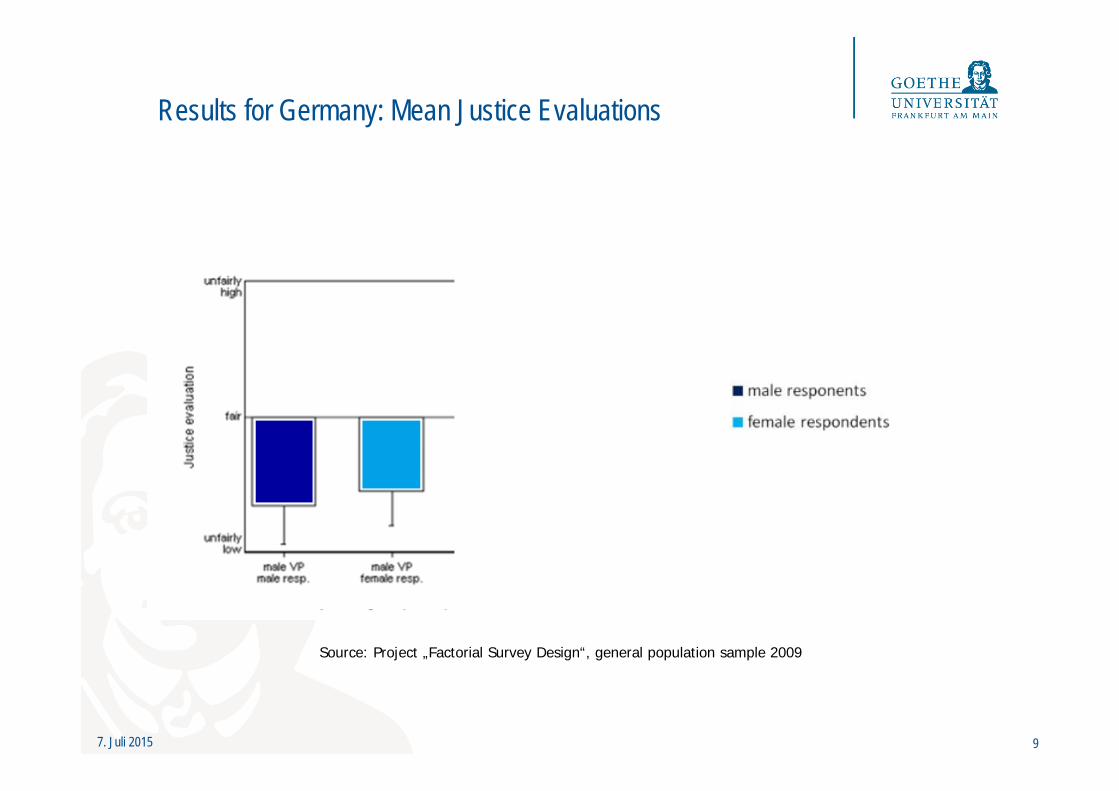
Results for Germany: Mean Justice Evaluations
9
Source: Project „Factorial Survey Design“, general population sample 2009

7. Juli 2015
Results for Germany: Mean Justice Evaluations
10
Source: Project „Factorial Survey Design“, general population sample 2009

7. Juli 2015
Just Gender Pay Gaps in %
11
7.258.88
male female
respondent vignette person
5.81
9.787.18
withoutdegree
vocationaldegree
universitydegree

7. Juli 2015
Hints on Underlying Mechanisms
Some evidence for double standards (e.g. education) Evidence for priming processes: just gender pay gaps were more pronounced for
respondents how experienced strong actual pay gaps in their own occupations. Only few evidence for statistical discrimination (pay gaps were found to be very resistant to
increasing amounts of information on employees’ performance).
12

7. Juli 2015
Or nothing more than artifacts?
The vagaries of the vignette world revisited
13
7. Juli 2015
The combination of dimensions often leads to implausible or even illogical cases. This might cause respondents to rate the plausibility instead of fairness. („Respondents may have been sophisticated enough to recognize functional untenabilities and to classify such vignettes as „overpaid“ or „underpaid“ largely on the basis of size of income alone“; Faia 1980: 952).
Research on the effects of implausible vignettes showed that respondents place less attention on the dimensions that cause the implausibility (Auspurg et al. 2009).
So one should exclude at least very implausible cases. But the remaining vignette cases still might vary in their plausibility.
Research on the construct validity is lacking. (Do respondents really rate fairness?).
Criticism: A Test of Intelligence (Faia 1980)
7. Juli 2015
0
200
400
600
800
indi
rect
mea
sure
men
t [10
0,00
0 U
SD
]
0 20 40 60 80 100direct measurement [100,000$]
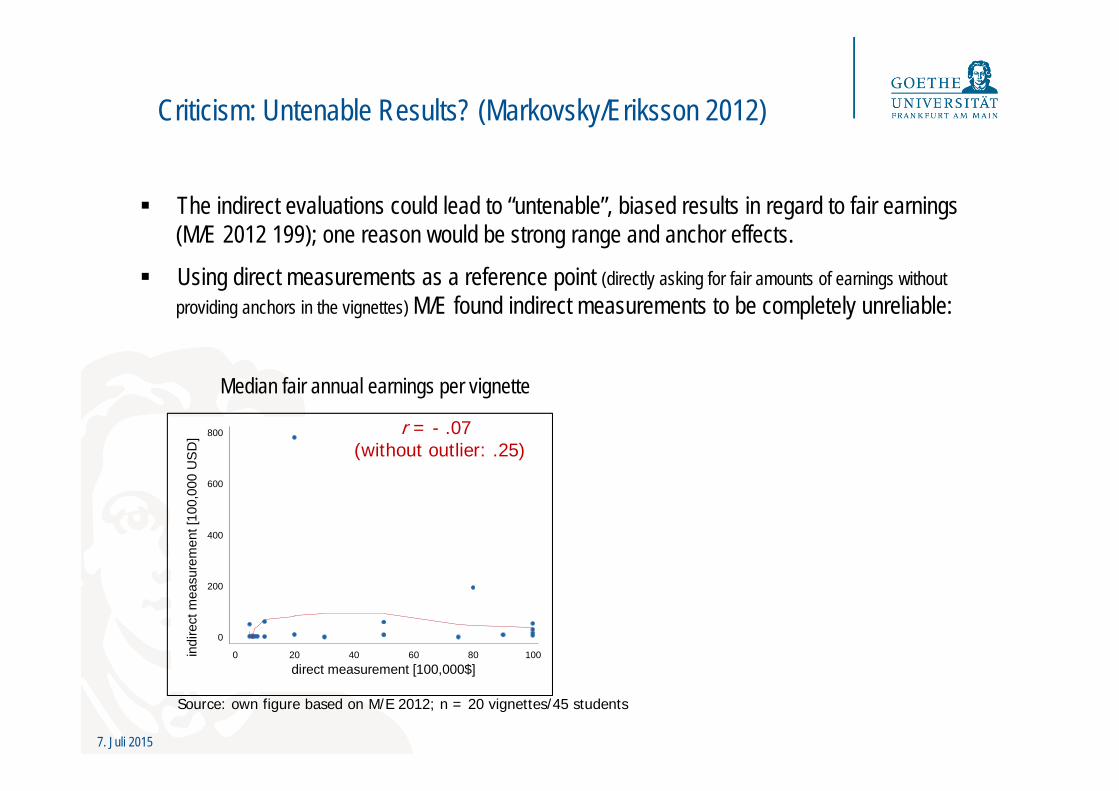
The indirect evaluations could lead to “untenable”, biased results in regard to fair earnings (M/E 2012 199); one reason would be strong range and anchor effects.
Using direct measurements as a reference point (directly asking for fair amounts of earnings without providing anchors in the vignettes) M/E found indirect measurements to be completely unreliable:
Criticism: Untenable Results? (Markovsky/Eriksson 2012)
r = - .07(without outlier: .25)
Source: own figure based on M/E 2012; n = 20 vignettes/45 students
Median fair annual earnings per vignette
7. Juli 2015
0
200
400
600
800
indi
rect
mea
sure
men
t [10
0,00
0 U
SD
]
0 20 40 60 80 100direct measurement [100,000$]
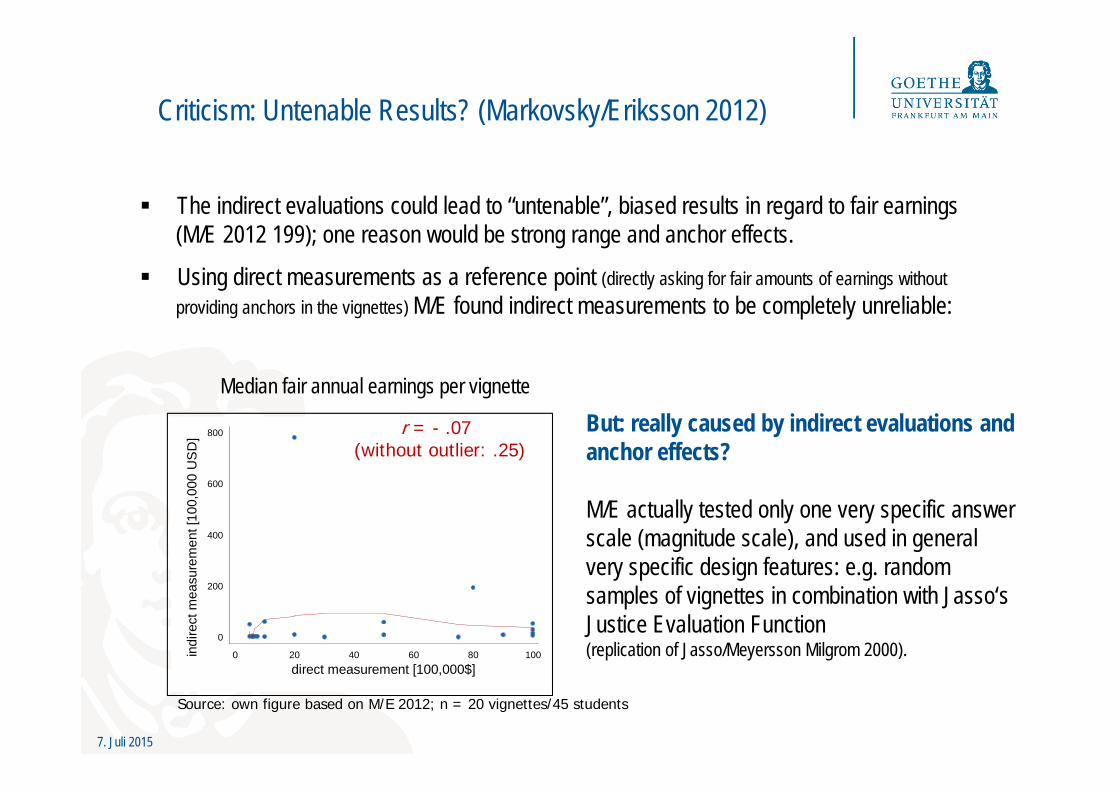
The indirect evaluations could lead to “untenable”, biased results in regard to fair earnings (M/E 2012 199); one reason would be strong range and anchor effects.
Using direct measurements as a reference point (directly asking for fair amounts of earnings without providing anchors in the vignettes) M/E found indirect measurements to be completely unreliable:
Criticism: Untenable Results? (Markovsky/Eriksson 2012)
r = - .07(without outlier: .25)
Source: own figure based on M/E 2012; n = 20 vignettes/45 students
Median fair annual earnings per vignette
But: really caused by indirect evaluations and anchor effects?
M/E actually tested only one very specific answer scale (magnitude scale), and used in general very specific design features: e.g. random samples of vignettes in combination with Jasso‘s Justice Evaluation Function (replication of Jasso/Meyersson Milgrom 2000).

7. Juli 2015
Research Project “The Factorial Survey as a Method for Measuring Attitudes in Population Surveys” (funded by the German Research Foundation, DFG 2007-2010; principal investigators: Thomas Hinz & Stefan Liebig).
Split ballot experiments focusing on more than 60 different design features. E.g., separate variation of: response scales (rating, magnitude, direct questioning for amounts) range of earnings presented in the vignettes number of dimensions and vignettes, number of levels order of vignettes and dimensions …
Several online surveys with university students (all in all > n = 2,000 students)
[Several large scale population surveys is Germany, Ukraine, Kirgizstan]
Revisiting… Research with Split Ballot Experiments

7. Juli 2015
Simply Artifacts? Construct Validity and Anchor Effects
Survey with university students, summer term 2011 (n= 89)
2x2 experimental design: Evaluation task: fairness | plausibility Range of vignette income: low | high
Respondents asked to evaluatefairness plausibility
Range of earningspresented in vignettes
500 to 10,000 € 22(438)
22(438)
750 to 15,000 €23
(460)22
(437)
Design and number of cases: respondents (vignette judgements)
7. Juli 2015
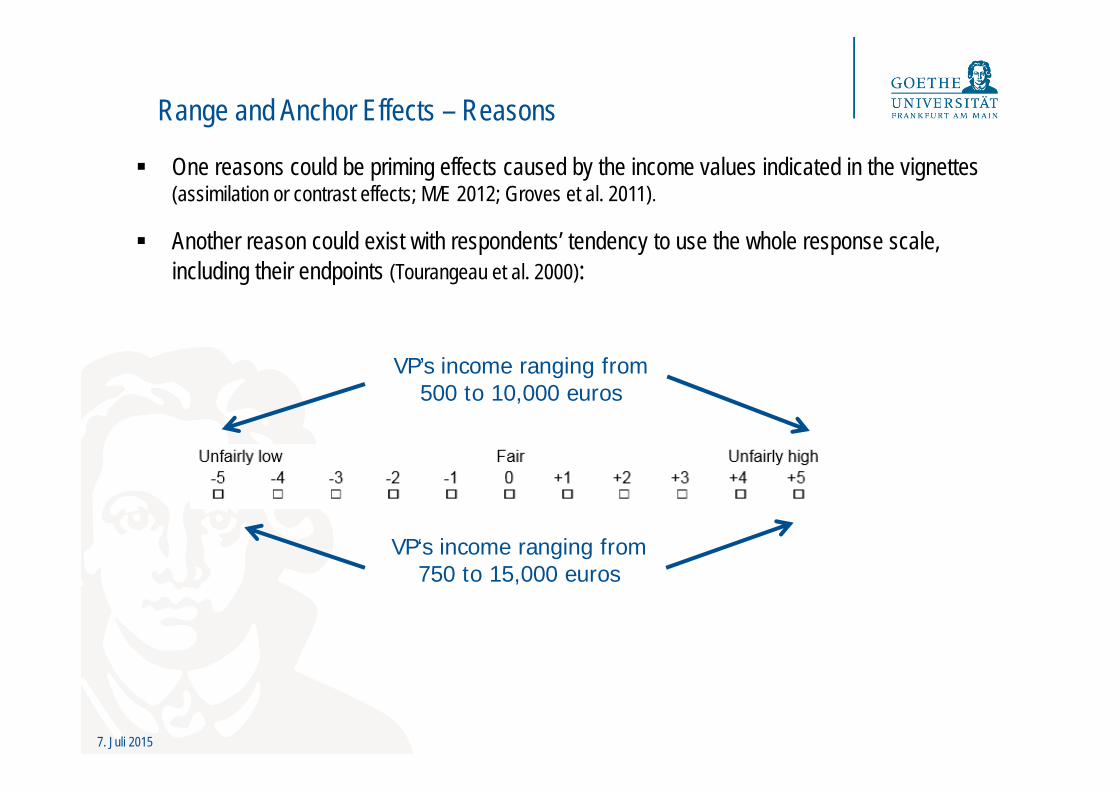
Range and Anchor Effects – Reasons
One reasons could be priming effects caused by the income values indicated in the vignettes (assimilation or contrast effects; M/E 2012; Groves et al. 2011).
Another reason could exist with respondents’ tendency to use the whole response scale, including their endpoints (Tourangeau et al. 2000):
VP‘s income ranging from 750 to 15,000 euros
VP’s income ranging from500 to 10,000 euros

7. Juli 2015
Simply Artifacts? Impact of Range (Anchors)
n= 89 respondents; n= 1773 vignette judgments.
Mean evaluations with 95%-CIs.
unfa
irly
low
fair
unfa
irly
high
just
ice
eval
uatio
n
0 5000 10000 15000income
low high
estimation with robust standard errors

7. Juli 2015
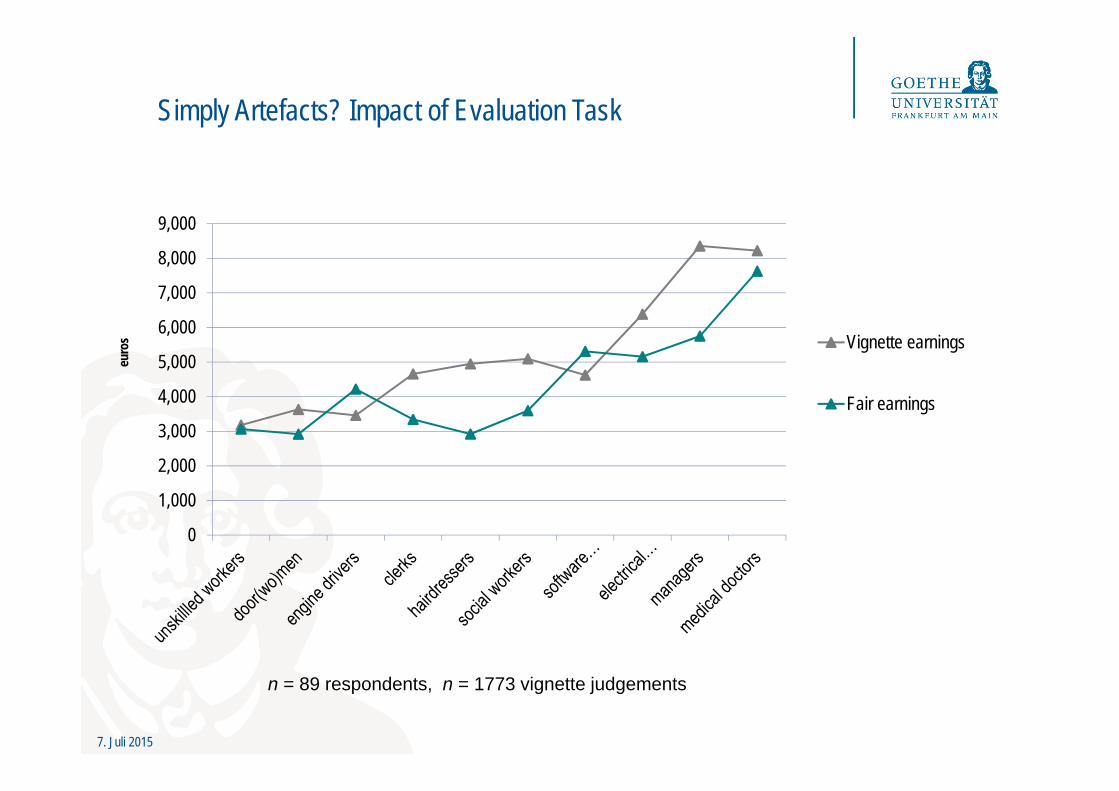
Simply Artefacts? Impact of Evaluation Task
n = 89 respondents, n = 1773 vignette judgements
0
1,000
2,000
3,000
4,000
5,000
6,000
7,000
8,000
9,000
euro
s
Vignette earnings
7. Juli 2015
Simply Artefacts? Impact of Evaluation Task
n = 89 respondents, n = 1773 vignette judgements
0
1,000
2,000
3,000
4,000
5,000
6,000
7,000
8,000
9,000
euro
s Vignette earnings
Fair earnings

7. Juli 2015
Simply Artefacts? Impact of Evaluation Task
n = 89 respondents, n = 1773 vignette judgements
0
1,000
2,000
3,000
4,000
5,000
6,000
7,000
8,000
9,000
euro
s Vignette earnings
Fair earnings
Plausible earnings
7. Juli 2015
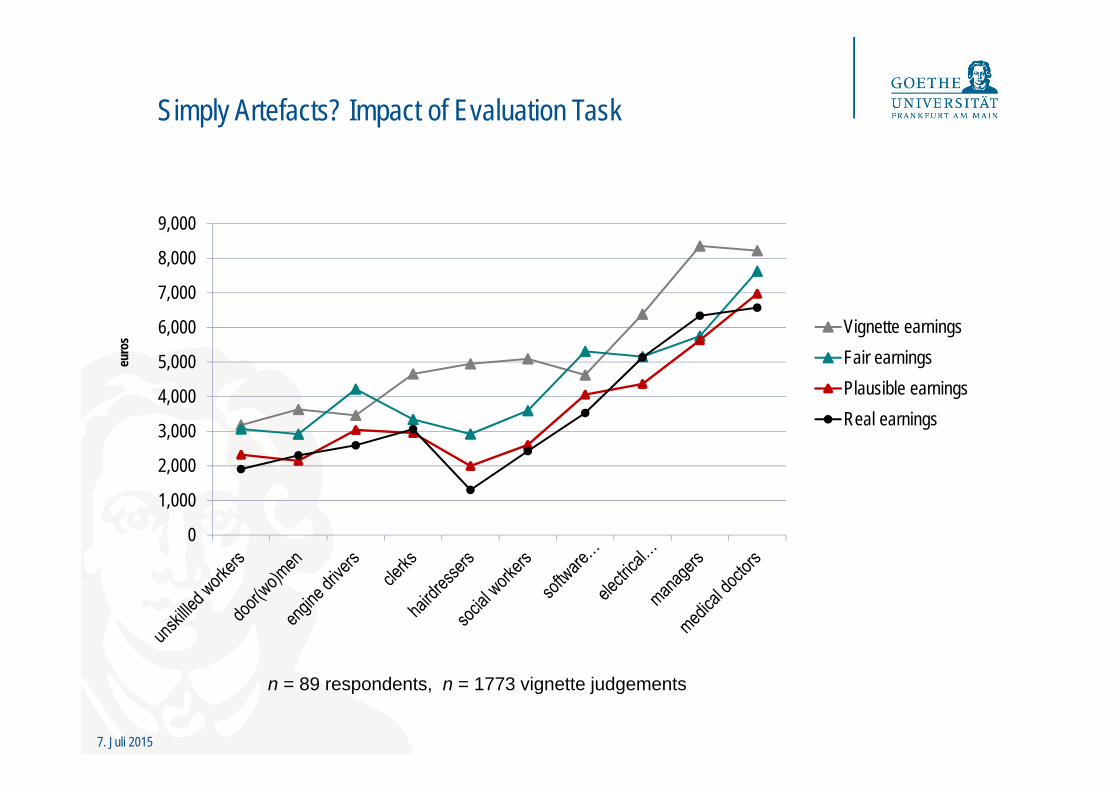
Simply Artefacts? Impact of Evaluation Task
n = 89 respondents, n = 1773 vignette judgements
0
1,000
2,000
3,000
4,000
5,000
6,000
7,000
8,000
9,000
euro
s
Vignette earningsFair earningsPlausible earningsReal earnings
7. Juli 2015
2000
3000
4000
5000
6000
7000
indi
rect
mea
sure
men
t2000 4000 6000 8000 10000 12000
direct measurement
0
200
400
600
800
indi
rect
mea
sure
men
t [10
0,00
0 U
SD
]
0 20 40 60 80 100direct measurement [100,000$]
r = - .07(without outlier: .25)
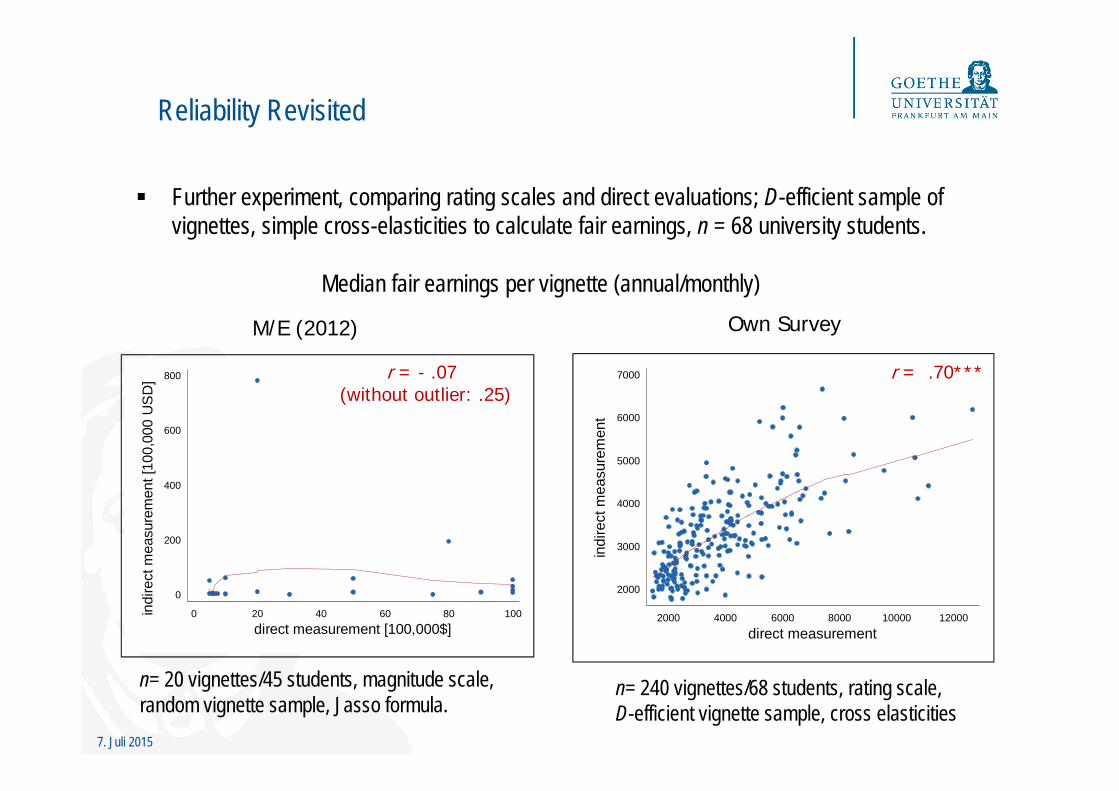
Reliability Revisited
Further experiment, comparing rating scales and direct evaluations; D-efficient sample of vignettes, simple cross-elasticities to calculate fair earnings, n = 68 university students.
M/E (2012) Own Survey
n= 20 vignettes/45 students, magnitude scale, random vignette sample, Jasso formula.
n= 240 vignettes/68 students, rating scale, D-efficient vignette sample, cross elasticities
r = .70***
Median fair earnings per vignette (annual/monthly)

7. Juli 2015
The design matters!Recommendations how to increase reliability and validity
26
7. Juli 2015
Use Standard Response Scales
27
7. Juli 2015
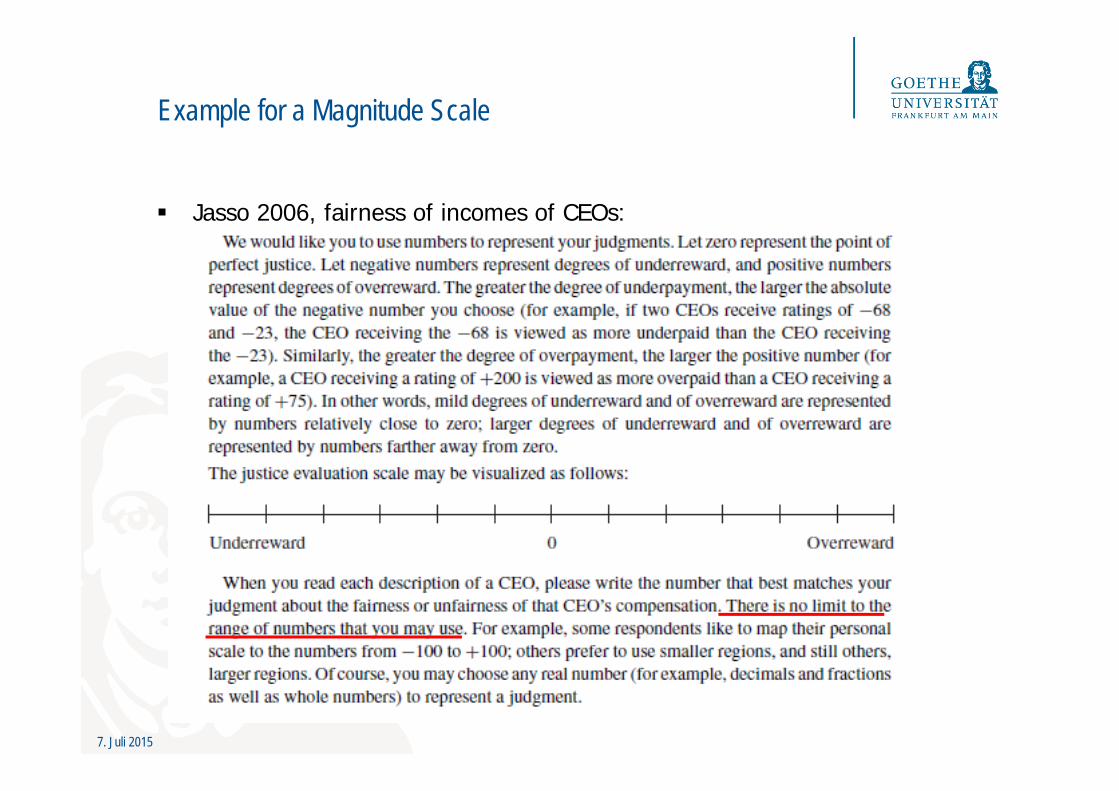
Example for a Magnitude Scale
Jasso 2006, fairness of incomes of CEOs:

7. Juli 2015
Own Survey (Split Ballot)
Experiment with n = 448 university students; online-survey; three-step answer scale (a) fair or not? b) if not: too high or too low? c) if not: which number would indicate the amount of injustice?
Respondents didn’t use magnitude scales as metric scales.
05
1015
2025
perc
ent
0 50 100 150 200
magnitude of unjusticefair unfairly paid
Source: Project „Factorial Survey Design“, student sample
7. Juli 2015
Own Survey (Split Ballot)
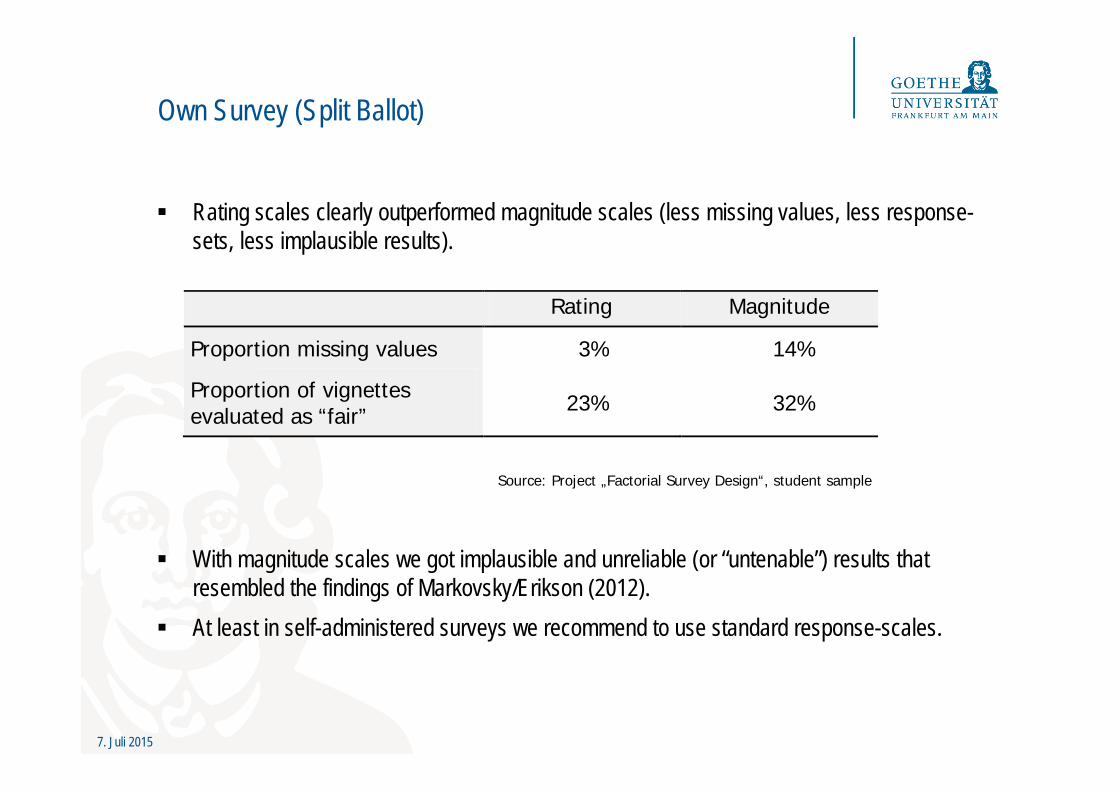
Rating scales clearly outperformed magnitude scales (less missing values, less response-sets, less implausible results).
With magnitude scales we got implausible and unreliable (or “untenable”) results that resembled the findings of Markovsky/Erikson (2012).
At least in self-administered surveys we recommend to use standard response-scales.
Rating Magnitude
Proportion missing values 3% 14%
Proportion of vignettes evaluated as “fair” 23% 32%
Source: Project „Factorial Survey Design“, student sample
7. Juli 2015
Use smart experimental designs for sampling vignettes
31

7. Juli 2015
Sampling Means Confounding
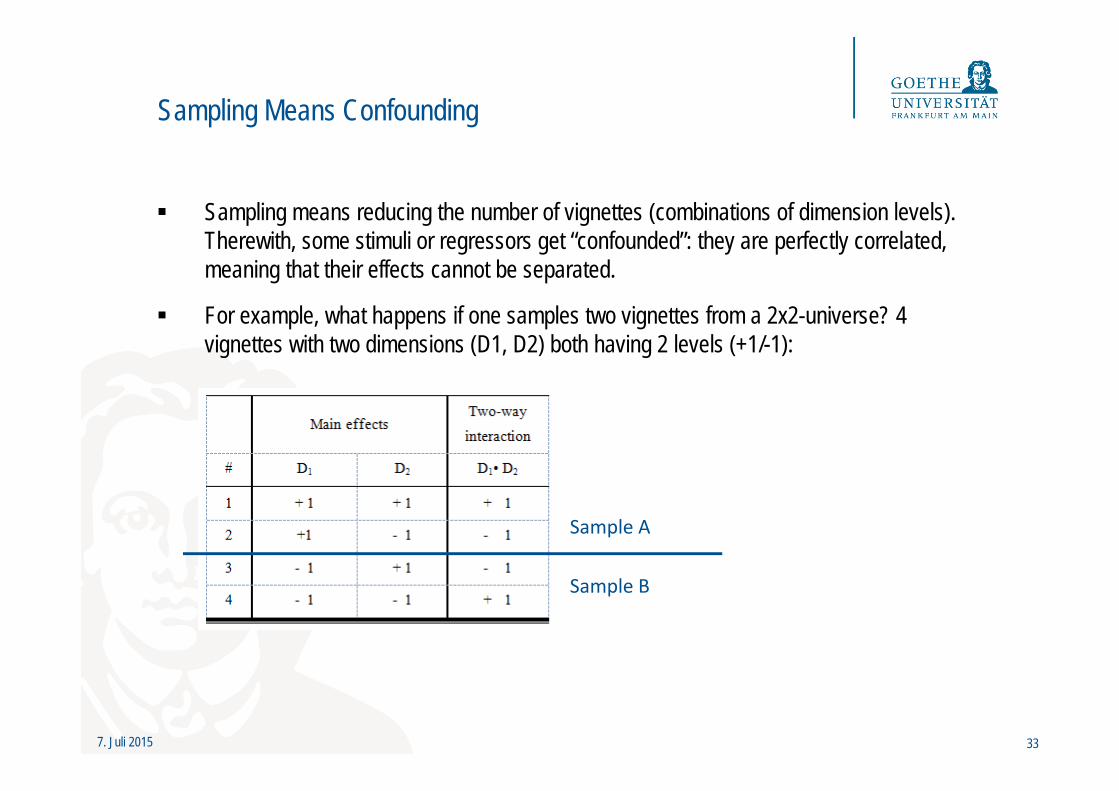
Sampling means reducing the number of vignettes (combinations of dimension levels). Therewith, some stimuli or regressors get “confounded”: they are perfectly correlated, meaning that their effects cannot be separated.
For example, what happens if one samples two vignettes from a 2x2-universe? 4 vignettes with two dimensions (D1, D2) both having 2 levels (+1/-1):
32
7. Juli 2015
Sampling Means Confounding
Sampling means reducing the number of vignettes (combinations of dimension levels). Therewith, some stimuli or regressors get “confounded”: they are perfectly correlated, meaning that their effects cannot be separated.
For example, what happens if one samples two vignettes from a 2x2-universe? 4 vignettes with two dimensions (D1, D2) both having 2 levels (+1/-1):
33
Sample A
Sample B
7. Juli 2015
Sampling Means Confounding
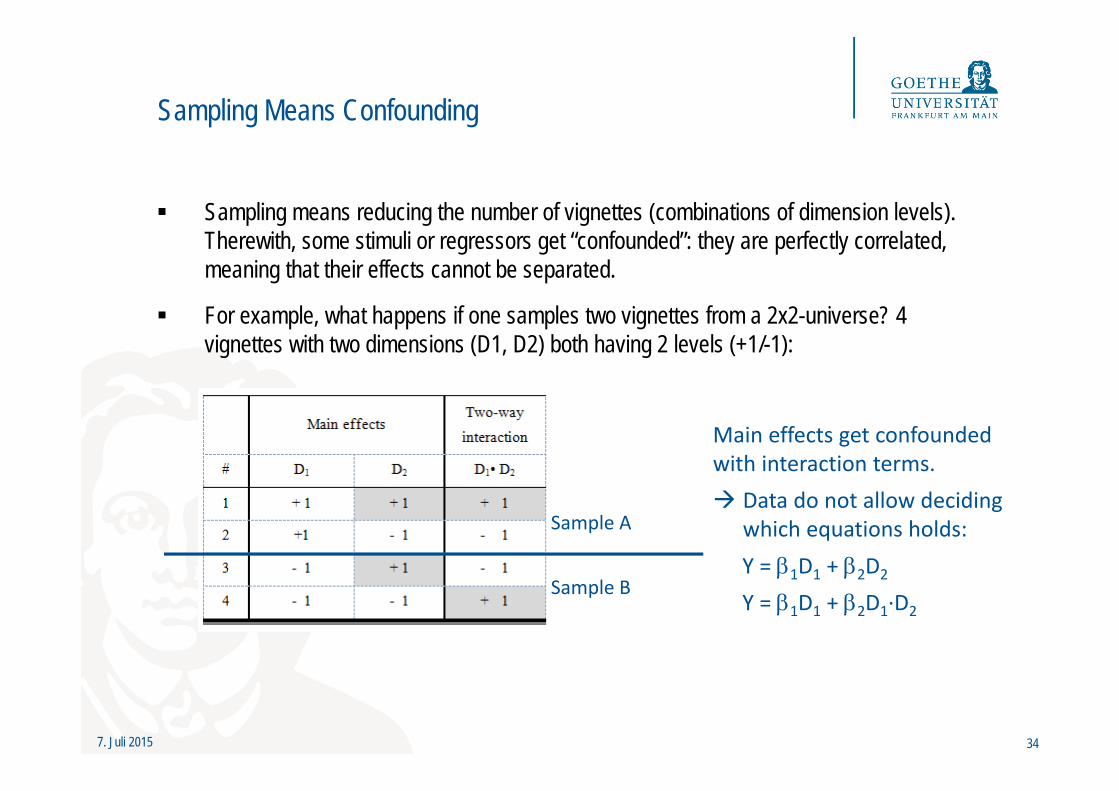
Sampling means reducing the number of vignettes (combinations of dimension levels). Therewith, some stimuli or regressors get “confounded”: they are perfectly correlated, meaning that their effects cannot be separated.
For example, what happens if one samples two vignettes from a 2x2-universe? 4 vignettes with two dimensions (D1, D2) both having 2 levels (+1/-1):
34
Sample A
Main effects get confounded with interaction terms. Data do not allow deciding
which equations holds:Y = 1D1 + 2D2
Y = 1D1 + 2D1∙D2Sample B
7. Juli 2015
Don‘t Leave Confoundings to Chance!
• With random samples one leaves confounding patterns simply to chance (Kuhfeld et al. 1994; Carson et al. 2009).
• In contrast, deliberate, fractionalized D-efficient samples allow controlling which effects get confounded.
• At the same time they allow optimizing further target criteria (like precision of parameter estimates): The higher the D-efficiency, the more precise are parameter estimates. (With one sample being x-times as efficient as another sample, one would need only about 1/x as many respondents to get the same amount of precision of parameter estimates; see also Dülmer 2007, forthocoming)
35

7. Juli 2015
Summary and Recommendations
Factorial survey experiments provide appealing possibilities for analyzing discrimination, testing theories or producing meaningful measurements such as just gender pay gaps.
But: valid results require good (experimental) designs. Based on more than 60 split-ballot experiments, we derived several recommendations (Auspurg/Hinz 2015): 1. Use standard response scales. 2. Use fractionalized, D-efficient vignette samples. 3. Use a mid-level of complexity (seven plus/minus two dimensions).4. Ensure a random allocation of vignettes and decks to respondents.5. Prevent the occurrence of many implausible vignettes.6. Consider the hierarchical data structure (cluster robust standard errors, multilevel analyses).
36
7. Juli 2015
Thank you for your attention!
Further information:
https://study.sagepub.com/auspurg_hinzhttp://www.fb03.uni-frankfurt.de/49649875/publikationen
37

7. Juli 2015
References
38
Auspurg, K./Hinz, T. (2015): Factorial Survey Experiments. Thousand Oaks: Sage.Auspurg, K./Hinz, T./Liebig, S. (2009): Complexity, learning effects and plausibility of vignettes in factorial surveys. Paper
presented at the 104th Annual Meeting of the American Sociological Association (ASA), San Francisco. Dülmer, H. (2007): Experimental Plans in Factorial Surveys: Random or Quota Design? Sociological Methods & Research
35: 382-409. Faia, M.1980. The vagaries of the vignette world: A comment on Alves and Rossi. American Journal of Sociology, 85(1),
951-954.Groves, R. M./Fowler Jr, F. J./Couper, M. P./Lepkowski, J. M./Singer, E./Tourangeau, R. (2009): Survey methodology.
Hoboken, NJ: John Wiley & Sons Homans, G. C. (1974): Social Behavior. Its elementary forms. New York: Harcourt, Brace & World.Jasso, G. (2006): Factorial survey methods for studying beliefs and judgments. Sociological Methods and Research,
34(3), 334-423.Jasso, G./Meyersson Milgrom, E. M. 2008. Distributive justice and CEO compensation. Acta Sociologica, 51(2), 123-143.Markovsky, B./Eriksson, K. (2012). Comparing direct and indirect measures of just rewards: What have we learned?
Sociological Methods and Research, 41(1), 240-245.Rossi, . H./Anderson, A. B. (1982): The Factorial Survey Approach: An Introduction. In: Rossi, Peter H./Nock, Steve L.
(Eds.): Measuring Social Judgments. The Factorial Survey Approach. Beverly Hills: 15-67. Tourangeau, R./Rips, L. J./Rasinski, K. A. (2000): The psychology of survey response. Cambridge: Cambridge University
Press.

7. Juli 2015
Appendix: Censoring of Responses? Vignette Order Effects
Does the order of vignettes influence parameter estimates? • random order vs. extreme cases first
No differences between random order vs. extreme cases first!
If ceiling effects occur: cluster robust (!) Tobit or multi-level Tobit regressions.
39
Source: own data, student sample

7. Juli 2015
Appendix: Simulations – Efficiency by Sample Size
40
With D-efficient samples much less respondents are needed for the same amount of precision of parameter estimates, and one has control which effects get confounded.
Correlations between dimensions: Are throughout lower for D-efficient samples. e.g.: Mean correlations when sampling 50
vignettes out of a universe of 432 vignettes: D-eff. : .018; random: .071
Maximum correlations when sampling 100 vignettes: D-eff. : .050; random: .190.