the utility of near-infrared spectroscopy in the ... · physiological noise from functional...
TRANSCRIPT

NeuroImage 59 (2012) 3128–3138
Contents lists available at SciVerse ScienceDirect
NeuroImage
j ourna l homepage: www.e lsev ie r .com/ locate /yn img
The utility of near-infrared spectroscopy in the regression of low-frequencyphysiological noise from functional magnetic resonance imaging data
R.J. Cooper a,⁎, Louis Gagnon a,b,c, Daniel M. Goldenholz a, David A. Boas a, Douglas N. Greve a
a Athinoula A. Martinos Center for Biomedical Imaging, Department of Radiology, Massachusetts General Hospital, Harvard Medical School, Charlestown, MA, USAb Harvard-MIT Division of Health Sciences and Technology, Cambridge, MA, USAc Department of Electrical Engineering and Computer Science, Massachusetts Institute of Technology, Cambridge, MA, USA
⁎ Corresponding author.E-mail address: [email protected] (R.J.
1053-8119/$ – see front matter © 2011 Elsevier Inc. Alldoi:10.1016/j.neuroimage.2011.11.028
a b s t r a c t
a r t i c l e i n f oArticle history:Received 18 July 2011Revised 6 October 2011Accepted 9 November 2011Available online 17 November 2011
Keywords:Near-infrared spectroscopyFunctional magnetic resonance imagingLow-frequency oscillationsResting state
Near-infrared spectroscopy (NIRS) signals have been shown to correlate with resting-state BOLD-fMRI dataacross the whole brain volume, particularly at frequencies below 0.1 Hz. While the physiological origins ofthis correlation remain unclear, its existence may have a practical application in minimizing the backgroundphysiological noise present in BOLD-fMRI recordings. We performed simultaneous, resting-state fMRI and28-channel NIRS in seven adult subjects in order to assess the utility of NIRS signals in the regression ofphysiological noise from fMRI data. We calculated the variance of the residual error in a general linearmodel of the baseline fMRI signal, and the reduction of this variance achieved by including NIRS signalsin the model. In addition, we introduced a sequence of simulated hemodynamic response functions(HRFs) into the resting-state fMRI data of each subject in order to quantify the effectiveness of NIRS signalsin optimizing the recovery of that HRF. For comparison, these calculations were also performed using apulse and respiration RETROICOR model. Our results show that the use of 10 or more NIRS channels can reducevariance in the residual error by asmuch as 36% on average across the whole cortex. However the same numberof low-pass filtered white noise regressors is shown to produce a reduction of 19%. The RETROICOR modelobtained a variance reduction of 6.4%. Our HRF simulation showed that the mean-squared error (MSE) betweenthe recovered and trueHRFs is reducedby 21% on averagewhen 10NIRS channels are applied and by introducingan optimized time lag between the NIRS and fMRI time series, a single NIRS channel can provide an averageMSEreduction of 14%. The RETROICOR model did not provide a significant change in MSE. By each of the metricscalculated, NIRS recording is shown to be of significant benefit to the regression of low-frequency physiologicalnoise from fMRI data.
© 2011 Elsevier Inc. All rights reserved.
Introduction
Near-infrared spectroscopy (NIRS) uses variations in the absorp-tion of near-infrared light to infer changes in the concentration ofoxyhemoglobin (HbO) and deoxyhemoglobin (HbR) in the cerebralcortex (Franceschini and Boas, 2004; Gibson et al., 2005; Obrig andVillringer, 2003). The most common applications of NIRS employ aback-reflection geometry, such that both the source and detector ofthe near-infrared light are positioned on the same surface (Villringeret al., 1993). This geometry is usually necessary to ensure that anadequate amount of light can reach both the brain and then the detec-tor, but it renders NIRS measurements highly sensitive to backgroundhemodynamic oscillations in superficial tissues. These oscillations, dueto heart rate, respiration and a variety of low-frequency effects, formthe background physiological noise through which changes in cortical
Cooper).
rights reserved.
HbO and HbR must be identified (Diamond et al., 2006; Lina et al.,2008; Prince et al., 2003).
The blood oxygen level dependent (BOLD) signal of functionalmagnetic resonance imaging (fMRI) occurs because of variations inthe local concentration of the paramagnetic deoxyhemoglobinmolecule(Huettel et al., 2004). As it is a hemodynamic measurement, BOLD-fMRIis also highly sensitive to background physiological oscillations anddespite the autoregulatory actions of the brain, the effects of heartrate, respiration rate and low-frequency hemodynamic oscillationsare often present in fMRI data (Hu et al., 1995).
A number of simultaneous NIRS and fMRI experiments have beenperformed in the study of functional activation (Huppert et al., 2006;Steinbrink et al., 2006; Strangman et al., 2002; Toronov et al., 2001).These studies have sought to investigate the relationship betweenthe functional NIRS and BOLD signals in common regions of the brain,and have shown that there is a good correlation between the NIRS-recorded functional HbR response and the local BOLD signal. Recentstudies have begun to investigate the relationship between NIRS andfMRI-BOLD during the resting state, i.e. when no stimulation paradigmis applied. Preliminary work by our group (Greve et al., 2009) and

3129R.J. Cooper et al. / NeuroImage 59 (2012) 3128–3138
studies by Tong et al. (Tong and Frederick, 2010; Tong et al., 2011)have described a significant correlation between NIRS signals andBOLD-fMRI data across the whole brain volume during the restingstate. A NIRS signal, obtained using sources and detectors placedon the scalp, appears to not only correlate with the BOLD signal presentin the cortical voxels to which it is directly sensitive, but also to theBOLD signal of a large number of voxels spread throughout the brain.These resting-state correlations are particularly apparent at frequenciesbelow 0.1 Hz (Greve et al., 2009; Tong and Frederick, 2010).
Tong and Frederick (2010) presented compelling evidence thatthe correlation which exists between resting-state NIRS and BOLD-fMRI is dominated by systemic oscillations in blood pressure whichtraverse the cerebral vasculature, rather than being suggestive ofresting-state neural connectivity (Biswal et al., 1995). Systemichemodynamic oscillations at 0.1 Hz and below are common to NIRSand BOLD-fMRI recordings and are thought to have two main sources;the variations in local vascular dilation known as vaso-motion(Gustafsson, 1993) and oscillations in arterial blood pressure known asMayer waves (Julien, 2006). Although it was not explicitly proven,Tong and Frederick (2010) suggested that the component of the NIRSsignal which correlates with BOLD-fMRI across the brain is primarilythat derived from superficial tissues (i.e. the scalp) and not from thebrain. While it is beyond doubt that NIRS signals contain a significantcontribution from the cerebral cortex (and that this contribution willcorrelate with the local fMRI voxels), this contribution is invariablysmaller than that of the superficial tissues (Boas et al., 2004; Obrigand Villringer, 2003). The dominance of superficial hemodynamicoscillations is partly what necessitates the detailed signal analysisand averaging common to functional NIRS experiments.
Irrelevant of its origin, the existence of a correlation between NIRSand fMRI-BOLD in the absence of stimulation has an obvious potentialapplication: the minimization of physiological noise in fMRI experi-ments. The BOLD hemodynamic response function (HRF) typicallyprovides a peak signal change of between 1 and 5% (Buxton et al., 1998;Friston et al., 2000), which can be significantly less than the level ofphysiological noise in the BOLD-fMRI signal. In order to maximize theefficiency with which the HRF can be recovered, fMRI experimentstypically consist of carefully designed paradigms of stimulus repetition(Dale, 1999; Friston et al., 1999). The reliable identification of thephysiological noise present in the BOLD signal allows for an increasein signal-to-noise ratio for a given experimental paradigm, or can allowthe same signal-to-noise ratio to be achieved using fewer stimulations,minimizing the necessary duration of the fMRI scan. This goal is notinsignificant, as fMRI experiments often require a subject to remainstationary in the scanner for periods of over an hour (Huettel et al.,2004). In addition to being expensive, this can cause serious discomfortand makes fMRI experiments less suitable for vulnerable subjectgroups.
A common approach to the minimization of fMRI physiologicalnoise involves the distal measurement of hemodynamic oscillationsand associated factors with a view to including these measurementsin the linear model of the BOLD-fMRI signal. When applied in thisway, such measurements are referred to as ‘nuisance regressors’.Measurements of heart rate and heart rate variability (Bianciardi etal., 2009; Chang et al., 2009; Glover et al., 2000) respiration rate andrespiration rate variability (Birn et al., 2006, 2008) and end-tidal carbondioxide (Chang and Glover, 2009; Wise et al., 2004) have all beeninvestigated as nuisance regressors. The most commonly appliednuisance regression technique is known as RETROspective ImageCORrection (RETROICOR) (Glover et al., 2000). This approach usesdistal measurements of pulse rate (via a pulse oximeter) and respiration(via a pneumatic chest belt) to enable an image-based correction ofrespiration and pulsatile oscillations in the BOLD signal.
For this study, we acquired simultaneous, resting-state fMRI and28-channel NIRS in seven healthy adults in order to thoroughly assessthe utility of NIRS signals as fMRI nuisance regressors. We calculate
the variance of the residual error in a general linear model of thebaseline fMRI signal, and calculate the reduction in this variancethat can be obtained by employing NIRS signals to regress out low-frequency physiological noise. To provide a more rigorous assessment,we simulate an event-related fMRI paradigm by introducing a seriesof synthetic HRFs into the resting-state fMRI data of our seven subjectsin order to explicitly quantify the utility of NIRS in the recovery of theHRF using a finite impulse response (FIR) model (Burock and Dale,2000). In both cases, we compare each NIRS model with a modelcontaining both pulse and respiration RETROICOR regressors. Wealso asses the utility of a single NIRS channel in groups of voxelswith different NIRS–fMRI correlation in order to quantify the successof a given NIRS regressor in terms of the baseline correlation between itand the BOLD-fMRI volume. Finally, we attempt to optimize the recoveryof the HRF using a single NIRS channel by introducing a voxel-specifictime lag between the NIRS and BOLD-fMRI time series.
Methods
Subjects and data acquisition
Seven healthy adult subjectswere recruited to this study,whichwasapproved by the Institutional Review Board of Massachusetts GeneralHospital. Each subject provided written, informed consent and under-went a single scanning session consisting of three resting-state runslasting 300 s.
Near-infrared spectroscopy was performed using a bilaterallysymmetric 28-channel probe and the TechEn CW6 continuous waveNIRS system operating at 690 and 830 nm, with a sample rate of 25 Hz(Franceschini et al., 2006). The NIRS probe covers a large proportion ofthe frontal and temporal lobes and is shown in position in Fig. 1.
AllMRI datawere acquired using a Siemens Tim Trio 3T system. Priorto functional imaging, an anatomical MRI was obtained using an MP-RAGE imaging sequence (TR=2530ms, TI=1100 ms, TE=3.44 ms).Functional MRI was performed using the Functional Biomedical Infor-matics Research Network protocol (fBIRN, www.birncommunity.org)(Greve et al., 2011) such that TR=2 s, flip angle=77°, TE=30ms,number of slices=30, echo spacing=500 ms, with posterior–anteriorphase encoding and a bandwidth of 2290 Hz/pixel. The in-plane resolu-tion was 3.43 mmwith a slice thickness of 5 mmwith a 1 mm skip andaxial slices approximately aligned with the AC–PC line. Each functionalrun provided an fMRI time course of 150 data points. The scanner trig-ger pulse was acquired to allow the synchronization of the NIRS andfMRI recordings.
Cardiac and respiration waveforms were measured for all subjectsusing a pulse oximeter and either a pressure monitor or stress gaugeattached to the chest with an elastic belt. Both acquisitions weresampled at 25 Hz.
NIRS pre-processing
The changes in optical density recorded at each of the 28 channelswere converted to changes in concentration of HbO and HbR usingthe modified Beer–Lambert relationship, with a path length correc-tion factor of 6 and a partial volume correction factor of 50 (Boas etal., 2004; Huppert et al., 2006) . A NIRS channel was excluded fromsubsequent processing if the baseline detected intensity of eitherwavelength was below or above the acceptable range of the system(40 to 70 dB respectively) or if the channel was determined to beexcessively noisy on visual inspection. Previous work has shown thatNIRS–fMRI correlations are dominated by low-frequency components(Greve et al., 2009; Tong and Frederick, 2010). As a result our HbOand HbR waveforms were low-pass filtered at 0.1 Hz (Butterworth,5th order) before being synchronized to the fMRI trigger pulse anddown-sampled to the fMRI sample rate of 0.5 Hz. If no channels were

Fig. 1. The 28-channel NIRS array is shown in position on one subject in panel a. Panel b shows the schematic arrangement of the array.
3130 R.J. Cooper et al. / NeuroImage 59 (2012) 3128–3138
rejected, this process would produce 56 time series (28 for HbO and 28for HbR), each with 150 data points.
fMRI pre-processing
All fMRI scans were motion corrected to the middle time pointusing the AFNI 3dvolreg program (Cox and Jesmanowicz, 1999).Non-brain voxels were masked out using the FSL Brain Extraction Tool(Smith, 2002). Anatomical images were analyzed using FreeSurfer(surfer.nmr.mgh.harvard.edu) (Dale et al., 1999; Fischl et al., 1999)to construct models of the cortical surface of each individual. EachfMRI time series was smoothed using a 5 mm full-width at half-maximum Gaussian in the 3D volume. The middle time point ofeach run was registered to the subject's anatomical image using theFreeSurfer bbregister program (Greve and Fischl, 2009) whichallowed the subject-specific cortical mask to be mapped into thefunctional image space. All reported results are from cortical graymatter.
RETROICOR processing
Pulsatile and respiration regressors were created using the RETRO-spective Image CORrection (RETROICOR) approach (Glover et al., 2000).Pulse and respiration waveforms were modeled using a fundamentaland first harmonic sine and cosine function to produce 4 regressorsfor pulse and 4 for respiration. These regressor waveforms weredown-sampled to the fMRI acquisition rate on a slice-specific basis, soas to compensate for the finite delay between the acquisition of consec-utive slices (Jones et al., 2008). The pulse oximetry data of one run inone subject was rejected due to a recording error. In this case onlythe 4 respiration RETROICOR regressors were used in furtherprocessing.
Linear models and error variance reduction
To assess the utility of NIRS regression of physiological noise, weconstructed a number of linear models of the resting-state fMRI signal.All regression analyses were performed using FreeSurfer (surfer.nmr.mgh.harvard.edu) and bespoke Matlab (The Mathworks Inc.) softwarefunctions. The first linear model consisted of 3 regressors correspondingto the 0th, 1st and 2nd order temporal drift polynomials and a fur-ther 6 regressors constructed from motion correction parameters.This ‘reference’ model is used as a comparison throughout, and formsthe basis of all other models.
A slice-specific RETROICOR model was computed by augmentingthe reference model with all 4 pulse and all 4 respiration RETROICOR
waveforms for each slice as defined above. The regressionwas performedon a slice-specific basis and the results averaged across all corticalvoxels.
The NIRS models were computed by adding one or more of thedown-sampled NIRS signals to the reference model. The NIRS modelsare separated into ‘HbO models’ (those containing one or more HbOregressors), ‘HbR models’ (those containing one or more HbR regres-sors) and ‘HbO & HbR models’ (those containing both the HbO andHbR regressors from one or more NIRS channels). To provide a simplemetric of the efficacy of NIRS modelling of resting-state fMRI timeseries, we computed the variance of the residual error of eachmodel and compared it to that of the reference model. The largerthe reduction in variance the better the model of the fMRI time series(a percentage variance reduction (PVR) of 100%, indicates thatthe model is able to remove all the variance in the fMRI time seriesunaccounted for by the reference model). The PVR achieved by theRETROICOR model was also calculated. A general linear model (GLM)of the fMRI time series (Y), with design matrix (X) has a residual error(ε) given by:
ε ¼ Y−Xβ̂ ð1Þ
where β̂ is the vector of parameter estimates calculated via:
β̂ ¼ X0X� �−1X0Y ð2Þ
The residual variance is given by:
var εð Þ ¼ εTεd
ð3Þ
where d is an estimate of themodel's degrees of freedomand is a functionof the number of regressors included in themodel. As themodel is altered(for example by adding regressors to the design matrix, X), the residualvariance (var(ε))will change depending on howwell themodel accountsfor data. Note that the variance does not necessarily decrease withthe addition of regressors to the linear model.
HRF simulation
To further quantify the utility of NIRS regressors in the removal ofphysiological noise, and therefore the improved recovery of a functionalresponse, we introduced a series of simulated HRFs into the resting-statefMRI time series of each data set. We produced a simple HRF using asingle-gamma function (Fig. 7) with a peak latency of 6 s, down-sampled to match TR and scaled to provide a 2% peak increase in the

3131R.J. Cooper et al. / NeuroImage 59 (2012) 3128–3138
BOLD signal of each relevant voxel. A ‘stimulus paradigm’ of ten HRFswas introduced into each 300-second run in an event-related fashion.To increase the reliability of our results, 30 different stimulus paradigmswere used in which each inter-HRF-interval was a randomly selectedperiod between 2 and 24 s. For each stimulus paradigm, subject, runand linear model, the HRF was estimated using a finite impulse responseapproach. For comparison, this process was also performed for theRETROICOR model. The HRF recovered by each model was comparedto the true HRF time series using two metrics: the mean-squarederror (MSE) and Pearson's correlation coefficient (R2). Within thecontext of the GLM, the MSE is given by:
MSE ¼ var εð Þξ
ð4Þ
where the efficiency of the model (ξ) is:
ξ ¼ 1
trace C X0X
� �−1C0
� � ð5Þ
and C is the contrast matrix pertaining to the HRF (Dale, 1999). Thevalue of the MSE achieved by a given model is thus dependent onboth the residual variance and the efficiency of that model.
As the correlation between a given NIRS channel and the fMRI signalwill vary significantly across the fMRI volume (Tong and Frederick,2010), the selection of specific regions of interest in which to applythe simulated functional response so as to best test the use of NIRSsignals as nuisance regressors is not trivial. To estimate the averageeffect of NIRS regression, the simulated HRFs were first added to(and recovered from) the BOLD time series of every cortical voxel,without any consideration for the correlation between the NIRS signalsand the fMRI volume.
Selected voxels and optimized time lag
This simulation was repeated for models containing only a singleNIRS regressor in groups of 100 voxels selected on the basis of thevalue of the correlation between the fMRI time series and each NIRSregressor. This process was performed in order to quantify the successof a given NIRS regressor with respect to the value of the baseline corre-lation between it and the BOLD-fMRI volume. The baseline correlation isdenoted Rbase
2 to distinguish it from the correlation between syntheticand recoveredHRFs (R2).We calculated Rbase
2 using the fMRI time seriesprior to the introduction of the simulated HRF in order to minimizecomputational expense. Three groups of 100 voxels, with Rbase
2 in therange 0–0.1, 0.1–0.2 and 0.2–0.3, were selected for each subject, runand HbO or HbR signal.
The results of Tong and Frederick (2010) suggest that the NIRS–fMRI correlation traverses the cerebral vasculature in a wave-likepattern. In an attempt to take advantage of this phenomenon, theHRF simulation was also performed across the whole cortex usingmodels containing a single NIRS regressor, but with a voxel-specifictime lag introduced between that NIRS regressor and the fMRI timeseries. Because the NIRS recording time for each run exceeded thatof the fMRI (NIRS recording began ~30 s prior to the fMRI sequenceand continued for~30 s after) we were able to shift the NIRS signalsin time relative to the fMRI recording. We produced 20 differenttime lags, from −10 to+10 s in 1-second intervals, relative to thefMRI time series for every HbO and HbR signal. For every corticalvoxel, HbO signal, HbR signal and for every run,wewere able to computethe time lag which optimized the baseline correlation (Rbase
2 ). A voxeland NIRS signal specific linear model was then used to recover thesimulated HRF at each voxel using this optimumtime lag, and the resultswere averaged across the cortex.
Synthetic NIRS signals
Near-infrared spectroscopy signals will always contain some noisecontribution from non-physiological sources. When the NIRS signalsare low-pass filtered, this noise is also low-pass filtered. When suchwaveforms are used in the general linear model, it is possible thatthey could provide a good model of resting-state fMRI oscillationssimply because the constituent noise spans the frequency space below0.1 Hz. The use of NIRS regressors could therefore produce a significantreduction in fMRI noise that is not related to the physiological measure-ments of HbO andHbR. To account for this possibility, our calculations ofvariance reduction and our HRF simulations were all repeated usingsynthetic NIRS data. These waveforms were obtained by producingtwo random vectors and passing them through the entire processingstream, including the Beer–Lambert transformation and low-pass filter-ing. This is effectively equivalent to repeating all our processing underthe null hypothesis that there is no relationship between HbO, HbRand the BOLD signal.
Results
The average proportion of the cortex found to be significantly cor-related with a givenNIRS regressor (using a two-tailed, voxel-wise t-test,pb0.01) was 17.8% for HbR signals and 16.8% for HbO signals, withsubject means ranging from 5 to 22%. Subject 6 showed very littlecorrelation despite there being no obvious issues with either the NIRSor fMRI recordings. Fig. 2 shows an example of a significance map fora single, well-correlated HbO regressor. The average proportion of thecortex significantly correlated with the synthetic NIRS signals was 3.7%.
Whole-cortex variance reduction
The percentage variance reduction (PVR) was computed for theHbO, HbR, HbO & HbR, RETROICOR and synthetic NIRS models. Theresults of this process are shown in Fig. 3a as a function of the numberof NIRS channels (n) in each linear model.
Each data point in Fig. 3a corresponds to the mean PVR achievedover the whole cortex and averaged over all runs and either everypossible combination of n channels or 28 random combinations of nchannels, whichever is smaller. For example, the HbO data point cor-responding to 1 NIRS channel is the average PVR obtained acrossevery possible model containing a single HbO regressor (if no chan-nels were excluded, there would be 28 possible models), for eachsubject and run. For the HbO data point corresponding to 2 NIRSchannels, 28 pairs of non-excluded HbO regressors were randomlyselected, and the average PVR achieved by those pairs of regressorsis presented. The upper limit on the number of random combinationswas set at 28, as it was computationally prohibitive to use every possiblemodel in most cases (for example, 28 choose 2=378 possible models).This process was performed in order to minimize the sensitivity of theresults to channel selection. This same process was applied to obtainthe HbR model PVR results in Fig. 3. For the HbO & HbR models, 1NIRS channel corresponds to 2 regressors (the HbO and HbR regressorscorresponding to each singleNIRS channel), 2NIRS channels correspondsto 4 regressors and so on. This randomized selection approach was alsoapplied for the whole-cortex HRF simulation results below.
As shown in Fig. 3a, the PVR increases with the addition of NIRSregressors for all models until 15 NIRS channels are applied, atwhich point the PVR is equal to 36% for the HbO & HbR model. ThePVR is significantly larger than zero for all models (one-tail t-test,pb0.01). The addition of the slice-specific respiration and pulseRETROICOR regressors to the referencemodel also produces a significantreduction in variance, averaging 6.4%. The PVR achieved by the HbO &HbR model becomes significantly larger than that of the RETROICORmodel when 2 NIRS channels are applied (one-tail, paired t-test,pb0.01). It is worth noting that the use of 8 synthetic NIRS regressors

Fig. 2. An example of the significance map for a single subject, run and NIRS-HbO regressor. Note that significantly correlated voxels are spread throughout the cortex as well as indeeper regions of the brain.
3132 R.J. Cooper et al. / NeuroImage 59 (2012) 3128–3138
(the same number of regressors used in the RETROICORmodel) producesan average PVR of 4.7%.
Fig. 3b shows the corrected PVR, achieved by subtraction of thevariance reduction calculated using the synthetic NIRS waveforms.This provides a lower-bound estimate of the average PVR attributableto each NIRS model. A peak value of 17.0% is achieved for the HbO &HbR model incorporating 9 NIRS channels. The PVR remains signifi-cantly larger than zero for all models after subtraction of the syntheticNIRS results (one-tail t-test, pb0.01).
Whole-cortex HRF simulation
Fig. 4a shows the average mean-squared error (MSE) between thesynthetic and recovered HRFs for HbO, HbR, HbO & HbR, RETROICORand the synthetic HbO & HbR models (synthetic HbO and syntheticHbRmodels were also calculated but for simplicity are not displayed).
Fig. 3. The percentage variance reduction obtained by the HbO, HbR and HbO & HbR modelPVR are obtained in comparison to the reference model. The corresponding results for the pPVR values, which were obtained by subtracting the PVR achieved using synthetic NIRS regreto which the variance of the BOLD-fMRI signal can be modeled by the physiological contenmodel) represent the standard deviation across all runs.
These data are normalized to the value obtained using the referencemodel (i.e. that without NIRS regressors) and are shown as a functionof the number of NIRS channels applied (n). For each NIRS model,either all possible combinations, or 28 combinations of nNIRS channelswere randomly selected and the results provided are an average of allcombinations, as described above for Fig. 3. The MSE decreases withthe addition of NIRS regressors for HbO, HbR and HbO & HbR models.This decrease reaches significance (one-tail paired t-test, pb0.01)with the use of a single NIRS channel for the HbO & HbR model andwith the use of 2 NIRS channels for both the HbO and HbR models.The minimum, equal to reduction of 21%, is found for the HbO & HbRmodel when 10 NIRS channels are applied.
The slice-specific RETROICOR results are highly variable but on aver-age the RETROICORmodel fails to reduce theMSE between the syntheticand recovered HRFs, and results in an average increase in MSE of 0.1%(standard deviation of 14%) compared to the reference model.
s as a function of the number of NIRS channels incorporated into each model. Values ofulse and respiration RETROICOR model are also included. Panel b shows the correctedssors from that of the real NIRS regressors. These corrected results represent the extentt of the NIRS data. In each figure the error bars (and shaded region for the RETROICOR
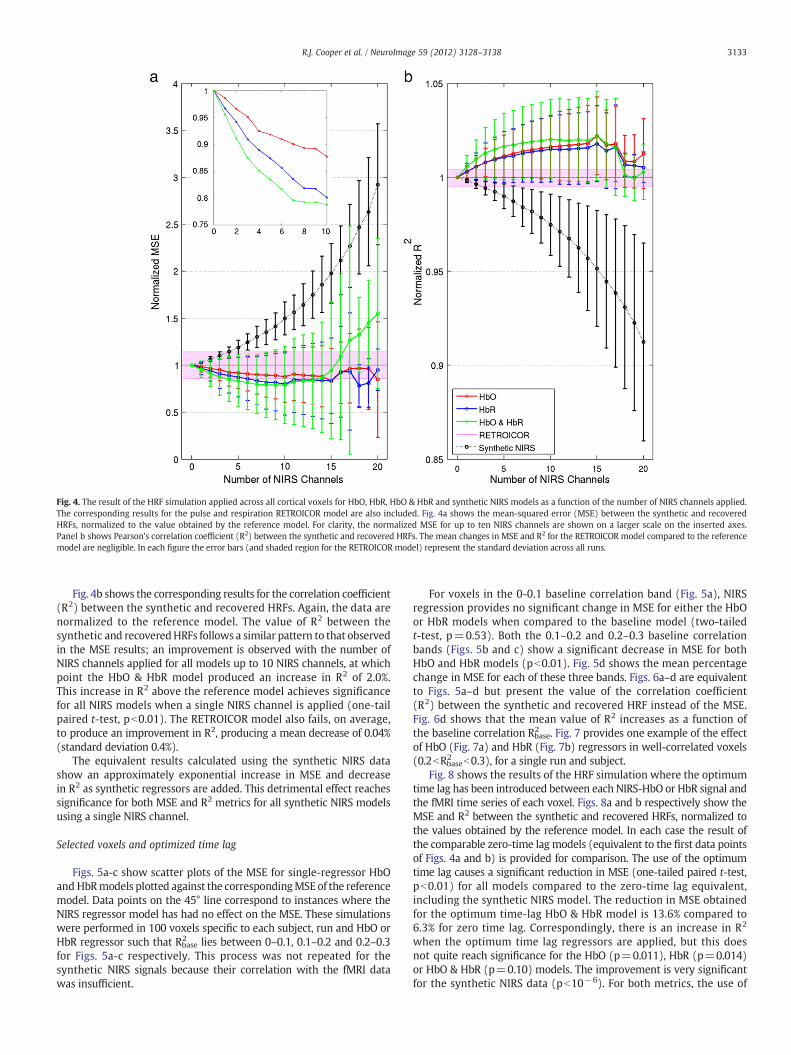
Fig. 4. The result of the HRF simulation applied across all cortical voxels for HbO, HbR, HbO & HbR and synthetic NIRS models as a function of the number of NIRS channels applied.The corresponding results for the pulse and respiration RETROICOR model are also included. Fig. 4a shows the mean-squared error (MSE) between the synthetic and recoveredHRFs, normalized to the value obtained by the reference model. For clarity, the normalized MSE for up to ten NIRS channels are shown on a larger scale on the inserted axes.Panel b shows Pearson's correlation coefficient (R2) between the synthetic and recovered HRFs. The mean changes in MSE and R2 for the RETROICOR model compared to the referencemodel are negligible. In each figure the error bars (and shaded region for the RETROICOR model) represent the standard deviation across all runs.
3133R.J. Cooper et al. / NeuroImage 59 (2012) 3128–3138
Fig. 4b shows the corresponding results for the correlation coefficient(R2) between the synthetic and recovered HRFs. Again, the data arenormalized to the reference model. The value of R2 between thesynthetic and recoveredHRFs follows a similar pattern to that observedin the MSE results; an improvement is observed with the number ofNIRS channels applied for all models up to 10 NIRS channels, at whichpoint the HbO & HbR model produced an increase in R2 of 2.0%.This increase in R2 above the reference model achieves significancefor all NIRS models when a single NIRS channel is applied (one-tailpaired t-test, pb0.01). The RETROICOR model also fails, on average,to produce an improvement in R2, producing a mean decrease of 0.04%(standard deviation 0.4%).
The equivalent results calculated using the synthetic NIRS datashow an approximately exponential increase in MSE and decreasein R2 as synthetic regressors are added. This detrimental effect reachessignificance for both MSE and R2 metrics for all synthetic NIRS modelsusing a single NIRS channel.
Selected voxels and optimized time lag
Figs. 5a-c show scatter plots of the MSE for single-regressor HbOand HbRmodels plotted against the correspondingMSEof the referencemodel. Data points on the 45° line correspond to instances where theNIRS regressor model has had no effect on the MSE. These simulationswere performed in 100 voxels specific to each subject, run and HbO orHbR regressor such that Rbase
2 lies between 0–0.1, 0.1–0.2 and 0.2–0.3for Figs. 5a-c respectively. This process was not repeated for thesynthetic NIRS signals because their correlation with the fMRI datawas insufficient.
For voxels in the 0-0.1 baseline correlation band (Fig. 5a), NIRSregression provides no significant change in MSE for either the HbOor HbR models when compared to the baseline model (two-tailedt-test, p=0.53). Both the 0.1–0.2 and 0.2–0.3 baseline correlationbands (Figs. 5b and c) show a significant decrease in MSE for bothHbO and HbR models (pb0.01). Fig. 5d shows the mean percentagechange in MSE for each of these three bands. Figs. 6a–d are equivalentto Figs. 5a–d but present the value of the correlation coefficient(R2) between the synthetic and recovered HRF instead of the MSE.Fig. 6d shows that the mean value of R2 increases as a function ofthe baseline correlation Rbase
2 . Fig. 7 provides one example of the effectof HbO (Fig. 7a) and HbR (Fig. 7b) regressors in well-correlated voxels(0.2bRbase
2 b0.3), for a single run and subject.Fig. 8 shows the results of the HRF simulation where the optimum
time lag has been introduced between each NIRS-HbO or HbR signal andthe fMRI time series of each voxel. Figs. 8a and b respectively show theMSE and R2 between the synthetic and recovered HRFs, normalized tothe values obtained by the reference model. In each case the result ofthe comparable zero-time lagmodels (equivalent to the first data pointsof Figs. 4a and b) is provided for comparison. The use of the optimumtime lag causes a significant reduction in MSE (one-tailed paired t-test,pb0.01) for all models compared to the zero-time lag equivalent,including the synthetic NIRS model. The reduction in MSE obtainedfor the optimum time-lag HbO & HbR model is 13.6% compared to6.3% for zero time lag. Correspondingly, there is an increase in R2
when the optimum time lag regressors are applied, but this doesnot quite reach significance for the HbO (p=0.011), HbR (p=0.014)or HbO & HbR (p=0.10) models. The improvement is very significantfor the synthetic NIRS data (pb10−6). For both metrics, the use of

Fig. 5. The single-regressor NIRS model MSE plotted against the reference model MSE for 100 voxels selected using the value of the baseline NIRS–fMRI correlation for each voxel.The data is separated into three bands on the basis of Rbase
2 . The average reduction in MSE for all data points is shown in panel d. The MSE between the synthetic and recovered HRFsdecreases as a function of Rbase
2 . The error bars in panel d show the standard deviation across all data points of panels a–c.
3134 R.J. Cooper et al. / NeuroImage 59 (2012) 3128–3138
optimum time lag produces a greater improvement for HbO regressorsthan for HbR regressors.
Discussion
Our results confirm that low-frequency oscillations present in near-infrared spectroscopy data correlate significantly with a large proportionof BOLD-fMRI voxels, spread throughout the cortex. At frequenciesbelow 0.1 Hz, NIRS signals are subject to a range of physiologicaloscillations. These include the spontaneous changes in vascular dilationreferred to as vaso-motion (Gustafsson, 1993) and the global oscillationsin arterial blood pressure known as Mayer waves (Julien, 2006). As theeffects of vaso-motion tend to be location-specific, the systemic oscilla-tions caused by Mayer waves affecting both the scalp-dominatedresting-state NIRS signal and BOLD-fMRI voxels across the brain seemthe most likely source of this correlation.
Whole-cortex PVR and HRF simulation
The utility of NIRS signals in the regression of physiological noise canbe established in a variety of ways. A simple assessment of the efficacyof a given linearmodel is the variance of thatmodel's residual error. Our
results indicate that the inclusion of NIRS signals in the model can re-duce this variance by as much as 36%. To achieve this, a large numberof NIRS channels (>15) are required. NIRS regression produces anaverage PVR of 6.0% for a single NIRS channel, comparable to thatachieved by the slice-specific RETROICOR approach (6.4%), (Fig. 3a).
As is clear from Fig. 3, a significant proportion of the variance re-duction achieved by NIRS regression is not due to the physiologicalinformation present in the NIRS data, but can equally be achievedby the regression of random vectors occupying the same frequencyspace. However, even when this effect is taken into account, an aver-age PVR of 17% can still be achieved by the HbO & HbR model(Fig. 3b). These corrected PVR results suggest that applying 10 NIRSchannels provides the best model of physiological noise in theBOLD signal. The value of 17% represents a lower-bound estimateon the average PVR which can be obtained by a model containing10 or more NIRS channels.
The results of our explicit simulation of an event-related BOLD-fMRI experiment confirm that NIRS can be used to improve the recoveryof the HRF time course. There is a significant improvement in both themean-squared error (MSE) and the correlation coefficient (R2) betweenthe synthetic and recovered HRFs when NIRS regressors are applied.Note that both the HbO and HbR models provide an improvement in

Fig. 6. The single-regressor NIRS model R2 plotted against the reference model R2 for 100 voxels selected using the value of the baseline NIRS–fMRI correlation for each voxel. Thedata is separated into three bands on the basis of Rbase
2 . The average increase in R2 for all data points is shown in panel d. The value of R2 between the synthetic and recovered HRFsincreases as a function of Rbase
2 . The error bars in panel d show the standard deviation across all data points of panels a–c.
3135R.J. Cooper et al. / NeuroImage 59 (2012) 3128–3138
MSE and R2 and that the HbO &HbRmodel is consistently better thaneither single-chromophore model. This may suggest that the HbOand HbR signals provide independent contributions to the model ofresting-state fMRI fluctuations, but could also be the result of spatialaveraging if the HbO andHbR signals are correlated with different re-gions of the cortex.
Fig. 4 shows that recovery of the HRF improves even if regressorsare applied in a ‘blind’ fashion; across the whole cortex and withoutconsideration for the baseline NIRS–fMRI correlation. The minimumMSE and maximum R2 are achieved across the whole cortex whenapproximately 10 NIRS channels are included in the linear model.The MSE does not monotonically decrease (as the PVR increases inFig. 3a) because the MSE is dependent on both variance and efficiency.Although adding NIRS regressors decreases the residual variance, it canalso decrease the model's efficiency. As the number of NIRS channelsincreases beyond 10, the decrease in efficiency overcomes the decreasein residual variance, and the MSE begins to increase.
As stated previously, we believe that the majority of the low-frequency contribution to the resting-state NIRS signal (and thereforeto the NIRS–fMRI correlation) originates in the superficial layers ofthe head. As a result, the acquisition of NIRS signals suitable for regres-sion could be performed using channels which only sample superficialtissues. Because of the improved signal-to-noise ratio associated
with short separation channels, superficial NIRS acquisition is oftensignificantly easier than standard NIRS. Obtaining multi-channel,superficial NIRS during fMRI experiments is therefore entirely feasible,and may be particularly useful in experiments which require preciserecovery of the HRF time course and where the number of stimuli orthe scanning duration are limited. Examples of such cases include thestudy of the hemodynamic response to inter-ictal epileptic activitywith fMRI (Bénar et al., 2002) or the computation of the cerebral meta-bolic rate of oxygen from combined NIRS–fMRI (Huppert et al., 2009). Itis important to note that the HRF simulation data presented here arethe average results obtained from 30 pseudo-random event-relatedparadigm designs. It was necessary to use a large number of differentdesigns in order to produce a robust result, which suggests that theefficacy of NIRS regression may be sensitive to experimental design.An investigation of the utility of NIRS in the regression of fMRI noisefor different experimental paradigms (including block designs) willtherefore be necessary to establish which fMRI experiments willbenefit from simultaneous NIRS recording.
Selected voxels and optimized time lag
The results summarized in Figs. 5 and 6 provide a measure of theimportance of the baseline correlation (Rbase
2 ) to the success of each

Fig. 7. An example of the HRFs recovered using the reference model, pulse and respiration RETROICOR model and by single-regressor HbO (panel a) and HbR (panel b) models for asingle subject, run and NIRS channel for voxels well correlated each NIRS regressor (0.2bRbase
2 b0.3). The true, single-gamma HRF is also shown in both panels.
3136 R.J. Cooper et al. / NeuroImage 59 (2012) 3128–3138
NIRS model. Although it is difficult to obtain the statistical powerrequired to provide exact quantification of this relationship (dueto variation in BOLD noise in different groups of voxels for example),the use of a single NIRS regressor in voxels where Rbase
2 > 0.1 will,on average, produce a significant improvement in HRF recovery.
It is also important to note that even in cases of low baseline cor-relation (Figs. 5a and 6a), the use of a single NIRS regressor does not,on average, worsen the recovery of the HRF. This is consistent withFig. 4, which shows that a significant improvement is observedeven when NIRS regression is applied across the whole cortex,which must include regions and channels which exhibit a poorNIRS–fMRI correlation. This does not appear to be the case for thesynthetic NIRS signals, as the whole-cortex simulation shows thatHRF recovery worsens significantly with the use of a single syntheticregressor.
The results of employing the optimum time lag between each NIRSand fMRI time series show a significant decrease in MSE and a modestincrease in R2 for HbO, HbR and HbO & HbR models. A comparableimprovement in HRF recovery is seen for the synthetic NIRS regressors(Fig. 8). An improvement inHRF recovery is clearly expected because byselecting the optimum time lag we are maximizing the value of thebaseline correlation between each NIRS signal and the fMRI data.The fact that the synthetic NIRS regressors (even when optimizedfor time lag) do not provide the reduction in MSE achieved by thereal NIRS signals is further evidence that low-frequency physiologi-cal oscillations are common to both fMRI and NIRS recordings. Theseresults are also consistent with the hypothesis that the NIRS–fMRIcorrelation follows a low-frequency wave pattern throughout thecerebral vasculature, but the improvement this affords to HRF recov-ery is relatively small; comparable to the addition of a second NIRSchannel.
The results of our simulations in pre-selected voxels, and the resultsof our time-lag optimization are both reliant on a calculation ofthe baseline correlation (Rbase
2 ) between each NIRS signal and thefMRI data prior to the introduction of the simulated HRF series.The improvement in the recovery of the HRF associated with ahigher baseline correlation is therefore to be expected. However,the introduction of the HRF series into the fMRI data produced anegligible change in Rbase
2 ; 0.0058 for HbO and 0.0059 for HbR signals.It is therefore reasonable to suggest that NIRS regression could beoptimized in a real fMRI study by maximizing Rbase
2 , as calculatedusing the fMRI data during the stimulation period, with little risk ofremoving the HRF itself. This would obviously require that the NIRSchannels are arranged so as not to sample the activated regions ofthe cortex. Alternatively, Rbase
2 could be calculated for a period ofNIRS–fMRI data where no stimulation occurs (i.e. during a rest period),but this assumes that the scale and spatial distribution of theNIRS–fMRIcorrelationwill remain constant in time, the veracity ofwhich has yet tobe determined.
Conclusions
We have demonstrated that NIRS recordings can be employed toreduce the variance of the residual error in a general linear model ofthe resting-state BOLD-fMRI. Our results show that the use of a singleNIRS channel will reduce variance in the residual error by an averageof 6.0%, comparable to that achieved by RETROICOR methods. The useof 10 NIRS channels can reduce variance by as much as 36% on averageacross the whole cortex, though the same number of low-pass filteredwhite noise regressors can achieve a PVR of 19%.Wehave also explicitlyshown that the use of even a single NIRS channel can significantlyimprove the recovery of a simulated hemodynamic response function
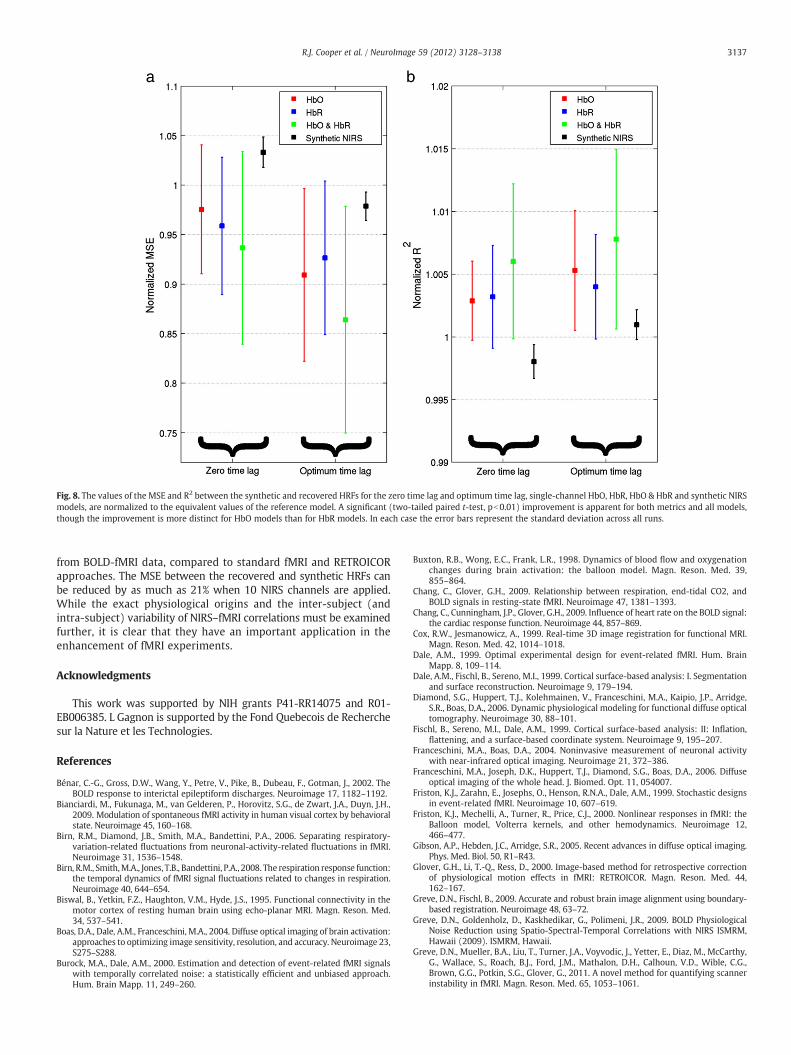
Fig. 8. The values of the MSE and R2 between the synthetic and recovered HRFs for the zero time lag and optimum time lag, single-channel HbO, HbR, HbO & HbR and synthetic NIRSmodels, are normalized to the equivalent values of the reference model. A significant (two-tailed paired t-test, pb0.01) improvement is apparent for both metrics and all models,though the improvement is more distinct for HbO models than for HbR models. In each case the error bars represent the standard deviation across all runs.
3137R.J. Cooper et al. / NeuroImage 59 (2012) 3128–3138
from BOLD-fMRI data, compared to standard fMRI and RETROICORapproaches. The MSE between the recovered and synthetic HRFs canbe reduced by as much as 21% when 10 NIRS channels are applied.While the exact physiological origins and the inter-subject (andintra-subject) variability of NIRS–fMRI correlations must be examinedfurther, it is clear that they have an important application in theenhancement of fMRI experiments.
Acknowledgments
This work was supported by NIH grants P41-RR14075 and R01-EB006385. L Gagnon is supported by the Fond Quebecois de Recherchesur la Nature et les Technologies.
References
Bénar, C.-G., Gross, D.W., Wang, Y., Petre, V., Pike, B., Dubeau, F., Gotman, J., 2002. TheBOLD response to interictal epileptiform discharges. Neuroimage 17, 1182–1192.
Bianciardi, M., Fukunaga, M., van Gelderen, P., Horovitz, S.G., de Zwart, J.A., Duyn, J.H.,2009. Modulation of spontaneous fMRI activity in human visual cortex by behavioralstate. Neuroimage 45, 160–168.
Birn, R.M., Diamond, J.B., Smith, M.A., Bandettini, P.A., 2006. Separating respiratory-variation-related fluctuations from neuronal-activity-related fluctuations in fMRI.Neuroimage 31, 1536–1548.
Birn, R.M., Smith,M.A., Jones, T.B., Bandettini, P.A., 2008. The respiration response function:the temporal dynamics of fMRI signal fluctuations related to changes in respiration.Neuroimage 40, 644–654.
Biswal, B., Yetkin, F.Z., Haughton, V.M., Hyde, J.S., 1995. Functional connectivity in themotor cortex of resting human brain using echo-planar MRI. Magn. Reson. Med.34, 537–541.
Boas, D.A., Dale, A.M., Franceschini, M.A., 2004. Diffuse optical imaging of brain activation:approaches to optimizing image sensitivity, resolution, and accuracy. Neuroimage 23,S275–S288.
Burock, M.A., Dale, A.M., 2000. Estimation and detection of event-related fMRI signalswith temporally correlated noise: a statistically efficient and unbiased approach.Hum. Brain Mapp. 11, 249–260.
Buxton, R.B., Wong, E.C., Frank, L.R., 1998. Dynamics of blood flow and oxygenationchanges during brain activation: the balloon model. Magn. Reson. Med. 39,855–864.
Chang, C., Glover, G.H., 2009. Relationship between respiration, end-tidal CO2, andBOLD signals in resting-state fMRI. Neuroimage 47, 1381–1393.
Chang, C., Cunningham, J.P., Glover, G.H., 2009. Influence of heart rate on the BOLD signal:the cardiac response function. Neuroimage 44, 857–869.
Cox, R.W., Jesmanowicz, A., 1999. Real-time 3D image registration for functional MRI.Magn. Reson. Med. 42, 1014–1018.
Dale, A.M., 1999. Optimal experimental design for event-related fMRI. Hum. BrainMapp. 8, 109–114.
Dale, A.M., Fischl, B., Sereno, M.I., 1999. Cortical surface-based analysis: I. Segmentationand surface reconstruction. Neuroimage 9, 179–194.
Diamond, S.G., Huppert, T.J., Kolehmainen, V., Franceschini, M.A., Kaipio, J.P., Arridge,S.R., Boas, D.A., 2006. Dynamic physiological modeling for functional diffuse opticaltomography. Neuroimage 30, 88–101.
Fischl, B., Sereno, M.I., Dale, A.M., 1999. Cortical surface-based analysis: II: Inflation,flattening, and a surface-based coordinate system. Neuroimage 9, 195–207.
Franceschini, M.A., Boas, D.A., 2004. Noninvasive measurement of neuronal activitywith near-infrared optical imaging. Neuroimage 21, 372–386.
Franceschini, M.A., Joseph, D.K., Huppert, T.J., Diamond, S.G., Boas, D.A., 2006. Diffuseoptical imaging of the whole head. J. Biomed. Opt. 11, 054007.
Friston, K.J., Zarahn, E., Josephs, O., Henson, R.N.A., Dale, A.M., 1999. Stochastic designsin event-related fMRI. Neuroimage 10, 607–619.
Friston, K.J., Mechelli, A., Turner, R., Price, C.J., 2000. Nonlinear responses in fMRI: theBalloon model, Volterra kernels, and other hemodynamics. Neuroimage 12,466–477.
Gibson, A.P., Hebden, J.C., Arridge, S.R., 2005. Recent advances in diffuse optical imaging.Phys. Med. Biol. 50, R1–R43.
Glover, G.H., Li, T.-Q., Ress, D., 2000. Image-based method for retrospective correctionof physiological motion effects in fMRI: RETROICOR. Magn. Reson. Med. 44,162–167.
Greve, D.N., Fischl, B., 2009. Accurate and robust brain image alignment using boundary-based registration. Neuroimage 48, 63–72.
Greve, D.N., Goldenholz, D., Kaskhedikar, G., Polimeni, J.R., 2009. BOLD PhysiologicalNoise Reduction using Spatio-Spectral-Temporal Correlations with NIRS ISMRM,Hawaii (2009). ISMRM, Hawaii.
Greve, D.N., Mueller, B.A., Liu, T., Turner, J.A., Voyvodic, J., Yetter, E., Diaz, M., McCarthy,G., Wallace, S., Roach, B.J., Ford, J.M., Mathalon, D.H., Calhoun, V.D., Wible, C.G.,Brown, G.G., Potkin, S.G., Glover, G., 2011. A novel method for quantifying scannerinstability in fMRI. Magn. Reson. Med. 65, 1053–1061.

3138 R.J. Cooper et al. / NeuroImage 59 (2012) 3128–3138
Gustafsson, H., 1993. Vasomotion and underlying mechanisms in small arteries. An invitro study of rat blood vessels. Acta. Physiol. Scand. (Suppl. 614), 1–44.
Hu, X., Le, T.H., Parrish, T., Erhard, P., 1995. Retrospective estimation and correction ofphysiological fluctuation in functional MRI. Magn. Reson. Med. 34, 201–212.
Huettel, S., Song, A., Mccarthy, G., 2004. Functional Magnetic Resonance Imaging.Sinauer Associates.
Huppert, T.J., Hoge, R.D., Diamond, S.G., Franceschini, M.A., Boas, D.A., 2006. A temporalcomparison of BOLD, ASL, and NIRS hemodynamic responses to motor stimuli inadult humans. Neuroimage 29, 368–382.
Huppert, T.J., Allen, M.S., Diamond, S.G., Boas, D.A., 2009. Estimating cerebral oxygenmetabolism from fMRI with a dynamic multicompartment Windkessel model.Hum. Brain Mapp. 30, 1548–1567.
Jones, T.B., Bandettini, P.A., Birn, R.M., 2008. Integration of motion correction andphysiological noise regression in fMRI. Neuroimage 42, 582–590.
Julien, C., 2006. The enigma ofMayer waves: facts andmodels. Cardiovasc. Res. 70, 12–21.Lina, J.-M., Dehaes, M., Matteau-Pelletier, C., Lesage, F., 2008. Complex wavelets applied
to diffuse optical spectroscopy for brain activity detection. Opt. Express 16,1029–1050.
Obrig, H., Villringer, A., 2003. Beyond the visible—imaging the human brain with light.J. Cereb. Blood Flow Metab. 23, 1–18.
Prince, S., Kolehmainen, V., Kaipio, J.P., Franceschini, M.A., Boas, D., Arridge, S.R., 2003.Time-series estimation of biological factors in optical diffusion tomography. Phys.Med. Biol. 48, 1491–1504.
Smith, S.M., 2002. Fast robust automated brain extraction. Hum. Brain Mapp. 17,143–155.
Steinbrink, J., Villringer, A., Kempf, F., Haux, D., Boden, S., Obrig, H., 2006. Illuminating theBOLD signal: combined fMRI–fNIRS studies. Magn. Reson. Imaging 24, 495–505.
Strangman, G., Culver, J.P., Thompson, J.H., Boas, D.A., 2002. A quantitative comparisonof simultaneous BOLD fMRI and NIRS recordings during functional brain activation.Neuroimage 17, 719–731.
Tong, Y., Frederick, B.D., 2010. Time lag dependent multimodal processing of concurrentfMRI and near-infrared spectroscopy (NIRS) data suggests a global circulatory originfor low-frequency oscillation signals in human brain. Neuroimage 53, 553–564.
Tong, Y., Bergethon, P.R., deB, Frederick, B., 2011. An improved method for mappingcerebrovascular reserve using concurrent fMRI and near-infrared spectroscopywith Regressor Interpolation at Progressive Time Delays (RIPTiDe). Neuroimage56, 2047–2057.
Toronov, V., Webb, A., Choi, J.H., Wolf, M., Michalos, A., Gratton, E., Hueber, D., 2001.Investigation of human brain hemodynamics by simultaneous near-infraredspectroscopy and functional magnetic resonance imaging. Med. Phys. 28, 521.
Villringer, A., Planck, J., Hock, C., Schleinkofer, L., Dirnagl, U., 1993. Near infraredspectroscopy (NIRS): a new tool to study hemodynamic changes during activationof brain function in human adults. Neurosci. Lett. 154, 101–104.
Wise, R.G., Ide, K., Poulin, M.J., Tracey, I., 2004. Resting fluctuations in arterial carbondioxide induce significant low frequency variations in BOLD signal. Neuroimage21, 1652–1664.