the use of matrigel has no influence on tumor development
TRANSCRIPT
RESEARCH ARTICLE Open Access
The use of matrigel has no influence ontumor development or PET imaging inFaDu human head and neck cancerxenograftsFrederikke P. Fliedner1, Anders E. Hansen1,2, Jesper T. Jørgensen1 and Andreas Kjær1*
Abstract
Background: In preclinical research MatrixgelTM Basement Membrane Matrix (MG) is used frequently for theestablishment of syngeneic and xenograft cancer models. Limited information on its influence on parametersincluding; tumor growth, vascularization, hypoxia and imaging characteristics is currently available. This studyevaluates the potential effect of matrigel use in a human head and neck cancer xenograft model (FaDu;hypopharyngeal carcinoma) in NMRI nude mice. The FaDu cell line was chosen based on its frequent use instudies of cancer imaging and tumor microenvironment.
Methods: NMRI nude mice (n = 34) were divided into two groups and subcutaneously injected with FaDu cellsin medium either including (+MG) or excluding matrigel (−MG). In sub study I seven mice from each group(+MG, n = 7; −MG, n = 7) were 18F- fluorodeoxyglucose (18F-FDG) PET/CT scanned on Day 5, 8, 12, 15, and 19.In sub study II ten mice from each group (+MG, n = 10; −MG, n = 10) were included and tumors collected forimmunohistochemistry (IHC) analysis of tumor microenvironment including; proliferation ratio, micro vesseldensity, average vessel area, hypoxia, nuclear density, and necrosis. Tumors for IHC were collected accordingto size (200–400 mm3, 500–700 mm3, 800–1100 mm3).
Results: FDG uptake and tumor growth was statistically compatible for the tumors established with or withoutMG. The IHC analysis on all parameters only identified a significantly higher micro vessel density for tumor size500–700 mm3 and 800–1100 mm3 and average vessel area for tumor size 500–700 mm3 in the −MG group.Comparable variations were observed for tumors of both the +MG and −MG groups. No difference in tumortake rate was observed between groups in study.
Conclusions: Matrigel did not affect tumor growth or tumor take for the FaDu xenograft model evaluated.Tumors in the -MG group displayed increased angiogenesis compared to the +MG tumors. No difference in18F-FDG PET uptake for tumors of different groups was found. Based on these observations the influence ofmatrigel on tumor imaging and tumor microenvironment seems minor for this particular xenograft model.
Keywords: Matrigel, FaDu, Xenograft, PET imaging, Tumor development, Hypoxia, MVD, Cancer, FDG-PET,Molecular imaging
* Correspondence: [email protected] of Clinical Physiology, Nuclear Medicine & PET and Cluster forMolecular Imaging, Rigshospitalet and University of Copenhagen,Blegdamsvej 9, 2100 Copenhagen, DenmarkFull list of author information is available at the end of the article
© 2016 Fliedner et al. Open Access This article is distributed under the terms of the Creative Commons Attribution 4.0International License (http://creativecommons.org/licenses/by/4.0/), which permits unrestricted use, distribution, andreproduction in any medium, provided you give appropriate credit to the original author(s) and the source, provide a link tothe Creative Commons license, and indicate if changes were made. The Creative Commons Public Domain Dedication waiver(http://creativecommons.org/publicdomain/zero/1.0/) applies to the data made available in this article, unless otherwise stated.
Fliedner et al. BMC Medical Imaging (2016) 16:5 DOI 10.1186/s12880-016-0105-4

BackgroundHuman cancer xenografts in immunodeficient mice arewidely used in cancer research and provide vital modelsfor the study of tumor growth, tumor development, andthe response to therapy in preclinical research. Severalhuman cancer cell linescan be succesfully implantedonto immune deficient mouse models, but variations intake rate and growth of solid tumors makes their usechallenging. MatrixgelTM Basement Membrane Matrix(Matrigel or MG) is commonly used to improve tumortake and growth [1]. Matrigel was originally extracted fromconnective tissue and research from the last century hasshown that the extracts form matrix structures, and providesurrounding cells with substrates for growth promotionand development [1–3]. The reconstructed basement mem-brane complex includes; laminin, growth factors, entactin,and type IV collagen [3–5]. Studies have evaluated the ad-vantages of MG for various cell lines [6–9] and generally ithas been found to improve tumor take and growth. Nochange in tumor development and microenvironment isstated in these studies and reviews [4, 8, 9]. Isolated constit-uents from MG have been tested for impact on cell growth.However, no single substance was identified as the mainmediator of effects [1, 10]. MG hereby lacks a fully definedimpact on tumor growth, which could be a possible sourceof error in translation. By legislation the number of animalsin preclinical research must be kept as low as possible whilemaintaining adequate power of studies. Enhancement oftumor growth by including MG can be used to decreasethe number of animals in a study, but could also be apotential source of error from a translational perspec-tive. 18F-FDG PET/CT is clinically used for head andneck cancer in relation to staging, therapy planningand response to therapy [11]. FaDu head and neck can-cer xenograft models are widely used for studies ofPET imaging, tumor microenvironment, and radiationtherapy in preclinical research [12–14]. The descriptionof MG use for tumor inoculation in studies is not alwaysspecified. Accordingly, an understanding of possible im-pact of MG use is of great importance. The aim of thisstudy was to investigate the influence of MG use, ontumor and imaging characteristics of FaDu hypopharyn-geal carcinoma cells inoculated subcutaneously on NMRInude mice.
MethodsTumor modelAll experimental procedures were approved by the DanishAnimal Welfare Council, the Danish Ministry of Justice.Dulbecco’s Modified Eagle Medium were supplementedwith 10 % Fetal Calf Serum (FCS) and 1 % penicillin-streptomycin for growth of FaDu cells in culture flaks untilconfluency, retained in 5 % CO2 incubator at 37 ° C. Sixweeks old female NMRI nude (Naval Medical Research
Institute) mice were purchased from Taconic Europe(Borup, Denmark). After one week of adaptation, 34animals were inoculated with FaDu tumor cells sub-cutaneously on both left and right flank. Half of themice (n = 17) were injected with a suspension for eachtumor consisting of 2.5 × 10⁶ FaDu cells in 50 μL Dul-becco’s Modified Eagle Medium (Life Technologies,Carlsbad, CA, USA) (−MG group; n = 17). For +MGgroup (n = 17) 50 μL Matrixgel™ Basement MembraneMatrix (BD Biosciences, San Jose, CA, USA) was addedand a total volume of 100 μL containing 2.5 × 10⁶ FaDucells injected. Tumor size and weight were measured con-tinuously from day 5 post implant to follow the develop-ment of tumors and monitor the health of the mice. Micewere housed in IVC rack from Techniplast in Type IIISPF cages with 8 mice in each cage. Purified water andchow food was available ad libitum for mice unless any-thing else is described.
Group determinationOf the 34 mice included in study; 14 mice (+MG, n = 7;−MG, n = 7) were randomized to sub study I where allmice were 18F- fluorodeoxyglucose (18F-FDG) PET/CTscanned on Day 5, 8, 12, 15, and 19. In sub study II thatincluded ten mice from the +MG group (n = 10) and tenmice from the -MG group (n = 10), tumors were collectedwhen reaching predetermined sizes (200–400 mm3, 500–700 mm3, 800–1100 mm3) for immunohistochemistry(IHC) analysis of tumor characteristics.
Volume determinationTumor volume determination with external caliper wasmade by measuring the greatest longitudinal diameterand transverse diameter. Tumor volume was then calcu-lated by following ellipsoid equation [15, 16]:
Tumor Volume ¼ π ⋅longitudinal diameter þ transverse diameter
2
� �3
⋅16
Tumor volumes determined from 18F-FDG PET/CTwere generated by manually drawing regions of interest(ROIs) to cover the entire tumor by numerous tomo-graphic voxels, and summation of these defined the 3Dtumor volume.
18F-FDG PET/CT imaging – sub study IMice were injected via the tail vein with a mean activityof 8.90 ± 1.55 MBq (Mean ± SD) 18F-FDG in 0.2 mL0.9 % isotonic saline solution. Prior to injection all micewere fasted for approximately 12 h to minimize the vari-ation in 18F-FDG uptake [17]. For injection, distribution,and scanning, all mice were kept anaesthetized with 3 %sevoflurane (Abbott Scandinavia AB, Solna, Sweden) mixed
Fliedner et al. BMC Medical Imaging (2016) 16:5 Page 2 of 8
with 35 % O2 and 65 % N2. Body temperature was keptstable by external heating device when anaesthetized, andpositioned on a heating pad during scan. 18F-FDG PET/CTimaging was performed on Siemens Inveon® Small AnimalScanner (Siemens Medical Systems, PA, USA). The proto-col included a five minute PET scan followed by a CT scanwith attenuation correction to be used for reconstruction.Reconstruction of PET scans were performed usingmaximum a posteriori (MAP) reconstruction algorithm(voxel size: 0.815 × 0.815 × 0.796 mm; resolution (FWHM)1.2 mm). Reconstructed images were analyzed with InveonResearch Workspace software (Siemens Medical Systems,PA, USA). Tracer uptake was determined as mean andmaximum % injected dose pr. gram of tumor (%ID/g)(1 gram per cm3), and mean and maximum standardizeduptake value (SUV), corrected for decay.
Tumor microenvironment – sub study IITumors were collected when reaching a size of 200–400 mm3 (+MG; n = 6, −MG; n = 5), 500–700 mm3 (+MG;n = 7, −MG; n = 6), and 800–1100 mm3 (+MG; n = 6,−MG; n = 4). Collection of tumors for IHC staining wasinitiated two weeks post injection of FaDu cells and thecollection periods lasted for two weeks. Two hours priorto euthanasia 0.06 mg/g pimonidazole was injected i.p..Tumors were fixed in 4 % formaldehyde for 24 h, hereaftertransferred to 70 % ethanol, and finally embedded in par-affin and cut into 4 μm slices. Each tumor was stainedwith the following antibodies; pimonidazole (PIMO;hypoxia) (HypoxyProbe-Omni Kit, HypoxyProbe Inc.,Burlington, USA), Ki-67 (proliferation) (Dako; M7240),and CD31 (endothelial cell marker) (Abcam; ab28364). Inaddition haematoxylin eosin (HE) staining was performed.Antibody concentrations were optimized on tumor sam-
ples from mice included in this study for optimal bindingspecificity. The following concentrations were used foranalysis; PIMO 1:400, Ki-67 1:400, and CD31 1:50.Deparaffination was performed by heating slides for
1 h at 40 ° C, increasing temperature to 60 °C and incubat-ing for one additional hour. Slides were subsequentlytreated with xylene and rehydrated in descending concen-trations of ethanol (99, 96, 70 %). Slides for Ki-67 antibodystaining were furthermore exposed to microwave heatingafter rehydration to retrieve optimal binding. Endogenousperoxidase was blocked by Peroxidase Blocking Reagent(Dako, Glostrup, Denmark) for 8 min followed by BovineSerum Albumin (BSA) blocking with 2 % BSA for 10 minto avoid unspecific binding of antibodies. Primary anti-body incubated for 1 h followed by secondary biotinylatedEnVision FLEX™ (Dako, Glostrup, Denmark) incubationfor 40 min. Finally antibody staining was evoked by3,3′-Diaminobenzidine (DAB) (Dako, Glostrup, Denmark)incubation for 10 min and counterstained with haema-toxylin. Between all steps slides were rinsed in phosphate
buffered saline (PBS, 0.2 M, pH= 7.4). After dehydrationin increasing alcohol concentrations cover slides weremounted and slides scanned on an Axio scanner (Axioscan, Carl Zeiss, Germany). The Following parameterswere analyzed; cell density, hypoxia percentages, microvessel density (MVD), average vessel area, non-viable cellpercentages, and proliferation percentages. Cell densityand hypoxia was determined using the publicly availablesoftware Fiji (ImageJ). For nuclear density a nuclei countthreshold of 50 pixels2 to infinity was used (pixel size0.022 × 0.022 μm). The percentage of tumor hypoxia wasevaluated using Color Deconvolution based on pimonida-zole DAB-H staining. Based on constructed binary images(threshold between 210 and 220 RGB values of intensity)the percentage of hypoxia positive stained area in tumorslides was determined. MVD and average vessel area wasdetermined using online image segmentation and endo-thelial cell analysis software CAIMAN (CAncer IMageANalysis: http://www.caiman.org.uk) [18] in 5 selectedROIs. ROIs, excluding necrotic regions and artifacts,were manually drawn to represent entire slide (pixelsize 0.088 × 0.088 μm). Non-viable cell counts were de-termined in Fiji using the Advanced Weka Segmenta-tion plug-in. Regions of viable cells, non-viable cells,and background in slide were marked to train the clas-sifier and determine final segmentation. Calculationwas made from the result image constructed by classifier.Proliferation in tumors was calculated using the online au-tomated image analysis application ImmunoRatio (http://jvsmicroscope.uta.fi/sites/default/files/software/immunor-atio-plugin/index.html) [19]. Five defined ROIs represent-ing entire slide, excluding necrosis and artifacts, weremanually drawn and uploaded to define percentage of
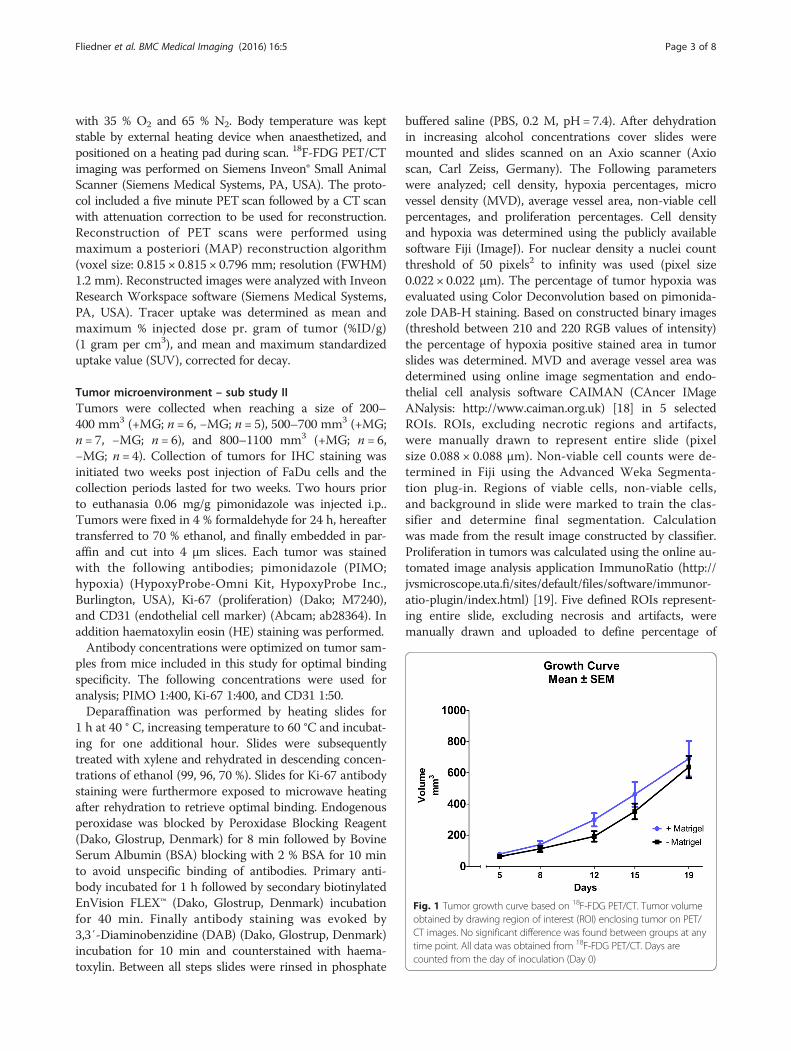
Fig. 1 Tumor growth curve based on 18F-FDG PET/CT. Tumor volumeobtained by drawing region of interest (ROI) enclosing tumor on PET/CT images. No significant difference was found between groups at anytime point. All data was obtained from 18F-FDG PET/CT. Days arecounted from the day of inoculation (Day 0)
Fliedner et al. BMC Medical Imaging (2016) 16:5 Page 3 of 8

Fig. 2 Transverse section of an 18F-FDG PET/CT image of mice with subcutaneous FaDu tumors. 18F-FDG PET/CT scans 1 h after 18F-FDG injection.Region of interests encapsulate tumor on each side of the flank. a and c +MG mouse at scan day 8 and 19, respectively. b and d −MG mousescan day 8 and 19, respectively. Scale bar is indicated in %ID/g for all images calculated from a specific mass of 1 g/cm3. Scan day representsnumber of days after inoculation
Fig. 3 Graphic presentation of tumor uptake results obtained from 18F-FDG PET/CT scan data. Uptake obtained from ROIs drawn on tumor areascalculated as mean (a) and maximum (b) %ID/g from a specific mass of 1 g/cm3 and also as mean (c) and maximum (d) standardized uptakevalue (SUV). All data in plots obtained from 18F-FDG PET/CT scans on Siemens Inveon Small Animal scanner 1 h post injection of tracer
Fliedner et al. BMC Medical Imaging (2016) 16:5 Page 4 of 8

proliferating cells in total nuclei area (pixel size 0.088 ×0.088 μm).
Statistical analysisStatistical analysis was performed in GraphPad 6 (Graph-Pad Software, CA, USA). Comparison between groups ofdata from PET/CT scan was performed using Student’s T-test. Results are presented as Mean ± SEM (Standard Errorof Mean). Analysis of data from histological staining’s wasperformed using One-Way ANOVA variance analysis withHolm-Sidak’s post hoc test for multiple comparisons testto evaluate differences between groups of different tumorsizes. A p-value < 0.05 was considered statistically signifi-cant in all tests.
Results and discussionTracer uptake and tumor volume determined by 18F-FDGPET/CT scanData obtained from 18F-FDG PET/CT identified no sig-nificant difference in FDG tumor uptake or tumor sizebetween the +MG and -MG groups on each scan day,shown in Figs. 1 and 3. A tendency for increased growthrate of the tumors in the +MG group was observedbetween day 8 and 12 (Fig. 1), but growth was very
compatible at later time points. Figure 2 illustrate 18F-FDGPET/CT images of mice from the different groups, and thecompatible 18F-FDG uptake can be readily appreciated atboth time points. The observed compatibility of FDGuptake in tumors +/− MG indicates that 18F-FDG PET/CT results are not influenced by the addition of MGfor this tumor model (Fig. 3). SUVmax is often usedclinically for classification of tumors in relation to staging,treatment, and response, and was therefore included instudy to identify and evaluate maximum uptake in tumors[20]. No difference between SUVmax in tumors with orwithout MG was found, indicating that MG, in this setup,does not influence maximum FDG uptake (Fig. 3d).Previous studies have shown that tumor take in models
are increased using MG [21]. In this study the take rate oftumors inoculated without MG was approximately 95 %(32 out of 34 inoculated) and 100 % (34 out of 34 inocu-lated) with MG, which indicates that MG does not influ-ence tumor take for the investigated model.The doubling in injection volume between groups might
lead to a falsely determined tumor volume for the +MGgroup at early and intermediate time points, where a dis-tinct part is mostly due to MG volume and not division oftumor cells. However, as seen in Fig. 1, tumor volume at
Fig. 4 Pearson correlation model for 18F-FDG PET/CT determined tumor volume and external caliper determined tumor volume. Correlationbetween external caliper determined volumes and volumes determined from PET/CT scans. Pearson correlation model was used for the plottedvalues. a All scans. Correlation coefficient was 0.85 (p-value < 0.0001). b Same regression model with mean value at each time point (5, 8, 12, 15,and 19). Correlation coefficient was 0.98 (p-value = 0.0017). c Bland-Altman plot showing the difference between measurements against the averageto visualize bias between methods
Fliedner et al. BMC Medical Imaging (2016) 16:5 Page 5 of 8

day 5 and 8 are virtually similar and the growth rates be-tween these days follow the same development curve. Dif-ference in growth rate was detected between day 8 and 12(increase in rate for +MG). Grounds for injecting largersuspension volumes for the MG suspension was based onkeeping the injected number of cells and concentration inmedia fixed, and from the results the difference in injec-tion volume did not seem to have a distinct effect. Basedon Figs. 1 and 3, it seems that the variation in size andtracer uptake is smaller in the −MG group compared tothe +MG group. PET/CT scan data indicate that no sig-nificant advantage or drawback can be stated regardingMG use for tumor growth or tumor uptake in this model,but a decrease in group variation is observed for the −MGgroup. Based on this, there is little reason for using MG inFaDu xenograft models.
Tumor development from IHC dataIHC staining was made on tumors collected at differentsize groups in order to compare tumor microenvironmentcharacteristics on different development stages. Size ofcollected tumors was defined using external caliper as
described in the method section. To connect the two partsof the study in regard to tumor growth, Pearson correl-ation was performed between volumes determined from18F-FDG PET/CT scan and volumes determined from theexternal caliper (Fig. 4). A correlation coefficient of 0.85(p-value < 0.0001) was found for the correlation includingall data points (Fig. 4a). Pearson correlation analysis basedon mean values at each time point identified a correlationcoefficient of 0.98 (p-value = 0.0017) (Fig. 4b). Add-itionally, the validity of comaring tumor sizes betweengroups was found acceptable using Bland-Altman analysis(Fig. 4c).Results obtained from IHC are presented in Fig. 5.
One-way ANOVA test was used for the comparisonsof characteristics between different size groups. IHCdata showed that vascularization differed between thegroups of the same tumor size. Statistical differencesbetween micro vessel densities were found for tumorsizes; 500–700 mm3 (p-value = 0.0457) and 800–1100 mm3
(p-value = 0.0214), and for average vessel area at 500–700 mm3 (p-value = 0.0237) with the highest numbers forthe -MG group (Fig. 5a and b). Angiogenesis was found to
Fig. 5 Boxplot presentation of immunohistochemical results of collected tumors at different size stages. Results presented from all IHC dataobtained. One way ANOVA with Holm-Sidak’s post hoc test. a MVD as determined by CD31 staining. Significance found between groups of sizes500–700 mm3 (p-value = 0.0457) and 800–1100 mm3 (p-value = 0.0214). MVD calculated as no. of vessels per ROI area. b Average vessel area incl.lumen from CD31 staining. Significant difference between groups in tumors size of 500–700 mm3 (p-value = 0.024). c Non-viable cell count presentedfrom HE staining of slides. No significance found. d Cell density calculated from Haematoxylin staining illustrated, no significant difference found. e Cellproliferation determined as percent Ki-67 positive cells of total count. No statistical difference observed. f Percentages of hypoxia in tumor from PIMOantibody staining. No statistical difference found
Fliedner et al. BMC Medical Imaging (2016) 16:5 Page 6 of 8

be significantly higher in tumors without MG. Whencomparing to the results of cell density, a tendency toa lower median in cell density for tumors without MGwas observed. As discussed previously, tumor growthdata obtained from PET/CT scans showed a tendencyof increased tumor size for the +MG group at day 12–15where tumors size was 200–400 mm3. Tumor cell prolifer-ation showed a distinct difference for the small tumor sizegroup (200–400 mm3) with a higher percentage of pro-liferating cells in the −MG group (Fig. 5e). These twoobservations are conflicting since the increased growthrate of the tumors in the +MG groups does not correlatewith the proliferation percentage in collected tumors atsame size. The tumor volume in the +MG group could, ac-cording to the proliferation percentages, hereby partly con-sist of MG volume but IHC results on other parameterscontradicts this theory. Cell density in tumors of all sizesseemed to be rather similar, but as described previously, alower median is observed for tumors in the −MG group.This hereby conversely describes the tumor area in +MG tobe denser in cell concentration than the −MG group. Forthe larger sized tumor groups proliferating cells in slides
were compatible. In Fig. 6 examples of pre- and post-analysis images of IHC slides stained with CD31(Fig. 6a + b), Ki-67 (Fig. 6c + d), and HE (Fig. 6e + f )are shown. From the IHC results MG seems to bewithout major influence on tumor development andthe preclinical outcome in our model.
ConclusionsOur data indicate that using MG in cell suspension forinoculation induces no major impact on imaging andmicroenvironment characteristics of the FaDu hypophar-yngeal carcinoma xenografts. Less variation is seen whenno MG is used, which is in favor of not including MG inFaDu xenograft inoculation. Following the extensive useof the FaDu head and neck cancer xenograft model forPET imaging and tumor microenvironment characteris-tics, this study indicates that studies with and withoutMG use are comparable. Importantly, the observation inthis study cannot be generally applied. Important differ-ences potentially exist for human xenograft models otherthan FaDu in NMRI nude mice, which must be consid-ered before comparing results between studies.
Fig. 6 Immunohistochemistry (IHC) sections of micro vessel density (CD31 staining), proliferating cells (Ki-67 staining), and non-viable cell count(HE staining). Selection of IHC results presented to illustrate collected tissue samples and analyzed tissue. a CD31 staining visualizing endothelialcells in vessels of tumor slide. Staining made with antibody concentration of 1:50. Picture originates from mouse in the −MG group. Arrows indicatepositive staining of vessels in slide. b Edited version of picture A after using the CAIMAN segmentation algorithm to detect antibody stainedareas. Arrows indicate vessels identified by the CAIMAN algorithm (marked by thin green contouring line). c Ki-67 staining for proliferatingcells in tumor section from a mouse in the +MG group. Staining made using antibody concentration of 1:400. d Review of image C after usingthe ImmunoRatio application for selecting proliferating cell percentage. Cells marked in brown are considered as positive Ki-67 and blue cellsnegative. e Haematoxylin eosin staining for non-viable cell count in tumor slide from mouse in the +MG group. f Image E after separation ofviable cells (red), non-viable cells (green), and background (purple) with the Advanced Weka Segmentation tool in FiJi (ImageJ)
Fliedner et al. BMC Medical Imaging (2016) 16:5 Page 7 of 8

Competing InterestsThe authors declare that they have no competing interests.
Authors’ contributionsFrederikke P. Fliedner (FPF), Anders E. Hansen (AEH) and Andreas Kjaer (AK)designed the study. FPF, AEH and Jesper T. Jørgensen (JTJ) performed theexperiments. All authors contributed to data analysis and interpretations.FPF drafted the manuscript and all authors provided input to revision of themanuscript and approved the final version.
AcknowledgementsGenerous support from the Danish Cancer Society, the Lundbeck foundation,the Novo Nordisk Foundation, the Svend Andersen Foundation, the InnovationFund Denmark, the Danish Research Council for Independent Research,Rigshospitalets Research Foundation, the Research Foundation of the CapitalRegion, the AP Møller Foundation, and the John and Birthe Meyer Foundation.
Author details1Department of Clinical Physiology, Nuclear Medicine & PET and Cluster forMolecular Imaging, Rigshospitalet and University of Copenhagen,Blegdamsvej 9, 2100 Copenhagen, Denmark. 2Department of Micro- andNanotechnology, Center for Nanomedicine and Theranostics, DTU Nanotech,Technical University of Denmark, Building 423, 2800 Lyngby, Denmark.
Received: 8 September 2015 Accepted: 4 January 2016
References1. Vukicevic S, Kleinman HK, Luyten FP, Roberts AB, Roche NS, Reddi AH.
Identification of multiple active growth factors in basement membraneMatrigel suggests caution in interpretation of cellular activity related toextracellular matrix components. Exp Cell Res. 1992;202(1):1–8.
2. Kleinman HK, McGarvey ML, Hassell JR, Star VL, Cannon FB, Laurie GW, et al.Basement membrane complexes with biological activity. Biochemistry.1986;25(2):312–8.
3. Fridman R, Benton G, Aranoutova I, Kleinman HK, Bonfil RD. Increasedinitiation and growth of tumor cell lines, cancer stem cells and biopsymaterial in mice using basement membrane matrix protein (Cultrex orMatrigel) co-injection. Nat Protoc. 2012;7(6):1138–44.
4. Benton G, Arnaoutova I, George J, Kleinman HK, Koblinski J. Matrigel: fromdiscovery and ECM mimicry to assays and models for cancer research. AdvDrug Deliv Rev. 2014;79–80:3–18. doi:10.1016/j.addr.2014.06.005.
5. Arnaoutova I, George J, Kleinman HK, Benton G. Basement membrane matrix(BME) has multiple uses with stem cells. Stem Cell Rev. 2012;8(1):163–9.
6. Fridman R, Kibbey MC, Royce LS, Zain M, Sweeney M, Jicha DL, et al.Enhanced tumor growth of both primary and established human andmurine tumor cells in athymic mice after coinjection with Matrigel. J NatlCancer Inst. 1991;83(11):769–74.
7. Pretlow TG, Delmoro CM, Dilley GG, Spadafora CG, Pretlow TP.Transplantation of human prostatic carcinoma into nude mice in Matrigel.Cancer Res. 1991;51(14):3814–7.
8. Noel A, De Pauw-Gillet MC, Purnell G, Nusgens B, Lapiere CM, Foidart JM.Enhancement of tumorigenicity of human breast adenocarcinoma cells innude mice by matrigel and fibroblasts. Br J Cancer. 1993;68(5):909–15.
9. Topley P, Jenkins DC, Jessup EA, Stables JN. Effect of reconstitutedbasement membrane components on the growth of a panel of humantumour cell lines in nude mice. Br J Cancer. 1993;67(5):953–8.
10. Hughes CS, Postovit LM, Lajoie GA. Matrigel: a complex protein mixturerequired for optimal growth of cell culture. Proteomics. 2010;10(9):1886–90.
11. Koshy M, Paulino AC, Howell R, Schuster D, Halkar R, Davis LW. F-18 FDGPET-CT fusion in radiotherapy treatment planning for head and neck cancer.Head Neck. 2005;27(6):494–502.
12. Baumann M, Liertz C, Baisch H, Wiegel T, Lorenzen J, Arps H. Impact ofoverall treatment time of fractionated irradiation on local control ofhuman FaDu squamous cell carcinoma in nude mice. Radiother Oncol.1994;32(2):137–43.
13. Menegakis A, Eicheler W, Yaromina A, Thames HD, Krause M, Baumann M.Residual DNA double strand breaks in perfused but not in unperfusedareas determine different radiosensitivity of tumours. Radiother Oncol.2011;100(1):137–44.
14. Schutze C, Bergmann R, Yaromina A, Hessel F, Kotzerke J, Steinbach J, et al.Effect of increase of radiation dose on local control relates to pre-treatmentFDG uptake in FaDu tumours in nude mice. Radiother Oncol. 2007;83(3):311–5.
15. Tomayko MM, Reynolds CP. Determination of subcutaneous tumor size inathymic (nude) mice. Cancer Chemother Pharmacol. 1989;24(3):148–54.
16. Russell PJ, Raghavan D, Gregory P, Philips J, Wills EJ, Jelbart M, et al.Bladder cancer xenografts: a model of tumor cell heterogeneity. CancerRes. 1986;46(4 Pt 2):2035–40.
17. Fueger BJ, Czernin J, Hildebrandt I, Tran C, Halpern BS, Stout D, et al. Impactof animal handling on the results of 18 F-FDG PET studies in mice. J NuclMed. 2006;47(6):999–1006.
18. Reyes-Aldasoro CC, Griffiths MK, Savas D, Tozer GM. CAIMAN: an onlinealgorithm repository for cancer image analysis. Comput Methods ProgramsBiomed. 2011;103(2):97–103.
19. Tuominen VJ, Ruotoistenmaki S, Viitanen A, Jumppanen M, Isola J.ImmunoRatio: a publicly available web application for quantitative imageanalysis of estrogen receptor (ER), progesterone receptor (PR), and Ki-67.Breast Cancer Res. 2010;12(4):R56.
20. Paidpally V, Chirindel A, Lam S, Agrawal N, Quon H, Subramaniam RM.FDG-PET/CT imaging biomarkers in head and neck squamous cellcarcinoma. Imaging Med. 2012;4(6):633–47.
21. Mullen P, Ritchie A, Langdon SP, Miller WR. Effect of Matrigel on thetumorigenicity of human breast and ovarian carcinoma cell lines. Int JCancer. 1996;67(6):816–20.
• We accept pre-submission inquiries
• Our selector tool helps you to find the most relevant journal
• We provide round the clock customer support
• Convenient online submission
• Thorough peer review
• Inclusion in PubMed and all major indexing services
• Maximum visibility for your research
Submit your manuscript atwww.biomedcentral.com/submit
Submit your next manuscript to BioMed Central and we will help you at every step:
Fliedner et al. BMC Medical Imaging (2016) 16:5 Page 8 of 8