the use of life cycle assessment (lca) to evaluate ... use of life cycle assessment (lca... · the...
TRANSCRIPT

The Use of Life Cycle Assessment (LCA) to Evaluate Pavement Choice
2011 Louisiana Transportation Conference
Erin Ashley, Ph.D., LEED APSenior Director of Sustainable ConstructionNational Ready Mixed Concrete Association
WWW. NRMCA.ORG
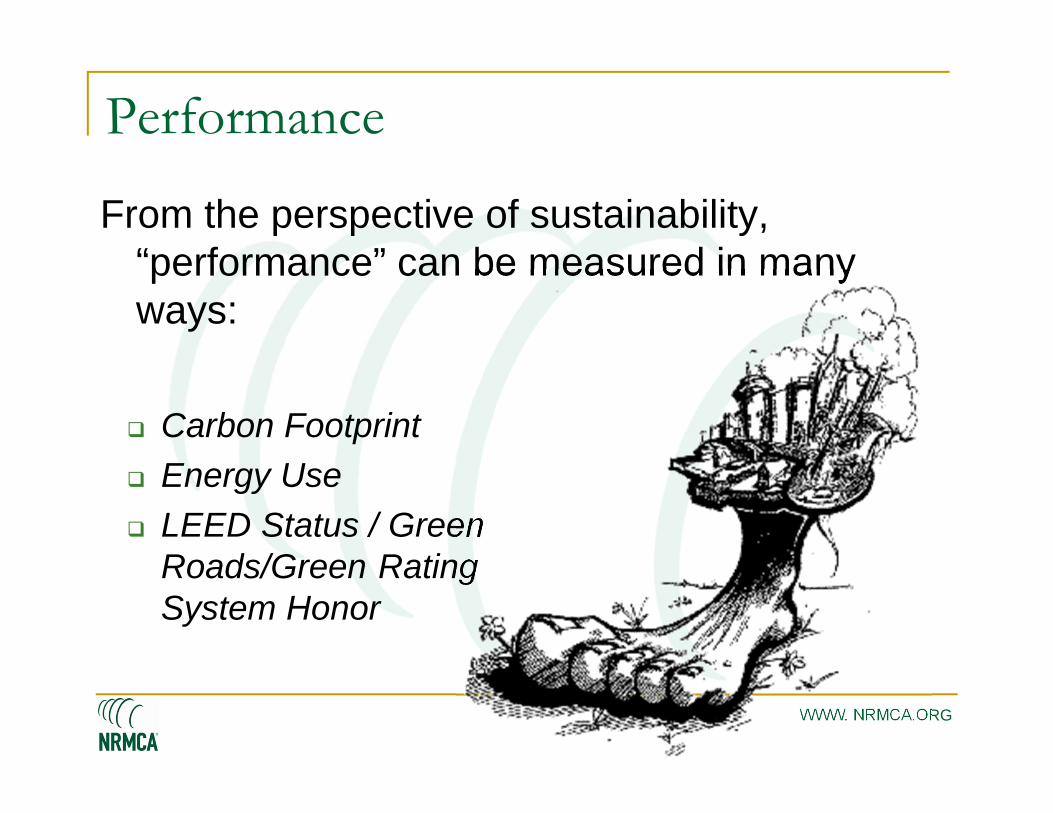
Performance
From the perspective of sustainability, “performance” can be measured in many ways:
Carbon Footprint Energy Use LEED Status / Green
Roads/Green Rating System Honor

WWW. NRMCA.ORG
Impacts Measured Prioritize Impacts
WWW. NRMCA.ORG
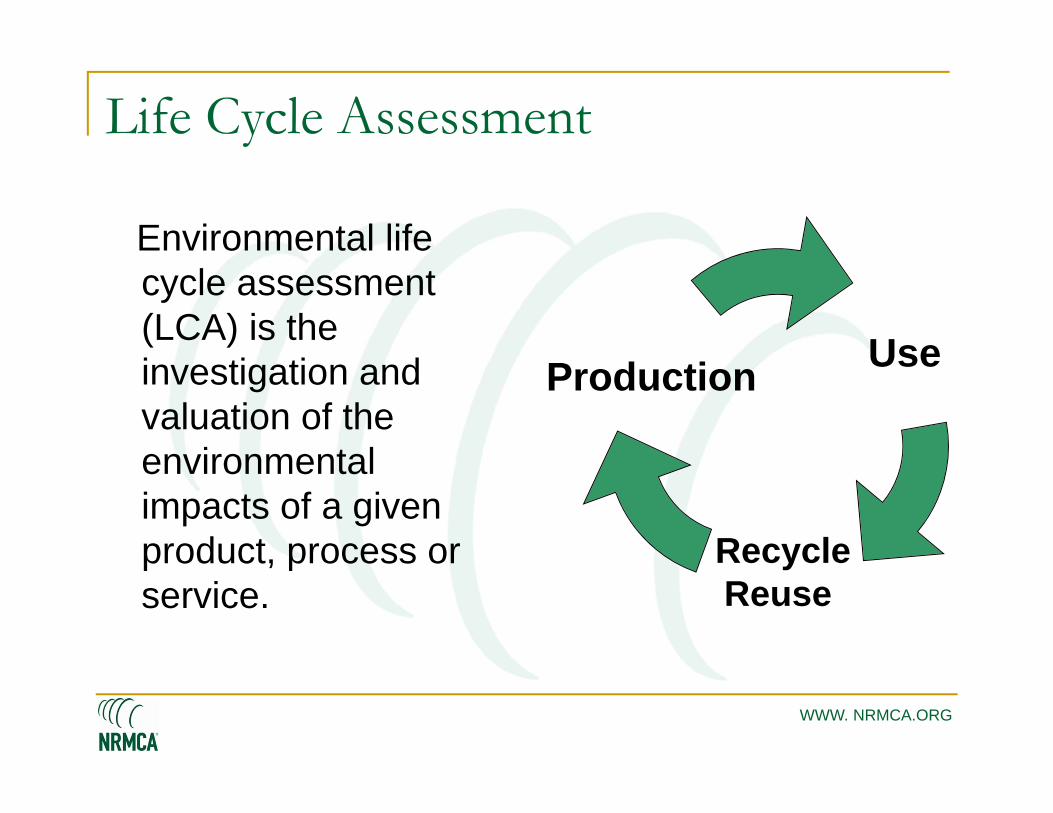
Life Cycle Assessment
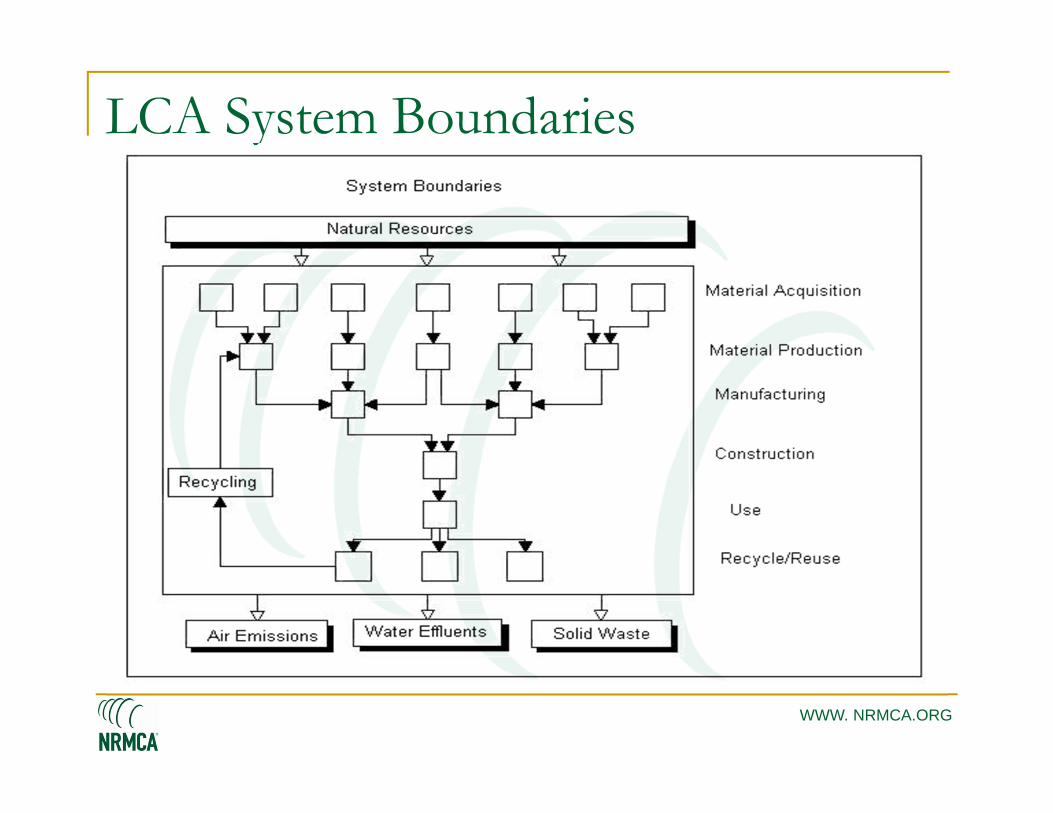
Environmental life cycle assessment (LCA) is the investigation and valuation of the environmental impacts of a given product, process or service.
Use
Recycle Reuse
Production
WWW. NRMCA.ORG
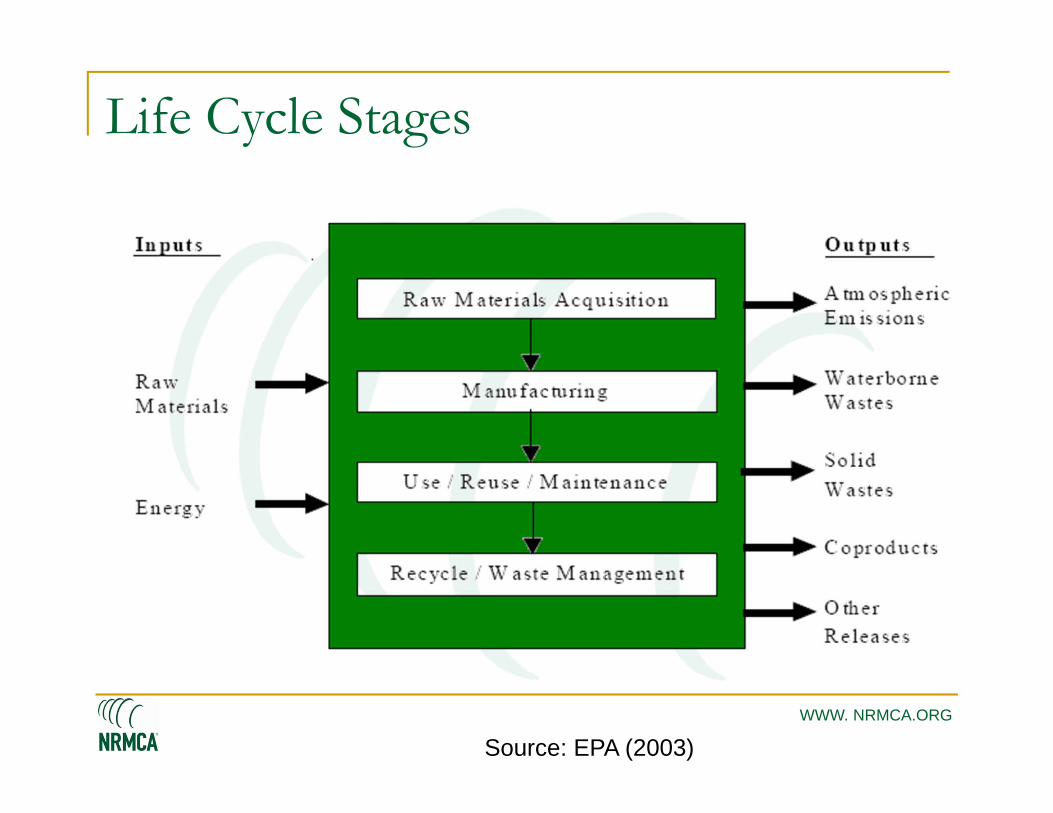
Life Cycle Stages
Source: EPA (2003)
WWW. NRMCA.ORG
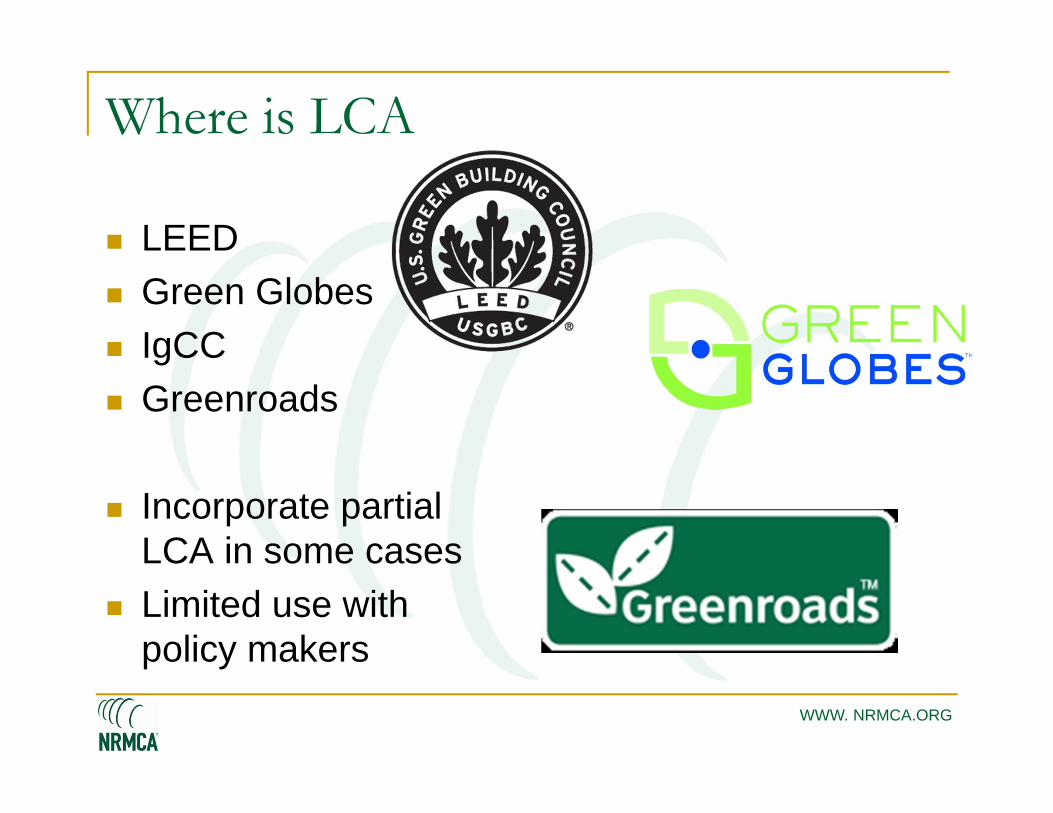
Where is LCA
LEED Green Globes IgCC Greenroads
Incorporate partial LCA in some cases
Limited use with policy makers

WWW. NRMCA.ORG
International Standards Organization (ISO)
The procedures of life cycle assessment (LCA) are part of the ISO 14000environmental management standards
ISO 14000 defines four distinct phases

WWW. NRMCA.ORG
Four phases of performing a LCA
1. Goal and Scope2. Life Cycle
Inventory Analysis3. Life Cycle Impact
Assessment4. Interpretation
Source: ISO (1997)
WWW. NRMCA.ORG
LCA System Boundaries

WWW. NRMCA.ORG
Functional Unit
The functional unit is a measure of the function of the studied system and it provides a reference to which the inputs and outputs can be related.
1000 Wash Cycles
1 water bottle
1 m2 painted surface
1 km roadway

WWW. NRMCA.ORG
Case StudiesAthena StudyMIT Study

WWW. NRMCA.ORG
Athena Study:Concrete Road vs. Asphalt Road
Report: A Life Cycle Perspective on Concrete and Asphalt Roadways: Embodied Primary Energy and Global Warming Potential
Conducted by Athena Institute, 2006

WWW. NRMCA.ORG
Goal and Scope
Compare the life cycle impacts of concrete highways vs. asphalt highways
Limited to life cycle inventory analysis of : Embodied primary (fossil) energy Greenhouse gas emissions
Does not include operational considerations Energy use by cars and trucks Lighting in urban areas

WWW. NRMCA.ORG
Goal and Scope (cont’d)
Several road types: Canadian average arterial roads and high volume
freeways Quebec urban freeway Section of Highway 401 freeway in Ontario

WWW. NRMCA.ORG
Boundaries
Sub-grade and finished surface, including asphalt paved shoulders
Excluded clearing, sub-grade, lane divider painting, etc.
AASHTO Guide for Design of Pavement Structures & CAC method for rigid pavements
50 year study period captures major rehabs
WWW. NRMCA.ORG
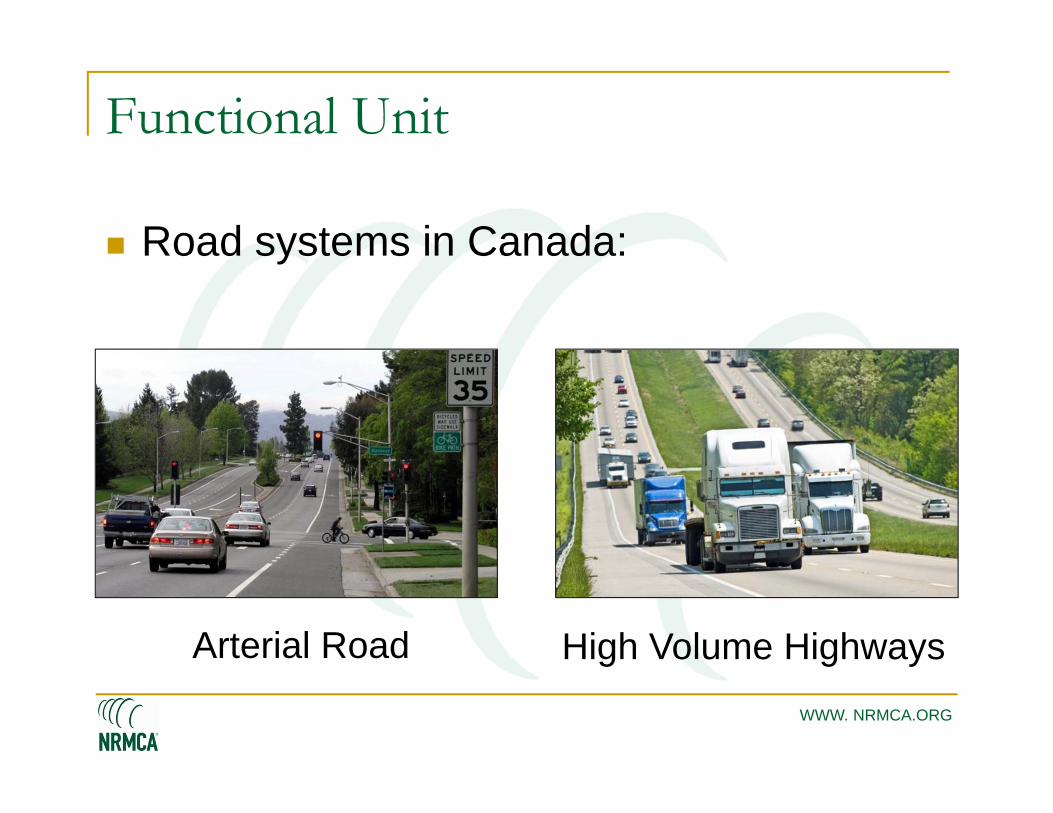
Functional Unit
Road systems in Canada:
Arterial Road High Volume Highways

WWW. NRMCA.ORG
Functional Unit (cont’d)
Third type of road system: Urban freeways (Quebec and Ontario)
All roads studied included inner and outer shoulders
I will only report on Canadian arterial and high volume highways

WWW. NRMCA.ORG
Definitions
Primary Energy Fossil fuel resources required by system
processes including pre-combustion fossil energy (see pre-combustion energy below).
Pre-combustion Energy Fossil fuel resources used to extract, process and
deliver fossil fuel resources to their point of use (also referred to as “indirect primary energy” or “upstream energy” use).

WWW. NRMCA.ORG
Definitions (cont’d)
Feedstock Energy The gross combustion heat value of any fossil
hydrocarbon material input to a product system which is an energy source, but is not being used as an energy source (e.g, bitumen) including its related pre-combustion energy.
Embodied Primary Energy Sum of primary energy and feedstock energy.
WWW. NRMCA.ORG
Definitions (cont’d)
California Bearing Ratio CBR is a penetration test for evaluation of the
mechanical strength of road sub-grades. It was developed by the Calfiornia highways department to measure the load-bearing capacity of soils supporting roads.
WWW. NRMCA.ORG
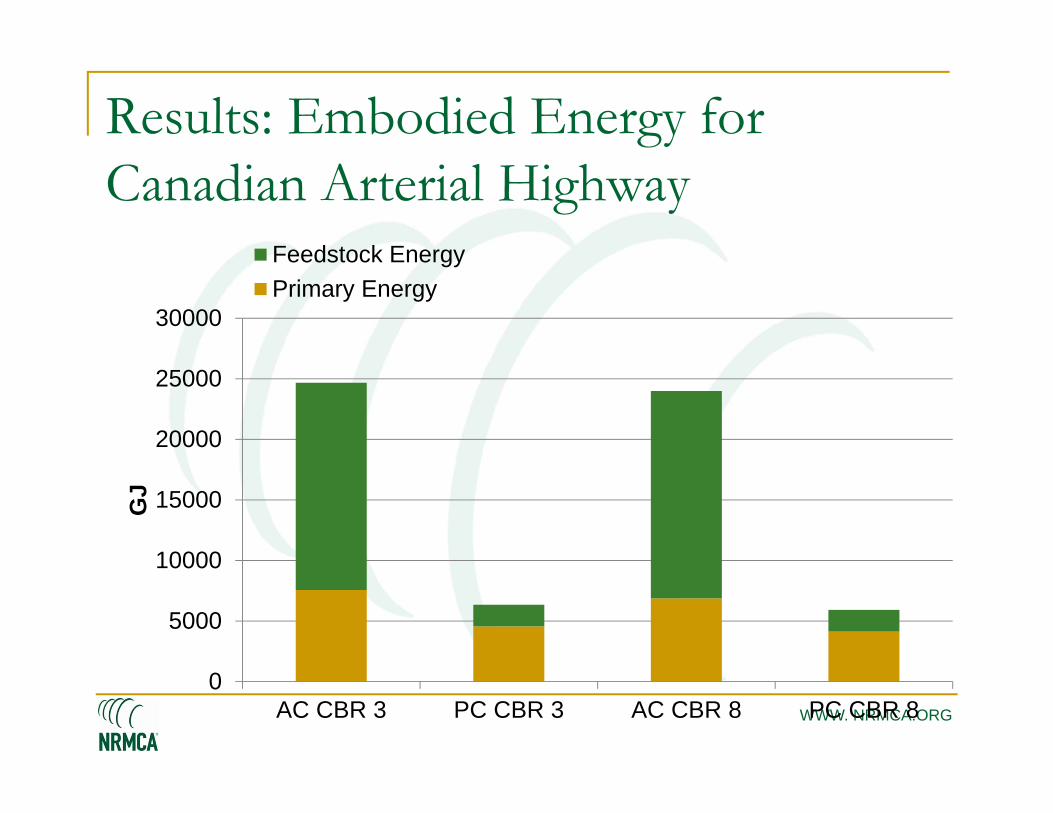
Results: Embodied Energy for Canadian Arterial Highway
0
5000
10000
15000
20000
25000
30000
AC CBR 3 PC CBR 3 AC CBR 8 PC CBR 8
GJ
Feedstock EnergyPrimary Energy
WWW. NRMCA.ORG
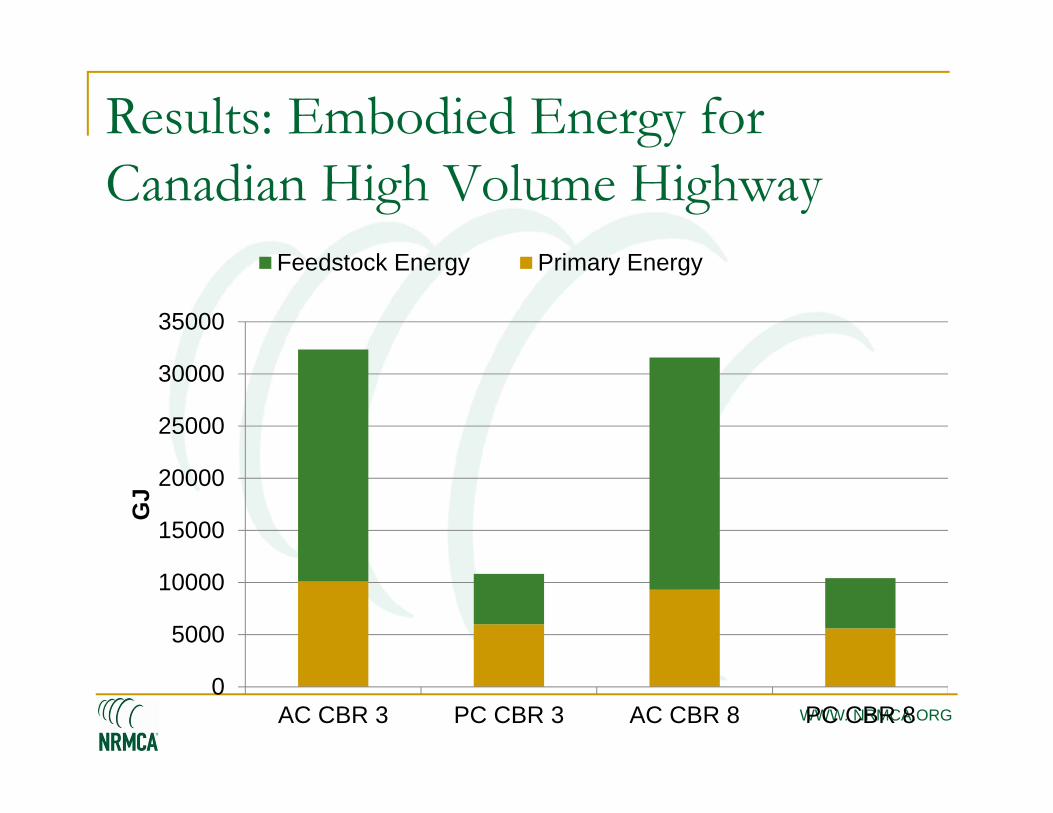
Results: Embodied Energy for Canadian High Volume Highway
0
5000
10000
15000
20000
25000
30000
35000
AC CBR 3 PC CBR 3 AC CBR 8 PC CBR 8
GJ
Feedstock Energy Primary Energy

WWW. NRMCA.ORG
Results: Global Warming Potential for Canadian Arterial and High Volume Highways
0
100
200
300
400
500
600
700
800
Arterial CBR 3 Arterial CBR 8 H. Vol. CBR 3 H. Vol CBR 8
Tonn
esC
O2
Equi
vale
nt
Asphalt Concrete
WWW. NRMCA.ORG
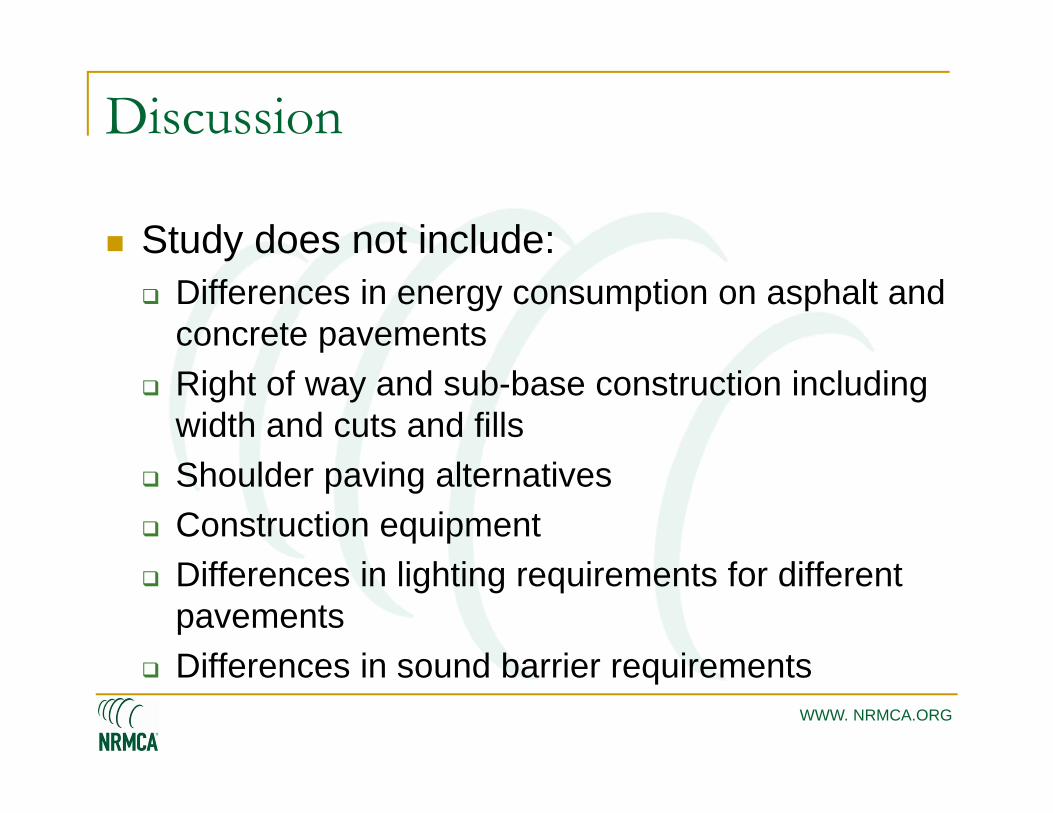
Discussion
Study does not include: Differences in energy consumption on asphalt and
concrete pavements Right of way and sub-base construction including
width and cuts and fills Shoulder paving alternatives Construction equipment Differences in lighting requirements for different
pavements Differences in sound barrier requirements

WWW. NRMCA.ORG
Truck Energy Use
National Resources Council of Canada Compared fuel consumption and emissions
for major urban arterial highway One paved with asphalt, other with concrete

WWW. NRMCA.ORG
Truck Energy Use (cont’d)
Trucks traveling on concrete
Fuel savings average 3.85%
Reductions in GWP Concrete pavement
stiffer than asphalt Less rolling resistance
Average Savings 3.85%
Fuel Savings
18,130 l/ km (7,708 gal/mi)
CO2
Reductions50 t/ km
(88 tons/mi)

WWW. NRMCA.ORG
Car Energy Use
University of Texas at Arlington Study Investigated differences in fuel consumption
and CO2 emissions Operating automobile on asphalt pavement
versus a concrete pavement under city driving conditions
Driving on concrete pavements can reduce fuel consumption by 3% to 17% fuel savings

WWW. NRMCA.ORG
Car Energy Use (cont’d)
Example for Dallas-Fort Worth, Texas If cars travelled at constant speed of 50 km/h
(30 mph) on concrete pavements similar to those in the study
Annual fuel savings 670 million liters (177 million gallons)
Annual CO2 reduction 620,000 tonnes (680,000 tons)

WWW. NRMCA.ORG
Lighting
Concrete pavements can also reduce energy demand for lighting
Concrete is more reflective Fewer lighting fixtures are needed to provide
the same illumination on a roadway built with concrete instead of asphalt.
An report by Richard Stark demonstrated 31% less energy

WWW. NRMCA.ORG
MIT Concrete Sustainability Hub Concrete Science Building Technology Econometrics

WWW. NRMCA.ORG
Life Cycle Analysis (LCA) of Pavements
Construction and maintenance embodied energy
Traffic emissions during maintenance
Fuel efficiency for semi-trucks and passenger vehicles
Material and aggregate consumption
Impact of heat island effect
Fossil fuel consumption

WWW. NRMCA.ORG
Roadway lighting, lane closures, etc.
WWW. NRMCA.ORG
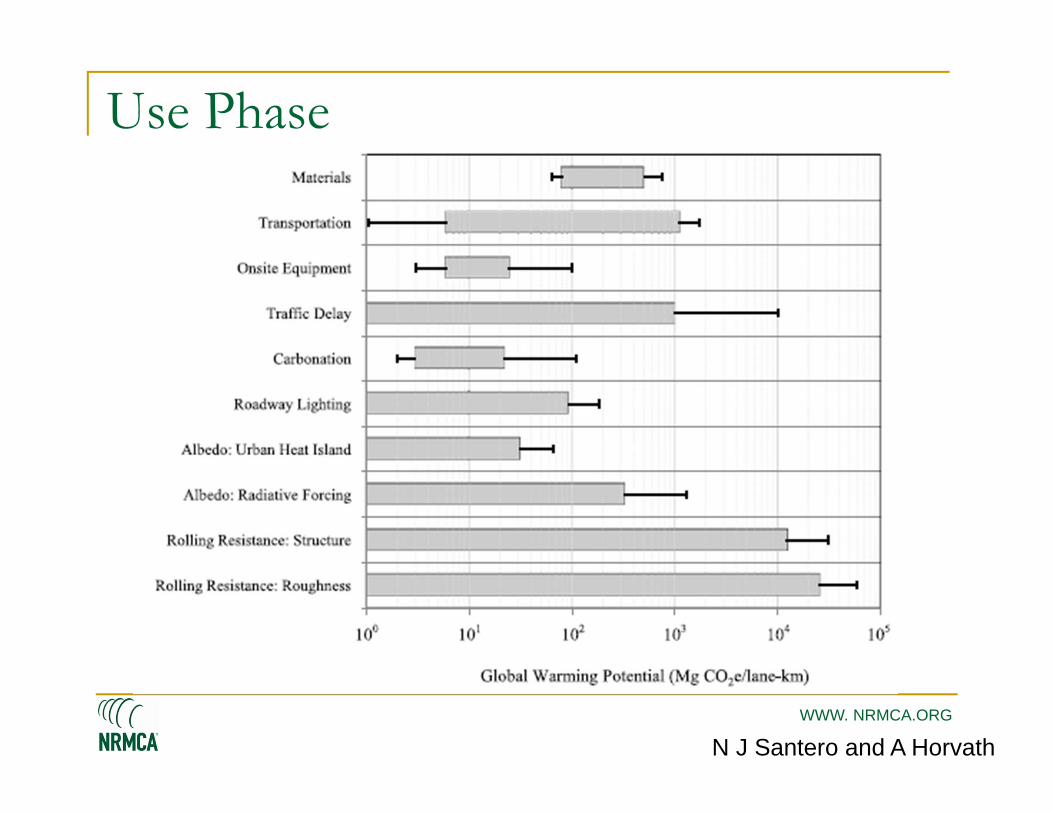
Use Phase
N J Santero and A Horvath

WWW. NRMCA.ORG
High volume road: Route 101 in Oxnard, CA
(at Route 232 junction) 65 mph highway 3 lanes each direction + 4
shoulders Daily traffic: 139,000 (Of which trucks: 6,672)
Moderate volume road: Route 67 in Ramona, CA
(at Route 78 junction) 35 mph urban road 2 lanes in each direction +
4 shoulders Daily traffic: 23,400
(Of which trucks: 1,357)
Low volume road: Route 178 in Sequoia
National Forest 35 mph rural road 1 lane in each direction
Daily traffic: 5,200(Of which trucks: 468)
Model Scenarios
WWW. NRMCA.ORG
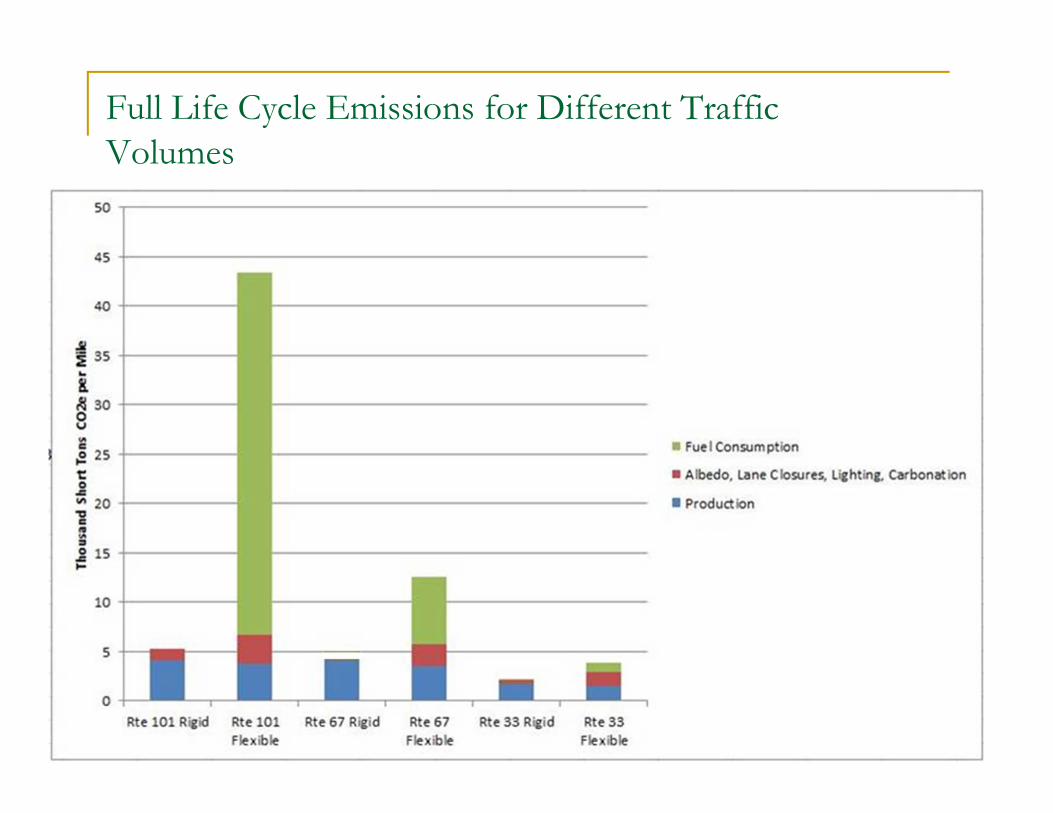
Full Life Cycle Emissions for Different Traffic Volumes

WWW. NRMCA.ORG
LCA of Pavements – Early Findings Concrete production emissions are higher than asphalt,
but concrete use phase emissions are lower High traffic concrete highways can have up to 90% lower emissions
for the entire life cycle compared to asphalt because of the greater fuel efficiency of vehicles driving on concrete
But no two pavements are alike The total carbon footprint of a pavement can vary by two orders of
magnitude depending on the traffic volume, rehabilitation schedule, and other assumptions
Pavement roughness and deflection are still uncertain No one has accurately quantified their interactive effects, the effect
of each pavement layer, nor the effect of temperature
WWW. NRMCA.ORG
Work for Year Two
Refine fuel consumption models to better account for pavement-vehicle interactions and instill greater confidence in fuel savings due to pavement design
Continue peer review process to have an expert critical review of LCA study
Policy Analysis - Analyze scenarios that quantify the carbon emissions associated with proposed renewal and improved upkeep of the national highway system Combine with life cycle economic costing to understand the
economic impact of reducing greenhouse gas emissions (Econometrics Platform)

WWW. NRMCA.ORG
Future Work• Improve Data Quality• Detailed Scenario Analysis
• 1) Decrease surface roughness by increasing preventive and rehabilitative maintenance
• 2) Leverage albedo effect and include whitening chemicals in LCI• 3) Engineered Cementitious Composite (ECC), etc.• 4) Model fly ash, rice husk ash, etc.
• Life cycle costing• Create tool for engineers to
estimate their pavement’s carbon footprint
WWW. NRMCA.ORG
Selected LCA Literature
Life Cycle Inventory of Portland Cement Concrete –Marceau, Nisbet and Van Geem
Horvath, A. and Hendrickson, C., Comparison of Environmental Implications of Asphalt and Steel-Reinforced Concrete Pavements.
Santero, N.J., Pavements and the Environment: A Life-Cycle Assessment Approach, Doctoral Dissertation in Civil and Environmental Engineering
A Life Cycle Perspective on Concrete and Asphalt Roadways: Embodied Primary Energy And Global Warming Potential – Athena Institute

Thank You.Erin Ashley, Ph.D., LEED [email protected]