measuring sustainability with life cycle assessment (lca
TRANSCRIPT
Measuring Sustainability with Life Cycle Assessment (LCA) and Life Cycle Costing (LCC)
Jonathan S.C. Low, PhD
25 May 2021
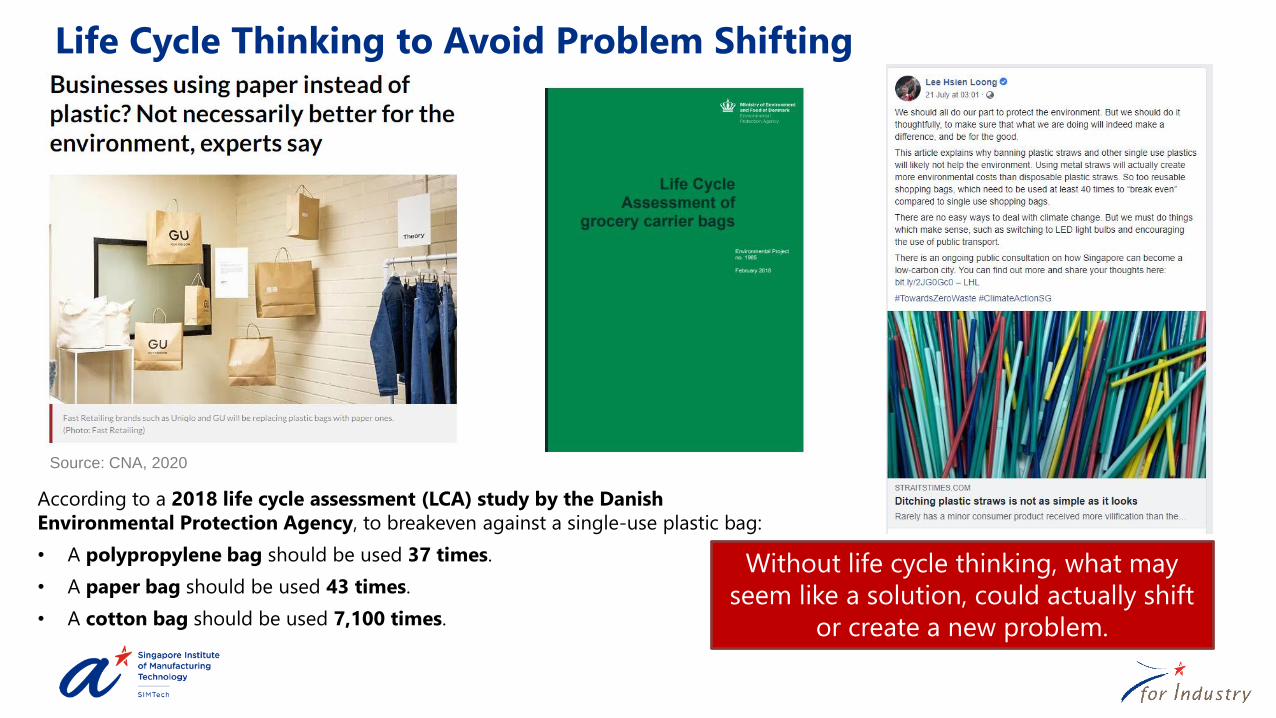
Life Cycle Thinking to Avoid Problem Shifting
According to a 2018 life cycle assessment (LCA) study by the Danish
Environmental Protection Agency, to breakeven against a single-use plastic bag:
• A polypropylene bag should be used 37 times.
• A paper bag should be used 43 times.
• A cotton bag should be used 7,100 times.
Without life cycle thinking, what may
seem like a solution, could actually shift
or create a new problem.
Source: CNA, 2020
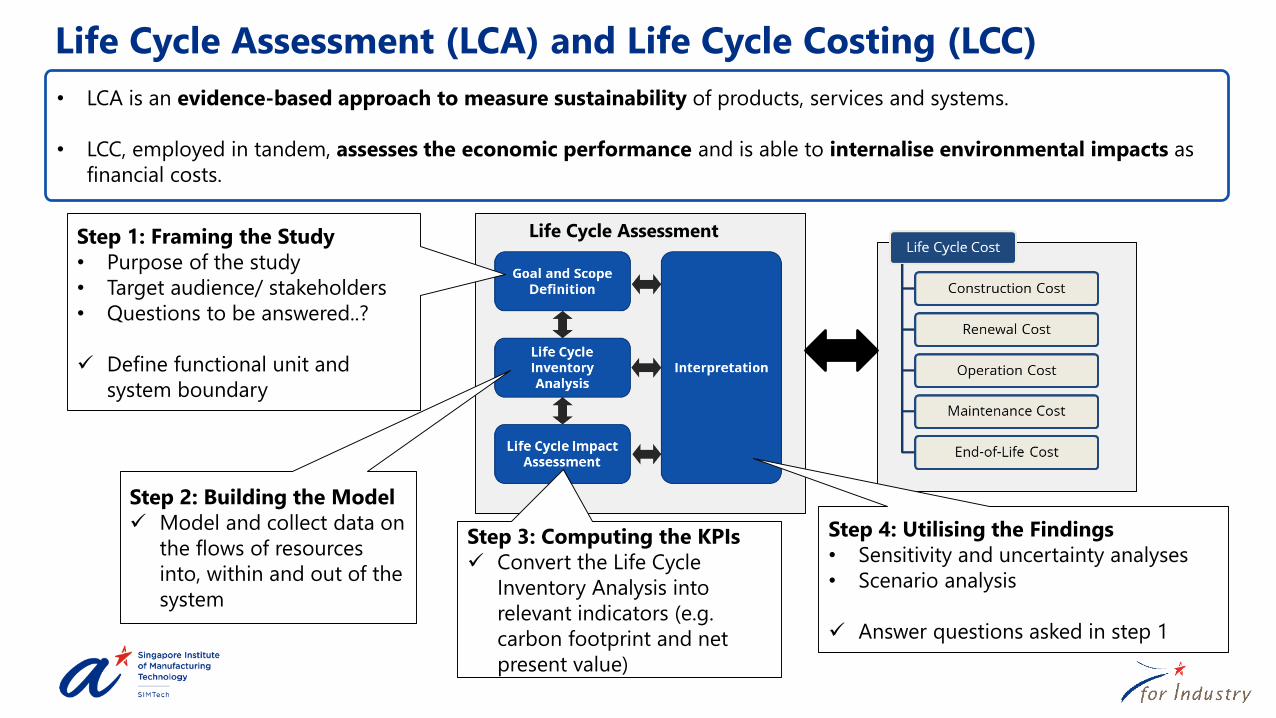
• LCA is an evidence-based approach to measure sustainability of products, services and systems.
• LCC, employed in tandem, assesses the economic performance and is able to internalise environmental impacts as
financial costs.
Life Cycle AssessmentStep 1: Framing the Study
• Purpose of the study
• Target audience/ stakeholders
• Questions to be answered..?
✓ Define functional unit and
system boundary
Step 2: Building the Model
✓ Model and collect data on
the flows of resources
into, within and out of the
system
Step 3: Computing the KPIs
✓ Convert the Life Cycle
Inventory Analysis into
relevant indicators (e.g.
carbon footprint and net
present value)
Step 4: Utilising the Findings
• Sensitivity and uncertainty analyses
• Scenario analysis
✓ Answer questions asked in step 1
Life Cycle Assessment (LCA) and Life Cycle Costing (LCC)
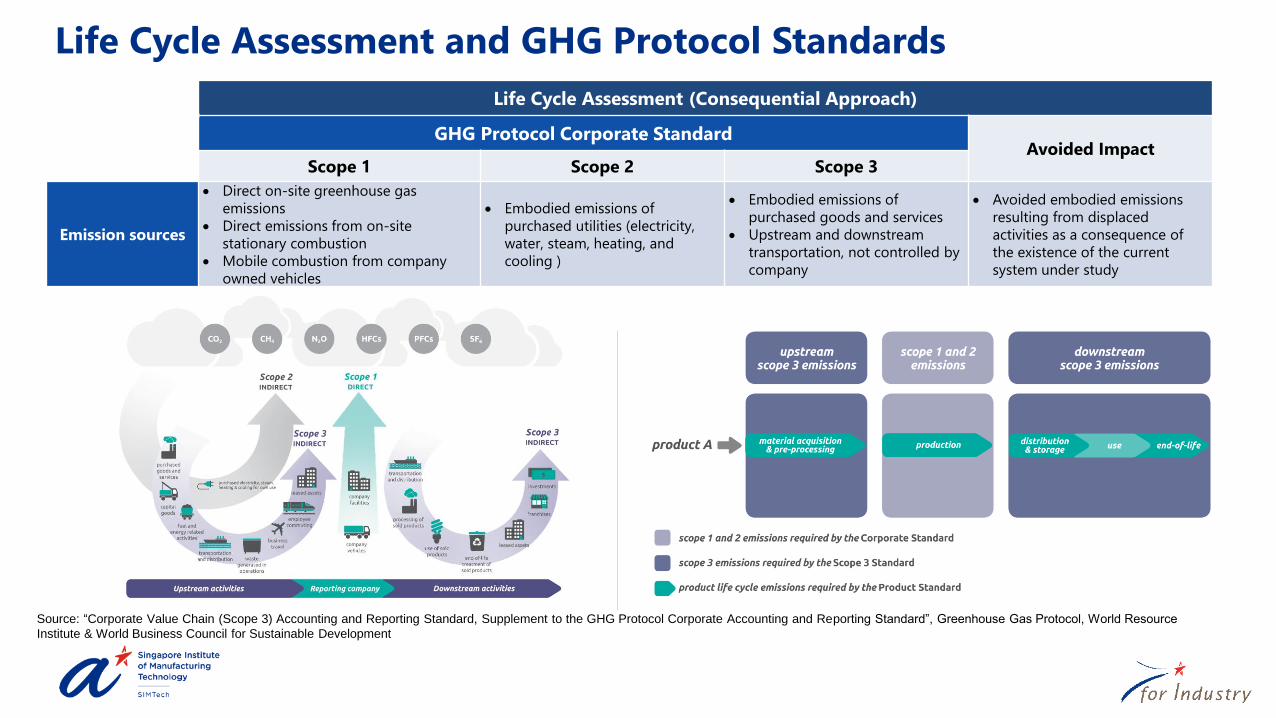
Life Cycle Assessment and GHG Protocol Standards
Source: “Corporate Value Chain (Scope 3) Accounting and Reporting Standard, Supplement to the GHG Protocol Corporate Accounting and Reporting Standard”, Greenhouse Gas Protocol, World Resource
Institute & World Business Council for Sustainable Development
Life Cycle Assessment (Consequential Approach)
GHG Protocol Corporate StandardAvoided Impact
Scope 1 Scope 2 Scope 3
Emission sources
• Direct on-site greenhouse gas
emissions
• Direct emissions from on-site
stationary combustion
• Mobile combustion from company
owned vehicles
• Embodied emissions of
purchased utilities (electricity,
water, steam, heating, and
cooling )
• Embodied emissions of
purchased goods and services
• Upstream and downstream
transportation, not controlled by
company
• Avoided embodied emissions
resulting from displaced
activities as a consequence of
the existence of the current
system under study
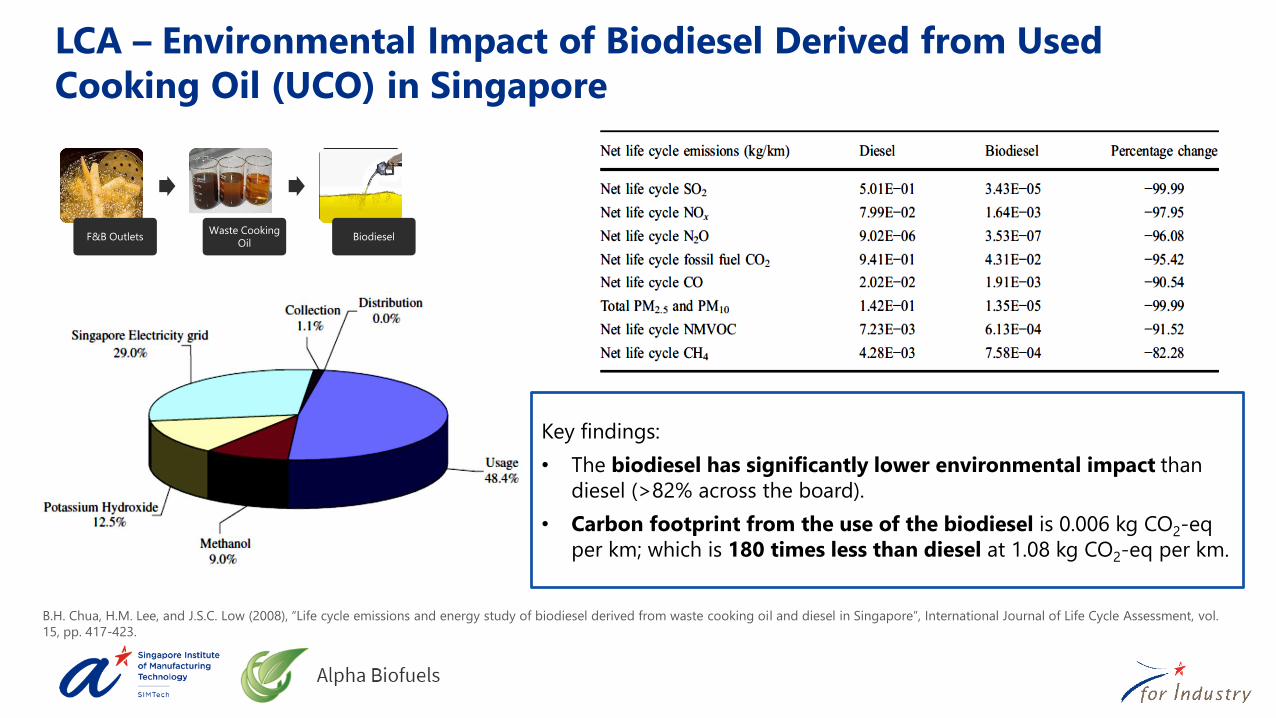
LCA – Environmental Impact of Biodiesel Derived from Used
Cooking Oil (UCO) in Singapore
Key findings:
• The biodiesel has significantly lower environmental impact than
diesel (>82% across the board).
• Carbon footprint from the use of the biodiesel is 0.006 kg CO2-eq
per km; which is 180 times less than diesel at 1.08 kg CO2-eq per km.
B.H. Chua, H.M. Lee, and J.S.C. Low (2008), “Life cycle emissions and energy study of biodiesel derived from waste cooking oil and diesel in Singapore”, International Journal of Life Cycle Assessment, vol.
15, pp. 417-423.
F&B OutletsWaste Cooking
OilBiodiesel
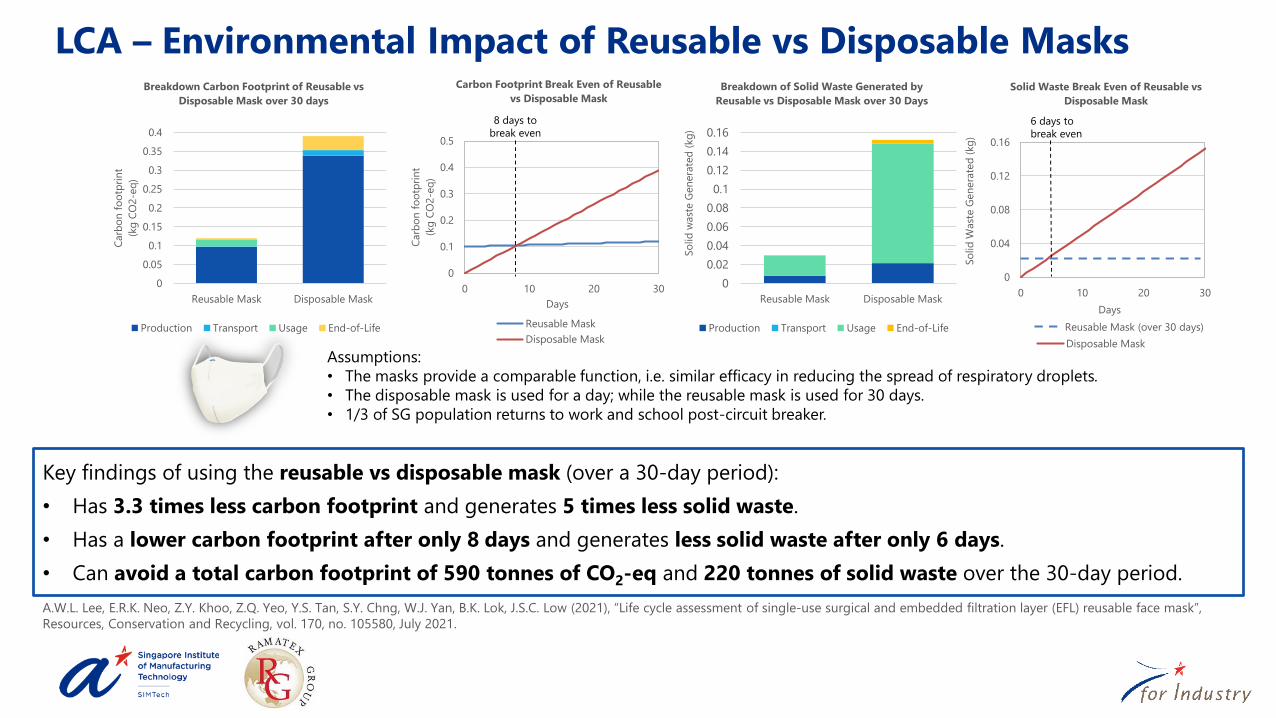
LCA – Environmental Impact of Reusable vs Disposable Masks
0
0.05
0.1
0.15
0.2
0.25
0.3
0.35
0.4
Reusable Mask Disposable Mask
Carb
on
fo
otp
rin
t
(kg
CO
2-e
q)
Breakdown Carbon Footprint of Reusable vs
Disposable Mask over 30 days
Production Transport Usage End-of-Life
0
0.1
0.2
0.3
0.4
0.5
0 10 20 30
Carb
on
fo
otp
rin
t
(kg
CO
2-e
q)
Days
Carbon Footprint Break Even of Reusable
vs Disposable Mask
Reusable Mask
Disposable Mask
8 days to
break even
Key findings of using the reusable vs disposable mask (over a 30-day period):
• Has 3.3 times less carbon footprint and generates 5 times less solid waste.
• Has a lower carbon footprint after only 8 days and generates less solid waste after only 6 days.
• Can avoid a total carbon footprint of 590 tonnes of CO2-eq and 220 tonnes of solid waste over the 30-day period.
Assumptions:
• The masks provide a comparable function, i.e. similar efficacy in reducing the spread of respiratory droplets.
• The disposable mask is used for a day; while the reusable mask is used for 30 days.
• 1/3 of SG population returns to work and school post-circuit breaker.
0
0.02
0.04
0.06
0.08
0.1
0.12
0.14
0.16
Reusable Mask Disposable Mask
So
lid
wast
e G
en
era
ted
(kg
)
Breakdown of Solid Waste Generated by
Reusable vs Disposable Mask over 30 Days
Production Transport Usage End-of-Life
0
0.04
0.08
0.12
0.16
0 10 20 30
So
lid
Wast
e G
en
era
ted
(kg
)
Days
Solid Waste Break Even of Reusable vs
Disposable Mask
Disposable Mask
6 days to
break even
Reusable Mask (over 30 days)
A.W.L. Lee, E.R.K. Neo, Z.Y. Khoo, Z.Q. Yeo, Y.S. Tan, S.Y. Chng, W.J. Yan, B.K. Lok, J.S.C. Low (2021), “Life cycle assessment of single-use surgical and embedded filtration layer (EFL) reusable face mask”,
Resources, Conservation and Recycling, vol. 170, no. 105580, July 2021.
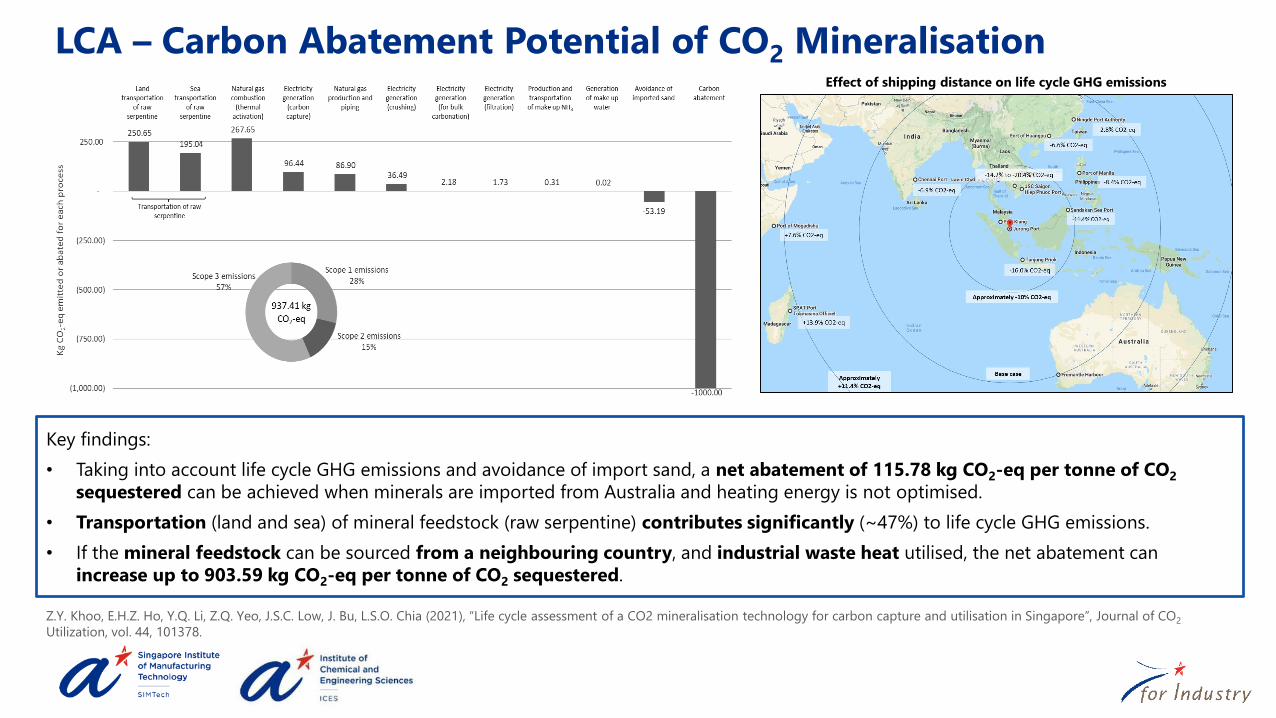
LCA – Carbon Abatement Potential of CO2 Mineralisation
Key findings:
• Taking into account life cycle GHG emissions and avoidance of import sand, a net abatement of 115.78 kg CO2-eq per tonne of CO2
sequestered can be achieved when minerals are imported from Australia and heating energy is not optimised.
• Transportation (land and sea) of mineral feedstock (raw serpentine) contributes significantly (~47%) to life cycle GHG emissions.
• If the mineral feedstock can be sourced from a neighbouring country, and industrial waste heat utilised, the net abatement can
increase up to 903.59 kg CO2-eq per tonne of CO2 sequestered.
Effect of shipping distance on life cycle GHG emissions
Z.Y. Khoo, E.H.Z. Ho, Y.Q. Li, Z.Q. Yeo, J.S.C. Low, J. Bu, L.S.O. Chia (2021), “Life cycle assessment of a CO2 mineralisation technology for carbon capture and utilisation in Singapore”, Journal of CO2
Utilization, vol. 44, 101378.
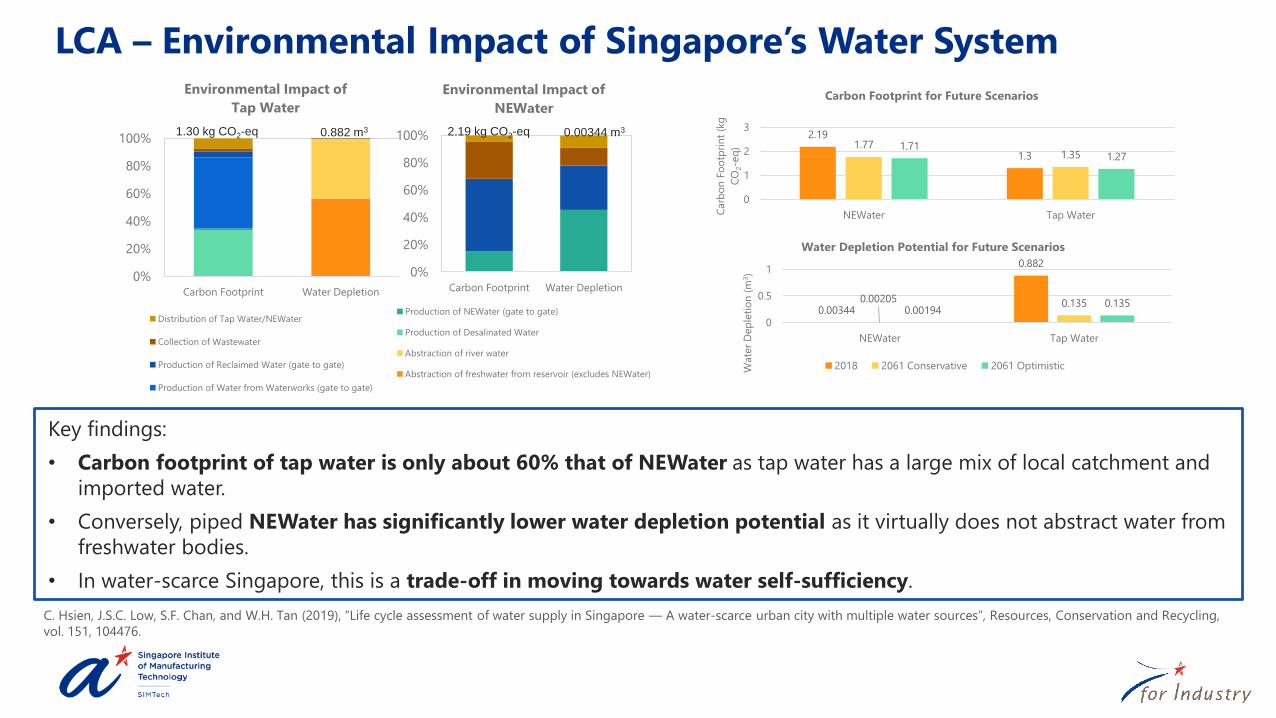
0.00344
0.882
0.00205 0.1350.00194
0.135
0
0.5
1
NEWater Tap Water
Wate
r D
ep
leti
on
(m
3)
Water Depletion Potential for Future Scenarios
2018 2061 Conservative 2061 Optimistic
LCA – Environmental Impact of Singapore’s Water System
C. Hsien, J.S.C. Low, S.F. Chan, and W.H. Tan (2019), “Life cycle assessment of water supply in Singapore — A water-scarce urban city with multiple water sources”, Resources, Conservation and Recycling,
vol. 151, 104476.
Key findings:
• Carbon footprint of tap water is only about 60% that of NEWater as tap water has a large mix of local catchment and
imported water.
• Conversely, piped NEWater has significantly lower water depletion potential as it virtually does not abstract water from
freshwater bodies.
• In water-scarce Singapore, this is a trade-off in moving towards water self-sufficiency.
0%
20%
40%
60%
80%
100%
Carbon Footprint Water Depletion
Environmental Impact of
NEWater
Production of NEWater (gate to gate)
Production of Desalinated Water
Abstraction of river water
Abstraction of freshwater from reservoir (excludes NEWater)
0%
20%
40%
60%
80%
100%
Carbon Footprint Water Depletion
Environmental Impact of
Tap Water
Distribution of Tap Water/NEWater
Collection of Wastewater
Production of Reclaimed Water (gate to gate)
Production of Water from Waterworks (gate to gate)
1.30 kg CO2-eq 2.19 kg CO2-eq 0.00344 m30.882 m32.19
1.31.77
1.351.71
1.27
0
1
2
3
NEWater Tap WaterCarb
on
Fo
otp
rin
t (k
g
CO
2-e
q)
Carbon Footprint for Future Scenarios
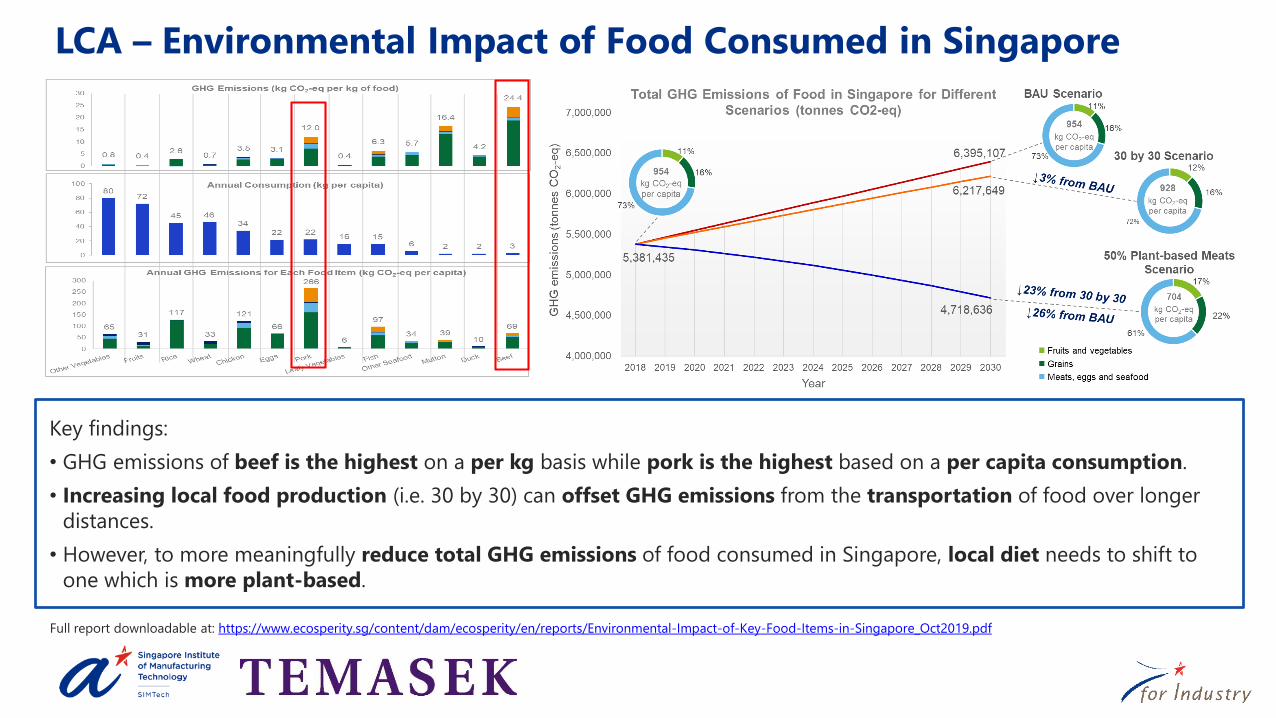
LCA – Environmental Impact of Food Consumed in Singapore
Full report downloadable at: https://www.ecosperity.sg/content/dam/ecosperity/en/reports/Environmental-Impact-of-Key-Food-Items-in-Singapore_Oct2019.pdf
Key findings:
• GHG emissions of beef is the highest on a per kg basis while pork is the highest based on a per capita consumption.
• Increasing local food production (i.e. 30 by 30) can offset GHG emissions from the transportation of food over longer
distances.
• However, to more meaningfully reduce total GHG emissions of food consumed in Singapore, local diet needs to shift to
one which is more plant-based.
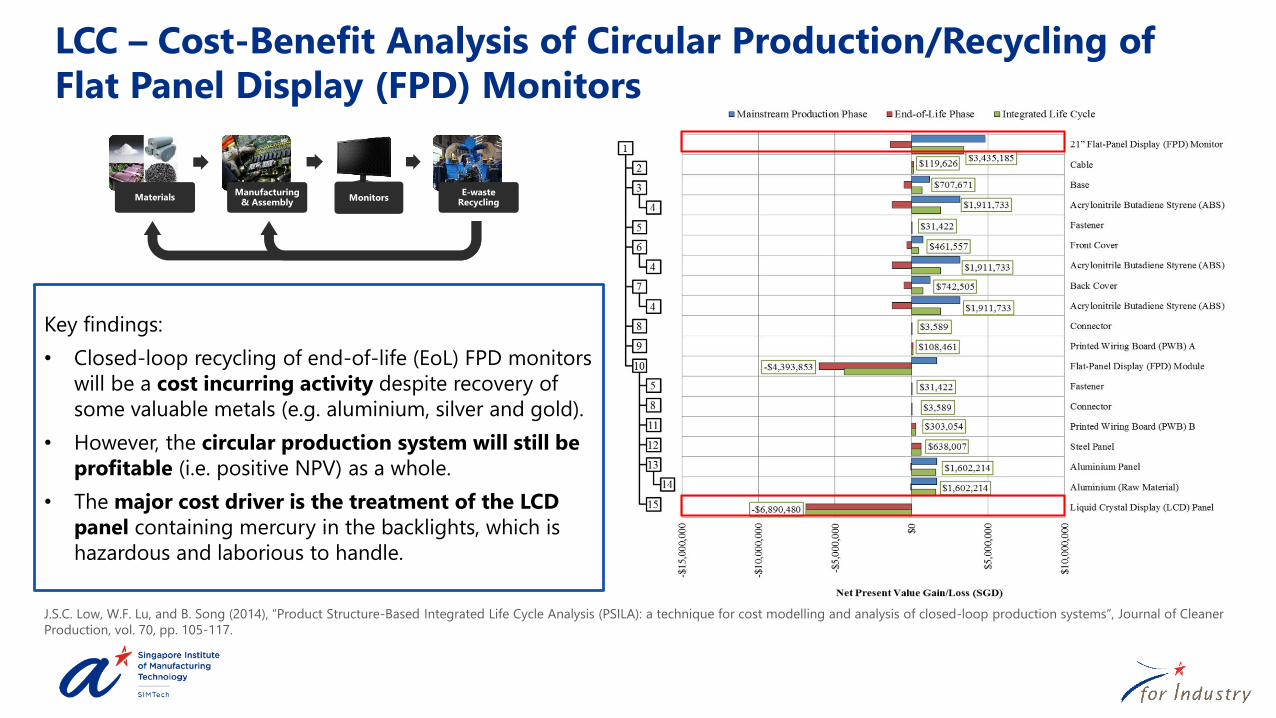
LCC – Cost-Benefit Analysis of Circular Production/Recycling of
Flat Panel Display (FPD) Monitors
J.S.C. Low, W.F. Lu, and B. Song (2014), “Product Structure-Based Integrated Life Cycle Analysis (PSILA): a technique for cost modelling and analysis of closed-loop production systems”, Journal of Cleaner
Production, vol. 70, pp. 105-117.
MaterialsManufacturing
& AssemblyMonitors
E-waste Recycling
Key findings:
• Closed-loop recycling of end-of-life (EoL) FPD monitors
will be a cost incurring activity despite recovery of
some valuable metals (e.g. aluminium, silver and gold).
• However, the circular production system will still be
profitable (i.e. positive NPV) as a whole.
• The major cost driver is the treatment of the LCD
panel containing mercury in the backlights, which is
hazardous and laborious to handle.

LCC – Designing a Remanufacturing System for Used PC for the
Cambodian Market
Key findings to optimise system:
• Despite the risks, the benefits of setting up the main
remanufacturing activity in Cambodia outweigh the costs
due to much lower CAPEX and OPEX in the long-term.
• A system designed with lower initial capacity –but with
allowance to expand – will be effective in mitigating market
risks.
• Implementing a flexible shift policy will further enhance the
system’s ability in mitigating such risks as well as agility in
capturing the upsides of market volatility.J.S.C. Low and Y.T. Ng (2018), “Improving the Economic Performance of Remanufacturing Systems
through Flexible Design Strategies: A Case Study Based on Remanufacturing Laptop Computers for the
Cambodian Market”, Business Strategy and the Environment, vol. 27, no. 4, pp. 503-527.
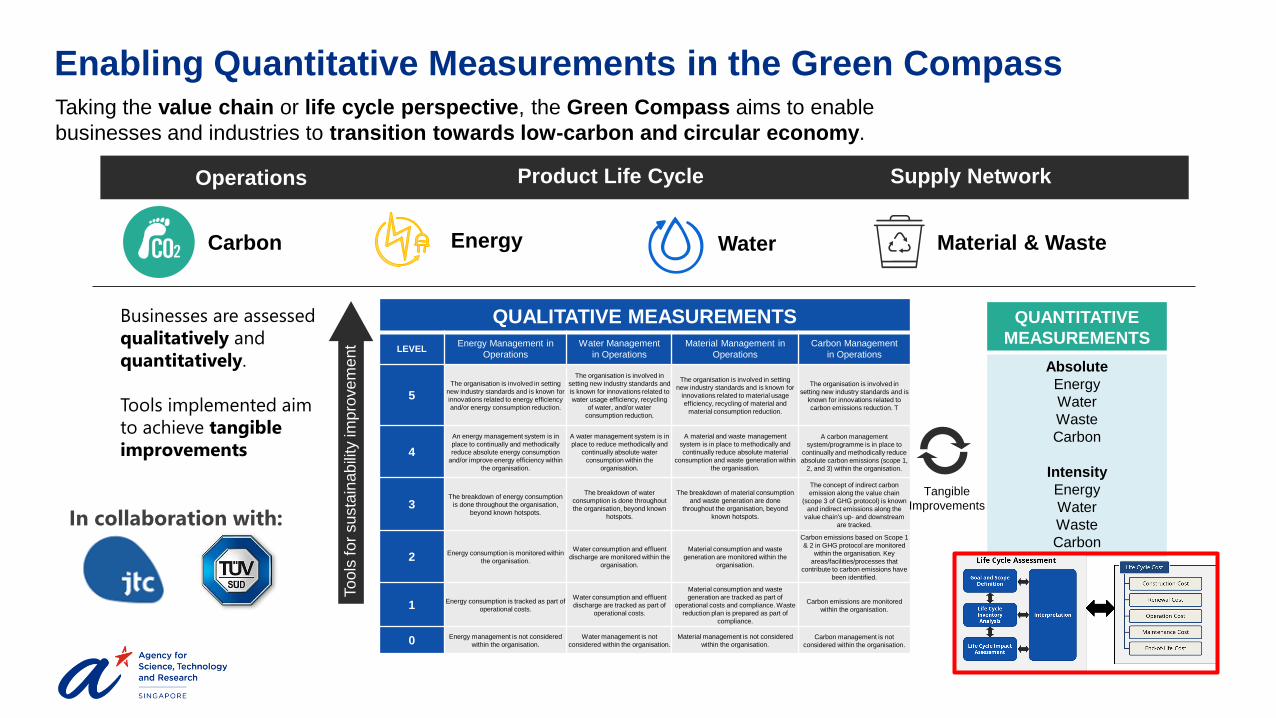
Enabling Quantitative Measurements in the Green CompassTaking the value chain or life cycle perspective, the Green Compass aims to enable
businesses and industries to transition towards low-carbon and circular economy.
QUALITATIVE MEASUREMENTS
LEVELEnergy Management in
Operations
Water Management
in Operations
Material Management in
Operations
Carbon Management
in Operations
5The organisation is involved in setting
new industry standards and is known for
innovations related to energy efficiency
and/or energy consumption reduction.
The organisation is involved in
setting new industry standards and
is known for innovations related to
water usage efficiency, recycling
of water, and/or water
consumption reduction.
The organisation is involved in setting
new industry standards and is known for
innovations related to material usage
efficiency, recycling of material and
material consumption reduction.
The organisation is involved in
setting new industry standards and is
known for innovations related to
carbon emissions reduction. T
4
An energy management system is in
place to continually and methodically
reduce absolute energy consumption
and/or improve energy efficiency within
the organisation.
A water management system is in
place to reduce methodically and
continually absolute water
consumption within the
organisation.
A material and waste management
system is in place to methodically and
continually reduce absolute material
consumption and waste generation within
the organisation.
A carbon management
system/programme is in place to
continually and methodically reduce
absolute carbon emissions (scope 1,
2, and 3) within the organisation.
3The breakdown of energy consumption
is done throughout the organisation,
beyond known hotspots.
The breakdown of water
consumption is done throughout
the organisation, beyond known
hotspots.
The breakdown of material consumption
and waste generation are done
throughout the organisation, beyond
known hotspots.
The concept of indirect carbon
emission along the value chain
(scope 3 of GHG protocol) is known
and indirect emissions along the
value chain's up- and downstream
are tracked.
2 Energy consumption is monitored within
the organisation.
Water consumption and effluent
discharge are monitored within the
organisation.
Material consumption and waste
generation are monitored within the
organisation.
Carbon emissions based on Scope 1
& 2 in GHG protocol are monitored
within the organisation. Key
areas/facilities/processes that
contribute to carbon emissions have
been identified.
1 Energy consumption is tracked as part of
operational costs.
Water consumption and effluent
discharge are tracked as part of
operational costs.
Material consumption and waste
generation are tracked as part of
operational costs and compliance. Waste
reduction plan is prepared as part of
compliance.
Carbon emissions are monitored
within the organisation.
0 Energy management is not considered
within the organisation.
Water management is not
considered within the organisation.
Material management is not considered
within the organisation.Carbon management is not
considered within the organisation.
To
ols
fo
r su
sta
inab
ility
im
pro
ve
me
nt
QUANTITATIVE
MEASUREMENTS
Absolute
Energy
Water
Waste
Carbon
Intensity
Energy
Water
Waste
Carbon
Tangible
Improvements
Operations Product Life Cycle Supply Network
Carbon Energy Water Material & Waste
Businesses are assessed
qualitatively and
quantitatively.
Tools implemented aim
to achieve tangible
improvements
In collaboration with:

Copyright © Singapore Institute of Manufacturing Technology
All Rights Reserved
Summary
Without life cycle thinking, what may seem like
a solution, could actually shift or create a new
problem.
Life Cycle Assessment (LCA) and Life Cycle
Costing (LCC) incorporates life cycle thinking to
measure sustainability of products, services and
entire ecosystems.
Applied systematically, they can support
collective and decisive action towards green
transformation.
Green
Compass