the use of critical process analysis to reduce risk and ... · analysis to reduce risk and increase...
TRANSCRIPT

The Use of Critical Process Analysis to Reduce Risk and
Increase Biologics Product Quality
Howard L. Levine, Ph.D. BioProcess Technology Consultants, Inc.FIP Quality International 2007 Conference
Critical Process Parameters in the Manufacture of APIs, Biologicals, Tablets, and Parenterals
London, UKNovember 26 – 27, 2007

From Clone to CommercialTM
What is Quality by Design?“Means that product and process performance characteristics are scientifically designed to meet specific objectives, not merely empirically derived from performance of test batches.”The product is designed to meet patient needs and performance requirementsThe process is designed to consistently meet product critical quality attributesThe impact of starting raw materials and process parameters on product quality is well understoodThe process is continually monitored, evaluated and updated to allow for consistent quality throughout product life cycleCritical sources of variability are identified and controlled through appropriate control strategies
Ref: H. Winkle, BPI Conference, Oct 1 – 4, 2007

From Clone to CommercialTM
Defining Critical Quality Attributes (CQAs)“…those molecular and biological characteristics found to be useful in ensuring the safety and efficacy of the product…” (Q6B)Can these attributes be defined?• Often difficult due to complexity of biologic products• Default is to look at many attributes
For QbD need to focus only on critical product attributes and the impact of those attributes across their ranges on safety and efficacy• Product specifications based on mechanistic
understanding of how formulation and process factors impact product performance
Need to develop a design space to be documented in application which is based on CQAs

From Clone to CommercialTM
Critical Process Parameters (CPPs)
CPPs are the independent process parameters most likely to affect the quality attributesDetermined by sound scientific judgment and based on research, scale-up or manufacturing experienceControlled and monitored to confirm that the impurity profile iscomparable to or better than historical data from development and manufacturingQuality attributes that should be considered in defining CPPsinclude:• Chemical purity• Qualitative and quantitative impurities• Physical characteristics• Microbial quality

From Clone to CommercialTM
Ran
ge o
f Raw
Mat
eria
lA
ndFa
cilit
y A
ttrib
utes
Process Designed toLimit Product Variability
Critical Process Parameters Drive Critical Quality Attributes and Create a Design Space
Define API in terms of CQAsIdentify CPP that affect these CQAsDetermine range of each CPP that produces acceptable product to establish the Design Space

From Clone to CommercialTM
Antibody Variability and CQA Challenge
Ref: Kozlowski and Swan (2006)
What is the impact of each CPP on the numerous variations possible
Which variants are important for product efficacy and patient safety?
From Clone to CommercialTM
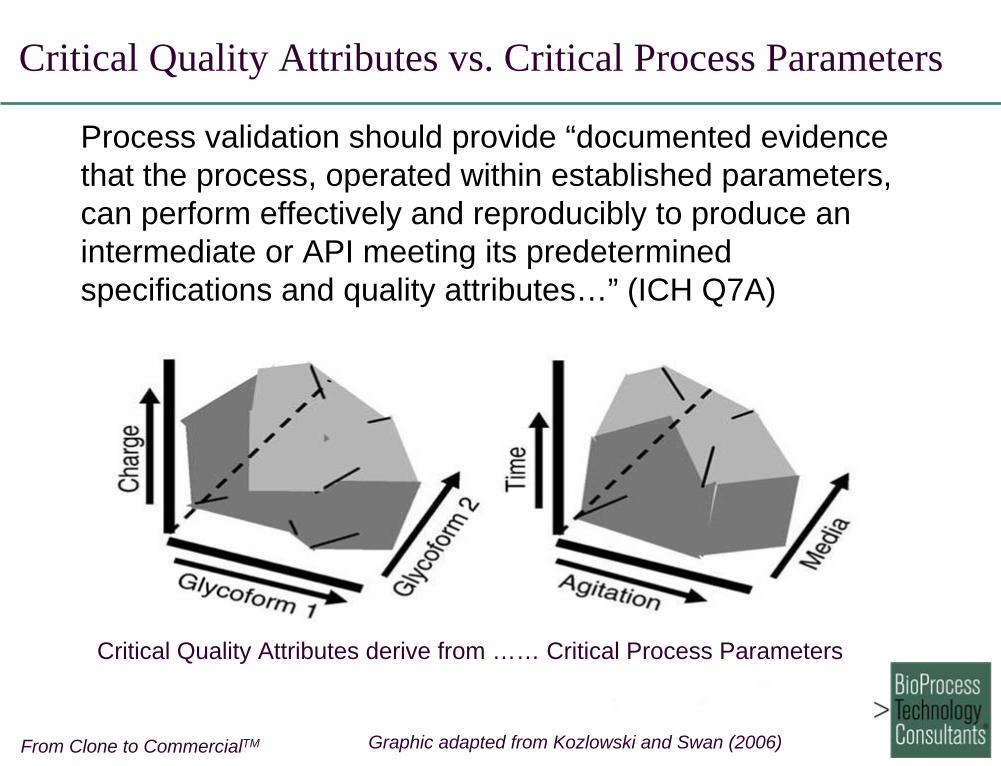
Critical Quality Attributes vs. Critical Process Parameters
Graphic adapted from Kozlowski and Swan (2006)
Process validation should provide “documented evidence that the process, operated within established parameters, can perform effectively and reproducibly to produce an intermediate or API meeting its predetermined specifications and quality attributes…” (ICH Q7A)
Critical Quality Attributes derive from …… Critical Process Parameters

From Clone to CommercialTM
Creating a Design Space: Identification of CPPs
Using data from development identify parameters that affect the defined product characteristics, for example• Level of Key Impurity• Desired Glycoform Content• Desired yield
Impurity 1
Gly
cofo
rm
Yield
Column Loading CapacityFl
ow R
ate
pH

From Clone to CommercialTM
Creating a Design Space: Optimize Process
Use Factorial Analysis without interactions to map boundary conditionsUse Full Factorial to fully define response surfaces and examine interactions
Column Loading Capacity
Flow
Rat
e
pH
Column Loading CapacityFl
ow R
ate
pH

From Clone to CommercialTM
Summarize results of multiple experiments to define response surface
Validate the process to demonstrate consistent production of product with desired characteristics
Creating a Design Space: Putting it All Together
Impurity 1
Gly
cofo
rm
Yield
[Fe] in Media
Agi
tatio
n R
ate
Final OD
Design Space

From Clone to CommercialTM
The Application of QbD to BiopharmaceuticalsQuality by Design is an important element in achieving desired state, however, we’re not there yet• Determining relationship between
−
Quality specifications and safety or efficacy results−
Clinical Activity and Critical Quality Attributes
−
Product Attributes and Critical Process Parameters−
Process Validation and the Design Space
• Insufficient Data on “Key” versus “Critical”• Strong Conservatism on both sides• Change must be regulated
“Traditional” process development and validation approaches can be applied to QbD, especially in identifying CPP and defining the Design Space

From Clone to CommercialTM
CPP Optimization in Cell Culture DevelopmentCritical Process Parameters in cell culture production…• Temperature• pH• Agitation• Dissolved oxygen• Medium constituents• Feed type and rate
Impact Critical Quality Attributes• Cell viability and number• Product titer• Product Characteristics (e.g. glycosylation)• Impurity profile
Two factorial design of experiment varying pH and temperature can help establish design space for product titer (yield)

From Clone to CommercialTM
Novo Nordisk Optimization of Cell Culture Conditions for Maximal MAb Yield
Optimization performed using SimCellTM technology from BioProcessors Corp.
2-Factor D.O.E.50 conditions (10 T x 5 pH)n=9 (450 total chambers)

From Clone to CommercialTM
Mapping a Downstream Process Design Space
Critical Process Parameters in column chromatography…• Column bed height and packing efficiency• Media selectivity• Dynamic capacity for product and total protein• Buffer conditions (pH, conductivity)• Temperature• Flow rate ranges• Sample load ranges• Media particle size and size range
All impact product purity and yield

From Clone to CommercialTM
Defining Ion Exchange Column Load ConditionsPurification of a natural protein by anion exchange chromatographyAnion exchange column equilibrated with 10 mM TRIS-Phosphate bufferVariation of load solution pH will impact product yield and purity
Product peak(s)

From Clone to CommercialTM
Anion Exchange Column Yield and Purity
Best yield at pH 7.0, however, additional contaminant present in pool not seen at higher pH’s
Can subsequent process steps remove this contaminant?
Product
Contaminant

From Clone to CommercialTM
Final Product PuritySubsequent purification of Anion Exchange Column pool removes process contaminant regardless of pH at which Anion Exchange column is run
A – Anion exchange column pool, pH 7.0B – Anion exchange column pool, pH 8.6
C – Column 2 pool following loading with “A”D – Column 2 pool following loading with “B”

From Clone to CommercialTM
Critical Process Parameters for MAb Purification
Parameter LoadDensity
FlowRate
BufferpH
BufferSalt
Specified Process
40 g/L 100 cm/hr 5.5 As specified
Load 10 g/L20 g/L30 g/L
Flow rate 50 cm/hr200 cm/hr
Buffer pH 5.45.6
Buffer salts + 5 mM- 5 mM
Ref: G. Blanks, Process Validation for Biologicals, 2001

From Clone to CommercialTM
Validation of Process Parameter RangesParameter CHOP (ppm) Monomer (%) DNA (log removal)
Control 10 99.5 >2.5Load:
10 g/L20 g/L30 g/L50 g/L
756
11
10010099.499.3
>1.9>2.2>2.42.3
Flow rate:50 cm/hr
200 cm/hr1311
99.499.3
>2.5>2.5
Buffer pH:5.45.6
1018
10098.5
>2.1>2.5
Buffer salts:+ 5 mM- 5 mM
520
99.199.5
>2.5>2.5
Ref: G. Blanks, Process Validation for Biologicals, 2001

From Clone to CommercialTM
Optimizing CPP in the Purification of Zevalin
Ref: Conley, McPherson and Thommes (2005)

From Clone to CommercialTM
Optimization of Process Parameter RangesCPPs identified during process development and operating ranges resulting in optimal purity and yield establishedDuring process validation product variability determined CPPswere operated at the center of and slightly beyond the normal operating range• Ensure process NOT operated at the edge of failure• Provides a data set for assessing potential manufacturing
excursions from the normal operating rangeExperiments run at the set point as well as upper and lower limit of the normal operating range for each CPP• CPPs normalized around the set point (X) ± desired operating
range • All of the CPPs for the other unit operations besides the unit
operation being investigated set at their defined “worst case” value (greatest chance of product failure)
From Clone to CommercialTM
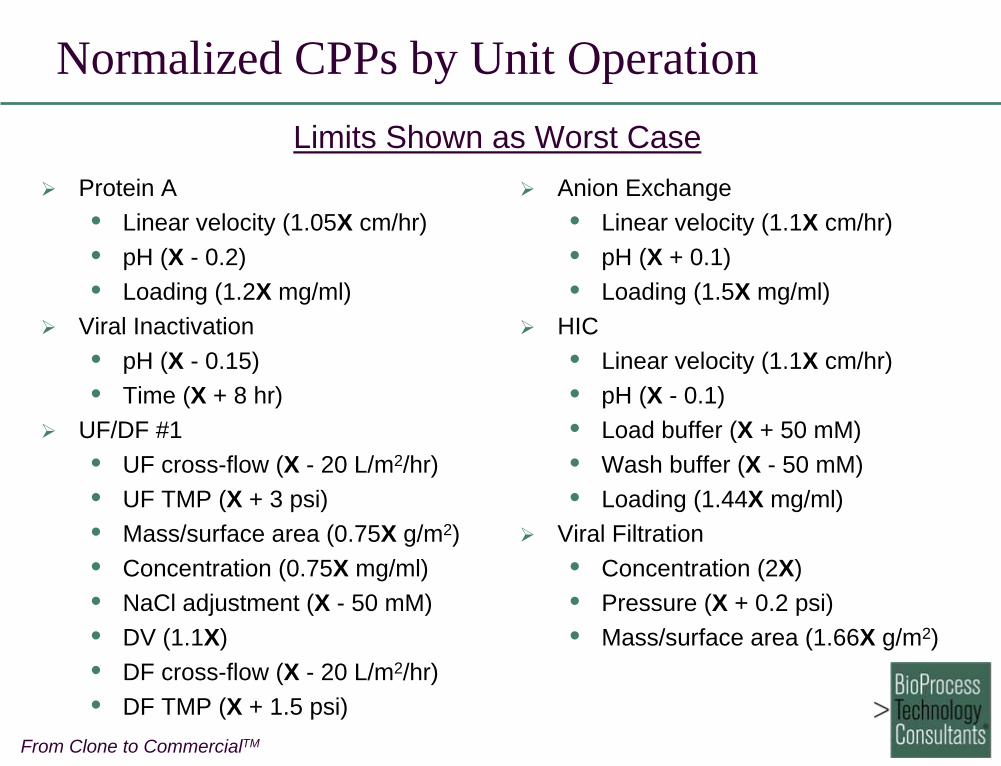
Normalized CPPs by Unit Operation
Protein A• Linear velocity (1.05X cm/hr)• pH (X - 0.2)• Loading (1.2X mg/ml)
Viral Inactivation• pH (X - 0.15)• Time (X + 8 hr)
UF/DF #1• UF cross-flow (X - 20 L/m2/hr)• UF TMP (X + 3 psi)• Mass/surface area (0.75X g/m2)• Concentration (0.75X mg/ml)• NaCl adjustment (X - 50 mM)• DV (1.1X)• DF cross-flow (X - 20 L/m2/hr)• DF TMP (X + 1.5 psi)
Anion Exchange• Linear velocity (1.1X cm/hr)• pH (X + 0.1)• Loading (1.5X mg/ml)
HIC• Linear velocity (1.1X cm/hr)• pH (X - 0.1)• Load buffer (X + 50 mM)• Wash buffer (X - 50 mM)• Loading (1.44X mg/ml)
Viral Filtration• Concentration (2X)• Pressure (X + 0.2 psi)• Mass/surface area (1.66X g/m2)
Limits Shown as Worst Case

From Clone to CommercialTM
Routine OperationalParameters
Proven Acceptable Range
Edges of Process Failure Factorial
Experimental Design
DOE Can be Used to Optimize Antibody Purification

From Clone to CommercialTM
Use of Scale Down Models to Optimize
CPP and Establish a Design Space
OptimizeCPP
Product ForcedDegradation
Studies
Process / ProductImpurityAssays
Scale DownProcess Models
Design SpaceEstablished

From Clone to CommercialTM
Impact of Four CPPs on IgG Capture Chromatography
Column load concentrationLoad timeDynamic binding capacityFlow rate
Sunil Chhatre, IMRC Bioprocess program – UCL UK
From Clone to CommercialTM
Summary and ConclusionsApplication of QbD to biopharmaceutical products is difficult due to the complexity of these products
Process development of biologics has always included some aspects of QbD, including science-based decisions, the use of scale down process models, and the definition of CPP
DOE can a useful tool to develop, define, and evaluate CPP ranges
Once optimized, CPP ranges can be used to define the design space for biologic manufacturing processes
Combining DOE with science-based decisions can decrease the time required to optimize production, speed the development of robust processes, and reduce risk in biologics product development
From Clone to CommercialTM
AcknowledgementsBioProcess Technology Consultants
• Sheila Magil, Ph.D.
• Susan Dana Jones, Ph.D.
BioProcessors, Inc.
• Cell culture optimization
Neurobiological Technologies, Inc.
• Chromatography optimization
Protherics Corporation
• DOE and Scale down models

From Clone to CommercialTM
For more information, contact
Howard L. Levine, Ph.D.BioProcess Technology Consultants, Inc.
289 Great Road, Suite 303Acton, MA 01720
978-266-9153978-266-9152 (fax)