the us. turkey Û-Î- industry
TRANSCRIPT

United States ÎÉAJii Department of t^^JÍ Agriculture
Economic Research Service
The US. Turkey Industry Û-Î-
Agricultural Economic Report Number 525
Floyd A. Lasley William L. Henson Harold B. Jones, Jr.

Sales Information
Additional copies of this report can be purchased from the Superintendent of Documents, U.S. Government Printing Office, 'Washington, D.C. 20402. Ask for The U.S. Turkey Industry. Write to the above address for price information or call the GPO order desk at (202) 783-3238 and charge the report to your Visa, Master- Card, or GPO Deposit Account. Discounts are available for purchases of more than
100 copies.
This report is part of a project by the National Economics Division (Economic Research Service, USDA) to identify the structural characteristics, operating prac- tices, and costs of production for the major meat animal industries in the United States. Reports published so far from the project include:
The U.S. Poultry Industry: Changing Economics and Structure, by Floyd A, Lasley. $3.25 from GPO at address above. Ask for stock number 001-000-04342-L
Characteristics of Farmer Cattle Feeding, by Roy N. Van Arsdall and Kenneth E. Nelson. $3.75 from GPO at address above. Ask for stock number 001-000-04361-7.
U.S. Hog Industry, by Roy N. Van Arsdall and Kenneth E. Nelson. $4.50 from GPO at address above. Ask for stock number 001-000-04408-7.
U.S. Beef Cow-Calf Industry, by Henry C. Gilliam, Jr. $2.75 from GPO at ad- dress above. Ask for stock number 001-019-00352-9.
Microfiche copies ($4.50 for each report) can be purchased from the National Technical Information Service, Identification Section, 5285 Port Royal Road, Springfield, Va. 22161. Enclose check or money order, payable to NTIS. For addi- tional information, call NTIS at (703) 487-4780.
The Economic Research Service has no copies for free mailing.

The U.S. Turkey Industry by Floyd A. Lasley, William L. Henson, and Harold B. Jones, Jr. National Economics Division, Economic Research Service, U.S. Department of Agriculture. Agricultural Economic Report No. 525.
Abstract
Americans are eating more turkey than ever because of lower real prices and new products. Production and consumption have expanded principally in the off season; both are now year-round activities. Further processed products represent the fastest growing sector of the industry. Turkey processors have expanded; the eight largest firms now process more turkey than the entire industry did in 1960. More turkeys are raised on fewer farms, with 1,608 farms selling 90 percent of all turkeys. About 53 percent are raised on farms selling an annual equivalent of 1,000 tons of live turkey.
KEYWORDS
Turkeys, poultry, prices, consumption, marketing, vertical integration, production
Washington, D.C. 20250 March 1985

Glossary
Brooder house: The brooder house is equipped with brooders (heating units) in which day-old poults (young turkeys) are started and kept for the first 6 weeks at which time they are moved to the growout house.
Confinement rearing: Poults are not permitted to run on range (pasture), but are confined within a house or small fenced apron alongside the house.
Finishing house (bam): The finishing house is used to confine poults from about 13 weeks of age until they are finished and ready to market. The finishing house is not heated and is less insulated, but more ventilated, than the brooder or growout house. Producers in the Midwest and West usually have fenced pens or aprons along both sides of the barn to provide more room for the birds as they grow larger.
Further processing: Turkeys are processed into products beyond the whole body or cutup parts-^for example, cooked products, turkey ham, turkey rolls, sausage, or salami.
Gradeout: The percentage of dressed turkeys graded as grade A. Eighty percent is usually Gonsidered standard.
jii >* Growout house (bam): The growout house is used to confine poults during their ^ g intermediate growing stagey from 6-IS weeks old. Many producers keep poults in H'^ S the growout house until they are ready for market, Growout houses have less in- b-^--î tr sulation than brooder houses, and many are unheated*
<*« « o ?^ s
0) u y c
-' ^â "tí -^ fL) )Z H3 w

Contents Page
Summary iv
Introduction 1
Production 1 Industry Output and Value 1 Areas of Production 1 Number of Farms and Output per Farm 5 Costs of Production 5 Regional Cost Differences 10 Costs and Returns 12
Simulated Costs and Prices 12
Processing 15
Number and Size of Plants 15 Concentration by Leading Firms 18 Concentration of Further Processing Firms 18 Processing Costs 19 Value Added by Manufacture 20 Seasonal Processing 21
Industry Coordination 25 Open Market Pricing 25 Direct Ownership 25 Contracts 27
Government Regulatory Influences on the Turkey Industry 29 Economic Regulation 30 Environmental, Health, and Safety Regulation 30 Social Regulation 31
Hatchery Structure, Output, and Pricing 31
Marketing 33 Supply and Utilization of Turkey Meat 35 Exports and Imports 35 Marketing Costs 35 Surplus-Deficit Areas 40 Product Form 41
Consumption, Demand, and Prices 45 Consumption Trends 45 Turkey Price Trends 45 Demand Relationships for Turkey 46
References 55
Appendix: Demand Equations for Turkeys 59

Summary
The U.S. turkey industry has skyrocketed from a modest enterprise with a gross farm value of $270 million in 1*950 to a thriving, complex agribusiness with a gross farm value of $1.26 billion in 1983, iSiew technologies have helped lower retail prices and have combined with industry marketing innovations to boost annual per capita consumption to 1Ï.2 pounds in 1983^ up from 8.0 pounds in 1970, 6.1 pounds in 1960, and only 1.7 pounds in 1935. Although most turkeys are eaten around the Thanksgiving-Christmas holiday season, turkey is now consumed year round. Less seasonality in production and processing results in a greater annual
volume of turkey from a given facility.
Industry innovation in marketing turkey through further processed products, such as turkey rolk, roasts, pot pies, and frozen dinners, has made further processing the fastest growing segment of the industry. Since 1980, further processed items have accounted for almost 40 percent of all turkey sales. SelHng prepacked turkey parts in smaller packages has also encouraged consumers to buy more turkey. Most major processors emphasize these value-added products to improve their profits.
Turkey-processing plants have been deereasing in number but growing in volume. The number of plants dropped from 281 in 1962 to lt5 in 1982, while the average turkey slaughter per plant rose firom 4.fl million to 26.8: miUion. ^e 20 largest firms operated 45 plants and slaughtered 87 percent of all turkeys in 1982 com- pared with 60 plants and 50 percent in 1962. The extent of growth in the industry is witnessed l3y the fact that the eight largest firms in 1982 processed more turkey
than did aH firms in 1960.
More turkeys are raised on fewer farms, with 1,608 of the existing 7,498 farms sell- ing 90 percent of all turkeys. About 53 percent are fed on farms selling an annual equivalent of 1,000 tons of live turkey. Gains from efficient production are passed on to consumers, who in turn have responded by buying more turkey, thereby pro- moting further expansion—for example, construction of new buildings, purchase of
new equipment, and development of new technolo^.
Although inflation has forced actual costs up since the^nergy crunch in 1973, real unit costs have dropped. The average real price of turkey meat at retail (measured in constant 1967 dollars) fell from 77 cents per pound in 1955 to 32 cents in 1982.
IV

The U.S. Turkey Industry
By Floyd A. Lasley, William L, Henson^ Harold B. Jones, Jr.
Introduction
The turkey industry offers a vivid example of how various agricuhural sectors are interrelated and depen- dent on one another. All segments of the turkey indus- try—producers, processors, hatcheries, geneticists, nutri- tionists, veterinarians, suppliers, marketing firms, and consumers—have combined to transform the industry from a minor sideline enterprise into a complex agribusiness.
Further processing and specialty products are the most rapidly growing part of the industry, making it possible for consumers to enjoy turkey in many forms throughout the year. However, many changes were required before this change was achieved. The traditional holiday bird consumption pattern was well suited to (and developed from) the spring hatching season. Processors and whole- salers stored frozen turkeys and most retailers displayed turkey only for the holiday season.
This report identifies some of the efficiency gains made by the turkey industry and describes the factors that caused or accompanied these gains. Circularity is often evident as adjustments made in response to one change sometimes lead to another. The long-term view provides insight into how the industry has developed by assimilat- ing change. The report also stresses the way the efficien- cy gains in production and marketing have been passed on to the consumer through lower real prices and a va- riety of new products.
Production
Turkey production is concentrated on large farm units. The 1982 Census of Agriculture reported 7,498 farms selling turkeys. The top 398 farms, each selling over 100,000 head, sold 53 percent of all turkeys. Farms in the South Atlantic region were the largest, averaging nearly 40,000 turkeys per farm, followed by those in the West North Central and Western regions.
Regional production in areas generally located some distance from population centers leads to some regions producing more than they consume while others produce less than they consume. Nearly 800 million pounds of turkey are shipped among regions in the United States. The New England, Mid-Atlantic, and East North Cen- tral regions produce less than they consume, whereas the West North Central and South Atlantic regions produce a surplus, which they ship to deficit areas. The South Central, Mountain, and Pacific regions produce about as much turkey as they consume.
Industry Output and Value
Production and marketing of turkeys has become big business. Output grew from 817 million pounds in 1950 to 1.5 billion pounds in 1960, 2.2 billion pounds in 1970, and 3.3 billion pounds in 1983 (table 1). Turkey production, although expanding rapidly, has varied widely year to year, leading to and resulting from marked price changes. The most dramatic annual pro- duction variation since 1950 was a 26-percent increase during 1960-61, followed by a 13-percent drop in 1962.
Farm prices increased gradually from the thirties to the late forties, then declined slightly throughout the fifties and sixties until 1973, when higher feed prices boosted costs, and retail turkey prices rose markedly along with worldwide inflation. Gross farm value of turkey produc- tion increased from $270 million in 1950 to $1.26 billion in 1983. Gross farm value increased more slowly than did production during the fifties and sixties because of the general decline in prices.
Areas of Production
Most of the Nation's turkeys are produced in relatively small areas of three regions: the North Central, the South, and the West. Production in all areas except New England and the Northwest has trended upward, but quite unevenly and with volatile, short-term fluctuations (table

Table l^—Turkey production, producer prices, and value of production
Production Average price
received
fäim
Year Live Pounds produced value of
Number weight
as percentage of preceding year by producers
production
Million Million pounds
Percent Cents/pound Million dollars
1935 20 298 99.5 20.1 59
193& 28 405 136.1 15.6 62
1937 25 376 92.7 18,1 69
1938 27 395 105.1 17.5 68
1939 33 494 125.1 15.7 72
1940 33 502 101.6 15.2 80
1941 32 512 102.0 19.9 101
1942 32 522 101.8 27.5 147
1943 31 509 97.6 32.7 162
1944 35 584 114.7 33.9 199
1945 42 740 126.8 33.7 245
1946 40 714 96.5 36.3 273
1947 34 611 85.5 36.5 236
1948 31 574 94.0 46.8 263
1949 41 769 134.1 35.2 267
1950 44 817 106.3 32.9 270
1951 53 950 116.2 37.5 351
1952 62 1.049 110.5 33.6 356
1953 60 1,008 96.1 33.7 340
1954 68 1,161 115.1 28.8 334
1955 65 1.091 94.0 30.2 329
1956 77 1.274 116.8 27.2 342
1957 81 1.356 106.4 23.4 319
1958 79 1,356 100.0 23.9 322
1959 84 1,433 105.7 23.9 345
1960 84 1.489 103.9 25.4 371
1961 107 1.871 125.7 18.9 356
1962 92 1.626 86.9 21.6 352
1963 94 1,686 103.7 22.3 377
1964 101 1.826 108.3 21.0 383
1965 106 1.915 104.9 22.2 424
1966 116 2.123 110.9 23.1 490
1967 126 2.343 110,4 19.5 458
1968 107 2,015 110.4 20.5 414
1969 107 2,029 100.7 22.4 455
1970 116 2.203 108.6 22.6 499
1971 120 2,264 102.8 22.1 501
1972 129 2,424 107.1 22.2 537
1973 132 2,451 101.1 38.2 936
1974 131 2,426 99.0 28.0 683
1975 124 2.277 93.9 34.8 793
1976 140 2.605 114.4 31.7 825
1977 136 2.562 98.3 35.5 910
1978 139 2.653 103.6 43.6 1.157
1979 157 2,958 111.5 41.4 1.226
1980 165 3,069 103.8 41.3 1,268
1981 171 3,260 106.2 38.2 1.246
1982 165 3.176 97.4 39.5 1.254
1983 170 3,316 105.1 38.0 1,261
Note: Italicized numbers in parentheses refer to items in the reference section at the end of this report.
Sources: (73, 75),

U.S. Turkey Industry
2 and fíg. 1). Led by North Garolina, the South Atlantic region has expanded most in recent years. After losing ground during the late fifties and early sixties, the South expanded output and now produces over 40 percent of our turkey supply.
Production continues to increase in the West North Cen- tral region, but has remained fairly level in the East North Central region since 1960 (11, 19) J The two North Central regions provided over half the Nation's turkeys in 1960, but now produce less than 40 percent. Although output has increased in the Mountain and Pa-
- Italicized numbers in parentheses in the text and tables refer to items in the reference section at the end of this report.
cific areas, the West's share of total production dropped from 30 percent in 1950 to less than 18 percent in 1982.
Changes in costs and relative profitability led to inter- regional shifts in turkey production. Low-cost feed ingre- dients gave the Midwest an early lead in turkey produc- tion, but many Midwestern producers have recently found it more profitable to devote their resources to other enterprises. Certain areas of the South Atlantic and South Central regions, with less productive soil and limited alternative employment opportunities, have found turkeys an attractive enterprise. These newer pro- duction areas use direct ownership and contract growers whereas independent growers, coordinated through mar- keting contracts, are more prevalent in the Midwest. In
Table 2—Regional production o£ turkeys and percentage change from preceding year, selected years
1959 1961 1965 ] 1970
Region Percentage Percentage Percentage Percentage
Number change from Number change from Number change from Number change from raised previous
year raised previous
year raised previous
year raised previous
year
Thousand Percent Thottsand Percent Thousand Percent Thousand Percent
North Atlantic 3,531 -3,1 3,601 8.1 3.265 5.2 3.102 8.8 East North Central 13,136 15.2 16,695 32.4 15,427 -1.2 14.573 17.2 West North Central 28,679 19.9 38.726 29.5 35,321 5.1 35.554 6.9 South Atlantic 12,069 .4 11.320 24.5 15.420 8.4 20,185 6.4 South Central 7,777 -6.1 11,085 33.1 13,487 13.6 17,421 21.2 West 19,301 -4.9 26,322 24.2 22,764 1.0 25.180 9.2 Other States^ NA NA NA NA NA NA 386 NA
United States 84.493 6.2 107,749 27.6 105,684 4.8 116.401 9.1
1975 1980 1982 1983 Percentage Percentage Percentage Percentage
Region Number change from Number change from Number change from Number change from raised previous
year raised previous
year raised previous
year raised previous
year
Thousand Percent Thousand Percent Thousand Percent Thousand Percent
North Atlantic 3,231 -6.8 6.012 14.6 5.834 -6.2 7.434 21A East North Central 14.009 -12.4 15,481 .8 17.929 4.8 18,033 .6 West North Central 39,549 -2.4 47,685 6.2 48,147 -.3 49.907 3.7 South Atlantic 25,742 -2.3 42,279 4.3 44,827 .3 46.716 4.2 South Central 17,315 -4.1 24,465 5.3 20,255 -15.5 19.850 -2.0 West 23,862 -8.5 28,495 5.8 27,519 -9.4 27.788 1.0 Other States^ 547 -14.9 326 5.2 NA NA NA NA
United States 124.255 -6.2 164.743 5.2 164,511 -3.7 169.728 3.2
NA = Not available.
^Florida. Montana, Idaho, Wyoming, New Mexico, and Arizona are combined to avoid disclosing individual operations.
Source: (73).

Lasley; Henson, and Jones
Figure 1
Poultry Prochictioñ-Marketing Regions
North Centrai
Northeast = New England and Middle Atlantic South = South Atlantic and South Central North Central = East North Central and West North Central West = Mountain and Pacific (excluding Hawaii and Alaska)
these established areas, the close coordination of produc- tion and marketing within specialized complexes, com- plete with a well-developed infrastructure of local sup- port services, now provides a competitive advantage.
North Carolina leads the turkey-producing States, fol- lowed by Minnesota, California, Missouri, and Arkansas (table 3 and fig. 2). These five States produced 57 per- cent of the total in 1983.
Produetion in North Carolina is centered in two areas, with some output being sent to Virginia's Shenandoah Valley area for slaughter. Minnesota's production is heavily concentrated in the central part of the State. Production in Arkansas is highly concentrated in the northwest corner of the State.
Production changes in these areas since the 1978 Agri- cultural Census further emphasize the pressures toward greater geographic concentration. Production tends to decline on the periphery of established production areas and increase in the heart of concentrated production areas. Production expanded very little outside established producing areas.
The leading counties further illustrate the degree of con- centration of turkey production (table 4). Duplin Coun- ty, N.C., continues to lead all counties after moving from 19th to first between the 1964 and 1969 Agricul- tural Censuses. Second place is held by neighboring Union County, which also moved up rapidly from 26th place in 1969. Fresno County, Calif, (third), and Rock- ingham County, Va. (fourth), were more consistent than

U.S* Turkey Industry
most counties in expansion. Stanislaus County, Calif., dropped from second in 1969 to 21st in 1978. McLennan County, Tex., had the most volatile ranking: in 1959, it was not in the top 40, rose to sixth in 1969, then dropped to 35th in 1978.
Number of Farms and Output per Farm
Turkey production has evolved from a secondary farm enterprise to a highly specialized industry over the past three decades. The number of farms producing turkeys, as listed in the Agricultural Census, dropped from 162,244 in 1949 to 88,399 in 1959 and to only 26,638 in 1978. Most of these farms produced just for home use, and by 1982 only 7,498 farms sold turkeys (table 5), w^ith the average in this group selling more than $200,000 worth of turkeys per year. During the past quarter cen- tury, most turkeys were produced on a relatively small number of farms. By 1982, one-third of the farms selling turkeys (2,436 farms selling more than 16,000 turkeys each) sold 96 percent of all turkeys. More than 50 per- cent of the turkeys were sold by the 398 farms selling more than 100,000 head (equivalent to 1,000 tons) il- lustrating how these farms developed into very large and specialized production units (11).
Agricultural Census data for all regions show that the number of farms producing turkeys fell, but the average size of the operation rose. Output per farm in 1978 was
greatest in the South Atlantic, West North Central, and Western regions (table 6). Average production per farm was lowest in the North Atlantic and East North Central regions, probably the result of a higher than average proportion of farms selling birds directly to consumers.
Costs of Production
Several factors influence the costs of producing turkeys; these may be grouped under efficiency factors or prices of inputs. Both factors have contributed to changes in costs of production over the past three decades (1). Tremendous gains were made in efficiency, but these improvements were sometimes overshadowed by price in- creases for feed and other production factors.
Four important cost components in production are poults, feed, labor, and physical facilities. Because feed repre- sents about 60 percent of total production cost, changes in feed efficiency or price will substantially affect costs.
Feed conversion has improved through better rations, improved selecting and breeding to produce birds with greater ability to convert feed to meat, improved hous- ing and management, and reduced mortality and morbid- ity. These improvements are evident by the reduction in feed per pound of gain from 4.87 pounds during 1955-59 to 3.01 during 1981-82 (table 7). In other words, 1 ton of feed produced 671 pounds of live turkey in 1982, or
Table 3—Leading States in U.S. turkey production
State Rank in turkey production
1983 1982 1981 1980 1975 1970 1960 1955
Number
North Carolina Minnesota California
1 2 3
1 2 3
1 2 3
2 1 3
2 1 3
3 1 2
12 2 1
16 2 1
Missouri Arkansas Virginia
4 5 6
5 4 6
5 4 6
5 4 6
5 4 6
5 6 9
5 11 4
8 13
3
Iowa Wisconsin Pennsylvania
7 8 9
7 9
10
8 10 11
8 11 10
8 9
11
7 12 15
3 6
13
4 10
9
Indiana Texas Colorado
10 11 12
8 U 12
9 7
12
9 7
12
10 7
12
8 4
12
9 7
14
11 5
21
Source: (75).

Lasley, Henson, and Jones
60 percent more than the 420 pounds of turkey produced in 1965.
Despite gains in production efficiency, the cost to pro- duce a pound of turkey has fluctuated widely on a year- to-year basis, largely because of changes in feed prices, especially during the past decade (6é, 67, 68) (see app. table 1).
Labor productivity has also benefited from improve- ments in feed efficiency, but technology, housing, and equipment have made the major gains. These gains per- mitted a grower to care for larger flocks and made labor more efficient. A farmworker spending 2,000 hours per year during 1976-80 could produce a half-million pounds of turkey, whereas a 1945-49 farmworker pro- duced only 15,267 pounds per year (table 7).
Figured
Housing and equipment used to produce a pound of tur- key have not been reduced as much as have feed and labor. Buildings and equipment generally substitute for labor and to some extent for feed because good housing improves feed efficiency by providing favorable tempera- ture and humidity. Automatic waterers and feeders sub- stantially reduce labor requirements per pound of out- put. Confinement rearing requires more housing but less labor than range growout. Confinement both facilitates and encourages year-round turkey production. It allows rearing four broods per year, which lowers costs by in- creasing output per square foot of brooding and growout houses. Lower mortality rates have also reduced brood- ing requirements per pound of turkey sold because fewer poults must be started to sell a given number of pounds of turkey. The changes from range to confinement grow- out makes direct comparisons of housing and equipment
Tiiilceys Sold in 1978
1 dot = 50,000 turkeys US, total = 141,302,966 turkeys
Source: f 7 7;,

U.S. Turkey Industry
Table 4—Leading counties in U.S. turkey production, selected years
Turkeys Rank
County Soldi Produced^
1982 1978 1974 1969 1959 1982 1978 1974 1969 1959
Number (thousand) - Number —
Duplin, N.C. 12,224 7,767 5,044 3,498 250 1 1 1 1 _ Union, N.C. 9,467 6,581 3,054 771 342 2 2 6 26 Fresno, Calif. 7,207 4,665 2,693 2,094 2,094 3 4 8 3 3 Rockingham, Va. 6,891 4,855 3,427 2,053 3,209 4 3 2 5 1 Stearns, Minn. 3,413 2,991 3,315 1,614 508 5 7 3 10 24 Barron, Wis. (D) 3,120 3,058 1,619 787 6 6 5 9 14 Dubois, Ind. 3,257 2,451 1,420 1,122 784 7 11 18 16 15 Benton, Ark. 3.216 2.948 1,655 1.259 280 8 8 15 15 -
Kandiyohi, Minn. 3,215 4,280 3,076 1,277 2,143 9 5 4 4 2 Weld, Colo. 3,186 2,242 2,371 1,466 248 10 12 9 11 — Madera, Calif. 2,717 1,416 2,190 1,386 696 11 22 12 13 17 Merced, Calif. 2,709 2.679 1,711 1,049 1,447 12 9 14 20 5 Otter Tail, Minn. 2,617 1,856 2,302 1,462 745 13 15 10 12 16 Franklin, Ark. 2,539 1,344 1,164 360 124 14 23 24 — _ Sanpete, Utah 2,328 2,502 1,913 1,687 877 15 10 13 8 9 Hamilton, Iowa 2,285 1,863 1,551 651 1,124 16 14 17 36 6
Todd, Minn. 2,143 934 441 503 48 17 33 _ _ _ Anson, N.C. 2,055 1,769 1,249 462 84 18 17 22 — — Carroll, Ark. 1,984 1,687 1.303 1,045 484 19 18 20 21 26 Miller, Mo. 1,950 1,825 1.255 1,108 212 20 16 21 17 Meeker, Minn. 1,761 1,514 985 431 189 21 19 28 — — Kings, Calif. 1,753 1,314 1,171 427 386 22 24 23 — — Morrison, Minn. 1,733 1,203 1,088 665 173 23 26 27 35 — Stanislaus, Calif. 1,677 1,417 2,203 2,707 1,452 24 21 11 2 4
Wayne, N.C. 1,655 602 205 72 45 25 Washington, Ark. 1,625 1,126 842 1.104 540 26 28 36 18 22 Sampson, N.C. 1,591 1.956 1,587 1,333 217 27 13 16 14 _ Pendleton, W.Va. 1,537 1,266 752 187 329 28 25 — — — Ottawa, Mich. 1,519 857 897 848 331 29 38 33 24 — Daviess, Ind. 1,509 734 629 434 273 30 — — — — Augusta, Va. 1,453 673 608 584 440 31 — — 39 23 Placer, Calif. 1,335 1,004 556 670 327 32 31 — 34 -
Shenandoah, Va. 1,286 887 716 742 885 33 37 28 8 Adams, Pa. 1,158 780 449 163 82 34 — — — — Gillespie, Tex. 1,154 (D) 752 213 173 35 — — — — Osage, Mo. 1,133 1,481 928 733 188 36 20 31 29 — Chesterfield, S.C. 1,120 939 976 704 124 37 32 29 31 — Becker, Minn. 1,118 806 842 409 409 38 40 35 — 31 McLennan, Tex. 1,112 925 475 1,901 58 39 35 — 6 _ Morgan, Mo. 1.033 897 1,106 567 60 40 36 25 — —
— = Not in top 40 counties that year. (D)= Withheld to avoid disclosing data for individual farms; assumed Barron, Wis., held 1978 ranking.
^Agricultural Census reported number sold in 1978 and 1974, number produced in 1969 and 1959.

Table 5^—Niiñiber of farms with turkeys raised or sold and number of turkeys report^» selected years
Turkeys sold per faim*
Farms reporting
Sales of Percentage disti ibtttion turkeys Farms Turkeys
1,000 Percent
234 63.3 0.1 289 1.3 .2
1,258 2.9 .7 S.794 4.4 2.2
10,984 6.7 6.4 32,346 10.3 18.8 32,232^ 5.8 18.7 90,898 5.3 52.8
172,035 100.0 100,0
273 61.7 .2 359 1.8 .3
1.735 4,2 1.2 4,904 5.8 3.5
11,543 7.4 8.2 29,110 9.6 20.6 28,658 5.3 20.3 64,721 4.2 45.8
141.303 100.0 100.0
302 31.7 .2 487 3.9 .4
2,377 9.6 1.9 7,371 14.7 5.9
12,595 13.3 10.1 26,115 14.6 20.9 21,529 6.7 17.3 53,963 5.4 43.6
124.738 100.0 100.0
219 71.0 .2 171 9.9 .2 162 2.6 .2 379 1.7 .4
1,127 1.6 1.1 3,750 2.5 3.6
98,942 10.8 94.5 104.750 100.0 100.0
685 82,5 .9 793 7,5 1.0 550 1.2 .7
1.370 1.3 1.7 3.566 1.7 4.4
17,149 3.4 21.3 56.285 2.4 70.0 80,398 100.0 100.0
1982: 1-1,999 2,000-3,999 4,000-7,999 8,000-15.999 16.000-29.999 30.000-59,999 60,000-99.999 100,000 or more
Total
1978: 1-1.999 2,2{)0-3.999 4.000-7,999 8,000-15.999 16.000-29,999 30,000-59,000 60.000-99,999 100,000 or more
Total
1974: 1-1.999 2.000-3,999 4,000-7,999 8,000-15,999 16,000-29,999 30,000-59,999 60.000-99.999 100.000 or more
Total
1964: 1-24 25-99 100-299 300-999 1.000-2.499 2,500-4.999 5,000 or more
Total
1959: 1-49 50-599 400-799 800-1,599 1,600-3.199 3,200-9,999 10,000 or more
Total
Number
4,745 98
219 329 499 771 439 398
7.498
4,485 128 305 421 538 701 389 304
7,271
1,398 173 425 648 584 645 294 240
4.407
29.719 4,124 1.070 691 681
1.046 4,531
41,862
72.910 6.667 1.035 1.191 1,476 2.976 2.144
88.399
^Data for 1978 are for 7,271 farms, the total number selling turkeys (5,328 of these were included as "over $2,500 in sales"); 1974 data are for farms with sales of $2,500 selling turkeys (7,224 farms reported turkeys); 1964 and 1959 data are for farms reporting turkeys raised. Different increments in number of turkeys sold reflect differences in how the Census survey data were reported.
^Estimated by authors; not shown by preliminary Census. Source: {77).

U.S. Turkey Industry
Table 6—Regional production of farms producing turkeys, total raised or sold, and average number per farm, selected years^
Item North East North West North South South
West United
Atlantic Central Central Atlantic Central States
Number
Farms reporting: 1959 4,523 5,550 13,659 14,741 38.118 10,121 86.712 1964 2,091 3,109 8,054 6,232 17.802 4,538 41,862 1969 544 936 1,624 708 872 740 5.424 1974 423 755 1,272 720 593 644 4.407 1978 678 906 1,286 927
Thotisands
765 766 5,328
Turkeys: 1959 3.492 13,164 27,735 11.778 7,376 18,970 82,517 1964 3,310 17,194 33.716 15,539 12.196 22.795 104,750 1969 2,885 14,328 30.632 17,576 15.442 22,592 103.455 1974 3,475 15.069 39,066 25,711 16,289 25,128 124,738 1978 4,530 15,082 41,240 36,657
Number
19,605 24.046 141,160
Turkeys per farm: 1959 772 2,372 2.031 799 194 1.874 952 1964 1,583 5,530 4.186 2.493 685 5,023 2,504 1969 5,304 15,307 18.862 24,826 17.708 30.530 19,074 1974 8,215 19,959 30,712 35,710 27,469 39,019 28.305 1978 6,681 16,647 32,068 39.544 25,627 31.392 26,494
^Turkeys sold from farms with annual sales of $2,500 or more for 1969, 1974, and 1978; 1964 and 1959 data for all farms reporting.
Souree: (77).
Table 7—^Turkey production efficiency factoid, selected years
Item Unit 1945-49 1955-59 1965-69 1976-80 1981-82
Feed per 100 pounds of turkey Labor per 100 pounds of turkey
Farm labor in total turkey production Turkey produced per hour of labor
Index of hours of labor in turkey production Index of turkey production per hour of labor
Pounds NA 487 441 319 301 Hours 13.1 4.4 1.3 A .3
Million hours 89.3 57.3 27.1 11.1 9.6 Pounds 7.6 22.7 76.9 250.0 333.3
100=1965-69 329.6 211.4 100.0 40.9 35.6 Do. 9,9 29.5 100.0 325.0 433,3
NA = Not available.
Sources: (60, 68).

Lasley, Henson, and Jones
costs for different time periods and regions difficult (15, 17, 31, 3^, 35, 39, 50, 59).
Newer brooder houses tend to be 50 feet wide and 250- feet long. Roofs and sides are generally insulated. Some use concrete floors, but most have dirt floors. Gas brooders dominate, although some Midwest growers use coal furnaces to reduce fuel bills. The overhead fan has quickly become standard equipment, also enabling grow- ers to reduce fuel bills and to maintain greater control over temperature and humidity. Most brooding and grow- out units are equipped with automatic feeders and waterers.
Building costs vary considerably with the Southeast and West Coast well below other areas, but most estimates for a brooder house in 1982 were close to $5-$6 per square foot, including equipment (about a third of the total). Depreciating the building over 20 years and the equipment over 7 years (straight line basis) would mean an annual depreciation of 44 cents per square foot. Al- lowing 1 square foot per poult placed, 10-percent mor- tality, and three broods per year would mean a brooder facility depreciation of 16 cents per poult raised. Raising four broods per year would lower depreciation to 12 cents per poult. Southeastern growers push this still lower by using brooding facilities five to six times per year.
Current recommendations feature a three-stage system using the brooder (brooding house), an intermediate growing house, and a finishing barn (house). Generally, poults are in the brooder through the 6th week, are transferred to the growing house through the 13th week, and then are moved to the finishing barn until market- ing at 16-22 weeks of age. Hen poults could be placed at the rate of 0.6 square foot per poult in the brooder, 1.2 square feet in the growing barn, and 2.4 square feet in the finishing barn. Toms would be allowed 1,2, and 3 square feet in the respective stages, with more space for those finished at heavier than 24 pounds. This three- stage plan uses the birds' body heat better and reduces both fuel and facility cost per pound produced. Al- though moving birds requires extra labor, the main disadvantage of the three-stage plan is that turkeys of two or three different ages are on the farm at the same time with no complete break between flocks.
Building and equipping new growout barns in 1982 for the more common two-stage system cost approximately
$3 per square foot, with the Southeast and West Coast perhaps 20 percent lower. These buildings were 50 feet wide, and 250-400 feet long to correspond with the brooder space.
Usually two or three growout barns are used in combina- tion with each brooder house. Most growers insulate the ceiling or roof and use side curtains. Finishing toms to 24 pounds liveweight requires about 2.5 square feet per bird, with many growers lowering the density by 10 per- cent and some allowing 3.5 square feet. Using the same schedule as for the brooder house and with equipment representing a third of the total facility cost, deprecia- tion costs on new growout barns are 8 cents per tom with three broods per year and 6 cents if four broods are raised.
Buildings and equipment for a typical two-stage produc- tion unit capable of brooding and growing out 20,000 hens or 15,400 toms per brood requires an investment of approximately $258,000. A 50- by 400-foot brooder house costs about $108,000, and three 50- by 335-foot growout barns cost approximately $150,000. The four buildings provide a total of 70,250 square feet (1.6 acres) of floor space.
Typically, growers have three broods of toms, four broods of hens, or two broods of each sex per year. This permits at least a 4-week vacancy between broods for the growout barns.
Regional Cost Differences
Production costs vary significantly among regions. Feed represents about 60 percent of the total cost of produc- ing live turkeys, and feed conversion rates differ rel- atively little from region to region. Therefore, feed price is the dominant factor in production cost differences among regions. Midwest growers, with plentiful grain available to mills from nearby farms, enjoy a feed price about $22 per ton below the average U.S. price. Grain in other regions is priced to feed mills at the appropriate terminal elevator price plus freight and handling, whereas grain to most Minnesota producers* mills is priced at the Twin Cities market price quote less transportation. Feed cost per pound of live tom turkey in 1982 averaged 22.20 cents in the Midwest, 26.73 cents in the South and East, and 28.12 in the West for an overall average of 25.18 cents (table 8).
10

U.S. Turkey Industry
The West has lower mortality rates for both toms and hens than other regions. Western producers also realize a higher proportion of grade A birds and a lower condem- nation rate than do growers in other areas. Because the cost comparisons in table 8 are based on net pounds live weight, the lower mortality and condemnation rates off- set some of the West's feed cost disadvantage.
Comparing costs among regions is difficult because of structural differences. Most Midwestern growers operate
as independent producers, buying the poults, feed, med- ication, and other inputs. Growers in the South and East (other than in Pennsylvania) generally grow birds under contract, in which case the grower provides the labx)r and facilities, and the contractor provides the poults, feed, and medication. Although both types of organiza- tion function in the West, data for this region are large- ly based on contract production. Costs in table 8 are shown for independent producers in the Midwest and for contractors in the other areas. Housing and equipment
Table 8-—Estimated turkey production costs by region, 1982
Unit
Toms Hens
Item South South and Midwest^ West^ Average and Midwest^ West^ Average East East
Average weight Pounds/bird 25.11 25.70 24.18 25.16 14.14 13.87 14.30 14.06 Age Weeks-days 20-2 19-6 19-0 20-0 16-4 16-2 16-3 16-3 Mortality Percent 11.35 11.30 9.50 10.90 7.86 8.50 5.10 7.56 Grade A do. 73.45 79.20 82.20 77.50 83.00 86.00 91.00 85.80 Condemns and DOA do. 2.03 3.98 1.52 2.71 1.25 1.80 1.00 1.42
Feed conversion Pounds feed/ pound gain
2.92 3,02 3.04 2.98 2,69 2.92 2.91 2.83
Feed price Dollars/ton 183 147 185 169 185 149 187 171
Feed cost Cents per 26.73 22,20 28.12 25.18 24,88 21.75 27.21 24,09 Poult cost pound net wt. 4.72 5.09 4.20 4.76 6.03 6.42 5.92 6.16 Medication do. .45 ,78 ,41 .57 .42 .85 .41 .59 Litter do. .40 .28 .82 ,44 .44 .30 .81 .46 Fuel do. .58 1.36 .55 ,88 .74 1,52 ,72 1.05 Insurance do. .11 .17 .14 .14 .09 .14 .12 .12 Interest do. 1.49 1.80 1.73 1.66 1.44 1.70 1,56 1.57 Miscellaneous do. .36 .16 .34 .28 .41 .37 .40 .39
Live haul do. 1.60 1,60 1.50 1.58 1.60 1.60 1.50 1.58
Flock service do. .49 .49 .49 .49 .55 .55 .55 .55 Hired labor^ do. — 1.67 — 1.67 — 2.16 _ 2.16 Grower fee^ do. 4.17 - 4.64 4.33 4.82 - 5.92 5.19
Building and equipment:^ Depreciation Dollars 1.18 2.01 .80 1.44 1.13 1.57 .72 1.22 Repair and taxes do. .20 .85 .30 .48 .19 .77 .30 .44 Interest do. .74 1.10 .57 .85 .59 .88 .46 .68 Electricity do. .20 .24 .15 .21 ,20 ,24 .15 ,21
Total'* do. 41,10 39.80 42.94 40.95 41,42 40,82 45.12 41.92
DOA = Dead on arrival. — = Not applicable. ^Midwestern costs are estimated for independent producers; costs for other regions are estimated for contract producers (integrators). ^Western producers often brood straight run poults, separating them by sex after brooding. Grower fee includes labor, building, and equipment. No return or charge is made for Midwest growers' labor.
^Aggregate total weighted to account for independent and contract production.
Source: Data provided by hatcheries, processors, growers, contractors, and specialists at various universities.
11

Lasley, Henson, and Jones
represent fixed costs for both independent and contract growers, but are cash costs for the contractor as these and the growers' labor costs are included in the fee paid to growers by the contractor. Hired labor costs are shown for independent Midwestern growers at the rate paid by those using hired labor, but no charge was made for growers' labor. Hired labor is not shown (even though used) for contract production because labor is in- eluded as part of the growers' fee.
Severe winter weather requires Midwestern producers to use higher cost, environment-controlled housing, although some Eastern and Southern growers are also using envi- ronmentally controlled housing. Confinement rearing in- creases total housing costs compared with range systems for a given flock capacity, but on an annual basis con- finement rearing costs can be more than offset by in- creased output per unit of capacity with year-round pro- duction and lower per-unit labor and feed requirements. Midwestern and Western growers generally use fenced aprons or runs on either side of the growing barn, thereby increasing growout capacity. Midwestern winter weather limits this practice so that growout capacity is reduced during the. winter months.
Midwestern producers are therefore not as time-flexible as those in other areas. If they house poults too early to use their aprons for growout, they will reduce their an- nual output. This seasonal aspect also influences process- ing schedules and costs, creating a tendency for growers to schedule placements at the same time, adding consid- erably to the problem of coordinating processing and marketing. Processing schediiles in the Midwest are more difficult to fill during mid^pril, because having a 14,000-bird flock ready at that time means growers must sacrifice 40,000 birds later in the season if they are to move their last brood to slaughter by mid-November (3, 4, 13, 14, 20, 38, 32, 63),
Costs and Returns
Net returns for whole turkeys varied markedly during the 1955-83 period. Highest returns, 17.2 cents per pound ready-to-cook (RTC), were realized in 1978. Four years of high returns in 1977-80 were followed by losses of 3.0 cents per pound. Producers suffered net losses in 8 of the 29 years between 1955 and 1983 (table 9).
ProductioTi costs for live turkeys increased substantially only twice during the past three decades —in 1973 and in 1979-81. These were periods of rapidly rising feed costs
due to higher feed prices. Feed prices have historically helped stabilize production costs. Production costs other than feed doubled during the 29 years, slowly rising from a low of 5.7 cents per pound in 1961 to a high of 13.2 cents per pound in 1983.
Marketing costs to transform live turkeys on the farm into RTC turkey at the wholesale level steadily rose to 15.7 cents per pound RTC in 1983, up from 6.9 cents in 1965.
Total costs to wholesale varied from 32.9 cents in 1965 and 1968 to a high of 67.2 cents in 1981. Turkey pro- duction suffered net losses in both the lowest and highest cost years, 1968 and 1981. Changes in net returns were more closely associated with changes in wholesale prices than in costs. During the 1955-83 period, net returns and prices moved in the same directions all but 4 years, but net returns and costs moved in different directions 13 years. The average change in annual costs was 2.2 cents overall, 2.6 cents for the 16 times costs increased, and 1.7 cents for the 12 times costs decreased. Wholesale price changes averaged 5.2 cents. Prices gained in 10 years (averaging 7.4 cents) and dropped in 17 years (averaging 3.9 cents). The average change was 5.2 cents for net returns, 5.7 cents for the 11 gains, and 4.8 cents in the 16 years returns declined.
Simulated Costs and Prices
Improved technology in turkey production and market- ing has lowered real prices for turkey meat during the past two decades. Plentiful supplies of high-quality pro- ducts are now available year round. The industry has been a leader in making technical and organizational improvements in production and marketing and has passed these benefits on to consumers.
Simulating costs and prices offers a way to describe some of the changes in these economic relationships over time. We can estimate the cumulative effect of productivity gains by the turkey industry by assuming that technology is held constant and by allowing input costs to vary directly with changes in their market prices. We can thus simulate costs and product prices and then compare them with actual prices to illustrate the technological gains realized and passed on to consumers. Technology and input-output ratios are held constant at the 1960 level, and inputs are valued at actual average annual
12

U.S. Turkey Industry
prices. We set the base at the 1960 level because bench-
mark data were available and price relationships were
relatively stable, although some major industry changes
had already begun.
During 1960-72, relatively stable feed prices helped
stabilize production costs as feed prices increased the
cost per pound of turkey by only 2 cents (table 10).
Then, in 1973, feed prices increased dramatically,
boosting feed costs 10 cents per pound of turkey in 1
year. Feed prices rose again in 1979-81, adding another
10 cents to costs. Without the efficiency gains, these
1960-81 feed price increases would have tripled the feed
costs per pound of turkey. Cumulative gains in feed effi-
ciency, however, offset half the effect of feed price in-
creases so that feed costs only doubled.
Table 9—Annual cost and returns for turkeys
Year
Live turkey production costs
Feed Other Total
Ready-to-cook turkey
1955 20.0 1956 19.1 1957 18.3 1958 17.8 1959 18.0
1960 15.6 1961 15.2 1962 15.0 1963 15.1 1964 14.6
1965 14.4 1966 14.7 1967 14.3 1968 13.2 1969 13.5
1970 14.0 1971 13.3 1972 13.5 1973 25.6 1974 22.5
1975 22.1 1976 22.4 1977 22.6 1978 22.1 1979 25.3
1980 26.0 1981 30.5 1982 24.5 1983 26.1
7.0 6.7 6.3 6.1 5.9
5.8 5.7 5.9 6.0 6.2
6.4 6.5 6.6 6.6 6.7
6.8 6.9 7.0 7.5 8.2
8,6 9.0 9.0 9.6
10.5
11.0 11.6 11,8 13.2
27.0 25.8 24.6 23.9 23.9
21.4 20.9 20.9 21.1 20.8
20.8 21.2 20.9 19.8 20.2
20.8 20.2 20.5 33.1 30.7
30.7 31.4 31.6 31.7 35.8
37.0 42.1 36.3 39.3
Production cost^
Marketing cost
Cents per pound
33.8 8.8 32.3 8.6 30.8 8.3 29.9 8.3 29.9 7.9
26.8 7.6 26.1 9.7 26.1 7.6 26.4 7.4 26.0 7.1
26.0 6.9 26.5 7.9 26.1 9.4 24.8 8.1 25.3 8.2
26.0 8.3 25.3 8.4 25.6 8.5 41.4 9.2 38.4 , 10.5
38.4 11.0 39.3 11.6 39.5 11.9 39.6 12.1 44.8 13.4
46.3 14,6 52.6 14.6 45,3 14.8 49.1 15.7
Total cost to
wholesale
42.6 40.9 39.1 38.2 37.8
34.4 35.8 33.7 33.8 33.1
32.9 34.4 35.5 32.9 33.5
34.3 33.7 34.1 50.6 48.9
49.4 50.9 51.4 51.7 58.2
60.9 67.2 60.1 64.8
Wholesale price
47.9 45.0 39.0 42.5 37.6
43.5 35.6 34.8 36.5 33.6
37.0 38.0 33.5 32.4 36.3
40.9 37.5 36.6 64.5 47.0
55.1 51.0 56.2 68.8 67.0
64.6 64.2 62.2 62.5
Net returns
5.3 4.1 -.1 4.3 -.2
9.1 -.2 1.1 2.7
.5
4.1 3.6
-2.0 -.5 2.8
6.6 3.8 2.5
13.9 -1.9
5.6 .1
4.8 17.2 8.8
3.7 -3.0 2.1
-2.3
1 Production cost is calculated by the division of live production cost by the dressing percentage to convert to a ready-to-cook basis. Net returns are to production and marketing through the wholesale level.
Source: (68).
13

Table 10—Simulated retail prices and costs of producing and marketing turkeys^
Simulated costs and farm value, live weight Simulated marketing costs, RTC basis
Year Feed cost
Nonfeed costs
Returns
1955 16.9 5.3 1956 16.6 5.4 1957 16.4 5.6 1958 16.4 5.8 1959 16.3 5.8
1960 15.6 5.8 1961 15.7 5.8 1962 15.9 5.8 1963 16.3 5.8 1964 16.2 5.8
1965 16.3 5.9 1966 16.5 6.1 1967 16.5 6.2 1968 15.8 6.4 1969 16.2 6.6
1970 17.1 6.8 1971 17.5 7.0 1972 17.8 7.3 1973 28.7 7.9 1974 31.4 9.1
1975 30.3 10.1 1976 31.5 10.5
1977 33.4 11.2 1978 33.1 12.1
1979 36.7 13.4
1980 40.5 15.3
1981 45.2 16.9
1982 41.6 17.2
6.1 6.2 6.4 6.5 6.6
6.7 6.8 6.8 6.9 7.0
7.1 7.3 7,6 7.9 8.3
8.8 9.2 9.5
10.1 11.2
12.2 12.9 13.7 14.8 16.4
18.6 20.6 21.8
Farm value
28.3 28.2 28.4 28.7 28.7
28.1 28.3 28.5 29.0 29.0
29.3 29.9 30.3 30.1 31.1
32.7 33.7 34.6 46.7 51.7
52.6 54.9 58.3 59.9 66.5
74.4 82.7 80.6
Farm value
36.5 36.3 36.6 37.0 37.0
36.2 36.5 36.7 37.4 37.4
37.7 38.5 39.0 38.8 40.1
42.1 43.4 44.6 60.1 66.6
67.8 70.7 75.1 77.2 85.7
95.8 106.6 103.9
Labor Energy
Cents/pound
5.0 5.3 5.6 5.9 6.1
6.4 6.6 6.8 7.0 7.2
7.4 7.6 8.0 8.5 9.0
9.6 10.3 10.9 11.6 12.6
13.9 15.1 16.3 17.6 190
20.8 22.6 24.0
2.3 2.3 2.5 2.4 2.4
2.4 2.4 2.4 2.4 2.3
2.4 2.4 2.5 2.5 2.5
2.7 2,9 3.0 3.4 5.2
6.1 6,6 7.5 8.1
10.2
14.3 17.3 17.3
Packaging and
materials
1.8 1.9 2.0 2.1 2.1
2.1 2.1 2.1 2.1 2.1
2.1 2.2 2-2 2.3 2.3
2.4 2.6 2.7 2.8 3.3
3.8 4.0 4.2 4.7 5.2
5.8 6.2 6.4
Overhead and
other
7.7 7.9 8.2 8.4 8.3
8.4 8.4 8.4 8.4 8.4
8.6 8.9 90 9.2 9.6
9.9 10.2 10.5 11.5 13.2
14.6 15.3 16.2 17.4 19.4
22.1 24.4 25.2
Total marketing
16.8 17.4 18.3 18.8 18.9
19.3 19.5 19.7 19.9 20.0
20.5 21.1 21.7 22.5 23.4
24.6 26.0 27.1 29.3 34.3
38.4 41.0 44.2 47.8 53.8
63.0 70.5 72.9
Simulated retail price^
53.3 53.7 54.9 55.8 55.9
55.5 56.0 56.4 57.3 57.4
58.2 59.6 60.7 61.3 63.5
66.7 69.4 71.7 89.4
100.9
106.2 111.7 119.3 125.0 139.5
158.8 177.1 176,8
Actual retail price
61.6 56.9 53.5 52.6 51.5
55.5 44.8 49.0 49.4 49.4
49.8 50.7 47.0 48.7 52,8
55.8 56.3 56.6 90.3 71.4
78.3 78.2 81.4 87.7 88.2
95.7 92.7 92.5
en
ft
P
«—I o
RTC = Ready-to-cook. ^Simulated by holding technology and inputs constant at the 1960 level and passing through the input price changes. 2price needed to cover costs based on 1960 technology and input-output relationships, with inputs valued at current prices.
Source: (35).

U.S. Turkey Industry
Nonfeed costs also have risen less rapidly than have the prices of these inputs. Returns to producers per pound of turkey (liveweight) in 1982 was approximately 40 cents, about 10 cents above the 1960 level, but just half what it would have been if it had kept pace with rising input prices.
Improved efficiency in marketing has cushioned the ef- fect of inflation. Wage rates in the food industries have almost quadrupled; fuel and energy is up sevenfold; and packaging prices have tripled since 1960. Passing these price increases through the system would have boosted marketing costs to 73 cents per pound in 1982; however, actual marketing costs were only 43 cents.
Simulated production and marketing costs totaled a 1982 retail price of |1.77 per pound; yet, consumers paid only 92.5 cents. Technical and organizational im- provements made producers far more efficient than their 1960 counterparts. This gain, plus part of the reduced returns per pound, has been passed on to the consumer (23, 33, 34),
Processing
The turkey processor is generally the integrator, coor- dinating all stages of production and marketing through direct ownership and contractual arrangements. Turkey processing plants tend to be relatively large and special- ized, a major change from the earlier sideline slaughter- ing of turkeys in chicken processing plants during their slack seasons.
Number and Size of Plants
Turkey processing plants continue to drop in number and grow in volume (table 11). Only 128 plants slaugh- tered turkeys in 1981; this number dropped to 115 in 1982, down from 156 in 1980 and from 281 in 1962. Spe- cialized turkey plants have nearly replaced seasonal slaughtering of turkeys by other plants, a common prac- tice in the midsixties.
Only 7 percent of the Nation's turkeys are now processed in dual slaughter plants. In 1982, processors operated 30
Table ^^"^^^^^^^^^ ^^^^^y processing plants and annual average pounds slaughtered per plant, by region, selected
Item
Processing plants:
North Atlantic East North Central West North Central South Atlantic South Central West
United States
Average live turkeys per plant:
North Atlantic East North Central West North Central South Atlantic South Central West
United States
1981 1972 1970 1968 1965 1962
Number
36 27 21 27 31 37 19 25 28 34 43 62 28 41 36 46 52 67 10 17 20 25 28 32 9 20 19 27 32 36
26 33 32 34 38 47
128 163 156
1,000 pounds
193 224 281
3,577 2,107 2,367 1,593 1.591 946 16,873 9,803 8,275 6,115 4,629 3,046 35,917 18.923 17,073 12,802 11.518 6,949 72,926 22,249 15,733 11,212 6,966 3,457 35,687 15,731 15,350 10,527 7,222 4,013 22,137 15,425 15,183 12.586 10,394 9,246
23,922 13,986 12.745 9,494 7,448 4,908
Source: 1981 data compiled from unpublished U.S. Department of Agriculture's Food Safety and Inspection Service data; prior years from (60)
15

Lasley, Henson, and Jones
plants slaughtering both turkey and chicken which pro- cessed 227 million pounds of turkey (liveweight), 408 million pound of broilers, and 29 million pounds of fowl. Five of these plants slaughtered predominantly turkey and 25 slaughtered predominantly chicken. Eight major processors operated 10 of these plants, which pro- cessed 96 percent of the turkey and 78 percent of the chicken slaughtered by all dual plants. Of the remaining dual plants, 9 could be classed as specialty meat vendors and the other 11 as grower-processors; these 20 plants slaughtered about 9 million pounds of turkey, 74 million pounds of broilers, and 28 million pounds of fowl.
Plant numbers have declined more rapidly in regions of heavy production (fig. 3). The North Atlantic region now has about the same number of plants as it had in 1962. Northeastern plants tend to be small and several are operated seasonally by grower-processors, primarily to process for the fresh market. The 10 smallest plants in
the United States each slaughter less than 1,000 pounds per year, and 6 of these plants are in the North Atlantic region (the only region without a plant slaughtering over 50 milHon pounds per year).
Average volume per plant is greatest in the South Atlan- tic region where the 10 plants average almost 73 million pounds each. Plants in the West North Central and South Central regions average almost 36 million pounds, just half the volume of the South Atlantic group. Plants in the larger size group account for an increasing share of the total volume processed for all regions (table 12).
Four plants slaughtered more than 100 million pounds each in 1981, and 20 others slaughtered more than 50 million pounds. The 16 largest plants processed 50 per- cent of the total volume, and the top 50 plants processed
almost 95 percent (8, 12, 16, 48).
Figure 3
Turkey Plants Slaughtering 20,000 Head or More In 1982
• Plant location
16

U.S. Turkey Industry
Table 12—Turkey processing plants under Federal inspection and annual slaughter volume (liveweight), by region and plant size, selected years, 1962-81
Plants with annual volume (in 1,000 pounds) Annual volume (in 1,000 pounds) Year and Less than 5,200- 15,600 Less than 5,200- 15,600 region 5,200 15,599 pounds Total 5,200 15,599 pounds Total
pounds pounds and over pounds pounds and over
— Number -- Million pounds
1981: North Atlantic 31 2 3 36 17 107 124 East North Central 11 1 7 19 10 284 294 West North Central 5 2 21 28 2 937 939 South Atlantic 1 1 8 10 2 701 701 South Central 2 1 6 9 2 321 321 West 11 5 10 26 5 561 566
United States 61 12 55 128 34 (108)1 2,911 2,945
1972: North Atlantic 23 4 0 27 14 43 0 57 East North Central 16 3 6 25 16 28 200 244 West North Central 11 7 23 41 3 88 686 777 South Atlantic 5 3 9 17 4 28 346 378 South Central 10 3 7 20 11 27 277 315 West 11 10 12 33 8 113 388 509
United States 76 30 57 163 56 327 1,897 2,280
1970: North Atlantic 17 4 0 21 13 37 0 50 East North Central 15 8 5 28 16 74 142 232 West North Central 7 12 17 36 7 161 446 614 South Atlantic 9 3 8 17 10 3 261 271 South Central 10 5^ 7 22 20 63» 252 335 West 10 12 10 32 17 146 323 486
United States 68 41 47 156 83 481 1,424 1,988
1962: North Atlantic 36 4 0 364 30 4 0 30^ East North Central 53 8^ 5 615 69 66 5 1355 West North Central 35 22 12^ 69* 54 202 2695 5255 South Atlantic 24 8 0 32 26 85 0 111 South Central 26 8 6 346 32 78 6 110^ West 20 16 13^ 496 15 145 3106 4706
United States 194 62 25 281 26 576 579 1,381
Included in larger size category, ^Less than 500,000 pounds
^Plants and volume for South Atlantic and South Central regions have been combined to avoid disclosure of individual plants. ^Plants and volume for North Atlantic and East North Central regions have been combined to avoid disclosure of individual plants. 5 Plants and volume for East North Central and West North Central regions have been combined to avoid disclosure of individual pla 6 Plants and volume for South Central and Western regions have been combined to avoid disclosure of individual plants.
Source: Compiled from unpublished data, Food Safety and Inspection Service, U.S. Department of Agriculture.
17

Lasley, Henson, and Jones
Concentration by Leading Firms
Turkey processing has become more concentrated in larger firms over the past two decades. Concentration ratios reflect the portion of total industry volume rep- resented by the largest firms. These ratios increased until the midseventies as the largest firms increased their share of the total volume slaughtered (table 13 and 14). Con- centration has changed little since 1975, although the leading companies have increased their share of plants operated. The four largest firms operated 14 percent of the 115 total plants in 1982 and slaughtered 33 percent of the total volume. The eight largest firms operated 25 percent of all turkey plants and slaughtered 55 percent of the volume. The 20 largest firms operated 39 percent of all plants and 87 percent of the volume; thus, these plants had more than twice the industry average volume.
However, the largest firms also are consolidating their slaughtering operations and continuing to close selected plants. Only 86 firms operated turkey slaughter plants in 1982, down from 249 in 1960.
Concentration of Further Processing Firms
Further processing—using RTC turkey meat to make ground, formed, boned, cooked, or prepared products — is the most rapidly growing sector of the turkey indus- try. In 1982, 438 firms used over 1 billion pounds of RTC turkey in further processing in 472 plants. Fifty firms each used more than 2 million pounds of turkey to produce further processed turkey products in 1982 (table 15). These 50 firms operated 84 further processing plants, accounting for 92.8 percent of the total volume. The top eight firms further processed 54.7 percent of
Table 13—Federally inspected turkey slaughter, by firm size and plants operated, selected years, 1960-82
Firm size 1960 1964 1968 1972 1975 1980 1981 1982
Percent
Share of federally inspected turkey slaughtered:
4 largest firms 22 22 30 32 37 38 34 33 8 largest firms 32 33 44 46 54 58 54 55 20 largest firms 50 51 65 72
Number
82 86 84 87
Plants operated by: 4 largest firms 34 29 30 23 28 19 23 16 8 largest firms 41 37 38 32 39 34 32 29 20 largest firms 60 56 54 49 55 53 49 45
Source: {33, 40).
Table 14—Turkey processing firms accounting for specified proportions of federally inspected output, selected years. 1960-82
Federally inspected output 1960 1964 1968 1972 1975 1980 1981 1982
Number of firms
30 percent 6 6 4 4 3 3 4 4 50 percent 18 17 10 9 7 7 7 8 70 percent 40 35 21 19 14 12 13 13 80 percent 57 48 30 26 19 17 18 17 90 percent 87 69 43 38 28 24 27 24 95 percent 121 93 53 48 41 40 40 31 100 percent 249 189 102 163 99 102 99 86
Source: 1960 and 1964 data from(^ö). Later material from unpublished inspection data; Food Safety and Inspection Service, U.S. Department of Agriculture.
18

U.S. Turkey Industry
Table 15—Firms further processing turkey, 1982
Plants Turkey used in Turkey slaughtered
Firm size further processing
turther processmg by further processors
Volume Share of total Volume Share of total slaughter
Number 1,000 lbs RTC Percent 1,000 lbs RTC Percent
4 largest firms 11 364,097 36.27 650,379 26.45 8 largest firms 20 549,452 54.73 1,008,395 41,01 12 largest firms 36 673.909 67.13 1,247,892 50.75 20 largest firms 52 815,972 81.28 1,594,597 64.85 50 largest firms^ 84 931,854 92.82 2,184,487 88.84 74 largest firms^ 108 965,537 96.18 2,205,142 89.68 103 largest firms^ 137 985,620 98.18 2,205,277 89.69 Total 438 472 1,003,939 100.00 2.365,462 96.20
RTC = Ready to cook. Firms which used 2 million or more pounds of turkey per firm for further processing. Firms which used 1 million or more pounds of turkey per firm for further processing. Firms which used 500,000 or more pounds of turkey per firm for further processing.
Source: Computed from unpublished data, Food Safety and Inspection Service, U.S. Department of Agriculture,
total further processed volume and also slaughtered 41.0 percent of all turkeys.
Although some firms are more specialized, the leading tur- key slaughterers are also among the leaders in further pro- cessing. The top 50 further processing firms accounted for 88.8 percent of the total turkey slaughter, although 25 of these firms did not slaughter.
Although plant numbers are decreasing in most sectors, further processors are expanding by operating more plants and increasing the size of these plants. In 1974, statistics on further processed products were first reported separately from whole-body further processed; 384 plants used 510 million pounds of turkey in further processed items. By 1982, the number grew to 472 plants
further processing over 1 billion pounds (table 16). Most of these plants further process relatively small volumes of turkey; the 335 which use less than 0.5 million pounds processed only 18 million pounds. A few plants handle large volumes; 11 plants each used more than 27 million pounds (the size of the largest plant in 1974). These 11 largest plants in 1982 processed 511 million pounds —the same volume as the total industry processed in 1974.
In 1974, 15 plants used more than 9 niillion pounds each; 11 of these 15 plants continued to use at least that volume in 1982. These 11 plants used a total of 177 million pounds in 1974 and 378 million pounds in 1982, more than doubling their volume in 8 years. In 1982, a total of
25 plants each further processed more than 9 million pounds of turkey.
Processing Costs
Specialized turkey processing plants can transform a 24-pound liveweight tom turkey into a 19-pound frozen RTC whole bird at a total cost of less than 15 cents per pound RTC (table 17). About a third of the cost of the transformation is for processing labor and about a sixth is for packaging. Energy costs about 1 cent per RTC pound, excluding freezing. Freezing and storing for the first month cost about 1.4 cents per pound. Building, equipment, administrative, and overhead costs are about 3.5-4.0 cents per pound RTC turkey. These are average costs for commodity-packed frozen whole turkeys, free- on-board (f.o.b.) processing plant. Storage charges for each additional month add 0.8 cent per pound (plus in- terest) and freight adds 2-5 cents per pound. Premium products entail more service and materials; hence, there are added costs for basting, packaging, cooking thermo- meters, storage, advertising, shipping, and distributing.
Although regional costs differ only slightly, processing costs tend to be lowest in the South and highest in the West. Processing labor costs about 0.5 cent less per pound RTC turkey in the South than the U.S. average. Building and equipment costs in the West are about 1,0 cent above the U.S. average, whereas these costs in the
19

Lasley, Henson, and Jones
other regions are about 0.5 cent below average. Costs in the West are about 0.9 cent above the U.S. average, whereas costs in the South are 0.5 cent below average.
Processing costs for torn turkeys are about 0.2 cent per pound below the average, and processing costs for hens are 0.2 cent above the average. Fryers cost 4-6 cents per pound more than the average to process, due mostly to the smaller average bird size and lower yield.
The 1982 average processing cost of 14.2 cents for hens and toms compares with 1970 costs of 8.5 cents per pound for hens and 7.2 cents for toms. Greater use of offseason capacity has held down increases in average processing costs. Increased output per hour of process- ing labor is the next most important factor in restrain- ing cost increases (4, 20).
Value Added by Manufacture
The Census of Manufactures measures value added by manufacturing for establishments by subtracting the cost
of materials, Supplies, fuel, and energy from the value of shipments (table 18), Total labor costs run about 50 per- cent of the value added by turkey dressing plants, which is comparable to poultry dressing plants and meat pack- ing plants. Labor efficiency is therefore important, and new technology is critical in boosting output per hour of labor.
Turkey processors have been increasing capital expendi- tures at a relatively higher rate than the overall poultry dressing industry and at a much higher rate than the meat packing industry. This difference is due to rapid expansion of the turkey industry and to the continued development of new further processed products. Turkey processors made new capital expenditures of $27.9 mil- lion in 1977 compared with only $6.0 million in 1972 (table 18), Capital expenditures for turkey processors in 1977 as a ratio of value added by manufacturers, value of shipments, hours worked, wages, and payroll were well above expenditure ratios for poultry and meat packers, although the three industries were comparable in 1972. However, these industries do have cyclical pat-
Table 16—Further processing of turkey, by size of plant, 1974 and 1982
1974 1982
Annual plant volume Plants
. , , Share of Annual volume , ,
total volume
Cumulative share of
total volume Plants Annual volume
Share of total volume
Cumulative share of
total volume
Number 1,000 lbs Percent Number 1,000 lbs Percent
0-9.999 lbs 140 458 0.1 0.1 158 453
10.000-49,999 lbs 76 1,761 .3 ,4 96 2,370 0.2 0.2
50,000-&9,999 lbs 18 1,370 .3 .7 38 2,785 .3 .5
100,000-299,999 lbs 36 6,941 1.4 2.1 43 7,823 .8 1.3
300,000-499,999 lbs 13 5,200 1.0 3.1 21 8,235 .8 2.1
500,000-999,999 lbs 21 14,462 2.8 5.9 29 20,645 2.1 4.2
1.0-1.999 million lbs 21 30,577 6.0 11.9 24 34,625 3.4 7.6
2.0-4.999 million lbs 24 73,692 14.4 26.4 26 84,621 8,4 16.0
5.0-9.999 million lbs 22 153,335 30.1 56.4 15 102,151 11.2 27.2
10.0-14,999 million lbs 6 70,161 13.8 70.2 4 57.098 5.7 32.9
15,0-19.999 million lbs 2 36,082 7.0 77.2 3 52.529 5.2 38.1
20.0-24.999 million lbs 4 88,946 17.4 94.7 3 68,250 6.8 44.9
25,0-29.999 million lbs 1 27,179 5.3 100.0 3 83,853 8.4 53.3
30.0-49.999 mülion lbs 0 .— _ — 5 198,381 19.8 73.1
50.0-84.999 million lbs 0 - - - 4 270,145 26.9 100.0
Total 384 510,164 100.0 100.0 472 1,003.939 100.0 100.0
— = Not applicable.
Source: Computed from unpublished data, Food Safety and Inspection Service, U.S. Department of Agriculture.
20

U.S. Turkey Industry
Table 17—Turkey processing plant costs, 1982^
Item Cents per pound RTC
Labor Packaging Energy^ General operating and supplies Freezing and 1 month storage Building and equipment Administrative and overhead
Total processing cost
4.83 2.59 1.04
.75 1.37 1.45 2.16
14.19
* Approximate adjustments in cents per pound from U.S. average for ready-to-cook (RTC), frozen whole bird, commodity pack:
Variable Cents
Hens +0.2 Toms - .2 Fryers +4.0 to 6.0 West Coast + .9 (primarily due to building and equipment cost) South - .5 (primarily due to labor costs) Storage + .8 per additional month Shipping +2.0 to 5.0
Premium packs, advertising, cutting up, and further processing also are additional costs.
^Excluding energy for freezing.
Source: Data provided by representative processors.
terns in production and prices which influence capital investment by changing their need for new capacity and the financial ability of the firms. Availability of new technology also influences timing of investment.
Turkey and poultry processors in 1977 and 1972 added about 20 percent of the value of their sales; meat packers added about 13 percent. However, meat packers added twice as much dollar value per hour of labor as did turkey or poultry plants. Wages constitute a slightly higher proportion of total payroll for turkey processors than for meat packers.
Seasonal Processing
More uniform processing throughout the year accounts for much of the capacity required to process the greater volume of turkey production in recent years (tables 19 and 20). Monthly proportions of total volume in 1982 certified as RTC varied from 5.0 percent in February to 11.8 percent in November. Monthly proportions in 1965 ranged from 1.0 percent in February to 20.7 percent in November (table 20).
If producers had followed the same seasonal pattern in 1982 as they did in 1960, October's RTC production
would have been 499 million pounds rather than 277 million pounds and would have required additional investment in facilities. However, March production would have been only 35 million rather than the actual
155 million pounds, implying a lot of seasonally idle capacity.
Total annual production of RTC turkey increased 1.233 billion pounds during the 1965-83 period from 1.330 bil- lion to 2.563 billion pounds. November processing was 289 million pounds in 1983, an increase of less than 15 million pounds over 1965, February volume, however, was 136 million pounds in 1983, which was 10 times greater than in 1965. Total slaughter for the first half year 0anuary-june) increased from 157 million pounds in 1965 to 1,044 million pounds in 1983, a jump of 887 million pounds in 17 years. The comparable increase for the last half year (July-December) was from 1.173 billion pounds to 1.519 billion pounds, an increase of 346 mil- lion pounds or 30 percent. Approximately 70 percent of the increased processing volume was realized in the first half year.
By decreasing seasonality in processing, processors have increased total annual volume with relatively limited ex- pansion of plant facilities. Yearly volume has increased 85 percent since 1965 and, because plants tend to oper- ate at capacity in the peak season, they would have re- quired a much larger expansion if the seasonal pattern had not changed.
Processors could increase aggregate processing volume still further by continuing to even out the current seasonal pattern, although this method would require in- creased storage. Assuming that processing facilities op- erate at capacity during October and November, uni- form volume for the full 12 months would allow a cur- rent annual capacity of 3.4 billion pounds. Even if each plant shut down for 1 month, these plants could process 3.1 billion pounds RTC turkey with current facilities, a 25-30 percent potential expansion. The industry has not yet fully utilized its processing capacity.
If individual plants were to fully utilize their current plant capacity, they could process 3.8 billion pounds of RTC a year, about 35 percent more than their actual 1982 volume (table 21). We calculated unused capacity by multiplying peak monthly output for each individual plant by 12 to get annual capacity. The plants' actual 1982 output was subtracted from this calculated capaci- ty, with the difference representing the annual capacity
21

Lasley, Henson, and Jones
unused because of seasonal variation in processing at levels below the peak month. However, plant managers doubt they could operate all year at the same intensity as during their peak month, so not all of this unused capacity would be available for increased output.
Individual plants have different seasonal patterns. Larger plants operate more months than do smaller plants (tables 21 and 22). All 19 plants with annual output over 50 million pounds operate at least 10 months, and 15 op- erate in all 12 months. Of the 23 plants with 20-50 mil- lion pounds of output, 6 operate 12 months and 16 op- erate at least 10 months. Even though these 42 largest plants have the most uniform seasonal patterns, they also have the most reserve capacity.
Small plants tend to be highly seasonal. Only 2 of the 39 plants processing below 500,000 pounds RTC per year
operate more than 7 months, and 21 plants operate 3 months or less. Most of these small plants are turkey producers who process and even retail much of their farm output. Most of their workers are part-time sea- sonal employees. Thus, smaller plant capacity would be difficult to use other than seasonally. If all 60 plants with less than 10 million pounds per year each were to operate year round at peak capacity, their production would add only 120 million pounds to annual volume.
Most plants (42 of the 55) slaughtering 10 or more months also further process turkey. However, only 16 of the 60 plants operating fewer than 10 months further process, and their further processed volume totals only 34 million pounds. Seasonal plants tend to be whole bird plants. Further processors also tend to be larger plants. Only 11 of the 50 plants under 1 million pounds RTC per year further process. Of the 65 plants above 1 mil-
Table 18—Selected characteristics of turkey dressing, poultry dressing, and meat packing plants, 1972 and 1977*
Unit
1977 1972
Item Turkey Poultry Meat Turkey Poultry Meat dressing dressing packing dressing dressing packing plants plants plants plants plants plants
Establishments Number 56 446 2,590 72 522 2,475 Employees 1,000 13.2 86.8 146.2 11.3 77.6 157.6 Total payroll Million dollars 89.2 612.3 2.110.6 58.4 391.8 1,533.1 Production workers 1,000 11.6 77.7 116.5 10.2 70.7 123.4 Wages Million dollars 71.3 496.3 1,625.9 47.2 331.1 1,149.1 Hours worked Millions 19.6 143.6 237.2 18.7 139.3 254.6 Value added Million dollars 176.0 1,236.9 4,010.0 116.0 724.4 2,970.1 Cost of materials do. 774.8 4,520.1 27,239.9 428.1 2,527.0 20,138.6 Value of shipments do. 961.4 5,746.1 31,208.2 546.5 3,254.1 23,024.0 New capital expenditures do. 27.9 126.1 236.7 6.0 45.5 167.9
Wages as share of payroll Percent 79.9 81.1 77.0 80.8 84.5 75.0 Wages as share of value added do. 40.5 40.1 40.5 40.7 45.7 38.7 Payroll as share of value added do. 50.7 49.5 52.6 50.3 54.1 51.6 Value added as share of value of shipments do. 18.3 21.5 12.8 21.2 22.3 12.9
New capital expenditures as share of: Value of shipments do. 2.9 2.2 .8 1.1 1.4 .7 Value added do. 15.9 10.2 5.9 5.2 6.3 5.7 Wages do. 39.1 25.4 14.6 12.7 13.7 14.6 Payroll do. 31.3 20.6 11.2 10.3 11.6 11.0
New capital per hour worked Dollars 1.42 .88 1.00 .32 .33 .66
Value added per hour do. 8.98 8.61 16.91 6.20 5.20 11.67
Wages per hour do. 3.64 3.46 6.85 2.52 2.38 4.51
^Type of plants is based on primary product class.
Source: {78).
22

Table lÖ—Turkey slaughter and processing under Federal inspection, by months for selected years, 1960-83
Item January February March April May June July August September October November December Annual
Millions Turkeys inspected:
1960 1.8 1.4 1.6 1.9 2.7 3.9 4.5 9.2 10.9 12.9 11.9 8.1 71 1965 1.9 1.2 1.5 1.7 2.4 4.6 7.8 12.3 15.1 17.1 17.2 9.9 93 1970 2.6 1.7 2.1 2.4 3.7 8.2 12.4 14.5 16.0 17.5 15.2 9.2 106 1975 4.3 3.6 4.4 5.3 6.2 10.2 13.9 14.4 15.6 17-0 14.3 10.1 119 1980 9.0 7.5 9.3 10.1 12.7 14.5 16.9 15.8 16.7 18.2 16.0 12.2 159.1 1981 9.0 8.3 9.7 10.4 11.9 15.3 17.0 17.6 18.3 18.6 17.6 12.7 166.3 1982 7.9 7.8 10.7 9.8 10.9 14.3 15.3 17,9 17.8 17.8 18.5 11.7 160.4 1983 8.5 8.5 12.0 10.6 12.1 15.2 14.9 18,4 17.4 18.1 17.9 11.3 165.0
Million pounds Liveweight:
1960 27.4 17.5 17.1 20.8 33.9 57.6 64.8 138.7 188.0 241.6 227.3 155.3 1,190 1965 39.2 17.2 18.5 19.7 34.0 68.3 119.7 204.7 280.6 328.5 345.9 192.6 1,669 1970 52.3 28.4 28.6 35.5 57.0 138.5 217.0 267.1 310.3 351.4 211.7 190.0 1,988 1975 82.7 60.0 68.8 86.5 103.1 175.0 242.8 256.4 288.3 324.3 277.3 198.5 2,164 1980 179.0 138.9 157.0 178.5 223.0 256.3 302.4 284.2 303.4 342.7 305.2 237.0 2,908 1981 180.2 152.8 173.3 188.7 224.4 284.4 316.9 330.0 344.7 366.4 351.4 258.5 3,171.7 1982 167.3 155.7 196.1 185.8 205.4 269.8 285.1 332.4 334.2 346.4 364.3 242.5 3,085.1 1983 182.6 172.1 229.7 208.8 230.5 290.4 282.7 341.8 331.1 353.4 362.1 237,4 3,222.6
Total certified RTCi^ 1960 22.1 14.0 13.4 16.2 27.1 46.0 51.9 109.5 149.6 192.3 181.3 125.0 948.4 1965 31.2 13.7 14.5 15.6 27.0 54.7 95.7 163.6 224.4 262.1 275.1 152.5 1,330.1 1970 40.5 22.2 22.1 27.6 44.9 109.5 172.1 212.0 244.6 276.9 244.9 149.2 1,566.5 1975 64.9 47.1 54.4 68.7 81.9 138.4 193.2 203.3 229.0 257.5 220.2 157.5 1,716.1 1980 141.2 109.4 127,9 143.0 178.4 206.9 240.3 227.0 244.3 276.3 246.3 190.8 2,332.4 1981 142.1 119.6 136.4 149.3 178.3 225.7 250.4 261.7 273.1 290.1 278.3 204.2 2,509.1 1982 132.2 123.3 154.9 147.4 164.3 216.2 228.3 265.4 267.7 276.6 289.8 192.7 2,458.9 1983
Frozen : 144.1 135.5 182.7 166.5 183.7 231.3 224.8 271.8 263.7 281.3 288.7 189,0 2,563.1
1960 20.0 12.3 11.0 12.5 22.8 39.0 43.8 95.5 129.1 168.4 144.1 102.0 800.4 1965 23.9 11.3 11.1 11.4 19.1 40.9 75.8 136.1 188.8 217.8 208.1 105.4 1,049.7 1970 30.3 16.5 16.2 20,1 33.7 90.6 142.9 179.0 207,7 232.7 183.8 103.4 1,256.9 1975 46.9 33.8 37.9 52.3 64.9 109.2 162.7 171.9 190,7 209.1 160.1 110.0 1,349.5 1980 92.9 74.9 89.1 101,3 131.9 155.9 185.7 175.9 189.9 208.8 163.1 130.1 1,699,3 1981 102.1 85.1 97.1 108.5 135.9 177.5 201.4 203.9 211.0 214.4 180.3 129.9 1,847.1 1982 91.4 82.0 99.1 97.4 115.4 153.8 166.5 191.7 193.4 196.9 181.5 116.1 1.685.2 1983 88.0 83.1 114.8 110.6 128.9 167.2 164.6 190.9 190.5 198.4 176.5 105.9 1,719.4
Chilled: 1960 2.1 1.7 2.4 3.8 4.3 7.0 8.1 14.0 20.5 23.9 37.2 23.0 148.1 1965 7.3 2.3 3.4 4.2 7,8 13.8 19.9 27.6 35.7 44.3 66.9 47.1 280.3 1970 10.2 5.7 5.9 7.4 , 11.2 19.0 29.2 33.0 36.9 44.2 61.1 45.8 309.6 1975 18.0 13,3 16.6 16.4 17.1 29.2 30.5 31.3 38.3 48.4 60.1 47.4 366.6 1980 48.4 34.6 38.9 41.7 46.5 51.1 54.6 51.1 54.5 68.0 83.2 60.7 633.1 1981 40.0 34.6 39.3 40.8 42.4 48.1 49.1 57.8 62.1 75.7 98.0 74.3 662.1 1982 40.8 41.4 55.8 49.9 48.9 62.4 61.8 73.7 74.4 79.7 108.3 76.6 773.7 1983 56.1 52.4 67.9 55.9 54.8 64.0 60.1 81.0 73.2 82.9 112.2 83.1 843.7
iRTC = Ready-to-cook.
Source: {76).
H
en

4^ Table 20—Seasonality of turkey slaughter. cutup, and further processing. monthly processing as percentage of yearly totaF
Item January February March April May June July August September October November December Annual volume
Million Percent pounds
Certified RTC:^ 1960 2.3 1.5 1.4 1.7 2.9 4.9 5.5 11.6 15.8 20.3 19.1 13.2 948
1965 2.3 1.0 1.1 1.2 2.0 4.1 7.2 12.3 16.9 19.7 20.7 11.8 1,330
1970 2.6 1.4 1.4 1.8 2.9 7.0 11.0 13.5 15.6 17.7 15.6 9.5 1,567
1975 3.8 2.7 3.2 4.0 4.8 8.1 11.3 11.8 13.3 15.0 12.8 9.2 1,716
1980 6.1 4.7 5.5 6.1 7.6 8.9 10.3 9.7 10.5 11.9 10.6 8.8 2,332
1981 5.7 4.8 5.4 6.0 7.1 9.0 10.0 10.4 10.9 11.6 11.1 8.1 2,509
1982 5.4 5.0 6.3 6.0 6.7 8.8 9.3 10.8 10.9 11.2 11.8 7.8 2,459
1983 5.6 5.3 7.1 6.5 7.2 9.0 8.8 10.6 10.3 11.0 11.3 7.4 2,563
Cutup: 1960 NA NA NA NA NA NA NA NA NA NA NA NA NA
1965 5.8 3.7 5.4 4.0 4.1 5.4 5.6 11.1 14.4 15.9 14.2 10.2 97
1970 5.7 5.5 5.2 5.1 5.1 7.4 10.5 11.0 12.1 13.1 10.3 9.2 191
1975 6.9 5.5 5.3 6.7 6.9 8.1 8.7 9.5 10.6 12.6 10.0 9.2 313
1980 8.7 7.3 7.3 7.4 8.1 9.1 8.1 8.1 7.9 10.1 9.0 8.9 656
1981 8.5 aî8 7.8 7.1 8.1 8.4 8.0 8.6 8.5 9.6 9.2 9.4 701
1982 7.3 7.7 8.5 6.6 7.3 8.8 6.8 8.9 9.2 10.3 9.9 8.7 734
1983 7.8^ 7.5 8.2' 7.9 8.4 7.8 7.3 9.3 9.0 9.3 9.3 8.2 809
Further processed. whole 1 body:
1960 5.7 5.0 . 6.9 5.6 6.3 6.9 6.5 8.5 9.8 13.1 13.5 11.7 54
1965 6.7 6.0 7.0 7.1 6.6 7.6 8.7 8.4 9.2 11.0 11.0 10.5 105
1970 7.6 6.4 - 5:8 5.4 5.2 7.4 9.9 10.2 11.1 12.7 10.4 8.3 201
1975 5.1 4.5 4.9 5.4 5.0 7.6 10.9 11.8 12.3 14.2 10.9 7.4 372
1980 4.3 4.« ^ 5.1 4.7 6.8 8.3 10.4 10.8 12.5 15.3 10.1 7.2 671
1981 4.2 3.3 4.6 5.3 6.5 10.2 12.3 13.0 12.6 12.3 10.0 5.6 706
1982 4.2 4.3 5.3 5.3 7.1 8.4 10.8 14.0 13.7 12.0 9.8 5.3 747
1983 3.5 . 3.4 6,7 5.8 7.3 10.4 11.8 12.6 12.0 13.0 8.9 4.8 709
Further processed, ■^
other than whole: 1960 5.5 5.1 6.6 5.3 6.2 6.6 6.4 8.3 9.6 13.2 13.4 13.4 47
1965 6.7 6.0 6.9 7.1 6.5 7.6 8.6 8.4 9.1 10.9 11.0 11.4 147
1970 7.6 6.3 5.7 5.4 5.1 7.4 9.8 10.2 11.1 12.7 10.4 8.3 278
1975 5.0 4.4 4.9 5.4 5.0 7.6 10.9 11.8 12.3 14.2 10.9 7.4 536
1980 7.0 7.0 7.0 7.0 8.4 8.9 9.0 9.3 10.4 10.2 8.1 7.8 953
1981 7.3 7.0 8.1 7.7 7.9 8.5 8.4 9.4 9.3 9.6 8.9 7.9 985
1982 6.4 6.2 8.7 6.5 7.3 8.2 7.2 9.2 9.6 10.1 9.0 8.7 1,034
1983 6.9 7.2 8.2 7.6 7.8 8.7 8.0 9.7 9.6 9.9 9.2 7.2 1,144
a:
S
(^ O Í3
NA = Not available. ^Cutup and further processed volumes are not additive. ^RTC = Ready-to-cook.
Source: (76).

U.S. Turkey Industry
lion pounds, 47 further process turkey products. Thus, large-volume turkey plants tend to slaughter year round and to further process; small volume plants are seasonal and do little further processing (9, 16, 57).
Industry Coordination
Industry adjustments to the following three major prob- lems have helped to bring about the types of coordina- tion today's turkey industry uses: (1) bearing risk, (2) procuring inputs, and (3) assuring markets. The struc- ture of the industry is dynamic and adjusts to current pressures. Coordination has been achieved through a combination of three types of organization: (1) open market (price), (2) direct ownership, and (3) contracts (18, 20, 21, 26, 32, 33, 34, 36, 43, 44, 49, 51, 55, 56, 58),
Open Market Pricing
Each industry participant responds individually to price changes. Prices provide the incentive to guide produc- tion and utilization at each stage and to allocate both costs and returns to each participant. Consumers may bid up to the price, which is then relayed back through the system, resulting in additional capital and labor so as to increase production. If consumers want less turkey or change their preference for turkey products, produc-
tion decreases. Cost savings from improved techniques work their way though the market, beginning with pro- ducers and ending with lower prices to consumers.
Considerable lag time can be expected as each entre- preneur assesses the market situation, making decisions and individual adjustments. Each will independently secure the necessary financing and bear the risk of pro- duction and market changes.
This chain reaction of responses illustrates both why the open market system is not always totally acceptable and what opportunities exist to create a more effective sys- tem. Responses by producers and by others in different stages of the industry vary both in timing and degree of adjustment. Economies of scale also differ at each stage. Marked changes in volume and quality, especially over short periods, may result in higher unit costs. Growing turkeys is a batch process, whereas most of the other stages are part of a flow process. Risk of physical loss is greatest for growers, who also bear the greatest risk of price changes between the time a commitment is made and the product is sold. Growers also experience the greatest price fluctuations and have the most dif- ficulty obtaining financing.
Direct Ownership
Many production and marketing uncertainties, risks, and other problems can be decreased by a firm's owning all
Table 21—Effect of seasonality on use of capacity by turkey processing plants, 1982^
Annual plant volume RTC^
Plants Annual capacity
Actual volume RTC
Capacity not used
Capacity not used
Range of percentage of plant
capacity not used
0-99,000 lbs 100,000-499,000 lbs 500,000-999,000 lbs 1.0-9.9 million lbs 10.0-19.9 million lbs 20.0-49.9 million lbs 50.0 million lbs and up
Total
Number - - Mutton pounds — Percent - -
20 5.4 1.2 4.2 86.3 59-92 19 28.2 4.5 23.7 84.0 51-92 11 42.9 8.4 34.5 80.4 55-89 10 117.4 59.9 57.5 49.0 23-73 13 406.3 200.0 206.3 50.8 28-72 23 1,350.6 775.9 574.7 42.6 15-59 19 1,838.7 1,409.0 429.7 23.4 6-39
115 3,789.5 2,458.9 1,330.6 35.1 6-92
Annual capacity calculated by multiplying peak monthly volume for each individual plant by 12 and adding the plant totals for each size grouping. Subtracting actual plant volume from this calculated total equals unused capacity
"^RTC = Ready-to-cook.
Source: (76).
25
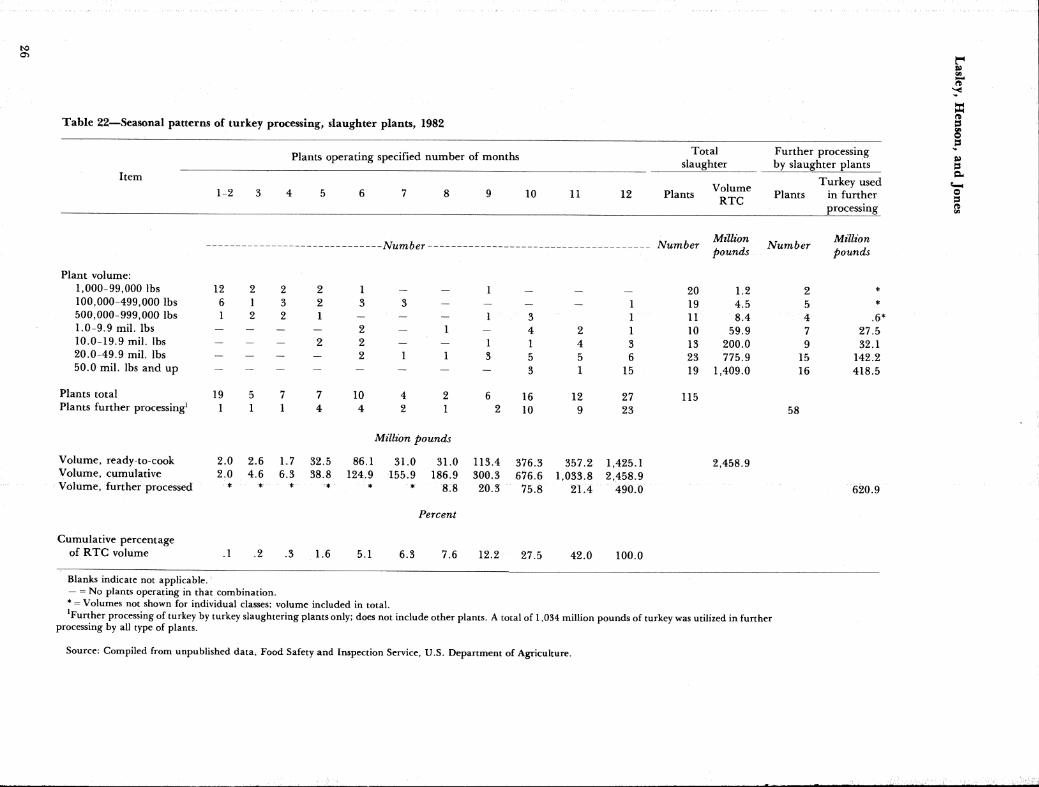
ir"
Table 22—Seasonal patterns of turkey processing, slaughter plants, 1982
Item
Plants operating specified number of months Total slaughter
Further processing by slaughter plants
1-2 3 10 11 12 Plants Volume RTC
Plants Turkey used
in further processing
O
Plant volume:
i\umoer
1,000-99,000 lbs 12 2 2 2 1 100,000-499,000 lbs 6 1 3 2 3 3 500,000-999,000 lbs 1 2 2 1 — — 1.0-9.9 mil. lbs — — _ — 2 _ 10.0-19.9 mil. lbs — — _„ 2 2 20.0-49.9 mil. lbs _ __ 2 1 50.0 mil. lbs and up - - - - - -
Plants total 19 5 7 7 10 4 Plants further processing^ 1 1 1 4 4 2
1 3 1
1 - 4 2 1 1 1 4 3 3 5 5 6 - 3 1 15
6 16 12 27 2 10 9 23
Number
20 19 11 10 13 23 19
115
Million pounds
1.2 4.5 8.4
59.9 200.0 775.9
1,409.0
Number
2 5 4 7 9
15 16
Million pounds
.6* 27.5 32.1
142.2 418.5
58
Volume, ready-to-cook 2.0 2.6 1.7 32.5 Volume, Cumulative 2.0 4.6 6.3 38.8 Volume, further processed * * * *
Million pounds
86.1 124.9
31.0 155.9
31.0 186.9
8.8
113.4 300.3 20.3
376.3 676.6
75.8
357.2 1,425.1 1,033.8 2,458.9
21.4 490.0
2,458.9
620.9
Cumulative percentage of RTC volume .1 .2 .3 1.6 5.1
Percent
6.3 7.6 12.2 27,5 42.0 100.0
Blanks indicate not applicable. — = No plants operating in that combination. * = Volumes not shown for individual classes; volume included in total. Further processing of turkey by turkey slaughtering plants only; does not include other plants. A total of 1,034 million pounds of turkey was utilized in further
processing by all type of plants.
Source: Compiled from unpublished data, Food Safety and Inspection Service, U.S. Department of Agriculture.

U.S. Turkey Industry
or most of the major stages of production and process- ing. The firm can coordinate the flow of physical pro- duct through all stages and reduce the risks both of physical loss and price changes. Labor can be scheduled more effectively and adquate financing is more readily available. Direct ownership as a form of economic in- tegration is expanding (table 23).
Direct ownership, however, raises new problems. Net returns to the different stages tend to differ, with growout often having low returns by industry standards. Owners need large sums of investment capital and oper- ating funds. The turkey industry has been a cyclical in- dustry, with recurring periods of low or negative returns. Maintaining and supervising the necessary farm and other labor at numerous locations is difficult. Incentives to en- courage efficiency have not always worked satisfactorily. Many firms are unwilling to accept the total risk of price changes. Complete ownership of facilities may deter some innovations because of the difficulty of initiating and supervising different systems. Some firms have found that their own managerial styles are not well suited to all stages of production and marketing.
Contracts
Contracting for certain services may alleviate some of the problems with either open-market pricing or direct own- ership. Feed mills, using a variety of payment provisions, often contract with growers to expand feed sales and to better utilize mill capacity. Growers enter contracts to obtain financing and reduce risk. Processors seek assur- ance of a supply of live birds of specified weight and grade to meet their processing needs. Processors are now the primary firms contracting with growers and, with their access to market and to storage, are in a stronger position to provide growers with price protection.
Contract production with growers has increased as a pro- portion of total turkey meat production and now accounts for more than half of all turkeys produced (table 23). Production contracts are of two types: (1) resource- providing contracts and (2) cost-plus contracts. A third type of contract, generally between processors and in- dependent growers, specifies pricing arrangements or formulas to be used at marketing. A discussion of each type of contract follows.
The three types of contracts we describe are used in vary- ing degrees in each of the major turkey producing areas.
Table 23—Types of coordination in the turkey industry, 1955-77
Percentage of total output involved in —
Year Owner- integrated enterprises
Contract production
Contract marketing
Total coordinated production
Percent
1955 4 21 11 36 1960 4 30 16 50 1965 8 35 13 56 1970 12 42 18 72 1975 20 47 14 81 1977 28 52 10 90
Source: (43).
Different firms, primarily because of the nature of their operations, prefer different arrangements. As the open market for live turkeys at the farm level has dwindled nearly to the point of disappearing, processors and grow- ers have adjusted their operations. When adequate sup- plies of turkeys were not available as processors needed them, processors began raising their own turkeys or con- tracting for assured supplies. This practice reduced the sales outlets for independent growers, who began demand- ing assurance of shackle space at the time their turkeys would be ready for market. Similar structural changes confront hatcheries and growers in the poult market.
The balance between the marginal quantities available in the open market and the marginal quantities demanded became more volatile. This volatility in turn resulted in greater price volatility. Faced with uncertain supply, uncertain outlets, and volatile prices, all parties were under pressure to reduce these uncertainties; contracts appeared to be the logical answer.
Some feed millers have taken the lead in developing con- tracts to suit the special needs of each stage. Feed millers sometimes contract to supply processors with a given num- ber of turkeys; sex, size, grade, and time are all spec- ified. The feed miller then contracts with a number of growers to brood and grow out the birds. Contracts with processors are generally formula-pricing contracts whereas those with growers are mostly resource-providing contracts. Cost-plus contracts also are used at both stages, but represent only a small volume, usually to pro- vide off-season birds. Discussions with processors and feed millers indicated that they used the futures market
27

Lasley, Henson, and Jones
to hedge the cost-plus contracting phase of their opera- tions more than any other. This practice is consistent with conditions leading to use of cost-plus contracts — namely, the greater risk, marginal decision to produce, and depletion of financial reserves by a period of adverse prices. In such cases, the higher perceived risk is trans- ferred to the mill or processor, who then covers it —or at least reduces it —by hedging the main cost, feed.
Resource-Providing Contracts. These contracts repre- sent the major means of procuring live turkeys for pro- cessing. Both processors and feed millers employ these contracts to help expand their volume and to reduce sea- sonal and day-to-day fluctuations in the use of their facilities. This type of contract requires a lower capital investment than does direct ownership for the contrac- tor, and it provides operating capital for the grower. The contractor generally providea the poults, feed, med- ication, part of the litter, some fuel allowance, and managerial assistance through a field service represen- tative who visits each flock at least once a week. The grower provides the building and equipment, labor, water, part of the litter, and most of the fuel. The grower is paid on a per-pound or a per-bird basis. Although growers' fees ranged from 2 to 8 cents per pound sold, they averaged 4.33 cents for toms and 5.19 cents for hens in 1982. As they compete in procurement, contractors vary these fees and resources such as fuel, lit- ter, and minor equipment. Almost all contracts provide incentives for efficiency in feed conversion, mortality, and grade out. Over time, net fees to growers by various contractors tend not to vary as much as they do for a single brood.
Contractors bear the risk of physical loss (birds or feed), part of any inefficiency in production, and most price changes for inputs and product. Although hedging may reduce price risk, the industry does little hedging by using the futures market —perhaps because most con- tractors place poults with several growers so that a flow of product is marketed over time rather than marketing most of the year's production in a short time. Thus, con- tractors receive average annual prices for their sales and pay average prices for feed—just as if they had used the market to hedge every flock. This averaging of prices and costs has been a major factor in strengthening the position of large contractors. Smaller contractors or feed millers who do not process turkeys often pass on part of their product price risk through pricing contracts with processors. Some smaller contractors split their opera-
tions by bearing the risk on some of their flocks and passing on the risk for other flocks.
Growers with resource-providing contracts are subject to placement decisions made by the contractor. Quick turn- arounds between broods may press growers for time to clean and prepare barns and equipment. However, longer periods between broods leave growers with underused facilities, raising fixed costs per pound and lowering total pounds produced per year.
Contractors are in a high-risk position regarding variable and adverse cash flow because they lack both the cushion effect of unpaid labor and the noncash depreciation costs agricultural producers so commonly use to main- tain their businesses during adverse periods. Neither do contractors have the fixed cost of owning growout facil- ities when cutting back on the number brooded. Hous- ing and equipment are fixed costs for growers, but are part of cash variable costs for contractors who make the production decisions. Labor, included in the fee paid to growers, also is a cash cost to contractors.
Cost-Plus Contracts. These contracts protect the grow- ers against losses due to low turkey prices, but growers bear normal production risks. These contracts base pay- ment to producers on production costs estimated at stated performance levels. A profit margin is provided, along with incentives based on performance. Inefficien- cies in feed conversion, mortality, or grade will lower the incentive payment to producers. Cost-plus contracts often provide for profit sharing when turkey prices or
profits rise above certain levels. Some companies com- bine the resource contract with the cost-plus contract— for example, when poults, feed, medication, and fuel are provided by contractors. Growers provide housing and equipment, litter, and labor and receive 2.5 cents per pound sold, liveweight. All cash costs (including the 2.5 cents) are subtracted from the proceeds at sale. Growers receive the first 2 cents per pound above the cash costs and the remainder is divided equally.
Contractors and growers stated that cost-plus contracts offer new or expanding growers a source of financing not readily available elsewhere and also protect them against price risk. Both agreed that established, well- financed growers would realize lower returns over time by growing under a cost-plus contract than they would as independent producers. Some processors preferred not to use cost-plus contracts, but realized that they might
28

U.S. Turkey Industry
have to use them to maintain growers who provided their own resources. Cost-plus contracts can help in- dependent growers experiencing extended periods of negative returns. Processors and feed millers can also use this contract to encourage some producers to grow turkeys in the off-season.
Formula-Pricing Contracts. These contracts do not set the price to be paid, but specify the formula to apply to a specified market quote at the time of sale. Contractors are usually processors seeking to assure that a given num- ber of turkeys will be delivered to their plant during a given time period. The contract, written before poults are placed, usually specifies the week of delivery with the day selected by the processor. It is common practice to specify the market quote for RTC turkey on a given wholesale market either on the day of sale or on the average sales for the week. (Some contracts use the aver- age for a 4-week period.) A margin for processing and shipping is deducted from the wholesale quote, and the agreed dressing percentage (usually 80 percent) is ap- plied to convert RTC to a liveweight basis. For example:
New York wholesale quote = 68.3 cents Less processing margin = 18.5 cents (including
transpor- tation cost to New York)
80-percent yield 49.8 cents
== 39.8 cents (basic liveweight price)
Specified premiums or deductions are used to adjust for
grade.
Processors generally encourage independent growers to schedule their operations so as to even out seasonal swings in processing volume. Processing plants operate at peak capacity from October to mid-December and have slack periods, especially during the first quarter of the year. Some processors vary the margins specified in contract formulas during the year about 3-6 cents per pound RTC turkey. They charge the highest processing margins during mid-September to mid-December and the lowest margins during January through May (table 24).
Processors normally post their margins in the fall for the following year. This arrangement gives growers, mills, and hatcheries (who also post their prices about the same time) vital cost information for scheduling oper- ations when annual contracts are being drawn up to cover both processing and poult orders from the hatch- ery. The arrangement also provides coordination for ad- vanced scheduling by processing plants, growers, feed mills, hatchery, and breeder flock operators and helps to utilize resources more effectively.
Government Regulatory Influences on the Turkey Industry
The turkey industry, unlike some industries, is not sub- ject to direct economic controls by Government, How- ever, a variety of Government regulations and policies influence various segments of the industry and provide the framework within which it operates. Without these government influences, the industry would have a dif- ferent structure and would respond differently to changes in the marketplace. Some regulations have in- creased industry costs, while others have directly or in- directly reduced costs. These regulations fall into three categories: (1) economic regulation, (2) environmental, health, and safety regulation, and (3) social regulation.
Economic regulation involves direct Government action as intervention into the market for goods and services—
Table 24—Average processing margins charged in 1982 formula pricing contracts, RTC turkeys^
Processing period Toms Hens Fryers
Cents per pound
January 17.0 17.5 19.5
February 16.5 17.0 19.0 March-April 15.5 16.5 18.2 May 15.0 16.0 17.5 June 16.0 16.6 18.2
J"iy 17.5 18.1 19.4 August 19.3 19.8 21.1 September-December 21,0 21.6 22.6
Weighted average 18.5 19.2 20.3
RTC= Ready-to-cook. ^Margins specified in annual contracts made by representative
processors in fall 1981; actual charges could be lowered by the plant. Charges not covered by annual contracts might move up or down.
Source: Data provided by representative processors.
29

Lasley, Henson, and Jones
that is, where prices, wages, supplies, or market struc- ture are controlled or regulated. The objectives are to alter the pricemaking process in favor of certain groups or commodities, to make the market system more efficient or less monopolistic, or to eliminate dishonesty and fraud. Environmental, health, and safety regulations involve setting Government standards on various products, ser- vices, and activities to protect consumers and workers and to improve the quality of life. Social regulation is concerned with broad social programs to improve the welfare of certain groups or individuals by redistributing income or protecting people from disruptive changes (21^ 62).
Economic Regulation
Farm price-support programs for crops generally lead to more stable, but higher, prices for turkey feed. To qualify for support prices, farmers normally must reduce crop acreage, thereby reducing supplies. The payment- in-kind (PIK) program of 1983 substantially reduced acreage planted, resulting in a much smaller crop and in higher feed prices.
Government food programs affect the demand and price structure for turkey products through direct purchase of foods and by food assistance programs. The Government began these programs in the thirties to help eliminate surpluses brought about by its price-support programs. These programs have gradually expanded, and their pri- mary emphasis has shifted from surplus disposal to food assistance. Turkeys have been bought for various food programs for the past 27 years, influencing demand and raising prices in the short run, especially when supplies were heavy. Direct purchases in 1982 totaled 75 million pounds, 3 percent of total turkey meat produetion, and cost $62.7 million.
Government credit programs influence both availability and terms of credit to agriculture. These programs gen- erally make credit for turkey production more readily available at more favorable terms, thereby lowering cost and risk. Interest on loans through these sources was about 2 percentage points below rates charged by con- ventional lenders in 1982.
Export market development policies influence the turkey industry in two ways: (1) increased exports of tvirkey products can create additional demand which would raise domestic turkey prices, and (2) increased exports
of grain can increase thé price of grain and cost of turkey production. Exports of turkey products are much smaller than those of feed grains, accounting for only 2.2 percent otf turkey meat production in 1982; however, these exports strengthen the domestic turkey market.
Other major economic programs and regulations affect- ing the turkey industry include : transportation, antitrust laws, the Packers and Stockyards Act, employment and labor standards, and energy policies and regulations.
Enyironmental, Health, and Safety Regulation
The primary environmental, health, and safety regula- tions v^hich affect the turkey industry are: (1) Tood and Drug Adrninistration regulatians, (2) poultry inspec- tions, (3) animal disease control and quarantine regula- tions, and (4) grading regulations.
Food and Drug Administration regulations prohibit
adulteration and misbrañding of food and drugs sold in interstate commerce. Regulations also apply to chemical additives and pesticides in food, animal drugs, feeds, and feed additives.
Poultry inspection was on a voluntary basis until 1957 when inspection standards were established similar to those existing for red meat. The major effect of inspec- tion regulations has been a high level of consumer con- fidence. Proéessing plant Output and costs have been af- fteted considerably because plant layout and equipment changes must be approved and sanitation inspections are prescribed. Inspection processes or requirements affect processing casts because line speeds and labor produc- tivity vary. Ghanges in labeling regulations, moisture allowance losses, or restrictions on the use of preser- vatives in poirltry products can also influence industry practices and costs.
Animal disease control and quarantine programs help con- trol and eradicate poultry diseases such as psittacosis, or- nithosis, exotic Newcastle disease, and avian influenza. These programs inelude iinport restrictions on certain products, improvement of animal and plant health, estab- lishment of quarantine stations, restrictions on interstate movement of diseased animals, and humane treatment of livestock |tnjd poultry. Cost sayings to the poultry in- dustry and to consumers from these programs can be substantial as virulent diseases spread rapidly and create widespread losses.
30

U.S. Turkey Industry
Grading regulations facilitate trading and market report- ing, and they contribute to consumer confidence and willingness to buy poultry products. Nearly all turkeys today are graded by voluntary Federal-State programs, with the costs paid by processors.
Other major regulations include the Environmental Pro- tection Laws (EPA) and Occupational Safety and Health (OSHA).
Social Regulation
The major types of social regulations affecting the turkey industry include: (1) social security laws, (2) equal em- ployment laws, and (3) income tax policy.
Special regulations generally were developed within these broad areas to reflect the unique nature of the farm business. However, these laws increasingly influence costs in the turkey industry.
Hatchery Structure, Output, and Pricing
Turkey hatcheries have been increasing in size, but decreasing in number. Year-round turkey production means that a given incubator can produce many more poults than if it were used only seasonally, as was previously the case (41). The schedule of some major turkey hatcheries now resembles that of a broiler chicken hatchery; they operate almost continuously with mini- mum down time for cleanup and disinfecting.
The total number of turkey hatcheries decreased from 453 in 1965 to 180 in 1975 and to 94 in 1983. Incubator capacity has declined more slowly, from 51 million eggs in 1965 to 37 million eggs in 1983 (table 25). Total capacity has remained about the same in the past 5 years, although hatchery numbers have declined.
Although hatchery numbers have dropped to only 20 per- cent of their 1965 number, average capacity per hatchery has increased. The average capacity of 391,000 eggs in 1982 was nearly four times as large as the 112,770-egg capacity in 1965. Average size has increased by a third in just the past 4 years as smaller hatcheries have dropped out and larger ones have expanded.
A total of 165.5 million turkeys were produced in 1982. Dividing this number by the incubator egg capacity on January 1, 1983, shows that on average 4.5 turkeys were
reared for each unit of egg capacity. The ratio in 1965 was less than half that figure as the average was only 2.1 turkeys reared per unit of egg capacity. This gain has enabled hatcheries to reduce the fixed cost per poult. However, it also shows considerable seasonal slack. Allowing 28 days for incubating and a 70-percent hatch, current incubator capacity could probably hatch 50 per- cent more poults.
The tendency toward a less variable seasonal pattern has enabled hatcheries to hatch more poults from a reduced incubator capacity (table 26). However, despite year- round production, the turkey industry is still far from realizing a uniform production level. Light breed turkeys, used primarily as fryers or broilers, have helped level out seasonal variations in hatching, rearing, and marketing.
Light breeds, however, were cut back severely in 1981-82 following overexpansion the preceding year.
This change to year-round use has put real pressure on breeder flock operations to supply hatching eggs on a more uniform basis. Several factors had to be overcome. Turkey hens normally lay their eggs in the spring and early summer, well suited to —and a major cause of—the usual seasonal production pattern. Geneticists were able to develop strains that could lay better in any season. However, building darkout houses in which operators could control lighting schedules for breeder poults, layers, and toms was necessary. Management practices became far more critical and had to be adjusted to ac- commodate bird requirements that vary with the season. Uniform production throughout the year depends on provisions for all these factors.
Some hatcheries are part of completely vertically in- tegrated complexes consisting of breeder flocks, hatch- ery, feed mill, brooding and growout, and processing. However, there is much more of an open market struc- ture between hatcheries and poult buyers than among the other production stages. Most hatcheries, even the completely integrated ones, also sell poults to producers outside their own firms. Most vertically integrated firms also purchase some part of their poult needs. Some poult sales are negotiated at or near the day of hatching. However, this is the exception and usually involves hen poults in the off season, when the demand is greater for tom poults to provide heavier birds for further process- ing rather than the whole bird market. Spot sales may also occur during those times when growers are cutting back on placements and when hatcheries have extra poults.
31

Lasley, Henson, and Jones
Table 25—Turkey hatcheries and incubator egg capacity, by size and region, selected years
Date and egg capacity North
Atlantic
East North
Central
West North
Central
South Atlantic
South Central
West United States^
Percentage of
total
Number of hatcheries Percent
Jan. 1, 1983: Under 100,000 2 2 2 5 5 29 30.9 100,000-499.000 2 2 2 5 5 9 37 39.4 500,000 or more — 6 8 5 3 6 28 29.8
Total 18 11 22 15 13 15 94 100.0
Jan. 1, 1979: Under 100,000 15 2 4 2 2 4 38 30.2 100,000-499,000 4 8 19 8 14 10 63 50.0 500,000 or more 2 7 2 2 8 25 19.9
Total 19 13 30 16 26 22 126 100.0
Jan. 1, 1975: Under 60,000 11 2 12 2 12 7 51 28.3 60,000-99,000 2 11 6 7 21 2 56 31.1 200,000 or more 15 13 24 13 6 22 73 40.6
Total 26 24 42 20 39 29 180 100.0
Jan. 1, 1971: Less than 25,000 16 27 2 4 215 2 42 16.7 25,000-59,000 8 222 2 _ 214 2 44 17.5 60,000-99.000 28 24 2 26 24 2 22 8.7 100,000-199.000 — 219 2 8 233 2 60 23.8 200,000 or more — 238 2 15 231 2 84 33.3
Total 32 290 2 33 297 2 252 100.0
Jan. 1, 1965: Less than 25,000 41 15 24 7 8 23 119 26.1 25,000-59,000 16 18 30 5 11 22 102 22.5 60.000-99,000 215 8 24 10 8 15 280 17.7 100,000-199,000 — 11 27 9 17 15 79 17.4 200,000 or more — 10 18 12 9 25 74 16.3
Total 72
table.
62 123 43 53 100 453 100.0
See footnotes at end of Continued--
Most poults are committed for sale before the eggs are set. Most are booked in the fall for specific dates for the full season's operation when growers contract with pro- cessors. This practice coordinates timing all the way from hatchery to processor and has been a major source of increased efficiency and stability. These booking con- tracts specify price, week of delivery, sex, number of poults, and method of servicing the poults, such as beak trimming, declawing, toe clipping, desnooding, and vac- cinating (table 27). In 1982, poult prices varied seasonal- ly about 10 cents, with the lowest prices in the off season, another incentive for growers to even out poult placement. Most hatcheries break down their price lists
according to periods shorter than a full month as shown in table 27, but the dates specified tend to be quite vari- able, sometimes for periods as short as a week. Monthly variation in average prices paid by growers for all turkey breeds was only about 5 percent during 1966-82 (table 28). Hatcheries also deliver 2-4 percent extra poults above the number charged. Some hatcheries also post adjustments to apply to poult prices based on changes in feed prices. Tbis arrangement was a response to a period when poults were not available to growers because breeder flocks were sold off when feed prices increased dramatically. The posted price adjustments provide yet another example of risk reduction and sharing.
32

U.S. Turkey Industry
Table 25—Turkey hatcheries and incubator tgg capacity, by size and region, selected years
Date and egg capacity North
Atlantic
East North
Central
West North
Central
South Atlantic
South Central
West United States^
Percentage of
total
- -Incubator egg capacity (Thousand)
Jan. 1, 1983: Under 100,000 451 2 2 303 61 — 955 2.6
100,000-499,000 801 2 2 1.849 1.496 3,234 11,046 30.1
500,000 or more — 3,960 9,547 5,188 1.937 4,123 24,755 67.3
Total 1,252 4,823 12,490 7,340 3.494 7,357 36,756 100.0
Jan. 1, 1979: Under 100,000 363 2 172 2 2 85 1,148 3.1
100,000-499,000 921 2,396 5,385 2,516 3,599 2,597 17,414 47.4
500,000 or more 2 5,532 2 2 4,966 18,711 49.5
Total 1,284 4,650 11,089 6,855 5,185 7,648 36,711 100.0
Jan. 1, 1975: Under 60.000 295 2 619 2 230 172 1,561 3.7
600,000-99,000 2 673 797 571 4,258 3 8,048 19.2
200,000 or more 1,143 4,681 12,205 5,823 2,398 7.986 32.242 77.1
Total 1,438 5,354 13,621 6,394 6,886 8.158 41,851 100.0
Jan. 1, 1971: Less than 25.000 167 281 2 55 2194 2 497 1.0
25,000-59,000 282 2835 2 — 2538 2 1,700 3.4
60,000-99.000 21,049 2327 2 2390 2273 2 1.099 2.2
100,000-199,000 _. • ^2,812 2 1.105 25,680 2 10,027 20.4
200,000 or more — 216.387 2 6.135 212,953 2 35.940 73.0
Total 1,498 220.442 2 7.685 219,638 2 49.263 100,0
Jan. 1, 1965: Less than 25,000 406 218 284 103 105 340 1,456 2.8
25,000-59,000 557 703 1,228 208 406 860 3,962 7.8
60,000-99,000 21,496 573 2,143 788 619 1.195 26,814 13.3
100,000-199,000 — 1,439 4.113 1,267 2.207 1.985 11.011 21.6
200,000 or more — 3,281 6,891 5.235 5,235 9,560 27.842 54.5
Total 2,459 6,214 14,659 7.601 6,212 13,940 51,085 100.0
^Does not include Alaska and Hawaii. 2Combined to avoid disclosing individual operations.
Source: {72, 74).
Although hatcheries now are far less seasonal, they still do have a decidedly seasonal pattern. Seasonality for tur- key hatcheries in earlier years resulted from the seasonal demand for poults and the seasonal availability of eggs for hatching because hens did not lay during the off- season. However, present technology can achieve a more uniform production of hatching eggs. Demand for poults, although increasing in uniformity, remains seasonal (table 26).
Marketing
Marketing includes all those functions required to move turkeys from the farm though processing, wholesaling, and retailing to the consumer. These channels have been growing shorter, with the processor performing more of the services previously done by distributors and retailers. However, new products, such as turkey ham, turkey rolls, and other further processed items, have been expanding
33

Lasley, Henson, and Jones
90 I
O
u
%
u
H I
'S H
(L) U
Q
> o
O
<
Cu
43
te
OO 00 CO 00 "^ iTJ ©4 Cí
p-iinr*«.Oíxao^oo çvjooeOintoot^kn
C0(^r-iû00^jTf<£5O I>00<—ti—«t^i—if—tcO 00Q0CMíí5rf<00<iO0ví
ooor-txc^3oo'<i^aï ■^oOO^OcOoOi—ti—I
^ooot^cvjiníOt-1 O^COO-^i—tf—(00l>«
1—""cf^t-oCTiinT^aíp-i cotot^i—it>«^ooa> .-Hi—irhoo-sfoôt^to
ooiOooTfini—cT^csi coTtfrHcsjoiinoi^ ^oooi>.int^csait>^
•—"OOOíOCSltOTí^OO oor^OcK^cûoooo
csiLoaic^iooóOiTim tOtÔr-HlficOOr^VO
r-lOOOt-»'íí^r-I'^í<Ln Or-ioomi—iocoi>. 1—IOOOíOTí<OOO^
arsOîOïOtêcOCOOO
CNí-tC<íl>.Tf"^C^ÍOO
QOt^I>.OOOOOQGm
i—^OiCTiCvia^eOí—to Ol>.F-(Oi>-LCSOOOO
O0r-40oo>iaío0'^
ooc<io.—<oOâ>r>-c^ W CO (JD f—r i-H cß tß t0
m i-H o eo CO c^ 00 e^j <^ Cví "^'^ í© r-^ i-T r-T C^
QOmoi'^cnttiO'^
I—I ,—t oí '^" of of (—T o"
OOOSICOLOCOCTíOOO O0000'^l>r-(too I—« C*>J CO (30 O^ Oi O^
"^OMOOïsoesijn I—l00(NOr-(0)(Nf-l OOitOtOOt^OiOl
>—t (—I OO 00 t>. t^ t>.
ooooa>ot^t£>i> C^OOOC^IÔOOP-IQO !>. Tt^^ lO CO X> OO o 0> I—< c<i oo" i>r o" r-T eo' I—r
OOt^r-H-^aSOOtöi—t I—itoOscOrfiOOOi Or-Hint-.o>r^coTf' urT oo" Oi (M" tíT t> o> 00
1—fCJ>csjot£>ooaí Oii-HOiTtiOiOïOeO TÍ<f—(Oïl—ft^OOOOcO
rH {£Í to to oo" cT oí o I—«í—(,—(r-H,—r(M,—^C^3
ooo^o^oOiOTftun^ r-HTí«otAr^ '^ eoco <—'1—tcotnooi-Htpoví <ö i—f o" i> of r-í oí o
^Q0{NOC<li>í-4CT> OïTÎ<C^(AtOI>O>C30 inoO'íí<o5i>.inrí(o <£>" o" o' <£>' 0> oT o" of
CO(MTfOï<M04C<lO^ coooi>*r-<crii>iûGO <J> C^ 1-H t>* OJ 00 CO Cvï CO 00 od Tí^" 00 00 r*"^ 00
c<iocOàno5i—1-^1—t Oï0GOitoc^iiotocr>
<£>^ t--" cT o ïo ifT oo' Tí^*'
tni-Htûi>.i>.oO'^fo »i^050>»C<l!Äe0O r-*^ >-4 ^ TÍ< CO CO to 00 CO Co" K¿ |>r T^" -rf Q^ oo'
00000Ot£>V0'<i*OC>a àni>'^t^tûcOTi<c^3 OOOt^OtOcOCvJi—I
in to^ oT r>." <» i>>" V csT Ôïr-»SsiSOOOOOOOOO
OOOi-HOOOOtOr-itO 0^iO0O00i>Ji-<<£>X>. ^^OO^OOOOOTíHT^
-íí* eo" lO i>r s^í CN OvJ S^í
i>-ooooi-Ho^oooa5 o^OiiNCsinoir^i^ ino>oococ<iootoo> (M rH GO" lO o" oT f—r o'
cOTi*'«fmt£>C^0O<N mOC£>tört*tÄ00O 00 t^OV'íí^ o m !>. CN 1—I I—I 0«J rí^" o' of oT oT
ooO(Mi>.-400oo<r> rHr-<(MOOOOOOOO t£>I>»tOCOO)CMr-HO f-^ t-H {>i rt^" oo' oo" oo' 00*^
i-<c<ii>oomr-<moo int^iO-^t^ooot» oôioôt^ïf—<<jDooin C<1 CO Uf5 oo 04 C<r CO^ CsT "is
r-tOOOïOO'^'^OCO inr-iOiO'5í*knooo tOOcO<MI>.<X>OOCvJ tß o^ 1—r -"çK oo" oo" o" of
I—< f—( i-H Ï-H I—t (>] r-f
OïC^ic^THoginooo^j ^-<000<liOCO'«fLOO CO !>■" i>." j>r o" Í—r o" I—r
Tj^oo^-^tnosoiLO Ti^ooïOiincvioooo ■^^ O^^ ^_^ o Og (M CO 00 i>» 0^ i-H of r-< C4^ O" o
t^tOC^lt^tOOOtOTf^
to i—f tb <Ä I—I lO oo t^
r-- CM I—r oo' r^ <D f-T of r-t<MCsir-lO^ÇM<Mi—t
r-HOQOiO"rti<£>rti(>J CO 00 C£5 Cvl lO o Oi (M OïeOp-iF-HTt'CT)000 Tj^ofoftûoofodoo
tO(Ni>Tf0OtOtí5ir5 ír>ooi>.cvitoosiur300 l>->ñt450í0i0'fr-i
t>» 00 .-H <>í î^r tu -^^ »rf
tooino^cßr-HLOitn iOlSi—<00O<NtÄO5 t^OitßtOOOyDG^OO CO oo !>• oo LO iO eo OO
oooooooo o o o o o o ö o oooooooo
íTJi—lOOí^Or-HÍJDiin í£>^OOi>OOTt<l>00 Tf04T^ir5t£)tOc¿t¿
cor-tiocOTfaococ^ï t^r^OïOi-^cvicoo O^Ji—iC^oOiOtOtûtT)
intDO^^jOGslOrHin O^-ífíMCNJCOi—lOOO
I—II—loqcoininurjin
Oïr^evjtocoooo-^ to-ii^Of-ir^oOTiiTf r-< f—i oi CO T^í T^í rí^* ^'
OtOOr-(mi>0>r-( 000>CO^I>.Tt"0)
COcOeOtûUDt£>l>.t£5
Or-*ÎMOTfit£>C^tÔ Oior^Tt*o^OioiLn
l>^ 00 00 o oí of i-î o
QOiOi—toooinr^m oocNoooor^Tí^r-^in 06lrícO<?sÍOr-H,-¡,-J
t^tßt>«coi>.r-«c^i>. t£5LaiOO>CN00O'«ti 00O>CD0OrHr-4i—ÍrH
CNtOt^000<IOíl>.iO t£50^mioc<}0ixnoo 00 oo t¿ CO r-I o r-H o
f-HOOr^tn-i^foocvioo r^ini>i>ootoooco vcfc¿Tt<i—4000^0
t£> Tf o r-H CO o
CO C«! iO '^ 00 00 00 CO
00l>.O>00Q000r^00
iOor^Tí^ooT^oc^í O^TfOOoOOOCOC^ItO
cocoiotßooodt^c^
So
(U
-13
4;
■^OiOOiTSOi—iCNCO wtotçr^t^oooooooo ^OiOîOïOïOiOlOîOl oo I—' I—t T—f r-t i-H f—i rH r->(
X
o iO o in o »1 oa oo r^voi>i>oooooooo {OJOíOíCTíOO^OíOI
CT3
43
OtOOifiOi—'C^OO •-;tr>tr>i>.r^QOQOoooo ™0>OlO>0>0^050)0)
>^oinoinoi—iG^oo ^tötor^r^oooooooo 2CïOO)0>050^050J
34

U.S. Turkey Industry
Table 27—Prices for day-old turkey poults, 1982*
Hatching date Toms Hens Straight
run
Cents per poult
January 106 91 96 February 112 97 102 March 114 99 104 April 115 100 105 May 114 101 104 June 115 102 105 July 116 104 106 August 114 101 104 September 105 95 99 October-December 2 2 2
-Average of prices as posted in fall of 1981 by hatcheries for which price iists were available. Prices were subject to change at any time before orders were placed. Actual prices were generally 5-10 cents per poult lower because of lower feed costs. Prices quoted are on a per- poult delivered, vaccinated, debeaked, desnooded, toes clipped basis. Prices for these services priced separately were: vaccination 2.5 cents, sexing 2.3 cents, debeaking 1.7 cents, desnooding 1.0 cent, and toe clipping 2.5 cents. Hatcheries generally quoted prices to include 2-4 percent extras. Some included a schedule by which poult prices would be adjusted according to changes in feed prices.
^Hatcheries generally indicated poults for delivery in October- December would be priced at later dates.
most rapidly. These products help to make turkey a year-round consumer item, which fits in well with year- round production and processing.
Supply and Utilization of Turkey Meat
Turkey meat is generally consumed within a short time (2 months) after the birds are processed. Storage facil- itates orderly movement of heavy supplies through the market and provides supplies for periods when utilization exceeds current production; most storage serves both these functions.
Frozen turkeys represent the most common method of marketing. Therefore, stocks move in and out of storage throughout the marketing year. Because of increased further processing and more nearly even seasonal pat- terns of production and consumption, yearend stocks ac- count for a decreasing proportion of the total supply of turkey. Since 1975, yearend stocks have represented less than 10 percent of the supply available during the year. Prior to 1975, yearend stocks were running at about 11- 15 percent of that year's production (table 29). Stocks are built up during the summer and early fall to a Nov- ember peak in preparation for the heavy consumption
season (table 30). The November peak tends to more than double yearend stocks. Stocks reach their seasonal low during the spring. Over the past two decades, the period of low spring stocks seems to have been pushed forward.
Some people think the industry does not need to carry such large stocks and that heavy storage stocks may be difficult —even disruptive—for the market. They base this opinion on the declining proportion purchased by consumers as frozen whole turkeys and on the decreasing seasonality of production (3, 9, 20, 53, 63, 68, 69, 71,
76),
Exports and Imports
Turkey exports make up only a small portion of total U.S. production, about 2-3 percent in the early eighties (table 31). Imports are also of low volume. Export mar- kets fluctuate much more than the domestic market. Foreign markets generally buy turkey to supplement their own supplies, which makes purchases irregular. It is difficult for individual processors to ship from normal production. Product and handling specifications can be a problem because exporters may fill orders by purchas- ing from several processors. The product must often be processed for a specific order, and a group of processors cooperates in servicing the export sale.
Export volume expanded significantly during 1979-80. Demand by some major importers increased and heavy U.S. supplies lowered prices, making trade quite advan- tageous for both parties. In view of reduced demand by foreign buyers, a strong increase in shipments made by other exporting countries, and the relatively strong position of the U.S. dollar, U.S. turkey exports have dropped from the high levels of 1980 —despite continued low prices.
Marketing Costs
Each sector of the industry has contributed to the gains that enable consumers to buy turkey at favorable prices. Although gains in individual sectors have often been small, the cumulative effect of changes in all sectors has been substantial.
Marketing costs, which account for almost half the retail price of turkey meat, have increased over time (table 32). However, increased productivity in the marketing sector
35

O)
Table 28- —Average monthly prices i paid by farmers for turkey poults. all breeds, 1966-831
a
§ sa
Year January February March April May June July August September October November December Average O
Cents per poult
í¿
1966 58.3 59.4 60.5 61.0 61.8 62.8 61.8 61.4 54.7 57.8 61.0 60.8 60.1 1967 59,6 59.2 57.9 58.3 59.0 59.8 60.7 59.7 59.0 59.1 59.0 59.3 59.2 1968 58.9 57.7 57.6 57.4 58.5 58.6 58.2 58.0 57.3 57.9 56.5 56.1 57.7 1969 56.0 55.8 56.3 56.5 57.4 58.0 56.4 53.6 50.5 51.0 52.0 53.1 54.7 1970 54.9 55.4 55.8 57.1 56.9 56.9 56.3 54.7 53.0 54.6 53.6 52.9 55.2
1971 55.2 55.8 56.1 57.3 57.9 58.2 57.2 56.9 56.3 56.2 54.9 55.3 56.4 1972 57.0 57.3 57.6 57.8 57.8 58.0 58.0 57.1 55.3 55.0 53.9 55.1 56.7 1973 54.5 56.3 57.3 57.8 58.4 60.2 60.8 64.1 64.7 67.8 64.4 64.0 60,9 1974 64.8 65.1 67.0 68.3 67.9 69.0 68.4 67.4 67.3 67.4 67.2 68.8 67.4
1975 68.7 69.5 70.1 70.0 70.2 71.0 73.9 70.6 70.4 68.6 67.6 68.8 70.0 1976 68.6 69.9 70,8 71.1 71.0 70.6 71.3 69.6 68.8 67.8 66.4 67.0 69.4 1977 67.9 70.6 72.7 73.1 74.0 74.9 75.2 75.1 72.0 70.7 69.4 69.0 72.1 1978 71.5 71.4 72.7 73.0 75.0 75.0 75.0 75.0 74.0 75.0 74.1 72.5 73.7 1979 75,8 75.5 76.8 78.6 79.3 80.2 80.0 79.1 78.2 79.1 79.1 78.8 78.4
1980 79.0 80.9 81.8 82.1 81.8 81.5 81.6 82.4 81.6 81.9 81.3 81.7 81.5 1981 83.2 83.7 86.0 86.5 88.0 88,6 89.8 90.2 90.1 90.6 89.4 88.3 87.9 1982 88.4 88.5 89.2 91.8 90.4 92.6 92.5 92.9 91.9 91.2 90.0 89.3 90.7 1983 89.7 91.7 90.6 94.1 93.7 93.7 93.6 93.2 94.6 92.3 92.5 93.3 92.8
18-year Í
average 67.3 68.0 68.7 69.5 69.9 70.6 70.6 70.1 68.9 69.1 68.4 68,6 69.2
11966-68 heavy breeds only; prior years used different classifications.
Source: (70).

U.S. Turkey Industry
Table 29—Supply and utilization of turkey, 1950-83^
Production^ Beginning
stocks^
Supply
Exports and
shipments'^
Disappeai
Military^
lion pounds --
ranee
(
Total Ending stocks^
Ending stocks as percentage of total supply
Civilian Year
Total Per capita,
ready-to-cook^
-- Million pou nds Percent Mil Pounds
1950 615 127 742 110 14.8 __ 20 612 4.1
1951 703 110 813 107 13.2 — 35 671 4.4
1952 795 107 902 147 16.3 - 41 714 4.7
1953 758 147 905 122 13.5 — 42 741 4.8
1954 871 122 993 121 12.2 — 30 842 5.3
1955 818 121 939 95 10.1 ~ 26 842 5.0
1956 957 95 1,052 162 15.4 - 39 860 5.2
1957 1,034 162 1,196 177 14.8 — 29 990 5.9
1958 1,038 177 1,215 162 13.3 6 32 1.015 5.9
1959 1,123 162 1,285 149 11.6 12 32 1,092 6.3
1960 1,156 149 1,305 160 12.3 24 31 1,090 6.1
1961 1,506 160 1,666 263 15.8 28 29 1,346 7.4
1962 1,302 263 1,565 203 13.0 37 34 1,291 7.0
1963 1,355 203 1,558 217 13.9 31 40 1,270 6.8
1964 1,459 217 1,676 207 12.4 43 36 1,390 7.3
1965 1,521 207 1,728 200 11.6 58 40 1,430 7.4
1966 1.685 200 1,885 267 14.2 47 56 1,515 7.8
1967 1,883 267 2,150 367 17.1 49 53 1,681 8.6
1968 1,620 367 1,987 317 16.0 41 63 1,566 8.0
1969 1,614 317 1.931 192 9.9 37 48 1,654 8.3
1970 1,757 192 1,930 219 11.3 35 49 1,646 8.2
1971 1,809 219 2,028 223 11.0 32 42 1,740 8.5
1972 1,915 223 2,138 208 9.7 42 42 1,846 9.0
1973 1,933 208 2,141 281 13.1 54 31 1,774 8.5
1974 1,910 281 2,191 275 12.6 57 14 1,846 8.7
1975 1,804 275 2,079 195 9.4 54 20 1,812 8.5
1976 2,046 195 2,241 203 9.1 71 17 1,948 9.1
1977 2.023 203 2,226 168 7.5 56 11 1,991 9.3
1978 2,111 168 2.279 175 7.7 60 15 2,029 9.3
1979 2,345 175 2,520 240 9.5 18 18 2.205 10.1
1980 2,425 240 2,665 198 7.4 81 16 2,370 10.5
1981 2,576 198 2,774 238 8.6 68 15 2,452 10.8
1982 2,522 238 2,761 204 7.4 56 12 2,489 10.8
1983 2,506 204 2,838 162 5.7 54 13 2,608 11.2
— = Not available. ^Certified, ready-to-cook (RTC) weight. . J n r _ 7=: ^Includes turkey sold from and consumed on farms where produced. The factor for converting from live to RTC weight was increased gradually from 75
percent in 1950-55 to 80 percent in 1961. ^Stock data in terms of product weight as reported. '^Exports prior to 1958 were negligible, and data were not reported separately from chicken. ^Includes U.S. Department of Agriculture donations to military and military feeding of civilians in occupied territories.
^Includes giblets.
Sources: U.S. Department of Agriculture {64, 68, 69).
57

oo 00
•jyj vAiiu-aiUi ; (ig^c noiaings oi turKeys, beginning < of month, selected years, 1955-83
Year January February March April May June July
Million pounds R
August
TC
September October November December
1955 121.0 124.0 110.7 92.7 70.7 60.2 51.5 45.0 48.0 76.9 144.3 129.0 1960 149.2 142.3 124.0 105-2 87.3 74.3 66.7 70,9 112.5 186.1 282.2 209.9 1965 1966 1967 1968 1969
207.4 200.1 267.1 366.9 317.1
197.1 182.4 272.1 360.6 293,6
168.9 156.5 253.9 310,3 254.4
137.0 122.0 206.6 267.8 201.4
105.7 92.3
176.1 225.1 155.0
82.5 69.4
149.4 194.1 123.0
70.0 69,7
159.9 185.3 119.3
88,4 103.6 221.3 226.0 162.7
147.2 171.4 332.1 304.7 237.1
243.6 282,5 441.5 385.9 329.4
362.8 395.5 550.8 504.4 435.6
280.3 312.1 428.7 385.7 283.8
1970 1971 1972 1973 1974
191.9 218.9 223.1 208.1 281,0
162.1 207.1 211.3 188.4 274.0
132.7 177.3 180.5 152.6 250.5
101.1 146.0 145.9 115.4 235,9
81.5 119.4 120.8 91.3
225.0
73.7 111,5 110.8 88,1
227.4
94.7 140.3 142.3 137.1 265.8
155.5 202.8 214.1 199.4 335.8
237.9 307.6 313.0 261.2 431.8
343.0 389.0 407.5 350.7 528.7
450,5 475.2 475.7 450.5 554.6
313.1 308.7 297.0 321.1 372.6
1975 1976 1977 1978 1979
272.0 195.2 203.4 167.9 175.1
267.1 186,8 190.3 168.3 170.7
239.9 160.7 167.8 136.6 154.7
207.3 140.7 142.3 122.9 135.7
180.2 114.5 130.3 101.1 128,0
162.7 120.8 138.2 103.6 153.1
193.2 177.3 201.4 152.1 200.9
248.6 261.9 253,6 212,7 272.5
328.3 370.3 329.9 297.9 382.5
409,8 459.7 409.3 370.4 432.3
472.4 512.3 444,5 430.1 445.5
286.2 298.8 269.4 235.7 281,2
1980 1981 1982 1983
240.0 198.0 238.4 203.9
246.8 207.9 236.9 193.8
225.0 207.9 236.4 187.7
208.9 220.7 232.8 185.3
206.9 228.7 N.S.
192.2
233.8 255.8 281.7 210.5
286.6 327,3 292.0 255,7
325.8 400.8 335.9 323.5
384.0 466.0 N.S.
384.3
398.8 532.1 435.8 432.2
420.2 528.1 N.S.
460.1
257.6 305.1 N.S.
251.6 RTC=: • Ready to cook.
No survey.
Source : {68).
Í3
I A3
o £3
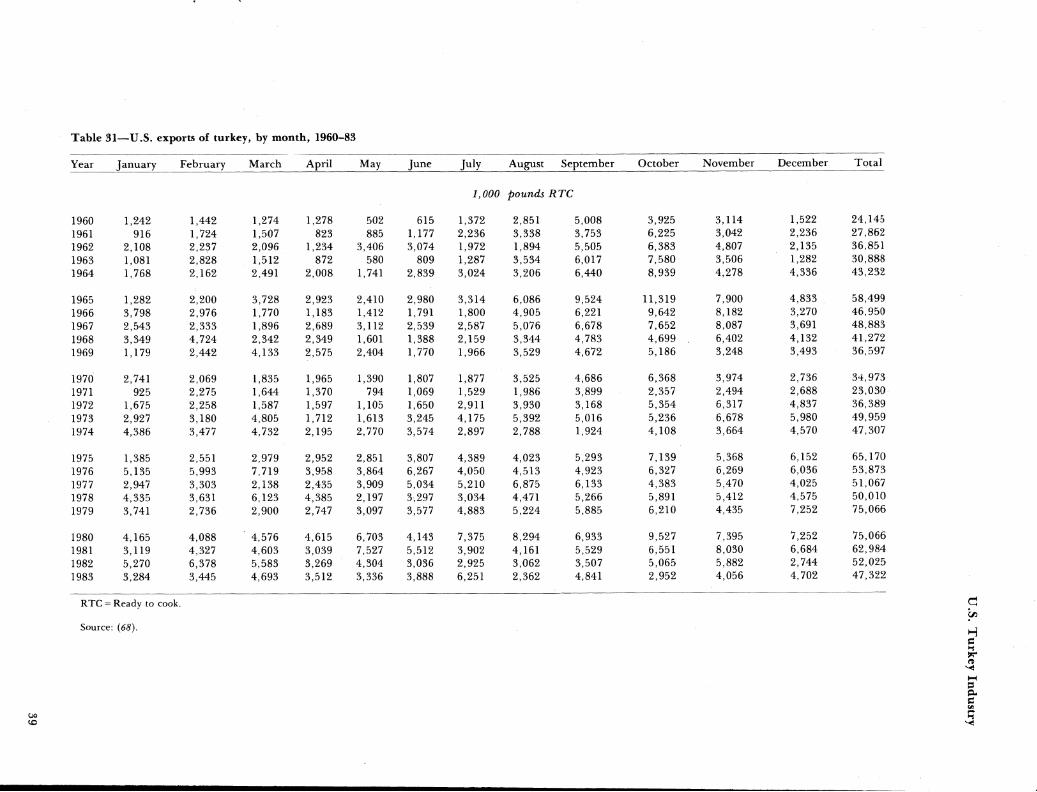
Table 31—U.S. exports of turkey, by month, 1960-83
Year January February March April May June July August September October November December Total
1,000 pounds RTC
1960 1,242 1,442 1,274 1,278 502 615 1,372 2,851 5,008 3.925 3.114 1,522 24,145
1961 916 1,724 1,507 823 885 1,177 2,236 3,338 3.753 6,225 3,042 2,236 27,862 1962 2,108 2,237 2,096 1,234 3,406 3,074 1,972 1,894 5,505 6,383 4,807 2,135 36,851
1963 1,081 2,828 1,512 872 580 809 1,287 3,534 6,017 7,580 3,506 1,282 30,888 1964 1,768 2,162 2,491 2,008 1,741 2,839 3,024 3,206 6,440 8,939 4,278 4,336 43,232
1965 1,282 2,200 3,728 2,923 2,410 2,980 3,314 6,086 9,524 11,319 7,900 4,833 58,499 1966 3,798 2,976 1,770 1,183 1,412 1,791 1,800 4,905 6,221 9,642 8,182 3,270 46,950
1967 2,543 2,333 1,896 2,689 3,112 2,539 2,587 5,076 6,678 7,652 8,087 3,691 48,883
1968 3,349 4,724 2,342 2,349 1,601 1,388 2,159 3,344 4,783 4,699 , 6,402 4,132 41,272
1969 1,179 2,442 4,133 2,575 2,404 1,770 1,966 3,529 4,672 5,186 3,248 3,493 36,597
1970 2,741 2,069 1,835 1,965 1,390 1,807 1,877 3,525 4,686 6,368 3,974 2,736 34,973
1971 925 2.275 1,644 1,370 794 1,069 1,529 1,986 3,899 2,357 2,494 2.688 23,030 1972 1,675 2,258 1,587 1,597 1,105 1,650 2,911 3,930 3,168 5,354 6,317 4,837 36,389 1973 2,927 3,180 4,805 1,712 1,613 3,245 4,175 5,392 5,016 5,236 6,678 5,980 49,959 1974 4,386 3,477 4,732 2,195 2,770 3,574 2,897 2,788 1,924 4,108 3,664 4,570 47,307
1975 1,385 2,551 2,979 2,952 2,851 3,807 4,389 4,023 5,293 7,139 5,368 6,152 65,170
1976 5,135 5,993 7,719 3,958 3,864 6,267 4,050 4,513 4,923 6,327 6,269 6,036 53.873
1977 2,947 3,303 2,138 2,435 3,909 5,034 5,210 6,875 6,133 4,383 5,470 4,025 51.067
1978 4,335 3,631 6,123 4,385 2,197 3,297 3,034 4,471 5,266 5,891 5,412 4,575 50,010
1979 3,741 2,736 2,900 2,747 3,097 3,577 4,883 5,224 5,885 6,210 4,435 7,252 75,066
1980 4,165 4,088 4,576 4,615 6,703 4,143 7,375 8,294 6,933 9,527 7,395 7,252 75,066
1981 3,119 4,327 4,603 3,039 7,527 5,512 3,902 4,161 5,529 6,551 8,030 6,684 62,984
1982 5,270 6,378 5,583 3,269 4,304 3,036 2,925 3,062 3,507 5,065 5,882 2,744 52,025
1983 3,284 3,445 4,693 3,512 3,336 3,888 6,251 2,362 4,841 2,952 4,056 4,702 47,322
RTC = Ready to cook
Source : (68). H
CO
j3 pu

Lasley, Henson, and Jones
has helped moderate these cost increases. Although in- put prices for labor, energy, and packaging tripled dur- ing 1960-80 (app. table 1), marketing costs per pound of turkey doubled. Total costs of assembling, processing, transporting, wholesaling, and retailing make up the farm-to-retail price spread (table 52).
Increased density in turkey production areas, limited procurement distances, larger houses concentrated on fewer production units, and partial mechanization of loading and unloading have held procurement and as- sembly cost increases down, even though transportation and labor are major cost components.
Processors have benefited from economies of scale, more effective use of facilities, less seasonality in production, improved and more uniform quality of birds, shorter hauls from fewer and larger volume growers, and mech- anization in processing and handling. Four important changes in the economic system during the seventies, however, caused processing costs to rise:
L Energy prices increased rapidly. 2. Persistent inflation boosted many input prices by
an unusually high rate. 3. Environmental considerations forced rapid in-
stallation of costly equipment without increasing output. However, some of this- impact has now been offset by reclaiming waste as byproducts.
4. More responsibility for functions such as cutup and packaging has been shifted to the processing level.
Wholesaling, including all activities between processors and retailers, has been shortened and made more direct. Processors now perform more functions formerly per- formed by wholesalers, and they move large volumes directly to retail warehouses. Improved transportation and refrigeration have also provided economies at these stages, although long-distance shipping costs have in- creased from about 1.5 cents per pound in the late fifties to nearly 3.0 cents in the early eighties.
Retailers' margins have more than doubled since the late fifties (table 32). The retailing function claims the largest individual share of marketing costs, but is less in- fluenced by adjustments within the turkey industry than are the other marketing stages. Retail performance is determined by factors outside a particular commodity industry. Although some marketing functions have been shifted from retailer to processor and costs have in- creased at each stage, the relative margins for these two functions have not changed much.
Surplus-Deficit Areas
Turkey production is highly concentrated in a few areas (see fig. 2), These production areas do not generally coincide with concentrations of population, and turkey must be moved from the surplus production areas to deficit areas. Actual data are no longer collected on regional consumption or interregional shipments. There- fore, we estimated regional consumption by multiplying population in the region by the average U.S. per capita consumption. We then compared this level of consump-
Table 32- —Estimated farm equivalent value, retail price, and components of farm-to-retail price spreads for turkeys^
Farm Procurement Long distance Farm-to- Period equivalent and Processing transport and Retailing retail Retail
value assembly wholesaling price spread price
Cents per pound RTC
1955-59 34.3 0.7 6.3 3.8 9.5 20.3 54.6 1960-64 29.0 .7 6,0 3.9 9.5 20.1 49.1 1965-69 27.4 .7 6.1 4.2 10.1 21.1 48.5 1970-74 37.8 .8 10,0 4.3 13.2 28.3 66.1 1975-79 49.9 .9 11.1 5.6 13.6 31.2 81.1 1980-81 52.0 1.7 14,0 7.1 19.3 42.1 94.2 1982 48.7 2.0 14.2 7.4 20.3 43.9 92.6
RTC= Ready to cook. * Medium turkeys, 8-16 pounds, October-December average.
Sources: {46, 63).
40

U.S. Turkey Industry
tion with regional turkey production to determine re- gional surplus and deficit balances (table 33).
All regions except New England have increased turkey production in the past quarter-century. The increases have been neither uniform nor in proportion to popula- tion changes or to changes in per capita consumption. Therefore, surplus-deficit balances have changed. With greater specialization in production, both regional sur- pluses and deficits have grown, except in the Mountain and Pacific regions, which are now self-supporting rather than surplus areas. The West North Central and the South Atlantic regions have heavy surpluses available for shipping to other regions. The New England, Middle Atlantic, and the East North Central regions, with their heavy urban populations, must ship increasing quantities of turkey from other regions.
Because of the combined effects of population changes and production shifts, interregional movements represent a decreasing proportion of total turkey production. In 1960, three regions had a combined surplus of 441.5 million pounds, about 47 percent of federally inspected production, with offsetting deficits in the other five regions. In 1980, however, the 691 milhon pounds of surplus in four regions which was used for interregional movement represented only 30 percent of total produc- tion. Increasing quantities are moved, but the propor- tion of total production involved is decreasing. With ex-
pansion of production in the South Atlantic region, average shipping distances and times are decreasing
(47, 7h 75).
Product Form
Most turkeys are marketed as young turkeys and grown to a matured market age, usually 4-7 months (table 34). Young turkeys represented 97 percent of total weight of turkey slaughtered under Federal inspection and cer- tified RTC in 1980-82. Fryer-roasters, young immature birds usually under 14 weeks of age, represented less than 2 percent of turkey certified under Federal inspec- tion in 1980. These small birds have varied in volume over the years, but declined from about 6 percent of the total in 1965-69. Old turkeys, fully matured birds held for breeders, represented more than 4 percent of the an- nual volume of turkeys certified in 1960, but they repre- sented less than 1 percent in 1980-82. Technological im- provements in the turkey industry during the past 20 years have allowed turkey production to increase without a proportional increase in the size of the breeding flock.
Turkeys are usually marketed frozen or in chill packs. Frozen turkeys and turkey products represented about 80 percent of turkeys certified at slaughter in the late six- ties, while chill packs accounted for about 20 percent (table 34). By 1983, the proportion of turkeys sold in frozen form decreased to about 67 percent while the pro-
Table 33—Regional turkey production compared with estimar ¿d consumption of turkey, selected years'
Year New Middle East
North West North
South South Mountain Pacific England Atlantic
Central Central Atlantic Central
Million pounds, RTC equivalent^
1955 -33.3 -129,4 -63.0 167.3 -5.8 -59.6 25.5 98.2
1960 -56.0 - 184.4 -66.1 297,4 -70.8 -63.8 28.6 115.2
1965 -77.4 -238.7 -76.9 362.0 -38.2 -36.9 35.8 81,4
1970 -87.8 -256.5 -118.6 336.3 31.2 -.3 39.7 56.0
1975 -101.9 -274.4 -144.7 408.3 75.2 -36.5 46.7 27.4
1979 -119.3 -301.3 -188.3 440.8 210.4 -53.2 17.3 -6.5
1980 -129.8 -308.5 -201.6 476.9 193.8 -51.2 12.2 8.1
RTC = Ready to cook. ^Northeast = combined New England (Me., N.H., Vt., Mass., R.I., Conn,) and Middle Atlantic (N.Y.. N.J., Pa.). East North Central (Ohio, Ind..
111.. Mich., Wis.). West North Central (Mn., Iowa, Mo.. N. Dak., S. Dak., Nebr., Kans.). South Atlantic (Del.. Md., Va., W. Va., N.C., S.C., Ga. Fla.). South Central (Ky., Tenn., Ala., Miss., Ark., La.. Okla., Tex.). Mountain (Mont., Idaho, Wyom., Colo., N. Mex., Ariz., Utah, Nev.). Pacific (Wash., Ore., Calif.). Excludes Hawaii and Alaska.
^Minus sign ( - ) indicates that consumption in region was greater than production and that inshipments were made from surplus regions.
41

Lasley, Henson, and Jones
portion marketed in chill packs increased to about 33 percent. These trends can be accounted for partly by decreases in seasonality of production and consumption (table 35), increases in the proportion of turkeys marketed cutup (table 36), and introduction of expand- ed lines of further processed and cutup turkey products (tables 37 and 38). A somewhat larger proportion of turkeys certified in the last quarter of the year is marketed in chill packs (including bulk packed) than in the first three quarters (table 36), The fourth quarter in- cludes the holiday seasons when per capita turkey con-
sumption is highest and when there is net movement of turkey products from storage.
Turkeys certified at the processing plant as frozen RTC generally go into short-term storage, but freezing also facilitates long-distance hauling and handling. Chilled RTC may be sold for consumption as fresh turkey, used for cutup, or used in further processing. The chilled proportion has risen to almost a third of the total RTC volume, double the proportion in 1960. The expansion in further processing caused most of this steady increase.
Table 34—Quantity of turkey certified RTC in federally inspected plants, by class and product form
Year Total turkey^ Young turkey Fryer-roasters Type of pack Further processed
Chill pack^ Frozen^ Cutup^ TotaP Whole^ Other^
- Pounds per capita^ Percent of total - Pounds per capita* —
1960 5.3 4.6 0.5 _ 0.6
1961 6.9 6.0 .6 _ .6 1962 5.9 5.2 .5 13.2 86.8 0.2 .8 1963 6.2 5.5 .5 13.4 86.6 .3 1.0 1964 6.6 5.8 .5 14.0 86.0 .3 1.1 - —
1965 6.9 6.2 .5 21.1 78.9 .5 1.3 1966 7.6 6.9 .6 21.0 79.0 .6 1.7 1967 8.5 7.8 .5 18.3 81.7 .6 1.6 1968 7.4 6.9 .4 18.7 81.3 .7 2.0 1969 7.2 6.7 .3 21.1 78.9 .8 2.5 - —
1970 7.8 7.3 A 19.8 80.2 1.0 2.4 1971 8.0 7.5 A 20.0 80.0 1.0 2.7 1972 8.8 8.2 A 21.8 78.2 1.5 3.1 1973 8.6 8.0 A 21.8 87.2 1.2 3.8 1974 8.7 8.1 .5 21.0 79.0 1.4 4.2 1.8 2.4
1975 8.0 7.6 .4 21.4 78.6 1.4 4.3 1.7 2.6 1976 9.1 8.6 .4 23.6 76.4 1.8 4.9 2.0 2.9 1977 8.8 8.4 .3 27.1 72.9 2.0 5.3 2.1 3.2 1978 9.1 8.8 .2 28.7 71.3 2.1 5.6 2.3 3.3 1979 10.0 9.6 .3 27.2 72.8 2.4 6.2 2.4 3.7
1980 10.2 9.8 .3 27.2 72.8 2.8 6.9 2.9 4.0 1981 11.1 10,7 .3 26.1 73.9 2.8 7.4 3.1 4.3 1982 10.7 10.4 .2 31.4 68.6 3.2 7.5 3.2 4.3 1983 11.0 10.8 .1 32.9 67.1 3.5 8.0 3.1 4.9
RTC: = Ready to cook. — = Not available.
jTotal certified as RTC in federally inspected plants will differ from consumption because of (1) production not federally inspected (2) exports (3) net change m storage. y ^ f • v /
^Chilled plus frozen = 100 percent of certified RTC. ^Further processed and cutup are not additive.
^Further processed was not reported separately for whole and other before 1974. Per capita is based on civilian population.
Source: {68, 76).
42

U.S. Turkey Industry
Because freezing adds cost and reduces product yield slightly, further processors prefer to use fresh turkeys. Not enough chilled turkey is produced at all times, how- ever, so considerable quantities of frozen turkeys are also used for further processing.
Marketing of value-added products is an important part of most integrated poultry operations. Frozen whole tur- keys are considered basic products, but the emphasis has been on cutup and further processed products. The pro- portion of turkeys certified and classified as cutup in- creased from about 9 percent in the late sixties to 30 percent in 1983 (table 36). The proportion cut up was somewhat larger in the first three quarters of the year than in the final quarter; however, there has been a trend toward decreasing the seasonal difference. Not all turkey classified as cutup is sold to consumers as turkey
parts cutup at the processing plant; some is used in further processing.
The major slaughter firms are also the leading processors of cutup and further processed poultry. More plants are cutting and further processing than are slaughtering (table 39). Many of the cutting and further processing operations purchase poultry meat from slaughter plants.
A rapid increase in production of further processed tur- key products began in the midsixties. In the late sixties, about 25 percent of the volume processed was sold as further processed products (table 36). Most of this fur- ther processed turkey was in the form of frozen raw meat in roasts, dinners, and pies sold to consumers; cooked turkey rolls sold to institutional markets; and bulk meat and parts sold to specialized outlets. By 1982, about 42
Table 35—Per capita consumption of turkey, by quarter, 1960-83
Year Quarter 1 Quarter 2 Quarter 3 Quarter 4 Annual
1960 0.6 1961 .6 1962 .7 1963 .5 1964 .7
1965 .7 1966 .7 1967 .8 1968 1.0 1969 .9
1970 .9 1971 1.0 1972 1.1 1973 1.2 1974 1.2
1975 1.1 1976 1.2 1977 1.3 1978 1.3 1979 1.5
1980 1.8 1981 1.6 1982 1.8 1983 2.1
Source: {66, 68).
Pounds per capita
0.8 1.3 3.4 1.0 1.7 4.1 .9 1.5 3.9 .9 1.5 3.9 .9 1.8 4.0
.8 1.8 4.1 1.0 2.0 4.1 1.1 2.2 4.5 1.1 1.9 4.0 1.2 2.0 4.2
.9 2.2 4.2 1.2 2.1 4.2 1.3 2.2 4.5 1.3 2.1 3.9 1.6 2.0 4.0
1.4 2.0 4.0 1.5 2.1 4.3 1.5 2.2 4.1 1.7 2.2 4.0 1.9 2.3 4.2
2.0 2.7 4.0 1.9 2.5 4.6 2.1 2.7 4.3 2.2 2.5 4.4
6.1 7.4 7.0 6,8 7.4
7.4 7.8 8.6 8.0 8.3
8.2 8.5 9.1 8.5 8.8
8.5 9.1 9.1 9.2 9.9
10,5 10.7 10.8 11.2
43
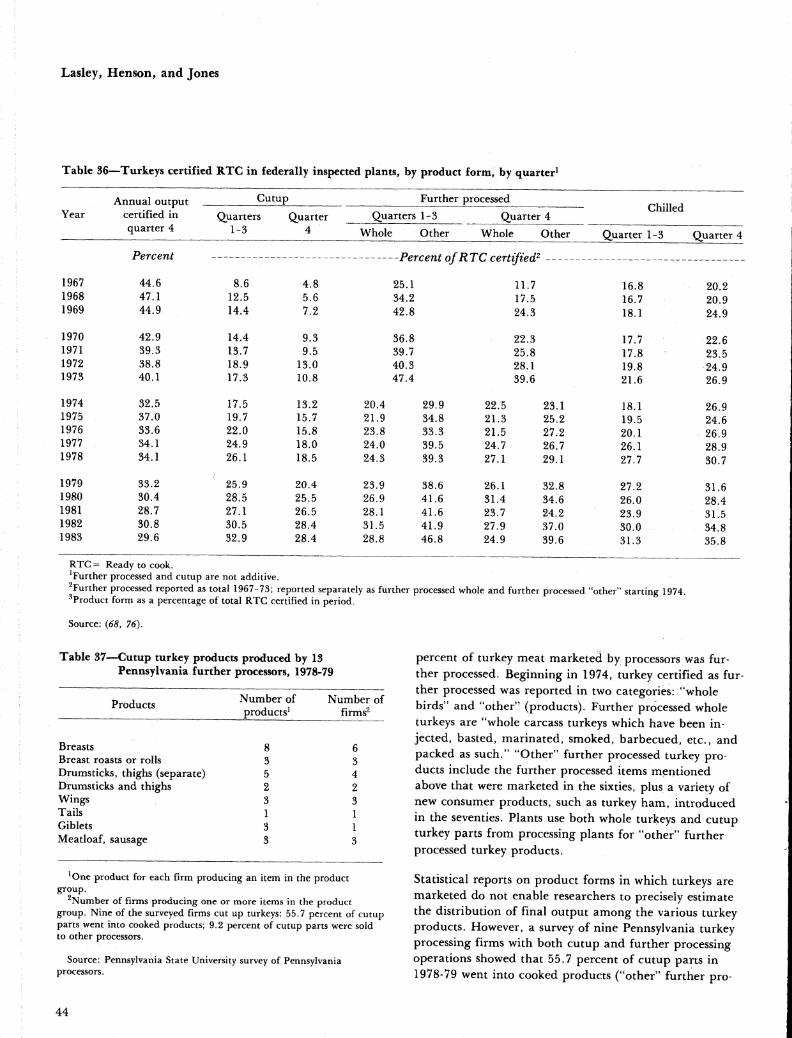
Lasley, Henson, and Jones
Table S6*—Turkeys certified RTC in federally inspected plants, by product form, by quarter^
Annual output certified in quarter 4
Cutup Further processed Chilled
Year Quarters Quarter 1-3 4
Quarters 1-3 Q uarter 4
Whole Other Whole Other Quarter 1-3 Quarter 4
Percent -Percent of RTC certified^
1967 44.6 8.6 4.8 25.1 11.7 16.8 20.2 1968 47.1 12.5 5.6 34.2 17.5 16.7 20.9 1969 44.9 14,4 7.2 42.8 24.3 18.1 24.9
1970 42.9 14.4 9.3 36.8 22.3 17.7 22.6 1971 39.3 13.7 9.5 39.7 25.8 17.8 23.5 1972 38.8 18.9 13.0 40.3 28.1 19.8 24.9 1973 40.1 17,3 10.8 47.4 39.6 21.6 26.9
1974 32.5 17,5 13.2 20.4 29.9 22.5 23.1 18.1 26.9 1975 37.0 19.7 15.7 21,9 34.8 21,3 25.2 19.5 24.6 1976 33.6 22,0 15.8 23.8 33.3 21.5 27.2 20.1 26.9 1977 34.1 24.9 18.0 24.0 39.5 24,7 26.7 26.1 28.9 1978 34.1 26.1 18.5 24,3 39.3 27.1 29.1 27.7 30.7
1979 33.2 25.9 20.4 23.9 38.6 26.1 32,8 27.2 31.6 1980 30.4 28.5 25.5 26.9 41.6 31.4 34.6 26.0 28,4 1981 28.7 27.1 26,5 28.1 41.6 23.7 24.2 23.9 31.5 1982 30,8 30.5 28.4 31.5 41.9 27.9 37.0 30.0 34.8 1983 29,6 32.9 28.4 28.8 46,8 24.9 39.6 31.3 35.8
RTC= Ready to cook. ^Further processed and cutup are not additive. Further processed reported as total 1967-73; reported separately as further processed whole and further processed "other" starting 1974.
^Product form as a percentage of total RTC certified in period.
Source: {68, 76).
Table 37—^^Cutup turkey products produced by 13 Pennsylvania further processors, 1978-79
Products Number of Number of products^ fírms^
Breasts 8 6 Breast roasts or rolls 3 3 Drumsticks, thighs (separate) 5 4 Drumsticks and thighs 2 2 Wings 3 3 Tails 1 1 Giblets 3 1 Meatloaf, sausage 3 3
^One product for each firm producing an item in the product group.
Number of firms producing one or more items in the product group. Nine of the surveyed firms cut up turkeys; 55.7 percent of cutup parts went into cooked products; 9.2 percent of cutup parts were sold to other processors.
Source: Pennsylvania State University survey of Pennsylvania processors.
percent of turkey meat marketed by processors was fur- ther processed. Beginning in 1974, turkey certified as fur- ther processed was reported in two categories: "whole birds" and "other" (products). Further processed whole turkeys are "whole carcass turkeys which have been in- jected, basted, marinated, smoked, barbecued, etc., and packed as such." "Other" further processed turkey pro- ducts include the further processed items mentioned above that were marketed in the sixties, plus a variety of new consumer products, such as turkey ham, introduced in the seventies. Plants use both whole turkeys and cutup turkey parts from processing plants for "other" further processed turkey products.
Statistical reports on product forms in which turkeys are marketed do not enable researchers to precisely estimate the distribution of final output among the various turkey products. However, a survey of nine Pennsylvania turkey processing firms with both cutup and further processing operations showed that 55.7 percent of cutup parts in 1978-79 went into cooked products ("other" further pro-
44

U.S. Turkey Industry
Table 38—Plants producing various types of further processed turkey products, by region, 1981i
Region^
Northeast Middle Atlantic East North Central West North Central South Atlantic East South Central West South Central Mountain Pacific
Total plants'*
Processed turkey whole/
parts^
2 22 13 17 12
2 8 3
12
91
Pot pies
4 1 2 3 3 0 1 0 1
15
Chicken and turkey
Entrees Dinners
Number
3 4 2 3 0 0 2 0 2
16
^Compiled from survey results reported in (53). ^Regional designations based on Bureau of Census definitions. Excludes Alaska and Hawan. ^Includes only plants that slaughter, eviscerate, or cut up turkeys. '^Number of plants not additive because of multiple processing of products in some plants.
0 2 3 2 2 0 1 0 0
10
Deli products
2 10
3 1 6 1 2 3 6
34
Turkey rolls or
1 12
4 4 5 1 2 2 3
34
cessed products). About 9 percent was also sold to other processors, presumably for further processing. There was a somewhat consistent upward trend in annual per capita pounds of turkey sold as further processed in 1974-82 (table 34). Most of the increase (1.9 pounds per capita) is accounted for by "other" further processed products.
Excluding 1961 and 1967, annual average per capita production of turkeys marketed as whole birds ranged from about 4.6 to 5.8 pounds during the 1960-82 peri- od. (Per capita production was exceptionally high in 1961 and 1967, years when year earlier net returns for turkey production were extremely favorable.)
Consumers have shifted somewhat to cutup and further processed turkeys for flexibility and convenience. Retail- ers also prefer handling precut and prepackaged items because these items are more economical than cutting turkey in their stores, and they can reduce space, labor, and the clutter associated with receiving, storing, cut- ting, and wrapping. Selling cutup and further processed products generally allows processors to increase both sales volume and markup per unit. Multiplant processors often specialize by concentrating further processing oper- ations in selected plants, although most slaughtering plants do have cutup operations. Specialized further pro- cessing plants often process red meat also, thus providing a wider product line, enabling them to reach more out- lets and more fully utilize facilities and distribution ser-
vices f2Ä, 29, 33, 48).
Consumption, Demand, and Prices
Consumers respond to changes in the price of turkey rel- ative to other food prices. However, consumer tastes and preferences also change over time; they respond to new products and to availability of the product. Each of these factors has played a major role in strongly increas-
ing the consumption of turkey.
Consumption Trends
Per capita consumption of turkey has risen by about 2 pounds each decade, from 4.1 pounds in 1950 to 10.8 pounds in 1982 (tables 29 and 35). Consumption is still highest during the Thanksgiving and Christmas seasons, but turkey is also widely sold at other times of the year. In 1980, about 40 percent of the yearly turkey consump- tion was during the last quarter. Twenty years earlier, about 55 percent of the yearly total was consumed dur- ing the last quarter. Over the 20-year period, fourth- quarter consumption rose by 16 percent, but consump- tion during the other three-quarters rose by 41 percent. Lower turkey prices and new product forms helped in- crease off-season consumption.
Turkey Price Trends
The retail price for whole turkeys trended downward from the midfifties through the midsixties. Since then, it has trended upward, approaching $1 per pound (table
45

Lasley, Henson, and Jones
40). Deflated retail turkey prices (in constant value dollars) trended downward through most of the 1955-83 period. There were only 8 years in the 29-year 1955-83 period when the average deflated retail price of whole turkeys was greater than the average for the previous year. In only 5 of these years was the increase from the previous year greater than 1.0 cent per RTC pound. There is a close relationship between turkey prices and costs. Deflated turkey prices declined, whereas actual prices increased because actual turkey prices increased less rapidly than the general price level for all goods and services.
Turkey meat competes with other meats for consumer dollars. During the 1960-82 period, 1 pound of turkey
Table 39—Structural comparisons of turkey slaughter, cutup, and further processing for plants under Federal inspection, 1981
Type of processing Turkey Total poultry
Million pounds
Total: Slaughter (certified RTC) Cutup^ Further processing^
2,509 688 985
15,179 1,404 2,712
m
Number
Plants performing: Slaughter Cutup Further processing^
129 175 445
NA 1,452 1,144
Plants with 20 percent of volume: Slaughter Cutup^ Further processing^
5
3
NA NA
10
Percent
Volume under Federal inspection processed by eight largest firms: Slaughter Cutup^ Further processing^
52.6 68.5 56.0
NA NA
34.5
RTC = Ready to cook. NA = Not available.
— Not shown to avoid disclosure of individual firms. ^Quantity inspected and used for cutup. Quantity inspected and used in further processing, excluding
further processing of whole birds.
Source: Compiled from unpublished Food Safety Inspection Service inspection data.
was equal in price to 1.2-1.3 pounds of frying chicken (table 41). During the 1960-64 period, 1 pound of turkey was equal in value to about 0.9 pound of pork or 0.6 pound of beef at retail. By 1980-82, retail prices for both pork and beef increased by about a third relative to whole turkey prices. This trend favors turkey consump- tion, and if it continues, additional boosts in turkey con- sumption can be expected.
The pork and beef prices used to calculate exchange val- ues in table 42 are weighted-average prices for retail cuts of pork and beef. Turkey prices are for the basic com- modity whole bird. However, as the proportion of turkey meat sold in product forms other than whole birds in- creases, the difference between the average retail price for all turkey marketed and the retail price for whole bird increases. Table 42 compares retail prices for se- lected frozen further processed products. Prices for these products have trended upward over the last several years, but detailed information on prices for turkey pro- ducts and on the distribution of output among products marketed is not available for calculation of weighted- average retail prices for turkeys.
Consumer preference for the higher priced products is increasing. So, too, is processors' interest in marketing such products. Wholesale prices for turkey parts and cooked products generally run higher than whole turkey prices (table 43). However, relative prices for different turkey parts and different size birds change with supply and demand conditions, both in the short run and long run.
An imbalance occasionally arises between the quantity of various parts available and effective demand. Parts prices vary in the short term, but the most desired parts have increased in price relative to other parts or whole birds (table 44). The New York wholesale price of turkey breast, for example, increased from 73 cents per pound in 1974 to 105 cents in 1982, a 44-percent rise, whereas drumstick and wing prices decreased by 10-20 percent. During the same time, prices for whole hens rose by 33 percent, from 46 to 61 cents. Relative prices for dif- ferent size birds also varied (5, 6, 7, 12, 14, 31, 51, 66, 67),
Demand Relationships for Turkey
The increase in per capita turkey consumption during 1960-83 (table 35 and fig. 4) could represent either an increase in demand for turkey with price assumed con-
46

U.S. Turkey Industry
stant, or a greater consumption at lower turkey prices due to increasing turkey supplies at lower costs (fig. 5). A combination of these two factors is most likely.
Demand for a good is traditionally defined as the sched- ule of quantities of that good which consumers are will- ing and able to purchase at various prices. Variables other than the price of the particular good are assumed
constant. These other variables, which change per capita demand for a good, are usually associated with changes in consumers' incomes, changes in the prices of substi- tute or complementary goods, and changes in consumers' tastes and preferences. Consumers can, therefore, pur- chase varying quantities of a good without changing de- mand if they vary the quantity they take in response to a
change in the price of the good.
Table 40—Turkey prices, farm-to-retail price spreads, and per capita consumption*
Farm value
P'aTm-to- Retail price Annual
Year c Bit m v\j
retail price spread
Actual Deflated^ per capita
consumption
/^¿»«M^C / ih/SIÊVi /I RTC Pounds i^eTiis/ puurtiU, i\ Á o
1955 40.9 20.7 61.6 76.8 5.0
1956 33.8 23.1 56.9 69.9 5.2
1957 31.5 19.3 50.8 60.3 3.9
1958 30.9 21.7 52.6 60.7 5.9
1959 34.4 16.9 51.3 58.8 6.3
1960 36.2 19.3 55.1 62.1 6.1
1961 22.0 22.8 44.8 50.0 7.4
1962 29.7 19.3 49.0 54.1 7.0
1963 29.7 19.7 49.4 53.9 6.8
1964 27.2 19.6 46.8 50.4 7.3
1965 28.9 19.2 48.1 50.9 7.4
1966 29,9 20.5 50.4 51.9 7.8
1967 25.5 23.2 48.7 48.7 8,5
1968 25.1 21.3 46.4 44.5 7.9
1969 27.5 21.6 49.1 44.7 8.2
1970 30.2 25.9 56.1 48.2 8.0
1971 29.9 26.4 56.3 46.4 8,3
1972 30.2 26.4 56.6 45.2 8.9
1973 58.1 32.2 90.3 67.8 8.5
1974 40.4 31.0 71.4 48.3 8.8
1975 46.4 31.9 78.3 48.6 8.5
1976 38.6 35.3 73.9 42.9 9.1
1977 46.9 30.4 77.3 42.6 9.1
1978 58.3 29.5 87.8 44.9 9.1
1979 59.2 29.9 88.2 40.6 9.9
1980 61.8 33.9 95.7 38.8 10.5
1981 42.3 50.4 92.7 34.0 10.8
1982 48.7 43.9 92.6 32.1 10.8
1983 54.0 36.8 90.8 30.4 11.2
RTC = Readyto-cook basis. * Prices and spreads are averages for Oct.-Dec. ^Deflated prices are current prices deflated by the consumer price index for all items. 1967= 100.
Source: (6, 7. 23, 63, 65, 68, 69).
47

Lâsley, Henson, and Jones
FiguTe 4 shows the relationship between deflated retail prices for whole turkeys and annual per capita turkey consuinption from 1960 through 1983. As real price of turkey declined from 70-80 cents per pound in the fifties to 40 cents per pound in the late seventies and early eighties, the quantity of turkey consumed increased from 5 pounds to over 11 pounds per capita. It appears that increased annual per capita cansumption between 1960
Table 41- -Selected competing meats equal in cost to 1 pound of turkey at retail, 1960-81
Period Pork Beef Frying chicken
Pounds
1960-64 0.86 0.63 1.22 1965-69 .70 .57 1.21 1970-74 .70 .51 1.31 1975-79 .59 .51 1.23 1980-82 .59 .39 1.28
and 198B resulted principally from lower prices. Rela- tionships between annual per capita production and pre- vious-year average deflated production costs and farm values show that annual average production costs decreased through most of the past 20 years and that producers were wiUing and able to produce increasing quantities of turkey at decreasing prices (fig. 5). These increases in quantities supplied contributed to lower prices and higher per capita consumption during 1960-83. However, it is likely that consumer demand has also in- creased during the period in response to increasing con- sumer incomes and increases in prices of competing goods, mainly beef and pork, relative to turkey prices. It is also likely that consumers' tastes and preferences shifted toward turkey meat during that period, particularly as many new turkey product forms were introduced (34).
Seasonal relationships in turkey meat consumption (fig. 6 and 7) suggest that between 1964 and 1981 per capita demand for turkey increased in the first three quarters
Table 42—Retail price trends per package for selected frozen further processed poultry products, 1970-83
Chicken or Chicken or Turkey Chicken or Chicken or Year turkey pies turkey dinners roasts turkey and gravy turkey boiled
(8 oz.)i (11 OZ,)2 (32 oz,f (32 oz.) in bags (5 oz.)
Cents ~~ Dollars Cents
1970 19.9 44.0 2.61 1.18 1971 19.0 42,9 2.45 1.08 1972 19.5 46.5 2.67 1.13 26 0 1973 22.3 42.3 3.06 1.26 26 4 1974 23.8 47.7 2.90 1.20 26.0
1975 23.5 50.7 2.19 1.11 27 6 1976 23.6 51.4 2.96 1.10 24 3 1977 25.2 44.0 3.08 1.10 26 7 1978 26.2 62.0 2.89 1.30 30 0 1979 27.8 61.0 3.36 1.60 38.6
1980 30.2 63.0 3.12 1.56 48 7 1981 33.9 74.0 3,32 1.59 42 6 1982 38.4 77,0 3.04 1.58 41 5 1983 37.9 82.1 2.85 1.61 41.1
^Prices for turkey pies and chicken pies are about the same as prices for meat pies. Prices for turkey and chicken frozen dinners are similar to prices for meat dinners.
equSir ^ ^'^^ '^"^"^ °^ ^"""^^^^ '''^' '^'* *""* white meat and mixed meat combinations. Prices adjusted for package size to 32-ounce
Sources: Data for 1970-76 derived from monthly averages of advertised retail prices in 21 trading areas of the U.S. from (42). Data for 1977-83 denved from retail prices for Atlanta, Ga., market areas as advertised in (2). Prices adjusted for package size where appropriate.
48

U.S. Turkey Industry
Table 43—Wholesale price trends for certain further processed turkey products, selected years, 1965-82
Type of product 1965 1970 1972 1974 1979 1980 1981 1982
Dollars per pound
Boneless turkey roasts (raw, LCL 60-percent white, 40-percent dark)
Turkey breasts (boned, oven-roasted)
Cooked turkey rolls: 60-percent white and 40-percent dark All white meat
Cooked, diced turkey meat (60-percent white and 40-percent dark) mixed portions
Ground turkey meat (raw, frozen 40-lb. box, dark ground, T/L)
Turkey hot dogs (frozen, T/L)
0.79 0.81 0.74 1.00 1.28 1.42 1.64 1.48
1.42 1.55 1.40 1.73 1.83 1.78 1.87 1.22
.82 1.02
.84 1.05
.77
.97 1.07 1.21
1.23 1.36
1.05 1.16
1.14 1.24
1.22 1.31
1.12 .92 .92 1.14
.74
1.22
.77
1.14
.70
.68
.99
.75
.53
— = Not available. LCL= Less than car load. T/L = Truck load.
Source: {61),
Table 44—New York wholesale prices of selected turkeys and turkey parts, 1974-82
1.33
.55
.63
Fryer- roasters,
4-9 pounds
Young hens, 8-16
pounds
Young toms Breasts, 10-12
pounds
Bulk parts
Year 14-20 pounds
28-30 pounds
Drumsticks Wings, full cut
Cents per pound
1974 1975 1976
48.8 55.8 50.5
46.5 53.2 48.7
43.9 50.8 48.7
48.3 55.8 64.4
73.0 87.4 85.0
27.8 28.0 24.0
31.6 34.6 24.8
1977 1978 1979
1
1
1
54.0 66.7 67.5
53.3 65.0 63.7
64.9 74.2 79.8
93.9 106.2 107.5
21.6 28.6 32.8
26.7 32.3 33.6
1980 1981 1982
1
65.5 1
63.6 60.7 60.8
62.6 61.1 61.7
65.82 66.72 63.82
110.8 102.0 104.8
33.1 27.8 25.8
27.5 26.7 25.4
^Insufficient data reported. ^24- to 26-pound toms.
Source {65).
49

Lasley, Henson, and Jones
Figure 4
Per Capita Turkey Consumption and Real Retaii Prices*
<i^ per lb 90
80
70
60
50
40
30
20
• 1956
•56 •73
57^ «5962
677lVf372
• 81 82 •
83
0 2 4 6 8
Pounds *PrJces in 1967 constant dollars.
10 12 14
of the year and that demand in the final quarter may have decreased. Furthermore, consumption now appears more responsive to price changes in the first three quar- ters, but less responsive in the final quarter. These trends are reasonable as turkey consumption increased mostly in the first three quarters, and this increase was primarily in further processed products or cutup parts, product forms which are more adaptable than whole turkey as substitutes for other meats.
Most studies assume that the quantity of turkey demanded is a function of whole turkey prices and certain demand determinants. Before 1970, most turkeys were purchased by consumers as whole birds and there was little reason to question this assumption. However, during the seven- ties, increasing proportions of turkey were marketed in value-added forms, cutup parts, or further processed whole birds or products. These product forms are sold to consumers at prices higher than are whole birds (table 42). Thus, average prices consumers pay for increasing quantities purchased are now considerably higher than traditional whole bird prices, and this difference is in- creasing. The immediate result of using whole bird
prices to estimate turkey demand is either that increases in demand for turkey are likely underestimated or that decreases are overestimated. The problem is further complicated by the fact that value-added products, par- ticularly further processed items, are likely to be dif- ferentiated goods sold as branded products, and prices for these goods are not so closely related to whole bird prices. Prices for cutup parts are more closely associated with whole bird prices. Because 40 percent of turkey meat is now further processed, there is a wide range of retail prices that consumers actually pay for the variety of cutup turkey parts and further processed turkey products.
Elasticity of demand of turkey meat is defined as the percentage change in quantity of turkey purchased which accompanies a 1-percent change in the price of turkey or in one of the demand determinants. Direct price elasticities are usually negative because relation- ships between quantities of goods demanded and their own prices are usually inverse. Cross elasticities and in- come elasticities measure the response in quantity pur- chased of a particular good to changes in prices of other goods or in consumers' incomes. Gross elasticities of de- mand for turkeys associated with prices of other meats are expected to be positive because turkey meat and other meats are substitute goods. The income elasticity of demand for turkey would also be expected to be posi- tive because consumers will vary the quantity taken in direct relationship to their ability to purchase turkey.
Estimates of demand elasticities for turkeys at the retail level reported in various studies include -1.555 for the 1946-68 period (22), -1.404 for the 1955-57 period (10), and -0.6485 for the 1953-77 period (24). Estimates of in- come elasticities of demand for turkeys reported in these first two studies were 0.768 and 0.490, respectively. The estimate of income elasticity in the third study was not statistically significant. In another study, price elasticities of demand for turkeys at the farm level were estimated for the 1960-67 period at -0.36 in the first quarter, -0.99 in the second quarter, -0.90 in the third quarter, and -0.45 in the fourth quarter (50). Demand elasticities at the farm level would be expected to be less than those at the retail level as farm prices are lower and a given change in price represents a larger percentage change.
We estimated more recent demand relationships at the retail level for the 1969-81 period (see appendix). We used monthly data and measured all prices and income in deflated dollars. Table 45 gives estimated elasticities
50

U.S. Turkey Industry
and an estimate of the annual trend in the level of demand for turkeys. The annual trend is a proxy for changes in consumer tastes and preferences for turkeys (including marketing innovation). If one compares results of studies in which data for different time periods were analyzed, one sees that the direct price elasticity for turkeys is decreasing over time and that consumers are becoming less responsive to changes in turkey prices. Perhaps most of the price effect has already been realized through the extended period of relatively low real prices for turkey.
Even if improvements in efficiency of turkey production continued to decrease the real price of turkeys, oppor- tunities to increase turkey consumption by reducing tur-
key prices have diminished.
Pork was the only meat we identified as a substitute for turkey. Although the relationship was statistically signifi- cant at a high probability level, a major large change in pork prices would be required to generate any substan- tial change in the demand for turkey.
Figure 5
Annual Turkey Production
^ per lb *
32
30
28
26
60
62 63 ,61
»65 .66
68 ►75 24 -
22
20
18
16
14
69 70 >71
1961-65
1966-1969
»74 1972-78
67
77
► 72
'73 ►78
• 80 '79
• 82 .81
»83
8 9 Per capita turkey production, lbs
10 11 12
* Deflated retail turkey production cost lagged 1 year.
51

Lasley, Henson, and Jones
The estimated response of turkey demand to changes in consumer income was also less than estimates calculated by use of data from earlier time periods. Therefore, future increases in turkey demand due to increasing con- sumer income will likely occur at a proportionally slower rate. The estimated 1969-81 trend increase in demand for turkey was 0.111 pound per year. In the first three quarters of the year, demand trended upward at an an- nual rate of 0.168 pound, whereas in the fourth quarter, demand trended downward at an annual rate of -0.060
pound (see appendix). Demand seasonality for turkey averaged about 1 pound highei per consumer per month in November than in any other month. The level of de- mand was lowest in the first quarter and increased pro- gressively through the fourth quarter.
Average per capita turkey consumption in 1965-69 was 8.0 pounds per year, whereas it was 10.7 pounds in the 1980-82 period, an increase of 2.7 pounds. We used the demand relationships in table 46 to estimate the distri-
Figure 6
Per Capita Turkey Consumption (t per ib *
55
50
45
40
1970-83
35
30
1964-69
3 4
* Deflated retail turkey price {base year = 1967)
5 6 Per capita turkey consumption, lbs, quarters 1-3
52

U,S. Turkey Industry
bution of the change in turkey consumption among sources. About 41 percent of the net increase ^ in annual average turkey consumption during the period can be accounted for by the decrease in real turkey prices. This portion represents an increase in the quantity of turkey purchased in response to a lower price; it does not represent an in- crease in the demand schedule for turkey.
^Net ihcrease accounts for a decrease in demand for turkey because of a decrease in real prices for pork.
The cross elasticity of demand for turkey associated with changes in pork prices was relatively small. However, the real price of pork decreased during the period and ex- erted a downward pressure on turkey demand; the im- pact of this change in annual consumption was about -0.2 pound per person. The 18.8-percent increase in average per capita income accounted for 0.2 pound, or 8 percent of the net increase in per capita turkey con- sumption (table 46). However, the annual trend (the proxy for consumers' tastes and preferences) accounted
Figure 7
Quarterly Per Capita Turkey Consumption
$ per lb *
55
,66
^^» »65
50 • 64
.74 .70 •69 .67
45 — • 68 «71 • 78
• 77 • 76
• 72
40 — • 79
• 80
35 —
• 82
• 81
30 1 • t 33 1 1
PBT capita turkey consumption, lbs, quarter 4
•Deflated retail turkey price (base year = 1967). 1973 price, beyond the scale of this chart, was 66.5 cents per lb. and consumption dropped to 3.9 !bs, per capita.
53

Lasley, Henson, and Jones
Table 45—Demand elasticity relatioiaships for turkey, 1969-81
Table 46—Factors responsible for change in annual per capita turkey consumption, 1965-69 to 1980-82
Direct price elasticity for turkey (retail level)
Cross elasticity with pork price
Income elasticity for turkey
Annual trend in level of demand
Percent
~0A72
+ .186
+ .131
Pounds per capita
.111
for 1.6 pounds or 60 percent of the estimated net in- crease in per capita turkey consumption in 1965-82. This finding is reasonable as the upward trend in demand was in the first three quarters when consumers are more likely to use turkeys in product forms other than the traditional whole bird. Most of the increase in turkey consumption was in new products which cater to con- sumer desires other than that for the traditional holiday consumption of whole turkeys. Continuing development of new turkey products which appeal to changing con- sumer tastes will likely provide the turkey industry with the best opportunity for growth.
Note that the above relationships were estimated based on wlwjle turkey prices even though more and more tur- key sales are in forms other than whole birds and are priced higher than whole birds. Therefore, demand has likely increased more than the estimates reported above would suggest. Because most of the increased consump-
Share Factor change Change in turkey consumption
contributed
Retail price of turkey (deflated)
—Percent-
Retail price of pork (deflated)
Per capita income (deflated)
Annual trend (14 years)
Total change
28.1
-15.1
18.8
NA
13.26
2,81
2.46
NA
Pounds
L06
-.22
.20
1.55
2.59 NA = Not available — = Not applicable.
tion in recent years has been in products with higher- than-whole-bird retail prices, the magnitudes of demand elasticities are probably somewhat more elastic (respon- sive to price change) than the estimates reported. The discrepancies are probably larger for estimated relation- ships for the first three quarters of the year when rela- tively large proportions of turkey consumption are in the higher priced, less traditional forms. The fourth-quarter holiday season favors consumer purchases of the tradi- tional whole bird at lower prices, consumed at relatively stable annual per capita rates.
54

U.S. Turkey Industry
References
(1) Anderson, Roice H. An Economic Analysis of Turkey Production in Utah. Bull. 395. Utah State Agr. College, Div. of Agr. Sciences Expt. Sta., 1954.
(2)
(3)
(4)
Atlantic Constitution. Various issues.
Bawden, D. Lee. The Cost of Producing Turkeys: A Comparison Among States. Bull. 588. Univ. of Wisconsin, College of Agr. and Life Sciences, June
1968.
, H. O. Carter, and G. W. Dean. Inter- regional Competition in the United States Turkey Industry. Univ. of California, Hilgardia (series), Vol. 37, No. 13, June 1969.
(5) Bessler, David. A., and Lee F. Schrader. "Measur- ing Leads and Lags Among Prices: Turkey Pro- ducts," ^gncw/íí¿ra/Economics i?g5earc/i. Vol. 32, No. 3, July 1980.
(6) Blase, Kenneth, and Sandra LeSesne. Egg and Poultry Price Spreads, 1971-76. SB-595. U.S. Dept. of Agr., Econ. Res. Serv., Jan. 1978.
(7) .. Egg and Poultry Price Spreads, 1976-80. Staff Report AGES820704. U.S. Dept. of Agr., Econ. Res. Serv., July 1982.
(8) Blase, Kenneth E., and George B. Rogers. Market Structure of the Food Industries, Poultry and Eggs. MRR-972. U.S. Dept. of Agr., Econ. Res. Serv., Sept. 1972, pp. 37-50.
(9) Blomo, V. J., and D. E. Farris. Seasonal Demand and Supply for Turkeys. Dept. Inf. Rept. 72-10. Texas A&M Univ., Dept. of Agr. Econ. and Rural Sociology, Nov. 1972.
(10) Brandow, G. E. Interrelations Among Demands for Farm Products and Implications for Control of Market Supply. Bull. 680. Pennsylvania State Univ., Aug. 1961.
(11) Burbee, C. R. Minnesota Agricultural Economist. No. 323. Univ. of Minnesota, Agr. Ext. Serv., Oct.
1969.
(12) Cook, Hugh L,, and Bruce Marion. Economic Issues. Univ. of Wisconsin-Madison, Jan. 1981.
(13) DeVault, S. H., and Mary Ingersoll. An Economic Study of 147 Turkey Flocks in Maryland. Bull. No. 355. Univ. of Maryland, Aug. 1933.
(14) Eidman, Vernon R,, Harold O. Carter, and Gerald W. Dean. Decision Models for California Turkey Growers. Giannini Foundation Monograph No. 21. Univ. of California, Div. of Agr. Sciences, Calif.
Agr. Expt. Sta., July 1968.
(15) Eidman, Vernon R., Gerald W. Dean, and Harold O. Carter. Economies of Scale in California Turkey Production. Giannini Foundation Res. Rept. No. 298, Univ. of Calfornia, Div. of Agr. Sciences, Calif. Agr. Expt. Sta., Aug. 1968.
(16) Espenschied, Robert P., and Ralph L. Baker. Pro- ducer Processing of Turkeys. KGS. Cir. 161. Ohio Agr. Res. and Devel. Center, Wooster, Ohio, Sept.
1968.
(17) Fischer, Charles M. Studies in Turkey Marketing in the Western States. Western Regional Res. Publ., Special Rpt. No. 6. Utah Agr. Expt. Sta., May 1952.
(18) Gallimore, William W. Contracting and Other Integrating Arrangements in the Turkey Industry. MRR-734. U,S. Dept of Agr., Nov. 1965.
(19) . Regional Differences in Growth of the United States Turkey Industry. North Carolina State Univ., Ph. D. thesis (unpublished), 1969.
(20) , and Ruth J. Irvin. The Turkey Industry: Structure, Practices, and Costs. MRR-1000. U.S Dept. of Agr., Econ. Res. Serv., June 1973.,
(21) Gallimore, WilUam W., and James G. Vertees. A Comparison of Returns to Poultry Growers Under Contract vs Operating Independently. MRR-814. U.S. Dept. of Agr., Econ. Res. Serv., Feb. 1968.
(22) George, P. S., and G. A. King. Consumer Demand for Food Commodities in the United States with Projections for 1980. Giannini Foundation Mono- graph No. 26. Calif. Agr. Expt. Sta., Mar. 1971.
55

Lasley, Henson, and Jones
(23) Gray, Leo R., and Ruby J. Willis. Prices and Price Spreads for Eggs, Frying Chickens, and Turkeys in Selected Cities, 1936-61. ERS-60. U.S. Dept. of Agr., Econ. Res, Serv., Apr. 1962.
(24) Haidacher, Richard C, and others. Consumer De- mand for Red Meats, Poultry, and Fish. Staff Report AGES 820818. U.S. Dept. of Agr., Econ. Res. Serv., Sept. 1982,
(25) Harp, Harry H. The Food Marketing Cost
Index: A New Measure for Analyzing Food Price Changes. TB-1633. U.S. Dept, of Agr., Econ. Stat. Serv., Aug. 1980.
(26) Harris, Marshall. Entrepreneurial Control in Farming. ERS-542. U.S. Dept. of Agr., Econ. Res. Serv., Feb. 1974.
(27) Jones, Harold B., Jr. ''Government Regulatory Agencies Affecting the Turkey Industry: Descrip- tion and Economic Impact." Speech, Southern Agr. Econ. Assn., Nashville, Tenn,, Feb. 5-8, 1984.
(28) The Market Potential for Further Processed Poultry Products. Res. Bull. 118. Univ. of Georgia, Agr. Expt. Sta., Nov. 1972.
(29) _ _, and George B. Rogers. Costs, Margins, and Projected Consumption of Turkey Rolls and Roasts. MRR-1023, U.S. Dept. of Agr., Econ. Res. Serv., May 1974.
(30) Rung, Yu-Lein, and Robert L. Jack, Estimated U,S. Retail Demand for Chicken Broilers, 1960-77. RM No. 82. West Virginia Univ., Agr. and For. Expt. Sta., July 1980.
(31) Lance, G. Chris. Economic Analysis of Turkey Pro- duction Costs in Georgia. Res. Bull. 147. Univ. of Georgia, Dept. of Agr. Econ., Georgia Expt. Sta, Nov. 1973.
(34) Lu, Yao-chi, and Leroy Quance. Agricultural Pro- ductivity: Expanding the Limits. AIB-431. U.S Dept. of Agr., Econ. Stat. Coop. Serv., Aug. 1979.
(35) Marsden, Stanley J, Turkey Production. AH-393. U,S, Dept. of Agr., Agr. Res. Serv., Mar. 1971.
(36) Mighell, Ronald L., and William S. Hoofnagle. Contract Production and Vertical Integration in Farming, 1960 and 1970. ERS-479. U.S Dept. of Agr., Econ. Res. Serv., Apr. 1972.
(37) Mountney, G. J., E. D. Parnell, and R. B. Halpin. Factors Influencing the Prices Received for Texas Turkeys. Bull. 777. Texas Agr. Expt. Sta., May 1954.
(38) Muir, Forest. Poultry Management and Business
Analysis Manual for the SO's. Bull. No. 566 (revised). Cooperative Ext. Serv., Univ. of Maine, 1980.
(39) ..1974-75 Poultry Management and Business Analysis Manual Bull. No. 566. Cooperative Ext. Serv., Univ. of Maine, 1975.
(40) National Commission on Food Marketing. Organization and Competition in the Poultry and Egg Industries. Tech. Study No. 2, June 1966.
(41) Pederson, John R. Economies of Scale in Turkey Hatcheries. MRR-719. U.S. Dept. of Agr., Econ. Res. Serv., July 1965.
(42) Quick Frozen Foods. Cleveland, Ohio: Harcourt Brace Jovanovich Publications, various issues.
(43) Reimund, Donn A., J. Rod Martin, and Charles V. Moore. Structure Change in Agriculture: The Ex- perience for Broilers, Fed Cattle, and Processing Vegetables. TB-1648. U.S. Dept. of Agr,, Econ. Stat. Serv., Apr. 1981.
(32) Production and Marketing Practices and Contracts for Georgia Turkey Producers. Res. Bull. 280. Univ. of Georgia, College of Agr. Expt. Stat. Sept. 1982.
(33) Lasley, Floyd A. The U.S. Poultry Industry: Changing Economics and Structure. AER-502. U.S Dept. of Agr., Econ. Res. Serv., July 1983.
(44) Rhodes, V. James. Changes in Turkey Contracting, 1967-68. Tech. Bull. 886, Univ. of Missouri- Columbia, Agr. Expt. Sta., Mar. 1970.
(45) Rogers, George B. 'Toultry and Eggs," Another Revolution in U.S. Farming^ by Lyle P. Schertz and others. AER-441. U.S. Dept. of Agr., Econ. Stat. Coop. Serv., 1979.
56

U.S. Turkey Industry
(46) . Price Spreads, Costs and Productivity in Poultry and Egg Marketing, 195^-74. AER-326. U.S. Dept. of Agr., Econ. Res. Serv., Feb. 1976.
(47) Rogers, George B.. and Ruth J. Irvin. Interregional Movements of Eggs and Poultry, 1933-73. SB-565. U.S. Dept. of Agr., Econ. Res. Serv., Mar. 1977.
(48) Rogers, George B., and Harold D. Smith. Further Processing Industry and Impact of Economies of Scale in Poultry Plants. Misc. Publ. 595. Univ. of Maryland, Agr. Expt. Sta., Dec. 1966.
(49) Roy, Ewell Paul. Contract Farming. Louisiana State Univ., Dept. of Agr. Econ. and Agribusiness, 1963.
(50) Russell, Walter. Missouri Turkey Record Analysis, 1967. Univ. of Missouri-Columbia, Ext. Div., 1968.
(51) Schrader, Lee. F., and Mahlon G. Lang. Turkey
Pricing in the United States. Stat. Bull. No. 275. Dept. of Agr. Econ., Agr. Expt. Sta., Purdue Univ., Apr. 1980.
(52) Schroeder, J. Price. Turkey Meat Production Costs. Univ. of California-Parlier, Agr. Ext. Serv., July 1972.
(53) Schwartz, Alfred N. "Directory Processors and Fur- ther Processors: Poultry and Egg Marketing," Poul- try and Egg News, Gainesville, Ga., Aug. 1981.
(54) Soliman, M. A. Quarterly Econometric Model of the Turkey Industry in the United States. Tech. Bull. 275. Univ. of Minnesota-St. Paul, Agr. Expt. Sta.. 1970.
(55) . Statistical Analysis of Cyclical Variations in the National Turkey Market. Tech. Bull. 276. Univ. of Minnesota-St. Paul, Agr. Expt. Sta., 1971.
(56) , and C. R. Burbee. Economic Analysis of United States Turkey Prices and Producer Income. Tech. Bull. 281. Univ. of Minnesota-St. Paul, Agr. Expt. Sta., 1971.
(57) Swenson, Clyde Geoffrey. Seasonal Variation in the Demand for Turkeys. Ph. D. thesis, Univ. of Min- nesota-St. Paul, Mar. 1967.
(58) Thompson, Eric G., and V. James Rhodes. Con- tract Production of Turkeys. B-879. Univ. of Missouri-Columbia, Agr. Expt. Sta., 1969.
(59) Tully, W. C, and E. P. Johnson. Turkey Facts for Virginia. Virginia Agr. and Mechanical College and Polytechnic Institute-Blacksburg, with U.S.
Dept. of Agr., Mar. 1936.
(60) Turkey World. Watt Publishing Company. Various issues.
(61) Urner, Barry. Price Current. Toms River, N.J.: Barry Urner Publications, Inc., various issues.
(62) U.S. Congress. Government Subsidy Historical Review: A Summary of the Use of Subsidies to Ad- vance the Aims and Purposes of Government. 91st Congress, 2d Session, committee print, Dec. 1970.
(63) U.S. Department of Agriculture, Economic Research Service. Developments in Marketing Spreads for Agricultural Products. Selected issues.
(64) *ERS Data Books." Available from the authors.
(65) Farm-Retail Spreads for Food Products. MP-741. May 1975.
(66) _. Livestock and Meat Outlook and Situation. LMS-244, Feb. 1982, and various issues.
(67) _. National Food Review. NFR-14. 1981, and
various issues.
(68) . Poultry and Egg Situation. Various issues.
(69) . Poultry and Egg Statistics. Various issues.
(70) U.S. Department of Agriculture, Statistical Report- ing Service, Crop Reporting Board, Agricultural Prices. Various issues.
(71) Eggs, Chickens, and Turkeys: Annual Revisions. Various issues.
(72) . Eggs, Chickens, and Turkeys: Hatchery Production. Various issues.
57

Lasley, Henson, and Jones
(73) .. Farm Production, Disposition and Income, (77) U.S. Department of Commerce, Bureau of the Cen- Turkeys, 1929-19^9. Apr. 1942. sus. Census of Agriculture, 1954-78 issues.
(74) Hatchery Production. Various issues. (^^) • Census of Manufacturers, 1977. 1977.
,^^. „ , r. , . ^. .. , (79) U.S. Department of Labor. HanddooÄ o/La6or (75) _ Poultry, Production, Disposition, and In- Statistics. Bull. 2000, 1979.
come. Various issues.
(80) __. Bureau of Labor Statistics. Producer Price (76) . Poultry Slaughter. Various issues. Index: Various issues.
58

U.S. Turkey Industry
Appendix: Demand Equations for Turkeys
We used monthly data for 1969 through 1981 to estimate retail demand for turkeys. Prices and in- come were deflated by the Consumer Price Index, with 1967 = 100. We used ordinary least squares to estimate the parameters of the model. A single-equation model was estimated because turkey supply within a given month is mostly predetermined. Turkey consumption was specified as a function of the price of turkey, prices of other meats (beef, pork, and chicken), and consumer income. The model included an annual trend variable to account for changes over time in consumer tastes and preferences. We used discrete variables to test for varia- tions among months in the level of turkey demand. We used interaction variables to test for seasonal variations in demand relationships. The final model estimated was:
CT^= 1.0401 - 0.0080 PT^ -f 0.0011 (PP^QP,) (11.0620) (4.0936) (4.0329)
+ 0.4393 (Y^TRJ -f 0.9655 NOV^ - 0.7664 Ql^ (6.1914) (32.6936) (20.4961)
- 0.6699 Q2^ - 0.4611 Q3, - 0.0185 Q4^TR^ (17.8890) (12.4050) (4.2716)
R2 = 0,96 Durbin-Watson = 1.96 (1)
where:
CT,
PT,
PP.
QPt =
TR, =
consumption of turkey, pounds per capita in month t; deflated retail price of turkey, whole birds, cents per pound in month t; deflated retail price of pork, cents per pound in month t; consumption of pork, pounds per capita in month t; deflated disposable personal income, $100,000 per capita annual rate in month t; annual trend; TR^ = 1 for 1969, TR^ = 2 for 1970, TR^ = 3 for 1971, TR, = 13 for 1981;
ISIOVj = discrete variable for demand shift in November; NOV^ = 1 in November, NOVj^ = 0 in all other months; and
Ql^ Q2^, Q3^, and Q4^ = discrete variables for seasonal demand shifts;
Ql^ = January 1 through March, Ql^ = 0 in all other months;
Q2j^ = April 1 through June, Q2^ = 0 in all other months;
Q3^ = July 1 through September, Q3^ = 0 in all other months; and
Q4^ = October 1 through December, Q4^ = 0 in all months.
The numbers in parentheses are Student t-statisitics. All parameters in the model are statistically significant at the 99-percent probability level. The model accounted for 96 percent (R^) of the variation in monthly average per capita turkey consumption during 1969-81. The Durbin-Watson statistic indicates no serial correlation in the estimated residuals. The signs of the coefficients are those expected.
Estimates of relationships between turkey demand and prices of beef and chicken were not statistically signifi- cant at an acceptable level. Prices for these meats were not included in the final model. To reduce the problem of intercorrelation among prices of meats, we used ex- penditures (for example PP^QP^) for substitute goods in- stead of prices (PP^) (see 30, p. 11). There was a strong inter-relationship between per capita income and the an- nual trend. This relationship was accounted for by use of a variable in the model which was the product of in- come times trend. Except for November, differences among estimates of monthly demand shifts within quar- ters were not statistically significant at an acceptable level. Thus, quarterly demand shifters were included in the final model. The rate of increase in per capita de- mand for turkeys was less in the fourth quarter than in the first three quarters. We accounted for this difference by including a variable calculated as a product of the fourth-quarter demand shifter (Q4^) and the trend variable (TR^^).
We used parameters in the demand equation to calcu- late the elasticities reported in the text. At the means of the data, the general equation for estimation of elastic- ities is:
E = b (2)
where:
b = regression coefficient of Y with respect to X, Y = average value of the independent variable, and X = average value of the dependent variable.
59

Lasley, Henson, and Jones
Average values of CT and PT were 0.757 and 44.627. respectively. Thus, based on momhly data, the direct price elasticity of demand (E) for turkeys is:
E = -0.008 44.627 0.757
= -0.472 (3)
We estimated the cross elasticity of turkey consumption with respect to pork price using a procedure outlined by Rung and Jack {30, pp. 27-30), because of the relation- ship between pork prices and pork consumption. Aver- age values of PP^ and Q^P^ were 70.237 and 5.016. respectively. Haidacher and others (24, p. 14) estimated the direct price elasticity of demand for pork (Pe) was -0.730. Thus:
Pe = b PP
= -0.730 = b 70.237 5.016
b = --0.052 = PP
QF= -0.052 PP
From the turkey demand equation, one derives:
CT
(4)
fPP QP) = 0.011
CT PP QP + QP PP
CT 70.237 QP if 5.016 PP
= 0.011
= 0.011 (5)
Substituting^ equation (4) in equation (5), one derives:
CT 70.137 (-.052 PP) -h 5.016 PP
CT
s 0.011
PP = 0.002
Cross elasticity of demand for turkey with respect to pork price is:
Ep = CT PP
PP CT
= 0.002 70.237
0.757 0.186
We also estimated the income elasticity at the means by using the general equation for calculation of elasticities. Averages of Y and TR were 0.032 and 7.039, respective- ly. Income elasticity of demand (Ey) for turkey was:
Ey = (Ü.4393 X 7.039) 0.032 0.757 = 0.131 (6)
The trend (proxy for change in the level of demand because of changes in consumers' tastes and preferences including marketing innovation) was estimated in pounds per month. Monthly average trends were ag- gregated to provide an estimate of the annual trend.
The trend on a monthly basis for the first 9 months was: TQl-a = (0^39) (0.032) = 0.014 pound per month. The trend for the last 3 months was: TQ4 = (a.439 X 0.032) - 0.019 = — 0.005 pound per month. The annual trend in the demand for turiceys was: (9 X 0.014) 4^ (3 X (-0.005)) = 0.111 pound per year.
60

U.S. Turkey Industry
Appendix table 1—Consumer price index and price indexes for selected production inputs
Consumer Producer Fuels and Wages in
price index
related food and Turkey Year
price index
Containers products kindred ration
(CPI) (PPI) and power industries
1960-= 100
1950 8L3 84.3 75.4 90.6 59.7 106.4
1951 87.7 92.3 88,5 94.0 64.0 115.5
1952 89.6 91.8 83.7 93.8 68.2 121,6
1953 90.3 90.8 83.8 96.4 72.6 113.8
1954 90.8 91.0 85.3 95.0 75.3 114.8
1955 90.4 91.2 86,5 94.9 78.7 108.4
1956 91.8 93.8 92.8 97.8 83.5 106.2
1957 95.0 97.2 96.9 103.1 87.7 104,9
1958 86.4 99.5 99.2 99.2 92.0 105.1
1959 98.4 99.3 98.6 99.2 95.7 104,3
1960 100.0 100.0 100.0 100.0 100.0 100,0
1961 101.0 100.0 99.2 101.1 102.9 100,9
1962 102.1 100.3 100.4 100.6 106.1 102.1
1963 103.4 100.0 99.2 100.2 109.0 104.7
1964 104.7 100.4 98.4 97.5 112.4 103.7
1965 106.5 102.1 100.3 99.4 115.1 104.5
1966 109.6 105.4 103.0 101.8 119.5 105.6
1967 112.7 106.7 104.7 104.1 125.2 105.7
1968 117.5 109.7 107,2 102.9 132.8 101.6
1969 123.8 113.8 111.3 105.0 140.3 103.8
1970 131.1 117.7 116.6 110.5 149.8 109.7
1971 136.8 121.3 122.1 119.9 160.2 112,2
1972 141.3 125.1 127.6 123.4 170.2 113.8
1973 150.1 136.5 135.3 139.8 181.1 183.9
1974 166.5 157.4 159.4 216.8 197.2 201.2
1975 181.7 174.4 179.5 255.0 216.6 194.3
1976 192.2 181.8 189,9 276.4 235.2 202.2
1977 2Ö4.6 192.7 202.2 314,5 254.6 213.9
1978 220.3 207.7 222.5 335.6 275.0 212.4
1979 245.1 230.6 246.4 424.7 297.2 235.3
1980 278.2 263.4 275.8 596.7 325,2 259.5
1981 307.0 290.7 296.6 722.6 353.6 289,8
1982 325.6 299.6 306,7 721.3 374.5 266.5
1983 336.3 304.3 300.1 691.7 387.8 287.4
Sources: {69, 78, 79, 80).
61

Appendix table 2—Volume of turkey certified under Federal inspection, by product form, by months for selected years, 1960-83
Item January February March April May June July August September October November December Annual
P
«I
Million pounds
Cutup RTC weight: I960 NA NA NA 1965 5.6 3,6 5.2 1970 10.8 10.4 9.9 1975 21:6 17.2 16.5 1980 56,9 47.9 47.9 1981 59.7 47.9 54.6 1982 53.8 56.7 62.1 1983 63.1 61.4 66.2
Further processed as whole body:
I960 3.1 2.7 3.7 1965 7.0 6.3 7,4 1970 15.3 12.8 11.6 1975 18.8 16.6 18.3 1980 29.1 30.7 33.9 1981 29.8 23.6 32.2 1982 31.2 31.9 39.5 1983 24.5 24.4 46,7
Further processed other than whole:
I960 2.6 2.4 3.1 1965 9.8 8,8 10.2 1970 21.2 17.6 15.9 1975 27.0 23.8 26.4 1980 66.3 66.5 66.8 1981 72,0 69.0 79.9 1982 66.1 63.9 89.6 1983 78.8 81.7 94.2
NA 3.9 9.8
21.1 48.0 50.1 48.3 64.1
3.0 7.5
10.8 20.1 31.3 37.5 39.8 40.8
2.5 10.5 14.9 29.0 67.1 75.7 67.6 87.3
NA 4.0 9.8
21.7 53.4 57.1 53.4 67.7
3.4 6.9
10.4 18.6 45.5 45.9 53.0 52.4
2.9 9.5
14.3 26.7 79.8 77.8 75.0 89.2
NA 5.2
14.2 25.4 59.5 58.7 64.7 62.7
3.7 8,0
14,9 28.3 55.9 72.0 62.9 73.6
3.1 11.1 20.5 40.8 84.8 83.8 85.1
100.2
NA 5.4
20.0 27.1 52.0 56.1 49.9 58.7
3.5 9.1
19.8 40,6 70.0 86.8 80.5 83.8
3.0 12.6 27.3 58.5 85.9 83.2 74.7 91.0
NA 10.8 20.9 29.8 53.9 60.3 65,2 74.8
4.6 8.8
20.5 44.0 72.6 92.0
104,3 88.8
3.9 12.3 28.3 63.4 88.8 92.7 95.5
110.7
NA 14.0 23.1 33.0 51.6 59.7 67,2 73.4
5.3 9.7
22.3 45.8 83.6 88.6
102.6 84.7
4.5 13.4 30,9 66.0 99.1 91.4 98.8
109.8
NA 15.5 24.9 39,3 66.2 67.0 75,7 74.6
7.1 11.5 25.5 52.9
102.4 86.6 89.6 91.6
6.2 16.0 35.2 76.2 96.8 94.1
104.7 112.9
NA 13.8 19.6 31.2 58.9 64.2 72.8 74.9
7.3 11.6 20.9 40.5 67.9 70.8 72.9 63.5
6.3 16.1 28.8 58.4 76.8 87.4 93.3
105.0
NA NA 10.2 97.2 17.5 190.7 28.9 312.8 58.6 655.8 65.9 7P1.3 64.2 734.0 66.0 809.2
6.3 54.0 11.0 105.0 16.7 201.0 27.5 372.0 48.0 671.1 39.6 705.5 39.4 747.4 33.6 708.7
RTC= Ready to cook. NA=Not available.
6.3 47 16.7 147 23.0 278 39.7 536 74.0 9528 77.4 984.6 89.7 1,033.9 82.5 1,144.4
Source: {76).

Appendix table 3—Product usage and forms as percentage of turkey certified RTC at slaughter by months, selected years, 1960-83^
Item January February March April May June July August September October November December
Percent
Annual
Further processed: 1960 11.8 17.1 23.1 15.4 10.7 6.7 5.8 3.6
1965 31.4 64.2 70.3 67.3 35.2 20.3 13.2 7.5
1970 52.3 79.3 71.9 54.0 31.8 18.7 15.9 13.3
1975 41.6 50.5 48.5 42.2 32.6 29.5 30.3 31.2
1980 47.0 60.8 52.2 46.9 44.7 41.0 35.7 39.1
1981 50.7 57,7 58.6 50.7 43.6 37.1 33.2 35.4
1982 50.0 51.8 57.8 45.9 45.6 39.4 32.7 36.0
1983 54.7 60.3 51.5 52.4 48.6 43.3 40.5 40.7
Cutup: 1960 NA NA NA NA NA NA NA NA
1965 17.9 26.3 35.9 25.0 14.8 9.5 5.6 9.9
1970 26.7 46.8 44.8 35.5 21.8 13.0 11.6 9.9
1975 33.3 36.5 30.3 30.7 26.5 18.4 . 14.0 14.7
1980 40.3 43.8 37,5 33.6 29.9 28.8 22.0 23.7
1981 42.0 40.0 40.0 33.6 32.0 26.0 22.4 23.0
1982 40.7 46.0 40.1 32.8 32.5 29.9 21.9 24.6
1983 43.8 45.3 36.2 38.5 36.9 27.1 26.1 27.5
Chilled, RTC: 1960 9.5 21.1 17.9 23.5 15.9 15.2 15.6 12.8
1965 23.4 16.8 23.4 26.9 28.9 25.2 20.8 16.9
1970 25.2 25.7 26.7 26.8 24.9 17.4 17.0 15.6
1975 27.7 28.2 30.5 23.9 20.9 21.1 15.8 15.4
1980 34.3 31.6 30.4 29.2 26.1 24.7 22.7 22.5
1981 28.1 28.9 28.8 27.3 23.8 21.3 19.6 22.1
1982 30.9 33.6 36.0 33.9 29.8 28.9 27.1 27.8
1983 38.9 38.7 37.2 33.6 29.8 27.7 26.8 29.8
Frozen. RTC: 1960 90.5 87.9 82.1 77.2 84.1 84.8 84.4 87.2
1965 76.6 82.5 76.6 73.1 70.7 74.8 79.2 83.2
1970 74.8 74.3 73.3 72.8 75.1 82.7 83.0 84.4
1975 72.3 71.8 69.7 76.1 79.2 78.9 84.2 84.6
1980 65.8 68.5 69.7 70.8 73.9 75.4 77.3 77.5
1981 71,9 77.8 75.9 75.9 76.2 78.6 80.4 77,9
1982 69.1 68.6 64.0 66.1 70.2 71,1 72.5 72,4
1983 61.1 61.3 62.8 66.4 70,2 72.3 73.2 70.2
3.0 6.0
12.6 28.8 40.6 33.5 36.9 41.6
NA 9.4 9.4
14.4 21.1 21,9 25.1 27.8
13.7 15.9 15.1 16.7 22.3 22.7 27.8 27.8
86.3 84.1 84.9 83.3 77.7 77.3 79.2 72.2
3.2 6.1
12.7 29.6 34.7 32.4 37.9 40.1
NA 5.9 9.0
15.3 23.9 23.1 27.4 26.5
12.4 16.9 16.0 18.8 24.6 26.1 28.8 29.5
87.6 83.1 84.0 81.2 75.4 73.0 71.1 70.5
3.5 5.9
11.8 26.5 31.2 31,4 32.2 36.4
NA 5.0 8.0
14.2 23.9 23,1 25.1 25.9
20.5 24.3 24.9 27.3 33.8 35.2 37.4 38.9
79,5 75.6 66.8 72.7 66.2 64.8 62.6 61.1
5.0 5.0 10,6 11.1 15.4 17.7 25.2 31.2 38.8 39.2 37.9 39.2 46.5 42.0 43.4 44.7
NA NA 6.7 7.3
11.7 12.2 18.3 18.2 30.7 28.1 32.3 28,0 33.3 29.9 34.9 31.6
18.4 15.6 30.9 21,1 30.0 19.8 30.1 21.4 31.8 27.1 36.4 26,4 39.8 31.5 44.0 32,9
81.6 84,4 69.1 78.9 69.3 78.9 69.8 78.6 68.2 72.9 63.6 73.6 60.2 68.5 56.0 67.1
RTC = Ready to cook. NA = Not available. ^Further processed and cutup are not additive.
Source: (75).
H

4^ Appendix table 4—Ü.S. Department of Agriculture contracts to purchase tu rkey, by month, 1960-83*
Year January February March April May June July
Million pounds
August September October November December Total
Ready-to-cook weight: 1960 1961 1962 1963 1964
0 0
0 0
0 0
0 0
0 0
0 0
0 0
0 7.8
15.5 40.2
3.4 11.9
0 .1
0 0
18.9 60.1
0 0 0 0 0 0 0 0 10.3 23.8 8.8 0 42.9 0 0 0 0 0 0 0 1.5 30.9 11.2 0 0 43.6 0 0 0 0 0 0 0 12.8 31.4 16,6 0 0 60.8
1965 1966 1967 1968 1969
0 0 0 0 0 0 0 0 13.3 15.2 1.4 0 29.7 0 0 0 0 0 0 0 8.0 4.9 0 0 0 12.9 0 0 0 0 0 0 11.8 17.2 26.5 19.4 0 0 74.8 0 0 0 0 0 0 0 30.9 13.7 0 0 0 44.6 0 0 0 0 0 0 0 5.9 12.1 2.6 0 0 20.6
1970 1971 1972 1973 1974
0 0 0 0 0
0 0 0 0 0
0 0 0 1.5 0
0 0 0 5.0 0
0 0 0 0 0
0 0 0 0 0
0 8.2 1.5 0 9.3
10.9 6.8
14.8 2,4 3.1
13.7 10.4 14.0 10.1 15.8
8.4 12.7 11.6 11.3 9.5
2.1 7,1 8.5 5.3 3.7
0 0 1.3 0 9.8
35.0 45.2 51.6 35.6 51.4
1975 1976 1977 1978 1979
2.2 0 0 0 0 0 0 2.1 6.9 10.4 0 0 21.6 ¡i- a
3.9 6.2
4.6 7.2
0 0
0 0
0 0
0 0
0 5.8
6.6 16.6
13.9 14.3
14.4 3.9
0 10.3
0 9.0
34.9 73.4
CO 9.6 6.8 8.0 0 0 0 0 7.7 14.5 14.0 9.4 9.8 80.0 s <
13.3 3.7 2.8 0 0 0 6.6 9.5 15.3 15.3 10.9 18.8 96.2
3 i
1980 1981
16.3 7.2
10.4 0
1.5 0
0 0
0 0
0 0
3.9 3.2
7.7 10.2
8.2 14.3
23.0 15.1
13.2 4.2
15.4 0
99.6 54.2 •^
TJ
1982 1983
12.9 7.8 1.4 0 0 0 5.1 12.3 18.0 10.0 5.0 2.5 75.0 M s; 1-3
1.7 11.2 10.4 0 0 0 9.2 10.4 10.1 5.5 0 0 58.5 M
1,000 dozen cans
§ Canned boned turkey: ^11 M
S
00
1968 1969 1970 1971 1972
0 81.6
0
0 0 0
0 0 0
0 0 0
0 0 0
0 0 0
0 193.8 20.4
0 533.8 23.4
0 734.4
0
3.4 523.6 78.2
299.2 0
306.0
533.8 0
44.2
918.0 2,067.2
472.8 1
o
85.0 0
40.8 0
23.8 0
0 0
0 0
0 0
149.6 397.8
207.4 108.8
0 190.4
0 153.0
0 129.2
0 74.8
486.2 1,054.0
o o
1
g
1973 1974 1975 1976 1977-83
104.7 95,2
0 0 0
89.9 0 0 0 0
0 0 0 0 0
18.7 0 0 0 0
22.4 0 0 0 0
37.4 0 0 0 0
34.0 0 0 0 0
139.4 0 0 0 0
119.0 0 0 1.7 0
142.8 0 0
.5 0
10.2 0 0
.7 0
153.0 0 0 0 0
871.4 95.2
0 3.0 0
PS m
O
Source: {67).