the u.s. food - usda ers - home
TRANSCRIPT

United StatesDepartmentof Agriculture
EconomicResearchService
EconomicResearchReportNumber 42
May 2007 Steve W. Martinez
The U.S. Food Marketing System:Recent Developments,1997-2006

Photo credits: Storefronts by ERS/USDA staff; grocery interior courtesy of Wal-Mart, Inc.
Martinez, Steve W.
The U.S. food marketing system : recent developments, 1997-2006. (Economic research report (United States. Dept. of Agriculture. Economic Research Service) ; no. 42)
1. Food industry and trade—United States.
I. United States. Dept. of Agriculture. Economic Research Service.
II. Title.
HD9005
Use of commercial and trade names does not imply approval or constituteendorsement by USDA.
ww
w.er
s.usda.gov
You can find additional information about ERS publications, databases, and other products at our website.
Visit Our Website To Learn More!
National Agricultural LibraryCataloging Record:
Suggested citation:Martinez, Steve W. The U.S. Food Marketing System: Recent Developments, 1997-2006, ERR-42. U.S. Dept. of Agriculture, Econ. Res. Serv. May 2007.
The U.S. Department of Agriculture (USDA) prohibits discrimination in all its programs and activities on the basis of race, color, national origin, age, disability, and, where applicable, sex, marital status, familial status, parental status, religion, sexual orientation, genetic information, political beliefs, reprisal, or because all or a part of an individual's income is derived from any public assistance program. (Not all prohibited bases apply to all programs.) Persons with disabilities who require alternative means for communication of program information (Braille, large print, audiotape, etc.) should contact USDA's TARGET Center at (202) 720-2600 (voice and TDD).
To file a complaint of discrimination write to USDA, Director, Office of Civil Rights, 1400 Independence Avenue, S.W., Washington, D.C. 20250-9410 or call (800) 795-3272 (voice) or (202) 720-6382 (TDD). USDA is an equal opportunity provider and employer.

United StatesDepartmentof Agriculture
www.ers.usda.gov
A Report from the Economic Research Service
Economic
Research
Report
Number 42 The U.S. Food Marketing System: Recent Developments, 1997-2006
Steve W. Martinez
May 2007
Abstract
Major recent developments in the U.S. food system include the increasing presence ofnontraditional grocery retailers, such as supercenters and drugstores, and competitiveresponses by traditional grocers, such as supermarket chains. These developments havecontributed to sharp increases in concentration in the grocery retail sector, changingconventional relationships among retailers, wholesalers, and manufacturers. In such acompetitive domestic food market, food companies are attempting to differentiate them-selves from the competition by reporting voluntary activities that demonstrate socialresponsibility and by more-tailored advertising campaigns and product offerings.
Keywords: Food marketing system, food manufacturing, food distributors, concentra-tion, corporate social responsibility, competitive strategies
Acknowledgments
Appreciation is extended to Ron Larson, Kyle Stiegert, Gary McBryde, Jim MacDonald,Warren Preston, and Leland Southard for manuscript review, Elise Golan for sugges-tions on organization, Courtney Knauth for editorial assistance, and Anne Pearl forlayout and cover design.

Contents
Summary . . . . . . . . . . . . . . . . . . . . . . . . . . . . . . . . . . . . . . . . . . . . . . . . . .iii
Introduction . . . . . . . . . . . . . . . . . . . . . . . . . . . . . . . . . . . . . . . . . . . . . . . . .1
Competition from Nonfood Stores and Responses by Food Retailers . . . . . . . . . . . . . . . . . . . . . . . . . . . . . . . . . . . . . . . . . . .3Strategies Companies Use for Positioning Themselves . . . . . . . . . . . . . .3Strategic Positioning by Nontraditional Food Outlets . . . . . . . . . . . . . . .4Foodservice Gains . . . . . . . . . . . . . . . . . . . . . . . . . . . . . . . . . . . . . . . . . . .8Strategic Responses by Traditional Grocery Outlets . . . . . . . . . . . . . . .10Global Competitive Strategies . . . . . . . . . . . . . . . . . . . . . . . . . . . . . . . .14
Increases in Food Retail Concentration Resonate Throughout the Food Industry . . . . . . . . . . . . . . . . . . . . . . .18Structural Changes in Food Distribution . . . . . . . . . . . . . . . . . . . . . . . .18Structural Changes in Food and Beverage Processing . . . . . . . . . . . . .21Recent Mergers, Acquisitions, and
Divestitures in the Food System . . . . . . . . . . . . . . . . . . . . . . . . . . . . .27
Food Companies Expand Corporate Responsibility Reporting and Customized Marketing . . . . . . . . . . . . . . . . . . . . . . . . .30
The Corporate Social Responsibility Movement . . . . . . . . . . . . . . . . .30New Product Introductions . . . . . . . . . . . . . . . . . . . . . . . . . . . . . . . . . .33Advertising . . . . . . . . . . . . . . . . . . . . . . . . . . . . . . . . . . . . . . . . . . . . . . .35
References . . . . . . . . . . . . . . . . . . . . . . . . . . . . . . . . . . . . . . . . . . . . . . . . .39
Appendix A: Top 10 Companies at Each Stage of the FoodMarketing System and Changes in Concentration in Food and Beverage Manufacturing Industries and Grocery Wholesaling . . . . . . . . . . . . . . . . . . . . . . . . . . . . . . . . . . . . . . .46
Appendix B: Major Changes in Food Industry CensusClassifications in 1997 and 2002 . . . . . . . . . . . . . . . . . . . . . . . . . . . . . .50
iiThe U.S. Food Marketing System Recent Developments, 1997-2006 / ERR-42
Economic Research Service/USDA
Summary
A main development in the U.S. food marketing system is the influx ofstores that have not traditionally sold food but that increasingly offer fooditems. With the growing trend for eating out, traditional food retailers alsoface competition from the foodservice industry.
What Is the Issue?
The products and services provided by the food marketing system (whichincludes manufacturers, wholesalers, and retailers) account for over 80percent of consumer expenditures on food. Developments in this systemhave important implications for the cost, quality, and variety of food prod-ucts. Hence, agribusiness operators, policymakers, and consumers alike areinterested in how competition within the industry affects industry perform-ance. Heightened competition has contributed to consolidation and sharpincreases in grocery retail concentration, changing conventional relation-ships within the food marketing chain. Competition has also generally putshort-term downward pressure on food prices. This report examines thesestructural changes and selected performance dimensions of the U.S. foodsystem over the past 10 years.
What Did the Study Find?
The study shows that nontraditional food retailers increased their share offood sales for at-home use from 17.1 percent in 1994 to 31.6 percent in2005. These companies were able to position themselves within the foodindustry by creating new shopping formats that appealed to consumers andby lowering costs. The study also found that foodservice facilities (restau-rants, for example) continued to increase their share of all food sales, from46.1 percent in 1994 to 48.5 percent in 2005, by offering new productsand services.
In response to competition from nontraditional food retailers and the food-service segment, conventional grocery retailers are employing their owncost-cutting and differentiation strategies. Cost-cutting tactics includesupply chain initiatives such as data-sharing activities. For instance,through UCCnet, an Internet platform, food retailers and suppliers canexchange information that facilitates product delivery and reduces out-of-stock items and excess inventory. Another cost-saving strategy is to restruc-ture operations to focus on the most profitable stores and geographic areas.
A main cost-cutting strategy of traditional grocery retailers over the past 10years has been to consolidate through mergers and takeovers. This develop-ment may, in turn, lead food processors to consolidate to meet the large-scale needs of grocery retail chains. Some large wholesalers—concernedabout the ability of the smaller, independent food retailers that they supplyto compete with retail chains and stay in business—are vertically integratinginto retailing by acquiring stores of their own.
iiiThe U.S. Food Marketing System: Recent Developments, 1997-2006 / ERR-42
Economic Research Service/USDA
Primary differentiation strategies include expanded project offerings—newfood product introductions continue to set records, outpacing nonfood pack-aged goods—along with updated store designs and technologies to improveservice. Food companies are also adopting some less conventional methods,focusing on new ways of image enhancement—for instance, publicizingtheir initiatives to advance social agendas beyond those required by law. Thecompanies are also using new advertising approaches. A shift from TVadvertising to other venues, such as magazines, the Internet, and videogames, reflects a move from mass to individualized marketing. This trend isalso reflected in new product labels designed to appeal to consumer self-image (for instance, with “upscale” terms such as premium and gourmet).
How Was the Study Conducted?
This study examined recent major developments in the U.S. food marketingsystem, using data from the U.S. Census Bureau, Bureau of Labor Statistics,Bureau of Economic Analysis, Food Institute, Marketing IntelligenceService’s Productscan Online,data base, company annual reports and Websites, and various trade publications.
ivThe U.S. Food Marketing System Recent Developments, 1997-2006 / ERR-42
Economic Research Service/USDA

Introduction
The U.S. food marketing system comprises five broad stages of economicactivity: production, processing and manufacturing, wholesaling, retailing,and consumption (see box, “Economic Stages of the U.S. Food MarketingSystem”). The food manufacturing and distribution stages serve as thebridge between production and consumption, coordinating the delivery offarm products in the form, place, and time preferred by consumers. Verticalcoordination between stages of the system is achieved through a variety ofmethods, including spot markets, contracts, alliances, and vertical integra-tion, varying by specific food industry. In 2001, the food and fibermarketing system contributed 12.3 percent to the U.S. gross domesticproduct and employed 23.7 million people, or 16.7 percent of total U.S.employment. According to calculations based on U.S. Census Bureau data,the food marketing system also accounted for 9 percent of the value of allmerchandise exported by the United States in 2005. The activities and serv-ices provided by food manufacturers and distributors accounted for about 81percent of consumer food expenditures in 2002, while the farm valuecomponent accounted for the remainder.
The objective of this report is to assess recent developments in the U.S. foodmarketing system. The report covers many of the same topics as an earlierEconomic Research Service (ERS) report, The U.S. Food Marketing System,2002 (Harris et al., 2002). However, unlike the previous report, the currentreport is organized by topic area rather than by stages of the marketingsystem. In addition, it focuses more on key developments, using the mostrecent data available.
The report is organized into three sections: (1) Changes in food distributionchannels, including the growing diversity of retail outlets selling food andthe globalization of food markets—the influx of retailers not traditionallyinvolved in selling food is one of the most important developments in theU.S. food system; (2) changes in market structure related to consolidation,mergers and acquisitions, and methods of vertical coordination; and (3)differentiation strategies in relation to the corporate social responsibilitymovement, new product introductions, and advertising that has the capacityto influence food consumption behavior and nutrition.
1The U.S. Food Marketing System: Recent Developments, 1997-2006 / ERR-42
Economic Research Service/USDA

2The U.S. Food Marketing System: Recent Developments, 1997-2006 / ERR-42
Economic Research Service/USDA
The U.S. food marketing system is generally composed of five broad stages. Over 25,000 food and
beverage processors purchase output from more than 2.1 million farms. Domestic and foreign food
processors handle over 90 percent of the value of U.S. farm production, with the remainder
reaching consumers in unprocessed form (Connor and Schiek, 1997).
Processed and packaged products are then sold to over 32,559 wholesalers, 112,662 food and
beverage retailers, and 377,717 foodservice companies for distribution to over 111 million house-
holds. Grocery wholesalers deliver products to retail food stores, such as supermarkets, whereas
specialized foodservice wholesalers distribute to foodservice outlets. The foodservice and grocery
retail segments compete for the consumer’s food dollar, but the wholesalers that supply them do
not compete directly with each other. Foodservice distributors serve more locations with smaller
order sizes, as the number of items typically required by a foodservice establishment is consider-
ably smaller than the number offered through grocery stores.
Sources: U.S. Census Bureau (2004, 2005); National Agricultural Statistics Service, USDA (2006).
Processing andmanufacturing
Production
Wholesaling
Foodservice Grocery
Consumption
Foodservice Retail foodstores
Retailing
Economic Stages of the U.S. Food Marketing System

Competition from Nonfood Storesand Responses by Food Retailers
As food companies strive to grow or maintain market share in a slowlygrowing domestic food economy, distribution channels for marketing foodproducts in the United States are changing. Over the past 10 years, thefood industry has seen an influx of companies not traditionally involved infood sales, led by Wal-Mart supercenters, along with continued growth inthe foodservice segment. In addition, global food marketing channelscontinue to expand through processed food exports and imports and foreigndirect investment.
We begin by discussing various strategies of companies as they seek acompetitive advantage within the food industry.
Strategies Companies Use for Positioning Themselves
In order to compete, a firm must establish a sustainable competitive advan-tage. In his theoretical framework for explaining competitive advantage,Porter (1990) posits two basic types of advantage: lower costs and differen-tiation. Lower costs result from a firm’s ability to produce and market prod-ucts more efficiently than the competition. Differentiation refers to theability of firms to provide consumers with unique and superior products andservice at a premium price. While it is possible for companies to followboth strategies, this is complicated by the additional costs of providingunique quality and services. Nonetheless, companies must be attentive toboth types of advantage, while emphasizing one. For example, a companythat produces high-quality products but neglects costs can see its pricepremium offset by higher expenses.
Another important choice is the company’s competitive scope, or breadth ofthe company’s target within an industry. A company must choose the prod-ucts to produce, channels to market the products, types of customers andgeographic areas to target, and the industries in which to compete.Segments within an industry have particular needs that require differentstrategies and capabilities. For example, regular milk and more expensiveorganic milk are sold to consumers with different tastes and preferences.Companies in the dairy industry may choose different competitive scopes,with some producing both organic and regular milk, for example, whileothers specialize in organic milk.
Companies may gain competitive advantage by expanding globally or bycompeting in related industries. For example, Pepsi-Cola and Coca-Colarelied on their extensive bottling and distribution channels and brand-building capabilities to gain important advantages in bottled water produc-tion (see “Structural Changes in Food and Beverage Processing,” p. 21). A global strategy is one in which a firm sells its product in many nations,using an integrated worldwide approach.
3The U.S. Food Marketing System: Recent Developments, 1997-2006 / ERR-42
Economic Research Service/USDA

To gain competitive advantage, a company must choose the type of advan-tage it wishes to achieve and the scope for obtaining it. For conceptual-izing, combinations of advantage type and scope form four basic strategies(fig. 1). For example, companies that choose a broad scope may follow acost-leader strategy by offering a variety of products at lower prices andless-than-superior quality. Alternatively, companies may follow a differenti-ation strategy by offering a variety of products at premium prices. Firmschoosing a narrow target may follow either a cost-focus or focused-differen-tiation strategy. Under a cost-focus strategy, companies offer basic productsat lower prices than those following a cost-leadership strategy. Finally, thefocused-differentiation strategy involves specialized products that commandpremium prices.
Although industry structure limits the range of approaches, different strate-gies can successfully coexist in many industries. There may also be varia-tions in how to focus or differentiate within the same strategy. Changes inindustry structure, or developments that establish new bases for competing,offer firms opportunities to substantially shift their competitive position.
A “stuck in the middle” strategy refers to companies that follow all posi-tioning strategies simultaneously. These companies are destined to failbecause the incompatible nature of the different strategies will result inbelow-average performance (Porter, 1990).
Strategic Positioning by Nontraditional Food Outlets
By segmenting consumers based on their preferences, nontraditional foodretail outlets, including supercenters, warehouse clubs, drugstores, anddollar stores, position themselves through pricing strategy and productvariety. Supercenters follow a cost-leadership strategy, offering a widevariety of food and nonfood merchandise at lower prices than traditionalstores such as supermarket chains. By competing in both the food and drugindustries, drugstores follow a differentiation strategy. Dollar stores havealso emerged as formidable competitors to traditional food retailers byappealing to bargain and low-income shoppers with a cost-focus strategy.
4The U.S. Food Marketing System: Recent Developments, 1997-2006 / ERR-42
Economic Research Service/USDA
Figure 1
Types of competitive strategies
Low cost Differentiation
Broad Cost-leadership Differentiation
Scope of advantage
Narrow Cost-focus Focused- differentiation
Source: Porter, 1990.
Type of advantage
Growth of Nontraditional Grocery Retailers
Nontraditional outlets increased their share of U.S. food-at-home expendi-tures (i.e., food purchased to be prepared and consumed at home) from 17.1percent in 1994 to 31.6 percent in 2005 (table 1). Most of this growth wasdue to supercenters and warehouse club stores, which together took in 17.1percent of food-at-home expenditures in 2005, up from 3.9 percent in 1994.Warehouse clubs compete by catering to small businesses and middle- toupper-income consumers with a limited variety of products and a grocerysection dedicated to large-size packages and bulk sales (Brady andCavanaugh, 2005; Hamstra, 2005).
Other types of nontraditional food outlets have recently emerged ascompetitors in the food industry (table 2). Drugstores, such as Walgreensand CVS, accounted for 4.8 percent of all food and nonfood grocery sales in2005, although drug sales remain their core business (Veiders, 2005). Foodsales by drugstores reached $7.25 billion in 2004, up 36 percent from 5years earlier (Alexander, 2004). Each store offers a small assortment offood and beverages, accounting for approximately 5 percent of sales, butwith the large number of stores operated by each company (e.g., CVS with6,100 stores, Walgreens with 5,251, and Rite Aid with 3,323), this adds upto significant food sales. Further, food and beverage sales earn highermargins for the company than drug sales. Customers are attracted by thepharmacy and the convenience of food product offerings.
Dollar stores are driving sales growth by opening new stores and addinggrocery items.1 Products are often priced at $1 or $2, with grocery prod-ucts accounting for between 20 and 80 percent of total sales (Brady andCavanaugh, 2005).
5The U.S. Food Marketing System: Recent Developments, 1997-2006 / ERR-42
Economic Research Service/USDA
Table 1Share of food-at-home expenditures by type of outlet1
1994 2001 2005
Traditional grocery retailers Percent
Supermarkets 59.2 62.7 58.2Convenience 3.1 2.9 2.9Other grocery 16.6 3.5 3.6Specialty food stores 2.8 2.3 2.7
Total traditional 81.7 71.4 67.4
Nontraditional grocery retailersSupercenters (e.g., Wal-Mart, Super Target, Super Kmart,
Meijer, Fred Meyer) and warehouse clubs (e.g., Costco,Sam’s, BJ’s) 3.9 11.7 17.1
Mass merchandisers (e.g., traditional Wal-Mart, Target, and Kmart stores) 1.8 2.2 1.8
Other stores (e.g., Walgreens, Dollar General) 9.0 9.6 8.7Home-delivered and mail order 2.4 4.1 4.0
Total nontraditional 17.1 27.6 31.6
1Excludes sales by farmers, processors, wholesalers, and others, which have accounted for approximately 1 percentof food-at-home expenditures.
Source: ERS, http://www.ers.usda.gov/Briefing/CPIFoodAndExpenditures/Data/table16.htm, accessed July 13, 2006.
1In 2005, Dollar General, the lead-ing dollar store, ranked 18th in U.S.grocery sales (“SN’s Top 75,”Supermarket News, http://www.super-marketnews.com/, accessed October13, 2005).

Competition for food sales is widening to include some of the Nation’slargest retail companies. In 2003, Sears, Roebuck and Co. introduced itsSears Grand stores, which sell clothing, appliances, tools, and a limitedarray of grocery products such as dairy, lunch meats, and frozen food.Sears Grand, with large freestanding buildings close to residential areas,emphasizes convenience over selection. A “dollar section” of packagedfoods was also added. Sears purchased stores from Kmart, which hadrecently emerged from bankruptcy, and converted some to Sears Grandstores. In 2005, Sears merged with Kmart to become the Nation’s third-largest retailer, referred to as Sears Holdings Corporation. Home Depot, thesecond-largest U.S. retailer behind Wal-Mart, is testing convenience storeswith gas stations adjacent to Home Depot stores.
Wal-Mart’s Influence
Supercenters have led the growth in grocery sales by nontraditional outlets(table 2). Primarily through its supercenters, Wal-Mart has emerged as aprominent player in the food industry (Stewart and Martinez, 2002). Within12 years after opening its first supercenter in 1988, Wal-Mart became theNation’s leading grocery retailer (Appendix A, Appendix table 1). Byoffering food at lower prices with very low profit, Wal-Mart can attractcustomers who also buy the store’s more profitable general merchandise.
Wal-Mart’s tremendous growth is largely due to efficiencies in managing itssupply chain to lower costs (Irwin and Clark, 2006). Through an innovativelogistics system and collaboration and data-sharing with suppliers, Wal-Martstreamlines the flow of products to consumers and tailors products to indi-vidual stores, based on customer preferences in the community where thatstore operates (Zwiebach, October 2005). Wal-Mart requires manufacturersto manage their own store inventories and makes available its private, invita-tion-only “Retail Link” system to exchange information with its suppliersover the Internet in a secure environment (Sparks and Wagner, 2003).About 30,000 of its suppliers are using Retail Link to track how well theirproducts are selling by region or store, to review inventory levels, and toassist Wal-Mart in optimizing its inventory holdings. Many of Wal-Mart’s
6The U.S. Food Marketing System: Recent Developments, 1997-2006 / ERR-42
Economic Research Service/USDA
Table 2Share of grocery sales by nontraditional outlets1
1994 2001 2005 20102
PercentWarehouse club 4.8 8.5 7.1 7.3Supercenters 2 9.9 13.6 20.7Dollar stores (e.g., Family Dollar, Dollar General, na na 1.7 2.1
Dollar Tree, Fred’s, 99 Cents Only)Drugstores (e.g., Walgreens, CVS, Rite Aid) na na 4.8 4.5Mass merchandisers na na 5.7 5.4Internet (e.g., FreshDirect) na .12 na naMilitary commissaries na na .5 .5Other (mini-club, deep discount drugstore) 2 .60 na naTotal nontraditional 8.9 19.14 33.4 40.5
na=Not available.1Sales include food and nonfood grocery items, health and beauty items, greeting cards and magazines, alcohol, and tobacco.2Forecast.
Sources: Caffarini and Cavanaugh, 2006; Griffith, 2002; Rogers, 2000.

products are not stored at the warehouse, but are moved from supplier truckto store-delivery truck through a process called cross-docking.
Wal-Mart has been the prime mover of radio frequency identification (RFID)technology in the United States (Martinez and Stewart, 2003). Items aretagged with an electronic product code (EPC), the digital enhancement of thebar code, containing detailed product data, manufacturing date, expirationand tracking data, and other information. Instead of manually scanning a barcode, an EPC reader automatically transfers the data to a database usingradio waves. In 2004, the company introduced the technology in some of itsstores and distribution centers, focusing on tagged pallets and cases of higherpriced, fast-moving merchandise (Covert, 2005; Sullivan, 2005). By 2007,the company intends to expand its RFID rollout from 500 to 1,000 stores andto double the number of participating suppliers to 600.
The RFID technology has the potential to move products from producer toconsumer more quickly, which is especially important for perishable prod-ucts like fresh fruits and vegetables (Parks, 2005). The technology canreduce instances of “out-of-stock.” A study of the effect of RFID on storesby researchers at the University of Arkansas found a 32-percent annualreduction in out-of-stock merchandise for products selling at a rate of 0.1 to2 units a day (Collins, 2006). The research data also showed a 62-percentreduction for goods selling at a rate of 6 to 15 units a day. For slower andfaster moving items, no improvement in product availability was found.
The share of grocery and tobacco sales at Wal-Mart’s discount stores andsupercenters has been growing steadily, approaching that of the company’sown Sam’s Clubs, the second-largest wholesale club behind Costco (fig. 2).In addition, while many food retailers achieve growth through acquisitions,Wal-Mart expands by opening new stores (table 3). Wal-Mart continues toopen new, smaller supermarket stores, referred to as “NeighborhoodMarkets,” close to its supercenters to serve as a fill-in stop betweencustomers’ trips to the supercenters. The company is also expanding itsofferings of private label food items.2
7The U.S. Food Marketing System: Recent Developments, 1997-2006 / ERR-42
Economic Research Service/USDA
Figure 2 Share of sales by Wal-Mart's supercenter and discount storesand Sam's Club for grocery and tobacco products
0
5
10
15
20
25
30
35
1999 2000 2001 2002 2003 2004 2005
Percent
Supercenters and discount stores Sam's Clubs
Source: Annual company reports submitted to the Securities and Exchange Commission.
2A store’s private label can be thestore’s own name or a brand name cre-ated exclusively by the retailer for thatstore.

Given its immense and growing size, Wal-Mart is changing the traditionalrelationship between manufacturer and retailer (Greenhouse, 2004). Thecompany is the biggest customer of many of the Nation’s leading foodprocessors, and its share is slowly growing (table 4). Regarded as a toughnegotiator, Wal-Mart is said to be capable of extracting concessions fromsuppliers (Connor and Schiek, 1997). As manufacturers’ revenue becomesmore dependent on Wal-Mart, they are willing to invest in technology toincrease efficiency and to satisfy Wal-Mart’s requests.3 To do business withWal-Mart, manufacturers must comply with company mandates, such astagging cases with RFID tags and delivering case-ready meats that areprepackaged and priced (Martinez and Stewart, 2003).4 As manufacturerscommit their resources to serving Wal-Mart, they may provide less supportfor retailers that are unable to provide the same sales growth (Zwiebach,April 2004).5
Foodservice Gains
Grocery retailers are also facing formidable competition from the foodser-vice channel as consumers slowly increase their share of food expendituresfrom foodservice outlets. In 2005, the food-away-from-home marketcaptured 48.5 percent of total food expenditures, compared with 46.1percent in 1994 (U.S. Department of Agriculture, Economic ResearchService). To continue building market share, foodservice companies arefollowing a differentiation strategy, offering new products and services thatcater to the lifestyles of today’s health-conscious, time-pressed, anddemanding consumers.
In addition to their traditional food offerings, foodservice companies haveresponded to consumers’ diet and health preferences with a host of newproducts. Facilitated by advances in fresh-cut produce technology,McDonald’s introduced sliced apples as a substitute for fries in HappyMeals in 2004. The Nation’s largest fast food company procured more than
8The U.S. Food Marketing System: Recent Developments, 1997-2006 / ERR-42
Economic Research Service/USDA
Table 3Wal-Mart growth
Unit 1995 2005
Number of distribution centers1 Number 30 99Total number of U.S. stores: Number 672 2,349
Supercenters2 Number 239 1,713Sam’s Clubs3 Number 433 551Neighborhood markets4 Number 0 85
New store openings in the United States5 Number 97 435International stores Number 276 1,587Total sales Bil. dol. 82.5 285Percent of U.S. GDP Percent 1.32 2.43Total U.S. employees Million 0.7 1.3Percent of U.S. employment Percent 0.59 0.99
1In 2005, approximately 19 percent of Wal-Mart’s merchandise was shipped directly to stores from suppliers, up from 16 percent in 1995. The remainder was shipped from Wal-Mart’s distribution centers, of which 34 are grocery distribution centers.2Nearly 2,200 Supercenters are expected to be operating by the end of 2006 (Zwiebach, October 2005).3These are Wal-Mart’s warehouse club stores.4These are Wal-Mart’s supermarket stores.5Includes discount stores relocated or expanded to supercenters.
Sources: Annual reports filed with the Securities and Exchange Commission.
3A study by Global Insight (2005)found evidence that, over the 1985-2004 period, Wal-Mart’s investmentsin innovative distribution and inven-tory increased the national economy’sproductivity by helping Wal-Mart sup-pliers operate more efficiently.
4All of Wal-Mart’s supercentersand Neighborhood Markets now sellcase-ready meats, which Wal-Marttouts as enabling streamlined distribu-tion from manufacturer to customerand providing greater quality controland tracking capabilities. Other fac-tors that have contributed to thegrowth of case-ready meats in theUnited States include the move towardbranded meat products, retailer prefer-ence for more uniform meat cuts, andimproved meat-case merchandisingwithout the labor cost of meat cutters.
5In addition to its influence oversuppliers, other contentious issuesraised by Wal-Mart’s increasing pres-ence in the economy include lowemployee wages and shifting of healthcare benefits onto States as the com-pany pursues a cost-leadership strategy.

54 million pounds of fresh-cut apples, becoming the largest consumer ofapples in the foodservice industry (Enis, 2005). More recently, the companyintroduced an apple, grape, and walnut salad. Mineral coatings and modi-fied-atmosphere packaging are extending the shelf-life of fresh-cut items,allowing a wider variety of offerings. New chicken products were recentlylaunched by several of the leading fast food chains, among themMcDonald’s Premium Chicken Sandwiches and Chicken Selects, BurgerKing’s Chicken TenderCrisp sandwich, Wendy’s Chicken Temptations sand-wiches, and KFC’s new roasted chicken menu. In response to consumerdemand for low-carbohydrate foods, full-service chains, such as Applebee’sand TGI Friday’s, have developed low-carb menus, while fast food chains,such as Hardee’s and McDonald’s, offer burgers without the bun.
Companies continue to offer consumers a variety of large-portion items thatare high in fat and calories. For example, in 2004, Hardee’s introduced a1,420-calorie “Monster Thickburger.” A nutritional calculator on Hardee’sWeb site allows consumers to analyze the nutritional content of all its menuitems, including calories, calories from fat, and sodium.
McDonald’s is providing consumers with on-the-spot nutritional andproduct-sourcing information. In February 2006, the company introducedproduct packaging that displays the nutritional content of most of its prod-ucts. Five icons provide information about the calorie, protein, fat, carbohy-drate, and sodium content compared with daily nutrient recommendations(Muirhead, 2005). By the end of 2006, the company expected to have thenutrition labeling in 20,000 of its 30,000 restaurants. It also added to itsWeb site an “open door” tour with information on how its products areproduced, beginning at the farm.
Some limited-service chains are following a focused-differentiation strategyby catering to consumer preferences for “casual indulgence” with more“upscale” items. Some of the fastest growing chains are those offeringspecialty products and gourmet ingredients. From 2004 to 2005, Starbucks,
9The U.S. Food Marketing System: Recent Developments, 1997-2006 / ERR-42
Economic Research Service/USDA
Table 4Percent of manufacturer revenue from sales to Wal-Mart, 2002-2004
Manufacturer 2002 2003 2004
Percent
Procter and Gamble 17 18 17Dean Foods1 10.6 13.4 14.6General Mills 12 13 14Kellogg Company 12 13 14Kraft Foods 12.2 12 14Campbell Soup 12 12 13Tyson Foods2 Less than 10 Less than 10 12Pepsico3 Less than 10 10 11
1Dairy division. In 2002, the second-leading customer accounted for 7.5 percent of sales.2According to Tyson’s 2004 annual report filed with the SEC, “Any extended discontinuance ofsales to this customer could, if not replaced, have a material impact on the Company’s opera-tions; however, the Company does not anticipate any such occurrences due to the demand forits products.” 3In all of North America, Wal-Mart accounted for 14 percent of Pepsico’s sales revenue in2004, up from 12 percent in 2003.
Sources: Annual reports filed with the Securities and Exchange Commission.

the world’s leading retailer of specialty coffee, had the third-largestpercentage increase in sales among limited-service chains and the second-largest increase in units (Technomic Information Services, Inc., 2006). Thecompany now ranks as the sixth-largest foodservice chain (Appendix A,Appendix table 1). Panera Bread and Quiznos Sub also ranked among the10 fastest growing chains in terms of both sales and units. Panera Breadsells all-natural specialty breads, while Quiznos Sub is an upscale chainserving sandwiches made from proprietary bread and special ingredients,such as Tuscan basil mayonnaise and spring-mix lettuce. Mainstreamchains are following suit with their own unique product offerings. Througha partnership with a coffee processor, McDonald’s is offering “Newman’sOwn Organics Blend” of Fair Trade Certified, organic specialty coffees(American Institute of Food Distribution, Inc., October 31, 2005). Chick-Fil-A recently introduced its “Café Blends Coffee” premium line.
Full-service restaurants are differentiating themselves by expanding theirtakeout business (Technomic, Inc., 2005). In 2004, their takeout sales wereestimated to be nearly 10 percent of total sales. Over the previous 3 years,takeout sales in full-service restaurants grew about 8 percent per year,roughly twice the rate of their total sales. Many of these restaurants haveadded reserved parking spaces and special entrances for takeout orders, andsome, such as Outback Steakhouse, are adding drive-up service.
Strategic Responses by TraditionalGrocery Outlets
Traditional food retailers that follow a “stuck-in-the-middle” strategy willlikely continue to lose market share to nontraditional retail outlets and food-service companies. Traditional outlets that have higher costs than Wal-Mart,fail to differentiate from the competition, and fail to compete in a narrowermarket segment lack any competitive advantage.
Much has been written in the popular press about conventional supermarketscaught between the “big box” stores (e.g., supercenters) and specialty storesthat target a specific consumer segment, such as the “fresh format” stores(Brady and Cavanaugh, 2005). These are stores exceeding 20,000 squarefeet that follow a focused-differentiation strategy by emphasizing perish-ables, with ethnic, natural, and organic assortments that differ from those oftraditional retailers. From 1999 to 2004, sales at the two largest publiclytraded fresh format stores that specialize in organic and natural foods,Whole Foods and Wild Oats, grew by 159 and 45 percent (annual reportsfiled with the Securities and Exchange Commission), compared with a 13-percent increase for the entire U.S. grocery store industry (U.S. CensusBureau). Over the same period, sales by United Natural Foods, a leadingwholesale distributor of organic and natural foods, increased by 95 percent,compared with a 16-percent increase for all merchant food wholesalers,excluding manufacturers’ sales branches and offices.
Conventional outlets are responding with a number of competitive strategiesto retain market share. Establishing a competitive position requires anunderstanding of what factors influence costs, which attributes are preferred
10The U.S. Food Marketing System: Recent Developments, 1997-2006 / ERR-42
Economic Research Service/USDA

by consumers, and how cost factors and attributes vary by customer segment(Besanko et al., 1996). Strategies for standing out from the competition,lowering costs, and streamlining product delivery are discussed next.
Differentiation Strategies
Traditional grocery stores are differentiating from the competition withexpanded product offerings, new store layouts, and innovative in-store tech-nologies. Mainstream supermarkets accounted for the largest share of theorganic foods market in 2004, with 37 percent of total sales, followed byindependent natural food stores (28 percent) and natural food supermarketchains (19 percent).6 Some supermarkets are opening their own organic andnatural food stores and producing their own corporate-brand organics. Forexample, Supervalu recently opened its first Sunflower Market banner storethat features organic, minimally processed products with no preservatives.Some of these products are sold as private label under the “Nature’s Best”brand. Other companies offering their own corporate-brand organic prod-ucts include Kroger (Naturally Preferred), Giant Food (Nature’s Promise),and Shaw’s (Wild Harvest).
Private labels are one way that retailers have diminished the market powerof manufacturers, differentiating themselves with store-brand products ofbetter value than national brands (Kinsey, 2001). As Wal-Mart and super-centers increase their private label products, traditional retailers are intro-ducing or expanding their own private label programs. Sales of private labelproducts in supermarkets rose by 0.9 percent in 2004, compared withnational brand growth of 0.6 percent. Private label share of supermarketsales is growing slowly, increasing from 14.0 percent in 1994 to 16.1percent in 2004, but this represents about $10 billion of additional sales.Examples include H.E. Butt’s Central Market Organic and All-Natural lineof food products, Albertsons’ Essencia premium line, Publix’s line ofbranded Hispanic products, and Food Lion’s Butcher’s Brand PremiumBeef. Premium brands project an image of higher quality based on superiorfood ingredients or packaging (Connor and Schiek, 1997). Food Lion’spremium beef, for example, is sourced from Midwestern producers thatcomply with the company’s standards for beef quality, including marblingand aging.
Major food chains and manufacturers are forming innovative partnerships asretailers attempt to differentiate themselves with their own line of products(Forbes.com, 2004). Private label processors include large national brandmanufacturers that use their expertise and excess plant capacity to supplystore brands; small manufacturers who specialize in particular product linesand produce store brands almost exclusively, often owned by corporationsthat also produce national brands; and regional brand manufacturers thatproduce private label products for specific markets (Private Label Manufac-tures Association, 2006). Large manufacturers, such as McCormick, DelMonte, and Birds Eye, usually do not cannibalize their national brands withstore-brand versions of their own products (ConsumerReports.org, 2005).For example, Del Monte produces soup for retailers, but not fruit products.When companies do make national and store brands of the same product,the products may have different attributes. For example, the quality of farm
11The U.S. Food Marketing System: Recent Developments, 1997-2006 / ERR-42
Economic Research Service/USDA
6The organic market increased by19 percent in 2004 and is expected todouble by 2007 (Tarnowski, 2005;Lempert, 2005).

output in the ingredients may vary by growing conditions and region. Inaddition, retailers that emphasize costs may prefer a lower priced versionand lower quality ingredients.
To benefit from the growing popularity of dollar stores, some grocers areadding more dollar merchandise (i.e., goods priced at one dollar). Morethan 27 percent of new grocery stores had aisles designated for dollarmerchandise in 2004, compared with 6 percent in 2002 (Adamy, 2005). In2002, Save-A-Lot, a small discount grocery store chain owned by Super-valu, bought a dollar store chain to get more dollar merchandise into itsstores, including videos, jewelry, and household goods. Winn-Dixie is alsoadding more dollar merchandise to improve sales.
As supermarkets compete with the foodservice sector, their annual sales ofprepared food are growing at about 4-4.5 percent, compared with 2-2.5percent for their other food items (Rogers, 2005). For example, they areoffering a variety of precooked, precut, or premarinated meats for warmingor cooking.
In addition to supercenters and wholesale clubs, mainstream supermarketssuch as Kroger and Albertsons are adding fuel pumps to entice motorists topurchase food and other products when they buy gas, and some stores offerdiscounts on fuel for purchasing promotional items. According to a 2006Food Marketing Institute survey, a third of member grocers had fuel pumps,compared with 6 percent in 2003 (Showalter, 2006).
New store designs offer consumers an upscale shopping experience. Stop &Shop Supermarkets rents space to Dunkin’ Donuts and Boston Market andis redesigning its health and beauty section to emphasize “health and relax-ation.” Safeway is opening “lifestyle” stores, sophisticated shopping venueswith high-quality produce, soft lighting, and classes on topics such as flowerarranging (Adamy, 2005). Safeway-owned Dominick’s Lifestyle storesfeature an expanded section of organic foods and an upscale bakery, deli,wine, and floral section. The stores also have a Starbucks coffee shop withsofas and plush chairs. Kroger Marketplace, twice as big as a regularKroger store, features a Starbucks and Donato’s Pizza stand. Building onKroger’s acquisition of Fred Meyer, a large supercenter selling groceriesand merchandise, the new stores offer furniture, linen, electronics, toys, andhousehold appliances in addition to grocery items. A&P, the 11th-rankedsupermarket chain, is expanding its upscale Fresh Market concept, featuringnatural and organic produce and restaurant-style hot and chilled foods.
Innovative, timesaving technologies offer another means for traditionalgrocers to differentiate from the competition. One of the fastest growingtechnological applications in new grocery stores is self-checkout lanes. In2005, nearly 56 percent of food retailers used self-checkout systems, up from38 percent in 2004 (American Institute of Food Distribution, Inc., October 3,2005). The technology has become so ingrained that it is no longer consid-ered a major initiative by food retailers (Garry, January 31, 2005).
Biometric technology allows customers to pay at checkout by scanning afinger to match the fingerprint on record, which releases payment from abank account or credit card. According to the 2004 Supermarket News
12The U.S. Food Marketing System: Recent Developments, 1997-2006 / ERR-42
Economic Research Service/USDA

annual survey of corporate and information technology, executives at 68food retail and wholesale companies, representing 36,000 supermarkets, 25percent of the companies planned to use or test biometric technology in2005, up from 15 percent in 2004 (Garry, January 31, 2005). Stop and ShopSupermarkets, owned by Ahold, is introducing the “Shopping Buddy” intosome of its stores, an updated version of the VideOcarts introduced a dozenyears ago (Garry, November 2005). The computerized self-scanning deviceattaches to the front of a shopping cart and provides a wide range of infor-mation, some of it targeted to the individual loyalty-card shopper. Shopperscan scan and bag items in the aisle, locate products, check prices, order deliitems without standing in line, and maintain a running total of items in theircart. The screen also informs shoppers of favorite items on sale as theyapproach those items in the aisle. By swiping their loyalty card at checkout,the cashier can total their purchases without scanning individual items.
Cost-Lowering Strategies
In addition to consolidation through mergers and acquisitions (see section“Structural Changes in Food Distribution”), traditional food retailers arereducing costs through supply chain initiatives and restructuring of opera-tions. They are attempting to improve inventory control and consumerresponse by emulating Wal-Mart’s supply chain management practices(McKinsey Global Institute, 2001).7 A 1992 industry-wide initiative, knownas Efficient Consumer Response (ECR), was an attempt by retail grocers toadopt Business-to-Business (B2B) e-commerce practices similar to Wal-Mart’s to streamline inventory ordering and reduce costs. However, theinitiative waned due to computer systems that were either nonexistent orincompatible with those of suppliers (Mohtadi and Kinsey, 2005). Theeffort was further hampered by retailers’ reluctance to share sales informa-tion with manufacturers, adoption of technologies that proved unprofitable,and perceived unequal sharing of ECR benefits across the supply chain.
ECR, however, paved the way for many efficient management practices andled to a new B2B Internet platform, referred to as UCCnet (Kinsey, 2000).UCCnet is a division of GS1 US, formerly the Uniform Code Council (UCC),which is the organization best known for developing bar codes containing aUniversal Product Code (UPC). To increase consistency in product andinvoice data used by food distributors and suppliers, UCCnet was the primarydriver of data synchronization between retailers and manufacturers in theUnited States (Seifert, 2002; Garry, March 2005). In 2004, 29 percent ofretailers and wholesalers surveyed by Supermarket News were involved indata synchronization with trading partners, 29 percent were planning to partic-ipate in 2005, and 33 percent were considering it (Garry, January 31, 2005).By allowing retailers and suppliers to electronically exchange information andservices in a secure environment, UCCnet facilitates the delivery of productsto reduce out-of-stocks and excess store inventory.
A global data system was needed, and in 2004 the Global Data Synchro-nization Network (GDSN) was introduced. The GDSN allows certified datapools, such as UCCnet, Transora, and WorldWide Retail Exchange(WWRE), to exchange standard product data registered in the GS1 GlobalRegistry.8 The GS1 Global Registry is a centralized directory that validates
13The U.S. Food Marketing System: Recent Developments, 1997-2006 / ERR-42
Economic Research Service/USDA
7Some traditional retail outlets,such as Giant Eagle and Raley’s, arelimiting promotional discounts in favorof everyday low prices, similar to theapproach of Wal-Mart and other dis-count retailers (Adamy, July 2005).
8In 2005, mergers between UCCnetand Transora, and between WorldWideRetail Exchange and GNX (referred toas Agentrics LLC), were announced(Garry, June 2005).

and stores basic item and participant information. It also serves as a“pointer” to the appropriate data pool for obtaining information on aspecific item or party. From January to June of 2005, the number of tradingpartners participating increased by 16 percent, and registered items (GlobalTrade Item Number) increased by 62 percent.9 In June 2005, there were 10certified data pools, with 252 manufacturers and 17 retailers synchronizingdata (Garry, June 20, 2005). By May 2006, 5,000 trading partners, mostlymanufacturers, were using the GDSN (Garry, June 5, 2006).
Food retailers have also moved forward with global scanning standards. Tofacilitate global trade, the UCC selected January 2005, referred to as “Sunrise2005,” as the deadline for North American retailers to become capable ofscanning the 13-digit European Article Number (EAN) bar code and storingthe code in their database. A 2005 Food Marketing Institute survey of infor-mation technology executives at 28 food retail and wholesale companies,representing 6,724 U.S. supermarkets, found that all retailers were capable ofscanning the EAN (Food Marketing Institute, 2005). All of the companieshad dedicated funds for complying with the scanning standards.
The 2004 Supermarket News annual survey of food retail and wholesalecompanies found that 21 percent of companies planned to launch or testRFID in 2005, compared with only 3 percent in 2004 (Garry, January 31,2005). In 2004, Albertsons asked its top 100 suppliers to begin placingRFID tags on cases and pallets. Publix recently initiated an RFID pilotprogram through a partnership with the University of Florida (Parks, 2005).
Some of the larger chains are restructuring their operations to improve effi-ciencies and services, cut costs, and maintain competitive prices. Strate-gies include closing older stores and focusing on core market areas andassets. In 2005, Winn-Dixie, the Nation’s 10th-largest grocery retailer,filed for bankruptcy protection to reposition itself for future growth. Thecompany announced a plan to sell a third of its stores so that it can focuson its strongest markets. The company is also closing some of its distribu-tion centers and selling its dairy, pizza, and beverage/condiment manufac-turing plants.
In 2005, A&P announced plans for a major strategic restructuring, includinginitiatives to improve labor productivity and reduce operating and adminis-trative costs. Shortly afterwards, the company moved away from self-distri-bution by entering into an agreement to transfer its U.S. distributionoperations to C&S Wholesale Grocers. This is expected to reduce costs byharnessing C&S’s logistics expertise and purchasing efficiency.
Global Competitive Strategies
In a slowly growing domestic market, firms may gain competitive advantageor offset domestic disadvantages by following a global strategy (Porter,1990). Advances in information, communication, and transportation tech-nology, along with various trade agreements, have increased access to inter-national markets. In addition, globalization of processing and distributionare associated with rising incomes and international travel, which influencethe diversity of consumer food preferences. A global strategy involves an
9One factor driving participation in theGDSN is the emergence of RFID tech-nology and electronic product code,which requires synchronized data(Garry, January 17, 2005).
14The U.S. Food Marketing System: Recent Developments, 1997-2006 / ERR-42
Economic Research Service/USDA

integrated approach to selling products abroad, including information onwhere best to locate and how to coordinate activities across nations to lowercosts or differentiate from global competitors.
Processed Food Trade
International trade has been the fastest growing marketing channel for foodprocessors since the 1970s (Connor and Schiek, 1997). In 1991, U.S.exports of high-value products surpassed bulk agricultural product exports(e.g., wheat, corn, and tobacco) (fig. 3). High-value products are processedproducts not yet ready for final consumption (e.g., wheat flour, soybeanmeal and oil, and animal hides) and those requiring little or no additionalprocessing (e.g., meats, fresh fruits and vegetables, and nuts). Leadingproducts include red meats, fresh and processed fruits and vegetables,poultry meat, and nuts, which together accounted for 39 percent of all high-value exports in 2005. With an export-based global strategy, food proces-sors can pursue growth opportunities in rapidly expanding economies.
U.S. imports of food products provide more food choices for U.S.consumers, but also bring added competition to the U.S. market. From1995 to 2005, imports of high-value food products grew at an averageannual rate of 8.4 percent, compared with a 2.9-percent increase in high-value exports. The United States has operated at a processed-food tradedeficit every year since 2002, widening from $3.3 billion in 2002 to nearly$12 billion in 2005. About 26 percent of all U.S. agricultural imports areclassified as noncompetitive, including tropical products that cannot be
15The U.S. Food Marketing System: Recent Developments, 1997-2006 / ERR-42
Economic Research Service/USDA
Figure 3
U.S. exports and imports, 1975-2005
0
10
20
30
40
50
60
Source: Foreign Agricultural Service, USDA.
Billion $
1975 78 81 84 87 90 93 96 99 2002 05
Bulk exportsHigh-value exports
High-value imports
Bulk imports

produced profitably in the United States (e.g., coffee and bananas)(FAS/USDA). Imports also include products that compete directly withdomestic production, such as wine and beer, red meats, snack foods, andprocessed fruits and vegetables.
Foreign Direct Investment
Most global strategies integrate trade and foreign direct investment (Porter,1990). In 2001, food manufacturing companies accounted for over 75percent, or $155 billion, of foreign sales at U.S. food facilities abroad (fig.4). Sales by U.S.-owned manufacturing plants located in foreign countrieshave outpaced the value of processed food exports in recent years (fig. 5).Advantages of foreign direct investment compared with international tradeinclude lower transportation costs, greater insight into local consumers andpolicies, and circumvention of tariffs and domestic market restrictions (e.g.,environmental, antitrust) (Connor and Schiek, 1997).
Retailers accounted for most sales by foreign food companies located in theUnited States, followed closely by manufacturers (fig. 6). U.S. sales by retailforeign affiliates, including Ahold (Netherlands) and Delhaize Group(Belgium), were 10 times greater than sales by U.S. retailers located abroad.In addition to U.S. imports of processed food, foreign manufacturers locatedin the United States are a source of competition for U.S. food manufacturers.
16The U.S. Food Marketing System: Recent Developments, 1997-2006 / ERR-42
Economic Research Service/USDA
Figure 4
Sales by U.S. food firms located in foreign countries ($ billion), 2001
$155.00
$19.25
$7.63
$18.82
Manufacturing Wholesaling Retailing Food service
Total = $201 billion
Source: Bureau of Economic Analysis. U.S. Department of Commerce.

17The U.S. Food Marketing System: Recent Developments, 1997-2006 / ERR-42
Economic Research Service/USDA
U.S. processed food exports and imports, and sales by foreign
0
20
40
60
80
100
120
140
160
180
1994 1995 1996 1997 1998 1999 2000 2001 2002
$ Billion
Note: Includes food manufacturing affiliates only.
Source: Bureau of Economic Analysis, U.S. Depar tment of Commmerce.
Sales by U.S.-owned foreign affiliates
Sales by foreign-owned U.S. affiliates
and U.S. affiliates, 1994-2002
Figure 5
Exports
Imports
Figure 6
Sales by foreign food firms located in the United States ($ billion), 2001
Manufacturing Wholesaling Retail Food service
Source: Bureau of Economic Analysis. U.S. Department of Commerce.
$80.34
$14.59
$86.49
$15.30
Total = $197 billion

Increases in Food RetailConcentration ResonateThroughout the Food Industry
One widely used measure of market structure is market concentration, orthe degree to which economic activity is concentrated in the hands of a fewlarge firms. Many factors contribute to increasing concentration in the U.S.food system. For instance, a firm that follows a lower cost strategy mayexploit economies of scale and scope to lower average costs relative torivals producing smaller quantities of the same product. Economies ofscale allow larger volumes to be produced at lower per unit productioncosts. Economies of scope exist if a firm achieves cost savings as itincreases the variety of goods it produces. Economies of scale and scopenot only affect the size of firms, but also influence business strategies, suchas decisions on merging with another firm or on whether market expansioncan be achieved through long-term cost reductions (Besanko et al., 1996).For example, Wal-Mart’s demand for low-cost products may influencemerger decisions by manufacturers needing to achieve economies of scaleand increased efficiency in order to supply Wal-Mart (Hopkins, 2003).
Other factors that can increase concentration include the exit of firms unableto compete with larger, more efficient firms, the cost of new technology,consolidation to offset market power as concentration increases at otherstages of the food marketing system, and slow overall demand growth.When demand is falling, new facilities may be discouraged. Consolidationmay also be encouraged by the prospect of other economies resulting fromsize, such as increased access to capital for research and advertising,volume-based price reductions on production inputs, or price premiums forlarge volumes of specific outputs.
Structural Changes in Food Distribution
Concentration ratios published by the U.S. Census Bureau provide usefulsummary indicators of the importance of large firms in the food system, asclassified under the six-digit North American Industrial ClassificationSystem (NAICS) (Appendix B). In grocery retailing, consolidation led tosharp increases in national concentration from 1997 to 2002 (fig. 7).10, 11
Mergers and acquisitions can have profound effects on the number and sizeof companies. In 1998 and 1999, some notable supermarket mergers andacquisitions occurred (Bjornson and Sykuta, 2002; Harris et al., 2002).They included:
• The $12.75-billion acquisition by Kroger of sixth-ranked Fred Meyer, which had previously acquired Smith’s Food & Drug Centers and Quality Food Centers.
• Fourth-ranked Albertsons’ $12-billion acquisition ofsecond-ranked American Stores Company.
• Ahold’s purchase of Giant Food, Inc.
18The U.S. Food Marketing System: Recent Developments, 1997-2006 / ERR-42
Economic Research Service/USDA
10ERS also calculates grocery con-centration ratios on an annual basis,including grocery product sales by Wal-Mart supercenters (Harris et al., 2002).(http://www.ers.usda.gov/Briefing/FoodMarketStructures/foodretailing.htm).These ratios are slightly higher thanthose for grocery stores published bythe U.S. Census Bureau, and trends overtime are similar.
11While national retail concentrationratios provide useful information on thesize of the largest food retailers overtime, retailers serve consumers insmaller local markets, where concentra-tion can be much higher. ERS analysisof the 100 largest U.S. cities in the1990s found that increases in local mar-ket concentration have been slight(Kaufman, 2000). In the 100 largestU.S. cities, average market share of thefour largest food retailers rose from 69percent in 1992 to 72 percent in 1998.

Safeway made several smaller acquisitions, including Vons Companies in1997, Dominick’s Supermarkets in 1998, Randall’s Food Markets and Carr-Gottstein Foods Company in 1999, and Genuardi’s Family Markets in 2001(Bjornson and Sykuta, 2002; Sharkey and Stiegert, 2006).
A number of forces heightened competition among larger traditional groceryretailers and led to consolidation through mergers to capture economies ofscale (Kaufman, 2000). These forces included increased consumer spendingfor prepared foods and meals away from home and the growth of food salesby nontraditional competitors such as Wal-Mart. Bureau of Labor Statisticsdata indicate that labor productivity (i.e., output per worker) in grocerystores increased from 1997 to 2002, following general declines after themid-1980s (table 5). This may reflect consolidation in the retail grocerysector, more rapid adoption of new technology, and other cost-cutting movesin response to strong price competition from the nontraditional outlets. Asdiscussed earlier, nontraditional outlets are important because of the effi-ciencies they can trigger in other retailers, in addition to the options theyprovide consumers. Leibtag (2006) found that the entry and expansion oflower priced nontraditional stores led to further food expenditure savingsbecause of the increased competition that they generate.
Past studies have examined the effect of mergers and acquisitions on oper-ating efficiencies and food prices. Bjornson and Sykuta (2002) analyzed theeffect of acquisitions by Albertsons, Kroger, and Safeway on their financialperformance over the 1993-1999 period. They found improved cost controland buying efficiencies for Kroger and Safeway, while Albertsons showedsigns of inefficiencies from its acquisitions. They also found that grossmargin increased for each firm, but they were unable to distinguish howmuch of the increase was due to greater market power or to improved oper-ating efficiencies and product offerings. A more recent study by Sharkey
19The U.S. Food Marketing System: Recent Developments, 1997-2006 / ERR-42
Economic Research Service/USDA
Figure 7Percent of U.S. grocery wholesale, retail, and foodservice sales by the 4, 8, 20, and 50 largest food companies
20
40
60
80
100
4 8 20 50 4 8 20 50 4 8 20 50
Source: Census Bureau, U.S. Department of Commerce.
Percent
19922 1997 2002Grocerywholesalers1
Foodservice
Grocery stores
1General-line grocery merchant wholesalers, excluding specialty and limited-line merchant wholesalers and manufacturers’ sales branches and offices.
2Based on Standard Industrial Classification (SIC) system.
0

and Stiegert (2006) examined the effect of supercenters and retail consolida-tion on food prices in major metropolitan areas from 1993 to 2003. Theyfound that if supermarkets did experience efficiency gains from the mergers,cost savings were not passed on to consumers.
As table 5 shows, a decline in grocery stores from 1997 to 2002 was accom-panied by stagnant growth in real grocery store sales, relative to the foodser-vice sector. An expanding foodservice sector and continual growth in thenumber of foodservice companies and establishments have kept concentra-tion levels in check.12 Small foodservice establishments can stay competi-tive by differentiating themselves by their menu offerings and service(Connor and Schiek, 1997).
Rising concentration in the grocery retail segment is of concern to manufac-turers because it makes them dependent on fewer retailers for maintainingtheir market share. Growing retail concentration could indicate a shift inbargaining power from manufacturers to grocery retailers (Kaufman, 2000;Connor and Schiek, 1997). If food processors must sell their products to afew large distributors, the bargaining power of distributors may increase.
Manufacturers and large retailers offering a broad assortment of items find itadvantageous to negotiate directly, reducing the power and influence oftraditional wholesalers. Self-distribution is the preferred method of coordi-nation for large grocery chain stores. In 2001, 81.9 percent of chain stores
20The U.S. Food Marketing System: Recent Developments, 1997-2006 / ERR-42
Economic Research Service/USDA
Table 5Number of food establishments and companies, real sales, and worker output, 1992, 1997, and 2002
Grocery wholesalers1 Grocery stores Foodservice
Number of establishments: 19922 3,740 104,105 433,6081997 3,390 96,542 486,9062002 3,212 95,514 504,430
Number of companies:19922 3,133 72,274 331,4881997 2,802 68,006 365,5882002 2,812 67,757 377,717
Real sales (percent change):19922 to 1997 -10.1 -3.9 15.61997 to 2002 15.0 1.7 12.5
Output per worker (percent change per year3): Food All4 Food All5 Food All6
1992 3.5 3.4 -0.8 1.6 -0.2 na1997 -0.6 3.2 -1.5 3.2 -0.1 na2002 0.6 4.4 1.0 4.6 0.8 na
na=Not available. 1General-line merchant wholesalers, excluding specialty and limited-line merchant wholesalers and manufacturers’ sales branches and offices. 2Census year 1992 is based on the Standard Industrial Classification (SIC) system.3Average annual change since the previous Census year.4All wholesaling.5All retailing.6Not available for all accommodations and food services.
Sources: Compiled by ERS from data from Bureau of Labor Statistics and Census Bureau, U.S. Department of Commerce.
12As with food retailing, the rele-vant foodservice market is local, andlocal market concentration can bemuch higher. Foodservice facilitiesoperate in small-sized markets, such asthose in neighborhoods, airports, andmalls, and national trends have little todo with how prices are set. Whilethere are over 500,000 foodserviceoutlets, many operate under a central-ized decision process, which couldhave a role in price-setting behavior.

(with “chain” defined by the grocery industry as 11 or more stores under thesame ownership) were self-distributing (American Institute of Food Distri-bution, Inc., Food Institute Report, February 3, 2003).13, 14
Structural Changes in Foodand Beverage Processing
Concentration at the food manufacturing stage is of special concern tofarmers because manufacturers are the primary purchasers of agriculturalproducts. Concentration of ownership has been steadily increasing.According to the Census Bureau, the top 50 processors accounted for 53percent of food processing sales in 2002, up 15 percentage points, or 39percent, since 1972 (table 6).
Every manufacturing establishment, or plant, is owned by at least onecompany. Large companies usually own several operating establishmentsand often operate plants in several industries (Connor and Schiek, 1997).If ownership is consolidating, the number of companies will fall faster thanthe number of plants. When firm divestitures outweigh mergers, thenumber of companies could increase, even though the number of plants issteady or falling.
An increase in the number of manufacturing plants and companies from1997 to 2002 continues a trend dating back to 1987 (table 6). According toanalysis of plant entry patterns by Connor and Schiek, most new productionsince the mid-1980s stems from the entry of small, startup plants typically
21The U.S. Food Marketing System: Recent Developments, 1997-2006 / ERR-42
Economic Research Service/USDA
13Ron Marshall, chairman of fifth-ranked food wholesaler Nash Finch,predicted that the number of foodwholesalers will likely shrink by morethan two-thirds over the next 5 to 7years and will eventually shrink to adozen general-line wholesalers servinga national market or multiple regions(American Institute of FoodDistribution, Inc., Food InstituteReport, June 13, 2005).
14Mohtadi and Kinsey (2005) notethat two types of market structure ofthe food supply chain likely exist. Inone case, the increase in large self-dis-tributing grocery chains, along withother trends, suggest a shift towardretail bargaining power relative tomanufacturers. On the other hand, 31percent of supermarkets are smallindependent retailers with less than 10stores, over half of which own only 1store. In the latter case, market powerlikely remains with the manufacturer.
Table 6Number of food processing plants and companies, sales concentration, and productivity changes,1963-2002
Top 50 Output per Multifactorshare of worker productivity3
shipmentCensus year1 Plants2 Companies2 value Food All4 Food All4
Number Number Percent Percent per year5
1963 37,521 32,617 32 2.8 2.7 1.4 3.01967 32,517 26,549 35 3.2 2.9 0.8 1.51972 28,193 22,172 38 3.1 3.6 1.2 1.91977 26,656 20,616 40 3.2 3.0 -1.1 -0.31982 22,130 16,813 43 3.2 1.5 2.1 0.21987 20,624 15,692 47 2.0 3.5 -0.2 2.41992 20,798 16,075 50 1.1 2.7 -0.3 0.11997 21,805 17,221 51 0.9 3.8 0.0 1.92002 23,338 18,696 53 2.5 3.7 -1.0 1.7
1Based on Standard Industrial Classification (SIC) system prior to 1997.2Excludes retail bakeries, which were included under NAICS in 1997 and 2002.3For 2002, average change in multifactor productivity index is from 1997 to 2001, the last year available. 4All manufacturing. 5Average annual change since the previous Census year.
Sources: Compiled by ERS from Connor and Schiek (1997), Bureau of Labor Statistics, and Census Bureau, U.S. Department of Commerce.

owned by small new companies in rapidly growing niche markets. Smallplants accounted for most of the net increase in food manufacturing plantsin 2002, but their share of shipment value remained below 5 percent (table7). Many of the smallest plants are open for only a few weeks of the year,often operating with unpaid family labor.
In general, consolidation and investment in optimum-sized processing plantsare expected to lead to productivity increases, assuming that the acquiringfirms are more efficient operators.15 Annual average increases in foodprocessing productivity from 1997 to 2002, as measured by labor produc-tivity (output per worker), reached its highest level since the early 1980s.However, since the early 1980s, there has been a general reduction in thegrowth of labor productivity and multifactor productivity, which comparesoutput growth to changes in all input requirements. Connor and Schiek(1997) offer several possible explanations for this finding. First, the upwardtrend in new products (see section, “New Product Introductions,” p.33) mayrequire shorter production runs and more time for factory line changeover,and may also increase the emphasis on new products at the expense of newprocess development. Second, an increase in quality control and qualityassurance programs may also have led to additional costs and inputs. Third,to the extent that quality improvements lead to higher product prices, pricedeflators in productivity calculations will overstate purely inflationarychanges because quality improvements are not recognized, leading to anunderestimate of the change in real output and productivity.
Specific Food Processing Industries
Consolidation can vary widely across food and beverage manufacturingindustries, as defined by the NAICS industry classifications. However, theNAICS system is less than ideal for measuring concentration because someindustries are defined too narrowly, while other definitions are overly broad.For example, products from the beet sugar and cane sugar refining indus-tries are near-perfect substitutes, which suggests that combining these indus-tries for analysis would provide a more accurate assessment ofconcentration. On the other hand, the animal slaughtering industry providesan imperfect measure of concentration because output from cattle and hogslaughter plants is combined. Despite these weaknesses, Census industryclassifications are the only publicly available source of food processingsales concentration.16
22The U.S. Food Marketing System: Recent Developments, 1997-2006 / ERR-42
Economic Research Service/USDA
Table 7Size distribution of food processing plants, 1997 and 2002
1997 2002
Size (employees) Plants Value of Plants Value of shipments shipments
Number Percent Million $ Percent Number Percent Million $ Percent
1-19 17,576 66.8 17,143 4.1 19,179 68.7 19,973 4.420-99 5,509 21.0 81,237 19.2 5,478 19.6 83,665 18.2100 or more 3,217 12.2 323,988 76.7 3,258 11.73 55,149 77.4Total 26,302 100.0 422,368 100.0 27,915 100.0 458,787 100.0
Source: Compiled by ERS from data from U.S. Census Bureau, 2002 and 1997 Economic Census, Manufacturing, General Summary.
16Private market research compa-nies, such as A.C. Nielsen andInformation Resources, Inc., providemore narrowly defined product marketdefinitions (Conner and Schiek, 1997).For example, while NAICS has oneclassification for the breakfast cerealindustry, private companies distinguishbetween ready-to-eat and cookedbreakfast cereal.
15Ollinger et al. (2006) analyzedmergers and acquisitions over the1977-82 and 1982-87 periods in spe-cific manufacturing industries, includ-ing the meat and poultry slaughter andprocessing, dairy, flour, feed, andoilseeds industries. They found thatacquired plants were highly productiveand became even more productiveafter the merger. The 1997-2001period was an especially active timefor mergers and acquisitions by foodmanufacturers (see the section“Recent Mergers, Acquisitions, and
Divestitures in the Food Industry,” p.27).

In 2002, the latest Census year, the average national market 4-firm concen-tration ratio (i.e., CR4—the percent of shipment value accounted for by thefour largest firms) across 44 food and beverage manufacturing industrieswas 50.2 percent, up only slightly from 49.8 in 1997.17 Five industries hadrelatively low levels of national concentration (CR4 less than 30), whileeight had high levels (CR4 greater than 70) (table 8). The soybeanprocessing industry was the only highly concentrated industry in 2002, witha net increase in plants between 1997 and 2002 (Appendix A, Appendixtable 2). Soybean processing is particularly important to agriculture,providing a major feed ingredient, product exports, and food uses such ascooking oil (Ollinger et al., 2005). The increase in soybean processingplants in 2002, and the decline in plant size (output per plant) and workerproductivity, run counter to long-term trends from 1977 to 1997 (table 9).
23The U.S. Food Marketing System: Recent Developments, 1997-2006 / ERR-42
Economic Research Service/USDA
17The average CR4 excludes eightlocal markets and “all other miscella-neous food.” For industries servinglocalized markets, such as fluid milk,ice cream, ice, bakeries, animal feed,soft drinks, and snack foods, localconcentration is likely much higher.For the category “all other miscella-neous food,” the CR4 is meaningless.
Table 8National 4-firm concentration ratios1 (CR4) for food and beverage manufacturers, 2002
CR4<30 (Low)2 CR4>70 (High)3
Industry CR4 Industry CR4
Fresh and frozen seafood processing 20 Breweries 91Meat processed from carcasses 24 Malt manufacturing 91Perishable prepared food 24 Beet sugar 80Fruit and vegetable canning 24 Soybean processing 80Spice and extract manufacturing 29 Breakfast cereal 78
Other snack food4 75Distilleries 71Specialty canning 71
1CR4 = The percent of shipment value accounted for by the four largest firms.2Excludes animal feed and retail bakeries, which are local market industries, and “all other miscellaneous food.” CR4 is meaningless for themiscellaneous food product category.3In 2002, concentration was not provided for cane sugar refining and flavoring syrup and concentrate to avoid disclosing individual companydata. In 1997, CR4 for these industries was 99 and 81, respectively. 4Excludes roasted nuts and peanut butter.
Source: U.S. Census Bureau, U.S. Department of Commerce.
Table 9Number and size of plants, labor productivity, and concentration in soybean processing, flour milling, and fluid milk processing, 1972-2002
1972 1977 1982 1987 1992 1997 2002
Soybeans Number of plants 94 121 114 106 99 93 117Output per plant (million bushels) 7.6 7.8 9.8 11.1 12.9 17.2 13.8Labor productivity (1,000 bushels)1 78 101 126 168 172 235 221CR42 52 50 61 71 71 79.6 79.9
FlourNumber of plants 457 407 360 358 371 382 340Output per plant (1,000 cwt) 548.0 677.6 808.1 954.1 999.5 1,055.2 1,160.9Labor productivity (1,000 cwt)1 15.6 17.7 19.3 25.7 28.3 31.6 33.9CR42 32 33 40 44 56 48.4 53.6
Fluid milkNumber of plants 2,507 1,924 1,190 946 779 608 524Output per plant (million pounds) Na 27.9 43.5 57.0 70.6 90.1 103.5Labor productivity (1,000 pounds)1 Na 573 664 745 868 950 979CR42 17.0 17.0 16.0 21.0 22.0 21.3 42.61Annual output per employee.2Four-firm concentration ratio.
Sources: Ollinger et al. (2005) and ERS calculations based on U.S. Census data.

Most of the additional soybean processing plants were in the small-sizecategory (1-19 employees), which accounted for a slightly larger share ofshipment value, from 1.6 to 2.3 percent. According to plant entry and exitpatterns from 1972 to 1992, plant size of oilseed (including soybean, wet-corn milling, and cottonseed) processing entrants was about 50 percent ofthe industry mean size, and 60 percent of these plants exited within 5 years(Ollinger et al., 2005).
Over the 1997-2002 period, nearly two-thirds of food manufacturing indus-tries became more concentrated (Appendix A, Appendix table 2). Eighteenhad sizeable increases in concentration, each exceeding 10 percent (table10). Industries with processing operations that serve local markets, with theexception of retail bakeries, also had fewer firms. Firms serving localmarkets have historically exited at a faster rate than other food processors,which suggests that merger activity has been more intense in these indus-tries (Connor and Schiek, 1997).
24The U.S. Food Marketing System: Recent Developments, 1997-2006 / ERR-42
Economic Research Service/USDA
Table 10Change in concentration, sales (volume) growth, and number of plants and firms, selected industries,1997-20021
CR4 Entire Industry
Sales Change in Change inAmount of (volume) number of number of
Type of Industry 1997 2002 change growth2 plants firms
Percent Percent
11-15 percent increase in CR4:
Cookie and cracker 60 67 11 0 -7 -9Flour milling 48 54 11 -2 -11 -16Dry pasta 57 65 13 -13 -27 -27Poultry processing 41 46 14 16 14 21Frozen fruit, juice, and vegetable 34 39 15 -9 -8 -15
16-30 percent increase in CR4:
Commercial bakeries (L) 39 46 18 -6 -5 -6Distilleries 60 71 18 -4 37 52Meat processed from carcasses 20 24 19 5 3 3Bottled water 52 63 21 59 66 84
>30 percent increase in CR4:
Fats and oils, refining and blending 37 48 31 -6 -9 -16Malt 69 91 32 -31 -21 -16Dried and dehydrated food 30 42 40 62 17 18Retail bakeries (L) 3 4 48 22 5 3Ice cream and frozen dessert (L) 32 48 49 17 -9 -11Fresh and frozen seafood 14 20 50 15 -10 -9Ice (L) 24 43 76 24 -15 -17Seafood canning 26 46 76 48 -16 -18Fluid milk (L) 21 43 100 -2 -14 -22
CR4 = Four-firm concentration ratio.L = Local market industry.1Industries listed are those with a change in the 4-firm concentration ratio (CR4) based on value of shipments, exceeding 10 percent from 1997 to 2002.2Estimated from growth in the volume of shipments, deflated by producer price indexes, or taken directly from quantities obtainedfrom other sources.Sources: Compiled by ERS from U.S. Census Bureau data, Rodwan, 2003, ERS Wheat Situation and Outlook, ERS Poultry Yearbook,and NASS Agricultural Statistics for relevant years.

Falling demand (i.e., reduction in sales volume) was associated with thedisappearance of plants and firms in seven of the industries, including flourmilling and fluid milk (table 10). In flour milling, increases in averageplant size, worker productivity, and concentration were consistent withhistorical trends (table 9). Increases in concentration beginning in the early1970s reflect the growing presence of multiplant grain companies, such asCargill (Ollinger et al., 2005). However, declining per capita flourconsumption, which fell to 137 pounds in 2002 after peaking in 1997 at 147pounds, is a recent development. Declining consumption may reflect, inpart, the increasing numbers of health-conscious people following low-carbohydrate diets, along with technological advances that extended theshelf life of bread, with less flour required to meet the same level of demand(Vocke et al., 2005).
The fluid milk industry had the largest percentage increase in CR4 amongall of the food and beverage industries. The industry’s extraordinaryincrease in concentration has come amid dramatic structural changes in thedairy industry. In 2002, there were 33 percent fewer fluid milk processingplants than in 1992, processing 46 percent more milk per plant. SuizaFoods emerged as a prominent player in the 1990s by purchasing 20 fluidmilk firms, while Dean Foods acquired 14 fluid milk firms in 1997 and1998 (Ollinger et al., 2005). In 2001, a merger between Suiza Foods andDean Foods, the Nation’s number one and two dairy processors, resulted ina company accounting for 30 percent of the U.S. fluid milk market (USDA,2004). Rapid consolidation in milk production was also taking place. From1994 to 2004, the number of dairy farms decreased by 45 percent, but milkproduction per farm doubled (USDA/NASS).
Declining per capita consumption of fluid milk, which fell from 223 to 207pounds over the 1994-2004 period, is one factor influencing consolidation.Other factors include scale economies and meeting the large-scale needs ofan increasingly consolidated grocery retailing sector (USDA, 2004; Connorand Schiek, 1997).
Among the industries with increases in concentration exceeding 10 percent,bottled water was one of two with demand growth (i.e., sales volumegrowth) exceeding 50 percent. From 1997 to 2002, per capita consumptionincreased by 53 percent, from 14.1 to 21.5 gallons (Rodwan, 2003). U.S.consumers now drink more bottled water than any other beverage, with theexception of carbonated soft drinks (Beverage Marketing Corporation ofNew York, 2006). Since 1998, however, per capita consumption of carbon-ated soft drinks has fallen slightly, while bottled water consumptioncontinues to set new records.
An increase in the concentration of bottled water production can be tracedto a small number of companies following a cost-leader strategy. Diversifi-cation by firms into multiple product markets may affect the costs of entrywhen products are related through economies of scope in production, distri-bution, or marketing. Leveraged by their extensive bottling and distributionnetworks, Pepsi-Cola and Coca-Cola recently entered the bottled waterindustry and quickly ranked among the top four processors. The companiesalso relied on their own brand-building capabilities. Pepsi introduced Aqua-fina in the mid-1990s, and by 1999 the company had become the fourth-
25The U.S. Food Marketing System: Recent Developments, 1997-2006 / ERR-42
Economic Research Service/USDA

largest producer, with a 5.5-percent market share. In 1999, Coke introducedthe Dasani brand, supported by the largest advertising budget in the industry(Beverage Marketing Corporation of New York, 2000). By 2002, marketshares of Pepsi and Coke bottled water had reached 11 percent and 10percent, respectively. The other two leading companies, European-basedNestle and Groupe Danone, also continued to grow market share throughNorth American mergers and acquisitions and constructing plants.
Spotlight on the Pork and Beef Industries
Consolidation in beef and pork slaughter has been of special interest topolicy officials, given the historically high and growing rates of concentra-tion. The pork industry, in particular, has experienced rapid structuralchanges in recent years, epitomizing the industrialization of agriculture.
The U.S. Department of Agriculture provides information on market struc-ture that is more recent and that enables more precise meat slaughter classi-fications than U.S. Census Bureau data. Fewer and larger hog slaughterplants continue to account for an increasing share of annual slaughter (table11). The four largest hog slaughter firms have increased their share ofslaughter by 20 percentage points over the past 10 years, reaching 64percent in 2004. While this share remained stable from 1996 to 2002, itincreased by 9 percentage points in 2003, following Smithfield Foods’acquisition of Farmland Foods (see the next section, “Recent Mergers,Acquisitions, and Divestitures in the Food Industry”).
Increasing consolidation in hog slaughter is linked to dramatic structuralchanges in hog production. Since the 1980s, particularly since 1989, U.S.hog production has been shifting to highly specialized large-scale farms(Martinez et al., 1997). Hogs on farms with more than 1,000 head increasedfrom 37 percent of the swine population in 1987 to 56 percent in 1994, andto 89 percent in 2004. From 1994 to 2004, the percentage of hogs produced
26The U.S. Food Marketing System: Recent Developments, 1997-2006 / ERR-42
Economic Research Service/USDA
Table 11Decline in hog and cattle slaughter plants, percent of animals slaughtered in large plants, and slaughter concentration, 1994 and 2004
Percent slaughtered in Share of slaughter by the 4 Number of slaughter plants large plants1 largest firms2
1994 2004 Percent 1994 2004 1994 2004change
Hogs 830 664 -20.0 62 78 44.5 64.1
Cattle 882 689 -21.9 46 52 68.7 69.2
1Large hog slaughter plants are those slaughtering at least 2 million head annually. Large cattle slaughter plants are those slaughtering at least1 million head annually. The definition of large plants is not directly comparable for hogs and cattle because a 1-million-head cattle plant pro-duces much more meat than a 2-million-head hog plant. 2Concentration in cattle slaughter is approximately 10 percentage points lower than for steer and heifer slaughter, but they exhibited similartrends over the past 10 years. The four-firm concentration ratio for steer and heifer slaughter, which accounts for about 80 percent of cattleslaughter, fell slightly, from 81.7 in 1994 to 79.6 in 2004.
Source: Compiled by ERS from USDA/NASS and USDA/GIPSA data.

on farms with 2,000 or more hogs increased from 38 to 79 percent(USDA/National Agricultural Statistics Service (NASS)).18 Concentrationin hog production, however, is considerably less than at the slaughter stage.In 2005, sows owned by the top four hog producers accounted for 23percent of the U.S. breeding herd inventory (Freese, 2005; USDA/NASS).
Marketing contracts and packer-owned hogs are the preferred methods ofvertical coordination between large packers and producers. In January2006, 70 percent of all hogs were sold through marketing contracts, and 20percent were owned and slaughtered by the same packer (Grimes and Plain,2006). This suggests that only 10 percent of hogs are “negotiated purchaseand negotiated sales,” also referred to as spot market transactions, comparedwith 87 percent in 1993.19
In the cattle slaughter sector, relatively high concentration is coupled withcontinued consolidation into fewer and larger plants, albeit at slower pacethan in the hog sector.20 The decline in the number of cattle slaughterplants has matched the decline in hog plants. The share of hogs slaughteredby large plants (i.e., at least 2 million head annually) increased by 16percentage points from 1994 to 2004, while the share of cattle slaughteredby large cattle slaughter plants (i.e., at least 1 million head annually) rose by6 percentage points over the same period.21 Unlike that of hog slaughter, the4-firm concentration ratio for cattle slaughter has been fairly stable,hovering around 70 percent since the mid-1990s.
For the four largest steer and heifer packers, the percentage of slaughter thatwas contracted or packer-owned fell from 44.4 percent in 2002 to 38.5percent in 2003. This was the first year since 1999, when 32.4 percent werecontracted or packer-owned, that the share had fallen (USDA/GIPSA).
Recent Mergers, Acquisitions, andDivestitures in the Food System
This section highlights major mergers and acquisitions since 2002, thelatest year available for Census industry concentration ratios. After anactive period of food mergers and acquisitions from 1997 to 2001, mergeractivity in the food system declined beween 2002 and 2006 (fig. 8). Manu-facturers found performance results disappointing and decided to focus ontheir core assets and top-selling product lines. Recent major acquisitions,which include those in the meat and confectionery industries, have been asfollows:
• In 2003, two notable meat-processor mergers occurred: SmithfieldFoods, the world’s largest pork packer and 10th-largest North Americanfood processor, acquired the pork operations of Farmland Industries,referred to as Farmland Foods, the Nation’s 8th-largest packer. Also, agroup of investors led by U.S. Premium Beef acquired FarmlandNational Beef, the fourth-largest beef processor, from FarmlandIndustries (American Institute of Food Distribution, Inc., The FoodInstitute Report, January 19, 2004).
• In 2004, the largest food-related deal was Wm. Wrigley Jr. Company’spurchase of Kraft Food’s confectionery brands, including Life Savers
27The U.S. Food Marketing System: Recent Developments, 1997-2006 / ERR-42
Economic Research Service/USDA
20 Using data from 1963 to 1992,ERS research found that economies ofscale were one factor that led to con-solidation in hog and cattle slaughter(MacDonald et al., 1999).
21According to analysis byMacDonald and Ollinger (2005), therate of cost reductions related to con-solidation in the beef industry slowedafter 1992 because of reduced consoli-dation and smaller cost advantages ofthe largest sized plants.
18ERS research found sizeeconomies to exist in hog production,even for the industrial-sized hog farms(5,000 or more hogs) (McBride andKey, 2003).
19Several ERS studies have ana-lyzed the growth in hog contracting.These studies have found that throughcontracts, packers can gain greatercontrol over hog quality attributes andensure a steady supply of uniform ani-mals, while producers are assured of amarket outlet. Policy concerns includevolatile and thinly traded spot markets,proprietary nature of contract informa-tion, and the ability of smaller, inde-pendent producers to compete withcontract producers (Martinez, 1999;Martinez and Zering, 2004).
and Altoids, which was valued at $1.46 billion. The purchase was com-pleted in 2005. Also in 2004, the 5th-largest pork processor, Hormel,acquired 11th-ranked Clougherty Packing.
• In 2005, the merger between beef packers American Foods Group Inc.and Rosen’s Diversified, Inc., referred to as American Foods Group,LLC, solidified the sixth-ranked position of American Foods Group Inc.
• In 2006, mergers were announced between two leading chicken proces-sors and between two leading pork processors. A $1.1 billion mergeragreement between the second- and third-largest chicken processors,Pilgrim’s Pride and Gold Kist, will create the world’s largest chickencompany, ahead of Tyson Foods. According to data contained inFeedstuffs 2007 Reference Issue and Buying Guide, the top four compa-nies will account for 58 percent of chicken slaughter after the merger, upfrom 53 percent. Smithfield Foods, the largest pork processor,announced a proposed merger with Premium Standard Farms (PSF), thesixth-largest pork processor. Smithfield and PSF are also the largest andsecond-largest hog producers. If the merger is approved, the combinedcompany will account for 20 percent of hog production and 31 percentof hog slaughter, and its own hogs will account for 54 percent of hogsslaughtered by the company (Kilman, 2006).
Major supermarket mergers and acquisitions have also slowed as companiesintegrate assets obtained in earlier merger activity. In 2003, most super-market activity involved national chains who were attempting to increasetheir share in certain geographic markets through small acquisitions (Amer-ican Institute of Food Distribution, Inc., January 19, 2004). In 2004, Albert-sons, the 3rd-largest grocery retailer, acquired JS USA Holdings, the11th-ranked supermarket, which operates under the Shaw’s and StarMarkets banners.
In 2003, the Nation’s largest grocery wholesaler, Fleming, divested the bulkof its operations after its largest customer, Kmart, filed for bankruptcyprotection in the face of stiff competition from Wal-Mart and Target.
28The U.S. Food Marketing System: Recent Developments, 1997-2006 / ERR-42
Economic Research Service/USDA
Figure 8
Annual average mergers and acquisitions by type of food operation,1992-2006
0
50
100
150
200Number
1992-1996 1997-2001 2002-2006
Source: Compiled by ERS from data from American Institute of Food Distribution, Inc.
Manufacturing Wholesale Retail Foodservice

Shortly after declaring bankruptcy in 2002, Kmart ended its supply contractwith Fleming, which accounted for about 20 percent of Fleming’s revenue.Fleming’s financial problems also mounted because of competition fromsupercenters and conflicts with suppliers related to the company’s restruc-turing efforts (Zwiebach, September 2005). In April 2003, Fleming filed forbankruptcy protection and subsequently closed distribution centers anddivested the bulk of its food distribution and retail operations. Volume fromFleming’s 32 distribution centers was replaced by over 100 suppliers in over200 supply locations (Lempert, 2003). Following the divestitures, the shareof general-line grocery sales by the top four wholesalers fell from 34percent in 2001 to 27 percent in 2004 (Appendix A, Appendix table 3).
In 2006, the 11th-ranked grocery wholesaler, Associated Wholesalers, Inc.(AWI), acquired 9th-ranked White Rose Foods. The combined company isexpected to benefit from complementary strengths in different product cate-gories and to lessen AWI’s exposure to Wal-Mart and other grocery retailers.
Given uncertainty that independent retailers served by general-line whole-salers can compete with larger chains, some of the largest grocery whole-salers are vertically integrating into retailing. For example, in 2005,Roundy’s, formerly the eighth-ranked grocery wholesaler, changed its nameto Roundy’s Supermarkets to better reflect the company’s retail focus. Thecompany also sold part of its distribution business to Nash Finch and Super-valu. In 2006, Supervalu, formerly the ninth-largest grocery retailer andsecond-largest grocery wholesaler, along with a consortium of investors thatincluded CVS Corp., a leading drugstore chain, acquired Albertsons for$17.4 billion. The deal boosted Supervalu to the third-ranked positionamong grocery retailers, behind Wal-Mart and Kroger. This trend in verticalintegration by wholesalers is expected to continue.22
29The U.S. Food Marketing System: Recent Developments, 1997-2006 / ERR-42
Economic Research Service/USDA
22Local independent and regionalretail grocers may join together to ownand control wholesale establishments,providing scale economies to competewith the large retail chains. In addi-tion to buying goods at lower costs,these grocery wholesale cooperativesprovide other services, such as adver-tising, technology, and risk manage-ment. They rank among the largestcooperatives, food and nonfood, andgrocery wholesalers in the Nation.Those included among the top 10 gro-cery wholesalers are Wakefern,Associated Wholesale Grocers, andUnified Western Grocers (Appendix A,Appendix table 1).

Food Companies Expand CorporateResponsibility Reporting andCustomized Marketing
Understanding, influencing, and meeting consumer demands are key func-tions of food marketing, with implications for the types of food productsoffered. Monitoring progress in these areas is important for appraising theoutcomes of competitive strategies in the food marketing system. Anintensely competitive environment increases the costs of competing, such asexpenditures on new products and advertising. In this section, we describesome differentiation strategies used by food firms, including responsivenessto societal needs, introduction of new products, and advertising to influenceconsumption patterns.
The Corporate Social Responsibility Movement
One of the most striking global developments in business over the past 10years has been the emergence of the “corporate social responsibility” (CSR)movement as part a firm’s product differentiation strategy (Conley andWilliams, 2005; Siegel and Vitaliano, 2006). The idea behind CSR is thatthe responsibility of a corporation extends beyond providing a financialreturn to its shareholders. Proponents of CSR argue that company objec-tives should broaden to include sustainable growth, equitable employmentpractices, and long-term social and environmental well-being. In addition,they believe that other groups should be included in corporate decisions, notonly employees, but also residents affected by the decisions, governments,and organizations that are advocates for environmental and social causes.CSR shifts the emphasis from traditional government regulation of corpo-rate conduct to the promotion of corporate disclosure of activities thataddress social and environmental issues. (See box, “The Five Stages ofCorporate Responsibility,” p. 31.)
One indication of the importance of the CSR movement in the United Statesis voluntary reporting by corporations of their social and environmentalactivities. Many of the largest companies have started producing social,environmental, or sustainability reports—a combination of social, environ-mental, and financial information. In 2005, 32 of the 100 top U.S. compa-nies published stand-alone CSR reports (KPMG Global SustainabilityServices, 2005). Many of the companies producing social and environ-mental reports have changed the way that they interact with nongovern-mental organizations (NGOs), such as Greenpeace. Instead of relating asadversaries, they are partnering with NGOs to identify issues, conductdiscussions with stakeholders around the world, produce and audit reports,and address specific problems.
The growing importance of CSR is also evident in the rise of M.B.A.programs that provide training in CSR. For example, more than half of the100 M.B.A. programs surveyed worldwide by Aspen Institute and WorldResources Institute require courses in corporate responsibility, comparedwith a third of M.B.A. programs in 2001 (Alsop, 2005). Major companies,such as McDonald’s, have begun forging close relationships with business
30The U.S. Food Marketing System: Recent Developments, 1997-2006 / ERR-42
Economic Research Service/USDA

schools offering these courses. In 2005, McDonald’s started a researchfellowship at the University of California at Berkeley for six students tostudy social, environmental, and financial aspects of the beef supply chain.
Web sites and annual reports of the top five companies in main sectors ofthe U.S. food system, food manufacturers, foodservice companies, andgrocery retailers, reveal substantial variation in the nature and extent of CSRreporting by food companies (table 12). At the time of this writing, all 15of these companies did some CSR reporting. CSR activities were discussedunder headings such as “Community,” “Environment,” “Nutrition, Health,and Wellness,” and “Diversity.” Eight companies provided both a Web sitelink devoted to CSR reporting and a dedicated CSR report, while twocompanies had only a devoted link. Reports were titled as either “corporateresponsibility reports” or “sustainability reports,” and ranged from 19 pages(ConAgra) to 88 pages (McDonald’s). CSR reporting included discussionsof company principles, goals, and accomplishments.
31The U.S. Food Marketing System: Recent Developments, 1997-2006 / ERR-42
Economic Research Service/USDA
The Five Stages of Corporate Responsibility
What factors motivate food companies to engage in socially beneficial activitiesthat extend beyond government mandates? In a 2005 Harvard Business Reviewexcerpt, Zadek (2005) describes five stages as companies move toward greatersocial responsibility.
1. Defensive stage. Companies are faced with unexpected criticism fromsources such as media and social activists. Typical response is to deny theallegations or a relationship between the company’s practices and negativeoutcomes.
2. Compliance stage. Corporate policy is formed and observed, and is usuallymade visible to critics. Compliance is viewed as a cost of protecting thecompany’s reputation and avoiding litigation. For example, the currentpublic policy debate on obesity highlights food companies’ aim for compli-ance, while the public expects far greater commitment.
3. Managerial stage. Companies realize that the problem cannot be deterredby simple compliance or public relations strategies.
4. Strategic stage. Companies learn how establishing strategies to addressresponsible business practices can give them a competitive advantage. Oneexample is food companies that seek greater awareness of how their prod-ucts affect consumer health.
5. Civil stage. Leading companies promote industry guidelines and actions toaddress societal concerns. For example, companies may engage in educa-tional initiatives to promote healthy lifestyle choices, or refrain from salespromotion strategies that could adversely affect social welfare. In a 2005press release, Kraft Foods announced an initiative to advertise more nutri-tionally healthy products in media primarily viewed by children ages 6-11.
Source: Zadek, 2005.

The extent of CSR reporting by leading companies, and the topic areascovered, varied by the company’s role in the marketing chain. Ahold wasthe only grocery retailer with a link or report dedicated to CSR activities,whereas all five manufacturers and four foodservice companies had either alink or report. Furthermore, all five manufacturers had both a link and dedi-cated report, while only two foodservice companies did. More foodservicecompanies reported on animal welfare issues, while contributions to nutri-tion and healthy living were more commonly reported by both foodserviceand manufacturing companies than by grocery retailers.
The Global Reporting Initiative (GRI), which began in 1997, is an inde-pendent institution with the goal of developing guidelines for CSRreporting. Several of the leading food companies use the GRI index, whichprovides standardized guidelines for reporting progress on corporateeconomic, environmental, and social performance. Pepsico, Tyson Foods,and Ahold include information on the GRI index in their CSR reports, whileAlbertsons presents the index as part of its “Company Profile.” Accordingto McDonald’s “Worldwide Corporate Responsibility Report 2004,” thecompany is committed to following GRI guidelines, but further work isneeded on data collection systems and on improving the guidelines to bettermeet company needs. In its 2005 CSR report, Starbucks acknowledges notreporting in full accordance with GRI guidelines, but uses the principles andindicators as a basis for reporting. GRI indicators of a company’s socialresponsibility commitment include its economic, environmental, labor,human rights, social (altruistic), and product responsibility practices.
32The U.S. Food Marketing System: Recent Developments, 1997-2006 / ERR-42
Economic Research Service/USDA
Table 12Reporting of corporate social responsibility (CSR) activities by leading U.S. food companies
Company Web site link devoted to CSR reporting Dedicated CSR report
Foodservice:1
McDonald’s X XYum! Brands XWendy’s XBurger KingStarbucks X X
Retail:Wal-MartKrogerAlbertsonsSafewayAhold X X
Manufacturing:Tyson Foods X XKraft X XPepsico2 X XNestle X XConAgra Foods X X
1Excludes Subway, which is a privately held company, owned by Doctor’s Associates. 2A CSR report is published as part of the company’s annual report.
Source: Compiled by ERS from company Web sites and annual reports.

New Product Introductions
New products bringing benefits to consumers, such as improved flavor ormore convenient packaging, may indicate technological improvements andincreased productivity. Food companies introduce new products to boostsales and maintain or expand market share. Product introductions mayprevent competitors’ new products from taking away sales or may stimulatedemand in poorly performing categories. Retailers are more likely to allo-cate shelf space to manufacturers providing new products on a regular basis.
U.S. food and beverage product introductions tracked by Marketing Intelli-gence Service have been trending upward since the early 1990s, exceedingthose of nonfood grocery items (fig. 9).23 A record 18,722 new food andbeverage products were introduced in 2005 (table 13). Categories with thelargest share of new products included candy, gum, snacks, beverages,condiments, and dairy. The increase in the share of new beverage productsover the past 10 years is especially notable, along with the decline in theshare of new condiments.
A growing share of new product introductions may suggest greater innova-tion for a category. However, new products may be variations of existingones (e.g., new variety or package). Typically, over 90 percent of new foodand beverage introductions are classified by Marketing Intelligence Serviceas “not innovative” (table 13). This suggests that food firms use newproduct introductions as a differentiation strategy, to offer a fresh imagerather than truly novel benefits. Further, failure rates for new products areexceptionally high, exceeding 90 percent for some categories, whichsuggests that firms have difficulty in developing products that appeal toenough people to warrant continued distribution (Connor and Schiek, 1997).Nonetheless, some new products involve technological progress that deliverstruly new benefits to consumers.
33The U.S. Food Marketing System: Recent Developments, 1997-2006 / ERR-42
Economic Research Service/USDA
Figure 9
New product introductions of consumer packaged goods, 1992-2005
Number
Food and beverage
Nonfood
Note: Nonfood items include health and beauty aids, household products, pet products, and miscellaneous items (e.g., tobacco, car care, lighters).
Source: Marketing Intelligence Service, Ltd., Productscan Online, 2006.
1992 94 96 98 2000 02 040
2,000
4,000
6,000
8,000
10,000
12,000
14,000
16,000
18,000
20,000
23Marketing Intelligence Service’sProductscan Online is a worldwidenew product database that includescontent from two MarketingIntelligence Service, Ltd., publica-tions: Product Alert and InternationalProduct Alert.

34The U.S. Food Marketing System: Recent Developments, 1997-2006 / ERR-42
Economic Research Service/USDA
Table 13New food and beverage product introductions, selected years, 1995-2005
1995 1998 2001 2004 2005
Total
New products 13,338 13,654 16,333 18,063 18,722
Type of product Percent of total
Candy, gum, snacks 25 23.8 32.5 30.5 27.7Beverages 19.2 21.6 22.8 21.2 25.1Condiments 18.2 14.2 13.8 13.9 10.2Dairy 8.2 7.9 6.7 6.1 7.2Baking ingredients 4.8 3.2 3.0 3.3 6.0Processed meat 3.2 4.3 5.1 4.4 5.0Meals and entrees 5.2 5.1 3.5 4.9 4.7Bakery foods 5.6 5.2 2.8 5.3 4.1Fruit and vegetables 3.0 5.1 2.8 3.3 3.4Pasta and rice 2.9 4.8 2.3 2.2 2.2Soups 1.9 2.1 1.8 1.5 1.6Cereals 1.1 1.4 1.0 1.2 1.4Desserts .7 .5 .7 .6 0.8Meal replacements .6 .6 .5 .8 0.4
and special diet foodsBaby food .3 .2 .7 .7 0.3
Classification:
Innovative1 8.4 7.1 7.4 8.8 5.4Formulation2 5.2 4.4 4.9 6.1 3.4Merchandising3 0 .1 .3 .4 0.3New market4 0 0 0 0 0.0Packaging benefit 1.4 .9 1.4 1.5 0.9Positioning5 1.8 1.7 .7 .6 0.5Technology6 0 0 .1 .2 0.3
Not innovative 91.6 92.9 92.6 91.2 94.6
1Products classified as innovative are those deemed by Marketing Intelligence Service to be the first to offer breakthrough features and benefits.Examples include icing marketed in microwaveable pouches, and a hot sauce with an adjustable cap that can be used to vary the spiciness. 2Products containing new ingredients that offer benefits not previously provided. 3Products marketed in a new way, such as unique display or packaging options. 4New products that do not compete with any existing product categories.5New products presented for new users or uses compared with existing products.6New product with added consumer benefits resulting from the new technology.
Source: Marketing Intelligence Service, Productscan Online, 2006.
Advertising
Food advertising can influence consumption behavior by encouragingcustomers to try new products, maintaining brand loyalty, and capturing newcustomers (Connor and Schiek, 1997). Advertising expenditures as apercent of sales, or advertising intensity, decrease as one moves furtherdown the supply chain (fig. 10). Advertising expenditures by manufacturershave accounted for a growing share of sales since 1997, which is not thecase for other participants in the food marketing system.
The size of advertising expenditures by food companies indicates the degreeof effort to influence consumer purchases. In 2004, food and beveragemanufacturers ranked among the top 10 ad-spending industries, along withreal estate agents, TV broadcast stations, and motion picture/video tapeproduction (AdAge.com, 2005). In 2001, advertising expenditures by foodand tobacco manufacturers accounted for 38 percent of all food and nonfoodmanufacturer advertising, up from 36 percent in 1994 (Internal RevenueService, 2004, 1997). In 2004, several leading food manufacturers rankedamong the top 50 companies in ad spending, including Altria Group, theparent company of Kraft Foods and Philip Morris ($1.4 billion), Pepsico($1.3 billion), Nestle ($1 billion), Anheuser-Busch ($0.8 billion), and Mars($0.7 billion). Several retailers and foodservice companies also rankedamong the top 50, including McDonald’s ($1.4 billion), Wal-Mart ($0.8billion), and Yum Brands ($0.8 billion), whose subsidiaries include KFC,Pizza Hut, and Taco Bell.
In 2004, manufacturers of food and beverages (excluding alcohol) spent byfar the largest share of their media budgets on TV advertising (69 percent),followed by ads in magazines (25 percent) and on the radio (2 percent)(Advertising Age, 2005). However, the share spent on TV advertising hasdeclined, while magazine ads have increased: in 1990, manufacturers spent80 percent of their media advertising for brand foods on TV ads, with 11percent going to magazine ads (Connor and Schiek, 1997). The decline
35The U.S. Food Marketing System: Recent Developments, 1997-2006 / ERR-42
Economic Research Service/USDA
Figure 10
Advertising expenditures by food companies as a shareof total sales, 1997 and 2004
0
5
10
15
20
25
Source: AdAge.com.
Percent
1997 2004
Foodmanufacturing
Beveragemanufacturing
Wholesalegrocers
Supermarkets Eatingplaces

may reflect new TV commercial-skipping technologies, such as TiVo, andfragmentation of consumers across a wide variety of advertising venues,including cable TV, Internet sites, and video games (Vranica, 2005). Alter-native advertising venues may improve the ability to identify and reachtarget customers. In 2004, cable networks accounted for 19 percent of the$6.8 billion in measured media advertising expenditures by food andbeverage manufacturers (Advertising Age, 2005).
The Internet accounts for only 1 percent of manufacturer advertising expen-ditures, but it is becoming increasingly important in targeting children(Advertising Age, 2005; Shields, 2005). Online advertising to childrengenerally takes the form of games and contests built around the brands andtheir characters. On Wrigley’s “Bubblegum.com” stand-alone gaming site,young viewers can play carnival toss with “Hubba Bubba” bubblegum char-acters. Other examples include Post’s Postopia.com and Frito-Lay’sINNW.com.
Some companies are turning to video games, in-store advertising, andproduct placement in entertainment programs to tout their brands (Nelsonand Ellison, 2005; Turner, 2005; Vranica, 2005). McDonald’s uses videogames to target 18- to 34-year-old males, who are spending less timewatching TV. Kroger announced plans to offer in-store television broad-casts of promotions and new products that will allow manufacturers to airtheir commercials. Each store will have programs specific to its location.In 2005, 14 percent of retailers, including Wal-Mart, were already using thistechnology, and 30 percent intended to add screens within 2 years.Company brands are also appearing in films. For example, Pepsico’s Moun-tain Dew financed a documentary on snowboarding, and the brand could beseen occasionally in the movie.
Advertising messages that tout a product’s attributes are also conveyed onpackages and in supporting literature. Based on new product tags or claimstracked by Marketing Intelligence Service in 2005, health- and convenience-related attributes accounted for 9 of the top 10 subject categories for ads onpackages (table 14).24 Six of these categories, including those stressing“natural,” “organic,” “single serving,” “quick,” “fresh,” and “low or no fat,”have ranked among the top 10 in every year since 2001.
The low-carbohydrate craze is testimony to the responsiveness of the foodindustry to changes in consumer preferences, as well as to the difficulty ofanticipating consumer demands. Given the relative ease of altering productsfor the “low-carb” market, the number of companies offering low-carb-labeled products grew rapidly to include mainstream players such as Nestle,Sara Lee, Frito-Lay, and the Nation’s second-largest food company, Kraft.Supermarkets also responded, with shelf tags, special low-carb sections,features in weekly circulars, and other advertising. In 2004, new productintroductions with low- or no-carb labels rose to 983, or 5.5 percent of allnew food and beverage product introductions, compared with 209 (1.3percent) in 2003 and 101 (0.9 percent) in 2001 (Marketing IntelligenceService, Ltd., 2006). More recently, the popularity of the Atkins and otherlow-carb diets has waned, punctuated by the July 2005 bankruptcy of AtkinsNutritionals. In 2005, 399 “low- or no-carb” products were introduced,down 60 percent from 2004.25
36The U.S. Food Marketing System: Recent Developments, 1997-2006 / ERR-42
Economic Research Service/USDA
24In 2005, Marketing IntelligenceService’s Productscan Online database listed a total of 100 U.S. food andbeverage product claims or tags.
25Diets, such as the Atkins, usuallyexhibit sensational ups and downs, butcome and go afterwards, rather thantotally disappearing, as a true fad does(Knowledge@Wharton, 2005).

While the low-carb craze is apparently fading, a Federal law requiringmanufacturers to list trans-fat on food labels by 2006 has sparked reformu-lation of products to reduce trans-fat. In 2005, 458 “no- or low-trans-fat”products were introduced, compared with 238 in 2004, 64 in 2003, and 5 in2001 (Marketing Intelligence Service, Ltd., 2006). This reformulation islikely to continue as processors work with farmers and suppliers to increaseproduction of low-linolenic soybean oil, and other healthier cooking oils.which can be used to reduce trans-fatty acids (just-food.com, 2005).
Through an agreement with Monsanto, a leading supplier of agriculturalproducts, Kellogg will become one of the first food manufacturers to uselow-linolenic soybean oil. To supply low-linolenic soybeans, farmers willneed to change their production methods. Kellogg is encouraging farmersto produce the soybeans under contract with participating processors. Thesuccess of specialty soybean marketing will hinge on several factors,including market demand and volume, identity preservation, access toappropriate distribution channels, and mutual trust, cooperation, and infor-mation-sharing at each level of the supply chain (Darroch et al., 2002).
37The U.S. Food Marketing System: Recent Developments, 1997-2006 / ERR-42
Economic Research Service/USDA
Table 14Number of new product introductions in the top 10 product claim categories for 2001 to 20051
Tag or claim2 2001 2002 2003 2004 2005
Number
Upscale 695 905 1589 1,568 2,106Natural 1,063 1,245 1,380 1,364 1,612Single serving 782 1,119 1,127 1,111 1,277Fresh 479 578 556 599 692Organic 378 443 559 533 670Low or no fat 518 586 656 617 646Quick 377 443 521 511 571No preservatives 368 421 578 551 550Low or no sugar 227 283 395 619 544High-vitamin 381 422 483 509 532Total new product claims 11,149 13,769 16,374 17,922 19,544
Percent of total
Upscale 6.2 6.6 9.7 8.7 10.8Natural 9.5 9.0 8.4 7.6 8.2Single serving 7.0 8.1 6.9 6.2 6.5Fresh 4.3 4.2 3.4 3.3 3.5Organic 3.4 3.2 3.4 3.0 3.4Low or no fat 4.6 4.3 4.0 3.4 3.3Quick 3.4 3.2 3.2 2.9 2.9No preservatives 3.3 3.1 3.5 3.1 2.8Low or no sugar 2.0 2.1 2.4 3.5 2.8High-vitamin 3.4 3.1 2.9 2.8 2.7
1Does not include associated stock keeping units (SKUs) (e.g., variations in size and form). According to Marketing Intelligence Service, theSKU count report may produce erroneous results because a single new product introduction can have multiple SKUs and each of these SKUsmay or may not have certain package tags.2A new product may have multiple tags or claims.
Source: Marketing Intelligence Service, Productscan Online, 2006.
“Upscale” ranked as the leading new product claim category in 2003, 2004,and 2005, surpassing “natural” and “single serving.” Examples includepremium ice cream, uniquely processed coffee, gourmet jam and desserttopping, and Certified Angus Beef. In what sociologists refer to as a “post-modern consumer culture,” the purchase of upscale food products allowsconsumers to express their individuality (Kinsey, 1994; Krasteva, 2003). Asincomes rise and consumers continually seek new experiences and tastes,the market grows for new niche products that allow consumers to signifytheir independence and social position. Upscale products create an endlessstream of niche-marketing opportunities for food companies, as new prod-ucts must be continually introduced to replace those that become moremainstream. This reinforces the trend away from traditional mass marketingtoward differentiated and customized products.
Advertising through “cobranding” has become an increasingly popularstrategy for differentiating food products. Food processors typically pay afee or royalty to place the logo of a popular food ingredient, container type,or media character—especially one that appeals to children—on a brand-name package (Connor and Schiek, 1997). The logos represent a strongimage that is well recognized by consumers. In 2005, 302 cobranded prod-ucts were introduced, compared with 16 in 1995 (fig. 11). Recent examplesinclude products containing Splenda brand sweetener and carryingSplenda’s logo, Tops brand of ice cream containing Nestle Butterfingercandy pieces, Hillshire Farm deli products packaged in Glad Warecontainers, and SpongeBob Squarepants characters on packages of KeeblerAnimal Crackers.
38The U.S. Food Marketing System: Recent Developments, 1997-2006 / ERR-42
Economic Research Service/USDA
Figure 11
Number of new cobranded* products, 1995-2005
0
50
100
150
200
250
300
350
1995 1996 1997 1998 1999 2000 2001 2002 2003 2004 2005
Number
Source: Marketing Intelligence Service, 2006.
*In cobranding, a company that produced a familiar ingredient used in a brand-nameproduct is paid by the maker of the product to have the logo of the ingredient displayedon the package.
References
Adage.com. “2004 Advertising to Sales Ratios for 200 Largest AdSpending Industries,” accessed March 16, 2005 at:www.adage.com/page.cms?pageId=1064/.
Adamy, J. “New Food, New Look,” The Wall Street Journal, November 21,2005.
Advertising Age. “Domestic Advertising Spending by Category,” June 27,2005.
Alexander, D. “Grocers, Drugstores Mixing it up in Food Fight,” ChicagoTribune, March 14, 2004.
Alsop, R. “Recruiters Seek M.B.A.s Trained in Responsibility,” The WallStreet Journal, December 13, 2005.
American Institute of Food Distribution, Inc. The Food Institute Report.Selected issues. Elmwood Park, NJ.
Besanko, David, David Dranove, and Mark Shanley. 1996. Economics ofStrategy. New York, NY: John Wiley and Sons.
Beverage Marketing Corporation of New York. “Bottled Water ContinuesTradition of Strong Growth in 2005,” Press release, April 2006.
Beverage Marketing Corporation of New York. “U.S. Bottled Water SalesSpurt Forward, Recording Fastest Growth in Ten Years,” Press release,August 25, 2000.
Bjornson, B., and M.E. Sykuta. 2002. “Growth by Acquisition and thePerformance of Large Food Retailers,” Agribusiness, Vol. 18, pp. 263-81.
Brady, R., and K. Cavanaugh. “Grocery and Consumables Retail LandscapeContinues to Evolve,” Competitive Edge, June 2005 (revised July 14, 2005).
Caffarini, A., and K. Cavanaugh. “The Future of Food Retailing,” Competi-tive Edge, July 2006.
Collins, J. “RFID’s Impact at Wal-Mart Greater Than Expected,” RFIDJournal, May 4, 2006.
Conley, J.M., and C.A. Williams. “Engage, Embed, Embellish: TheoryVersus Practice in the Corporate Social Responsibility Movement.” Univer-sity of North Carolina (UNC) Legal Studies Research Paper No. 05-16,March 23, 2005. Available at SSRN: http://ssrn.com/abstract=691521 orDOI: 10.2139/ssrn.691521.
Connor, John M., and William A. Schiek. 1997. Food Processing: An Indus-trial Powerhouse in Transition. New York, NY: John Wiley and Sons.
39The U.S. Food Marketing System: Recent Developments, 1997-2006 / ERR-42
Economic Research Service/USDA

ConsumerReports.org. August 2005. “Store Brands vs. Name Brands: Howto Choose,” accessed September 18, 2006 at:http://www.consumerreports.org/cro/personal-finance/store-brands-vs-name-brands-how-to-choose-805/index.htm .
Covert, J. “Wal-Mart Says Radio Tags Keep Shelves Better-Stocked,” TheWall Street Journal, October 26, 2005.
Darroch, M.A., J.T. Akridge, and M.D. Boehlje. 2002. “Capturing Value inthe Supply Chain: The Case of High Oleic Acid Soybeans,” InternationalFood and Agribusiness Management Review, Vol. 5, pp. 87-103.
Enis, M. “Quick-Service Restaurants Make the Cut,” Supermarket News,September 26, 2005.
Feedstuffs. 2007 Reference Issue and Buyers Guide, Rural Press Limited,September 13, 2006.
Food Marketing Institute. “New FMI Report Shows Retailer Success WithSunrise 2005 and Data Synchronization; Barriers Remain for ElectronicProduct Code,” Press release, September 15, 2005.
Forbes.com. July 7, 2004. “Emerging Trends: Private Labels OutperformFamiliar Names,” accessed November 18, 2005 at:http://www.forbes.com/2004/07/07/0707findspv_labels_print.html/.
Freese, B. “Show Me the Sows,” Successful Farming, October 2005.
Garry, M. “A Brave New World of Data Sync,” Supermarket News,January 17, 2005.
Garry, M. “Bracing for Competition,” Supermarket News, January 31,2005.
Garry, M. “Data Collaboration,” Supermarket News, June 20, 2005.
Garry, M. “Pursuing the Dream,” Supermarket News, June 5, 2006.
Garry, M. “The New High-Tech Store,” Supermarket News, November 28,2005.
Garry, M. “Wakefern Chooses Transora as Data Pool,” Supermarket News,March 14, 2005.
Global Insight Inc. November 2, 2005. “The Economic Impact of Wal-Mart.” accessed December 13, 2006 at:http://www.globalinsight.com/MultiClientStudy/MultiClientStudyDe-tail2438.htm /.
Greenhouse, S. “Wal-Mart, a Nation Unto Itself,” The New York Times,April 17, 2004.
40The U.S. Food Marketing System: Recent Developments, 1997-2006 / ERR-42
Economic Research Service/USDA

Griffith, T. “The U.S. Retail Food Industry: 2002 Store Format Update,”Competitive Edge, June 2002.
Grimes, G., and R. Plain. “U.S. Hog Marketing Contract Study,” Depart-ment of Agricultural Economics, University of Missouri, Columbia,Working Paper No. AEWP 2006-01, January 2006.
Hamstra, M. “Alternative Access: Club Stores,” Supermarket News,October 24, 2005.
Harris, J.M., P.R. Kaufman, S.W. Martinez, and C. Price. The U.S. FoodMarketing System, 2002: Competition, Coordination, and TechnologicalInnovations Into the 21st Century, AER-811, U.S. Department of Agricul-ture, Economic Research Service, June 2002.
Hopkins, J. “U.S. Economy Follows the Wal-Mart Way,” USA Today,February 3, 2003.
Internal Revenue Service. Statistics of Income - 2001, Corporation IncomeTax Returns, Publication 16, September 2004.
Internal Revenue Service. Statistics of Income - 1994, Corporation IncomeTax Returns, Publication 16, September 1997.
Irwin, E.G., and J. Clark. February 23, 2006. “The Local Costs and Bene-fits of Wal-Mart.” Department of Agricultural, Environmental, and Devel-opment Economics, The Ohio State University. Accessed October 11, 2006at: http://aede.osu.edu/programs/ComRegEcon/retail.htm/.just-food.com.
just-food.com. “Kellogg Moves to Low Linolenic Oil to Cut Trans Fat,”December 9, 2005.
Kaufman, P.R. “Consolidation in Food Retailing: Prospects for Consumersand Grocery Suppliers,” Agricultural Outlook, August 2000.
Kilman, S. “Smithfield To Buy Hog Farmer Premium Standard,” The WallStreet Journal, September 19, 2006.
Kinsey, Jean. 1994. “Changes in Food Consumption from Mass Market toNiche Markets,” Food and Agricultural Markets: The Quiet Revolution.National Planning Assoc. Rpt. No. 270. Eds.: Lyle P. Schertz and Lynn M.Daft. Washington, DC, pp. 19-43.
Kinsey, J.D. 2001. “The New Food Economy: Consumers, Farms, Pharms,and Science,” American Journal of Agricultural Economics, Vol. 83, pp.1113-30.
Kinsey, J. July 2000. “Retail Food Distribution: The Race to Efficiency.”Presentation at the International Institute of Fisheries Economics and Tradeconference, Corvallis, OR.
KPMG Global Sustainability Services. KPMG International Survey ofCorporate Responsibility Reporting 2005, Report 15-6-2005, June 2005.
41The U.S. Food Marketing System: Recent Developments, 1997-2006 / ERR-42
Economic Research Service/USDA
Knowledge@Wharton. October 19, 2005. “Spreading Yourself Too Thin:The Atkins Diet and Other Fads,” accessed September 13, 2006 at:http://knowledge.wharton.upenn.edu/article.cfm?articleid=1295&CFID=978232&CFTOKEN=20486806/.
Krasteva, M. 2003. “Creating a Postmodern Individual Product Offer.”Masters thesis, School of Economics and Commercial Law, GöteborgUniversity, Göteborg, Sweden.
Lempert, P. (ed.). November 12, 2003. Facts, Figures, and the Future,accessed June 22, 2005 at:www.factsfiguresfuture.com/archive/november_2003.htm/.
Lempert, P. “The Lempert Report: Organic Generation,” ProgressiveGrocer, October 1, 2005.
Leibtag, E. The Impact of Big-Box Stores on Retail Food Prices and theConsumer Price Index, ERR-33, U.S. Department of Agriculture, EconomicResearch Service, December 2006.
MacDonald, J.M., and M.E. Ollinger. “Technology, Labor Wars, andProducer Dynamics: Explaining Consolidation in Beefpacking,” AmericanJournal of Agricultural Economics, Vol. 87, pp. 1020-33, 2005.
MacDonald, J.M., M.E. Ollinger, K.E. Nelson, and C.R. Handy. Consolida-tion in U.S. Meatpacking, AER-785, U.S. Department of Agriculture,Economic Research Service, March 1999.
Marketing Intelligence Service, Ltd. Productscan Online, 2006.http://www.productscan.com/.
Martinez, S.W. Vertical Coordination in the Pork and Broiler Industries:Implications for Pork and Chicken Products, AER-777, U.S. Department ofAgriculture, Economic Research Service, April 1999.
Martinez, S., K. Smith, and K. Zering. Vertical Coordination andConsumer Welfare: The Case of the Pork Industry, AER-753. U.S. Depart-ment of Agriculture, Economic Research Service, August 1997.
Martinez, S., and H. Stewart. “From Supply Push to Demand Pull:Agribusiness Strategies for Today’s Consumers,” Amber Waves, Vol. 1, Issue 5, November 2003.
Martinez, S.W., and K. Zering. Pork Quality and the Role of Market Organi-zation, AER-835, U.S. Department of Agriculture, Economic ResearchService, October 2004.
McBride, W.D., and N. Key. Economic and Structural Relationships in U.S.Hog Production, AER-818. U.S. Department of Agriculture, EconomicResearch Service, February 2003.
McKinsey Global Institute. U.S. Productivity Growth 1995-2000, Wash-ington, DC, October 2001.
42The U.S. Food Marketing System: Recent Developments, 1997-2006 / ERR-42
Economic Research Service/USDA

Mohtadi, Hamid, and Jean D. Kinsey. 2005. “Information Exchange andStrategic Behavior in Supply Chains: Application to the Food Sector,”American Journal of Agricultural Economics, Vol. 87, pp. 582-99.
Muirhead, S. “McDonald’s Rolls Out New Labels,” Feedstuffs, October 31,2005.
Nelson, E., and S. Ellison. “In a Shift, Marketers Beef Up Ad SpendingInside Stores,” The Wall Street Journal, September 21, 2005.
Ollinger, M., S.V. Nguyen, D. Blayney, B. Chambers, and K. Nelson. FoodIndustry Mergers and Acquisitions Lead to Higher Labor Productivity,ERR-4227. U.S. Department of Agriculture, Economic Research Service,October 2006.
Ollinger, M., S.V. Nguyen, D. Blayney, B. Chambers, and K. Nelson.Structural Change in the Meat, Poultry, Dairy, and Grain Processing Indus-tries, ERR-423. U.S. Department of Agriculture, Economic ResearchService, March 2005.
Parks, L. “More Retailers, Vendors Start Embracing RFID,” Supermarket News, Sept. 26, 2005.
Porter, Michael E. 1990. The Competitive Advantage of Nations. New York,NY: The Free Press.
Private Label Manufacturers Association. 2006. “Market Profile,” accessedSeptember 19, 2006 at: http://plma.com/storeBrands/sbt06.html.
Progressive Grocer. “Taking the Lead,” May 1, 2006.
Rodwan, J.G. “The 2002 Stats: Another Year of Big Gains,” Bottled WaterReporter, April/May 2003.
Rogers, R.T. “The U.S. Food Marketing System.” In Wiley Encyclopedia ofFood Science and Technology, ed. F.J. Francis, pp. 2701-24. New York, NY:John Wiley and Sons, 2000.
Rogers, T.K. “Turning Supermarkets Into Restaurants, Too,” The New YorkTimes, August 28, 2005.
Seifert, Dirk. 2002. Collaborative Planning, Forecasting and Replenish-ment. Bonn, Germany: Galileo Press.
Sharkey, T., and K. Stiegert. “Impacts of Nontraditional Food RetailingSupercenters on Food Price Changes,” Food System Research Group,Department of Agricultural and Applied Economics, University ofWisconsin-Madison, FSRG Monograph Series No. 20. February 2006.
Shields, M. July 25, 2005. “Web Marketing to Kids Is Rising,” Mediaweek,accessed September 19, 2006 at:http://www.aef.com/industry/news/data/2005/3137.
43The U.S. Food Marketing System: Recent Developments, 1997-2006 / ERR-42
Economic Research Service/USDA

Showalter, K. “Grocers See Gold in Gas, Add Discounted Pumps,” BusinessFirst of Columbus, June 12, 2006.
Siegel, D.S., and D.F. Vitaliano. “An Empirical Analysis of the StrategicUse of Corporate Social Responsibility.” Rensselaer Working Papers inEconomics 0602, Rensselaer Polytechnic Institute, Department ofEconomics. January 2006.
Sparks, L., and B.A. Wagner. 2003. “Retail Exchanges: A ResearchAgenda,” Supply Chain Management: An International Journal, Vol. 8, pp. 17-25.
Stewart, H., and S. Martinez. “Innovation by Food Companies Key toGrowth and Profitability,” FoodReview, Vol. 25, Issue 1, Spring 2002.
Sullivan, L. “Wal-Mart RFID Trial Shows 16% Reduction in ProductStock-Outs,” RFIDinsights, October 14, 2005.
Tarnowski, J. “Natural Defenses,” Progressive Grocer, March 1, 2005.
Technomic, Inc. “Takeout Takes Off—Technomic Launches Tapping theMarket Potential for Takeout Dining Study,” Press release, January 27, 2005.
Technomic Information Services, Inc. 2006 Technomic Top 500 ChainRestaurant Report. 2006.
Turner, T. “Sales Pitch on Aisle Five,” Knight Ridder News Service,September 17, 2005.
United States Census Bureau. Economic Census.http://www.census.gov/econ/census02/.
United States Department of Agriculture. National Agricultural StatisticsService (NASS). http://www.nass.usda.gov/index.asp/
United States Department of Agriculture, Economic Research Service. ERSBriefing Room, “Food CPI, Price and Expenditures: Foodservice as a Shareof Food Expenditures”http://www.ers.usda.gov/Briefing/CPIFoodAndEx-penditures/Data/table12.htm
United States Department of Agriculture. Grain Inspection, Packers andStockyards Administration. Packers and Stockyards Statistical Report,selected issues.
United States Department of Agriculture. Report to Congress on theEconomic Effects of U.S. Dairy Policy and Alternative Approaches to MilkPricing. July 2004.
Veiders, C. “Alternative Access: Drug Stores,” Supermarket News, October 24, 2005.
Vocke, G., E. W. Allen, and M. Ali. Wheat Backgrounder, WHS-05k-01. U.S.Department of Agriculture, Economic Research Service, December 2005.
44The U.S. Food Marketing System: Recent Developments, 1997-2006 / ERR-42
Economic Research Service/USDA

Vranica, S. “Anywhere, Anytime,” The Wall Street Journal, November 21,2005.
Zadek, S. “The Five Steps of Corporate Responsibility,” Harvard BusinessWeek, January 17, 2005.
Zwiebach, E. “Alternative Access: Supercenters,” Supermarket News,October 24, 2005.
Zwiebach, E. “Rationalizing the Volume,” Supermarket News, June 28,2004.
Zwiebach, E. “SEC Details Fleming’s Accounting ‘Illusions’,” SupermarketNews, September 26, 2005.
Zwiebach, E. “Wal-Mart Logistics May Swamp Distribution Chain,” Super-market News, April 12, 2004.
45The U.S. Food Marketing System: Recent Developments, 1997-2006 / ERR-42
Economic Research Service/USDA

46The U.S. Food Marketing System: Recent Developments, 1997-2006 / ERR-42
Economic Research Service/USDA
Appendix ATop 10 Companies in Each Stage of the Food Marketing System and Changes in Concentration in all Food and Beverage Manufacturing Industries and Grocery Wholesaling
Appendix table 1Top 10 food marketing companies by stage of marketing1
Manufacturing2 Grocery Foodservice Grocery Foodservicewholesalers3 wholesalers retailers
Tyson Foods, C and S Sysco Co. Wal-Mart Stores McDonald’s Inc. ($23.9) Wholesale ($31.4) ($98.7) Corp. ($26.9)
Grocers ($15.2)
Kraft Foods, Supervalu, Inc. U.S. Foodservice Kroger ($58.5) Yum! Brands5
Inc.4 ($23.3) ($10.00) ($18.5) ($17.4)
Pepsico, Inc. Wakefern Food Performance Albertsons, Inc. Wendy’s ($21.2) Corporation Food Group ($36.3) International,
($9.0) ($5.7) Inc. ($8.0)
Nestle ($19.9) Associated Gordon Food Safeway, Inc. Burger King Wholesale Service ($3.7) ($32.7) ($7.9)Grocers of Kansas City ($4.5)
Anheuser-Busch Nash Finch Food Services of Ahold USA, Inc.6 Doctor’s Cos., Inc. ($11.5) Company ($3.9) America Inc. ($23.8) Associates, Inc.7
($2.5) ($7.2)
Dean Foods Unified Western Reinhart Publix Super Starbucks Corp.($10.5) Grocers ($2.9) Foodservice, Inc. Markets, Inc. ($5.8)
($2.1) ($18.5)
General Mills, United Natural Maines Paper Delhaize Darden Inc. ($9.8) Foods ($2.3) and Foodservice, America, Inc.8 Restaurants,
Inc. ($2.0) ($16.5) Inc.9 ($4.8)
Smithfield Purity Wholesale Ben E. Keith H.E. Butt Grocery AlliedFoods, Inc. Grocers ($1.2) Foods ($1.3) Co. ($10.4) Domecq10($4.5)($9.6)
ConAgra Foods, White Rose Shamrock Foods Supervalu, Inc. Applebee’sInc. ($8.2) Foods ($1.2) Co. ($1.3) ($8.6) International,
Inc. ($4.2)
Swift & Co. Spartan ($1.2) Cheney Brothers, Winn-Dixie Brinker ($7.8) Inc. ($0.6) Stores, Inc.($7.1) International11
($4.2)
12005 sales in parentheses (billion dollars).2Includes North American food sales.3Excludes sales at company-owned retail stores.4Subsidiary of Altria Group.5Chains include KFC, Pizza Hut, Taco Bell, and Long John Silver’s.6Stores include Giant Food, Stop and Shop, and Tops Friendly Markets.7Owner of Subway.8Stores include Food Lion, Hannaford Bros., and Kash ‘n Karry.9Chains include The Olive Garden and Red Lobster.10Chains include Dunkin’ Donuts and Baskin-Robbins.11Chains include Chili’s Grill & Bar, Romano’s Macaroni Grill, and On The Border.
Sources: Compiled by ERS from Food Processing, August 2006; Supermarket News; American Institute of Food Distribution, Inc., The Food Institute Report, April 3, 2006; Progressive Grocer, May 2006; Technomic Information Services, Inc., 2006; and company annual reports filed with the SEC.

47The U.S. Food Marketing System: Recent Developments, 1997-2006 / ERR-42
Economic Research Service/USDA
Appendix table 2Changes in number of plants, number of firms, and concentration in food and beveragemanufacturing, 1997 to 2002
Number of plants Number of firms CR44
Percent change
Average change over all industries 4.5 6.3 11.4
Increasing concentration
Fluid milk -14 -22 100
Seafood canning -16 -18 76
Ice -15 -17 76
Fresh & frozen seafood -10 -9 50
Ice cream and frozen desert -9 -11 49
Retail bakeries 5 3 48
Dried & dehydrated food2 17 18 40
Malt -21 -16 32
Fats & oils refining & blending -9 -16 31
Bottled water 66 84 21
Meat processed from carcasses 3 3 19
Commercial bakeries -5 -6 18
Distilleries 37 52 18
Frozen fruit, juice, & vegetable -8 -15 15
Poultry processing 14 21 14
Dry pasta -27 -27 13
Cookie & cracker -7 -9 11
Flour milling -11 -16 11
Dog & cat food 29 36 10
Nonchocolate confectionery -17 -18 10
Creamery butter 3 3 10
Other animal food1 4 8 10
Soft drink -16 -24 10
Wineries 74 77 8
Flour mixes & dough mfg. from purchased flour -12 -13 8
Other snack food3 -19 -22 6
Specialty canning -7 -6 6
All other miscellaneous food 96 102 4
Animal (except poultry) slaughtering 34 36 3
Rice milling 13 11 3
Frozen specialty food 1 -1 2
Dry, condensed, & evaporated dairy product 0 -5 1
Breweries -29 -30 1
No change in concentration
Cheese -4 -8 0
Soybean processing 27 42 0
—Continued
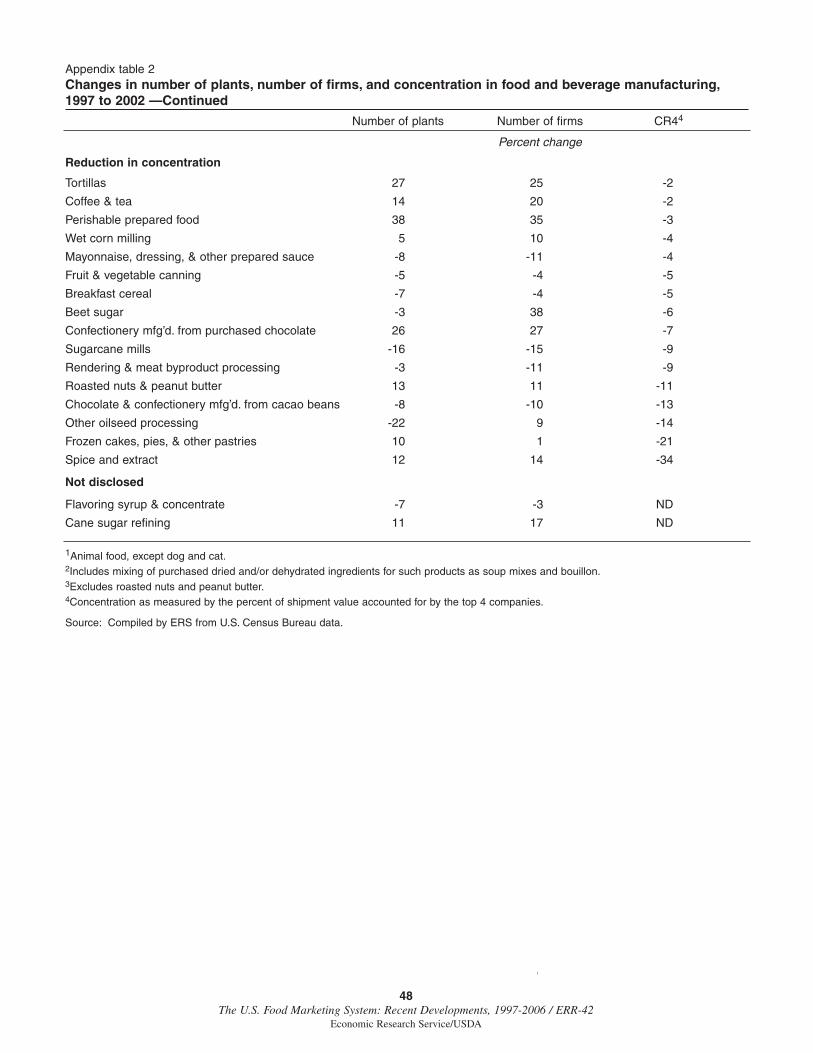
48The U.S. Food Marketing System: Recent Developments, 1997-2006 / ERR-42
Economic Research Service/USDA
Appendix table 2Changes in number of plants, number of firms, and concentration in food and beverage manufacturing,1997 to 2002 —Continued
Number of plants Number of firms CR44
Percent change
Reduction in concentration
Tortillas 27 25 -2
Coffee & tea 14 20 -2
Perishable prepared food 38 35 -3
Wet corn milling 5 10 -4
Mayonnaise, dressing, & other prepared sauce -8 -11 -4
Fruit & vegetable canning -5 -4 -5
Breakfast cereal -7 -4 -5
Beet sugar -3 38 -6
Confectionery mfg’d. from purchased chocolate 26 27 -7
Sugarcane mills -16 -15 -9
Rendering & meat byproduct processing -3 -11 -9
Roasted nuts & peanut butter 13 11 -11
Chocolate & confectionery mfg’d. from cacao beans -8 -10 -13
Other oilseed processing -22 9 -14
Frozen cakes, pies, & other pastries 10 1 -21
Spice and extract 12 14 -34
Not disclosed
Flavoring syrup & concentrate -7 -3 ND
Cane sugar refining 11 17 ND
1Animal food, except dog and cat.2Includes mixing of purchased dried and/or dehydrated ingredients for such products as soup mixes and bouillon.3Excludes roasted nuts and peanut butter.4Concentration as measured by the percent of shipment value accounted for by the top 4 companies.
Source: Compiled by ERS from U.S. Census Bureau data.

49The U.S. Food Marketing System: Recent Developments, 1997-2006 / ERR-42
Economic Research Service/USDA
Appendix table 3Top 10 wholesalers ranked by wholesale sales, 2001 and 2004
2001 Sales derived from 2004 Sales derived fromCompany Wholesale Retail Total Company Wholesale Retail Total
Billion dollars Billion dollars
Fleming 13.3 2.3 15.6 C and S 13.2 0.0 13.2Companies, Inc. Wholesale
Grocers
Supervalu, Inc. 10.8 9.5 20.3 Supervalu, Inc. 9.0 10.5 19.5
C and S Wholesale 8.5 0.0 8.5 Wakefern Food 7.0 0.1 7.1Grocers1 Corporation
Wakefern Food 5.8 0.1 5.9 Associated 4.3 0.5 4.8Corporation Wholesale
Grocers ofKansas City
Nash Finch 3.1 1.0 4.11 Nash Finch 3.1 0.8 3.9Company Company
Associated 3.0 0.2 3.1 Unified 3.0 0.0 3.0Wholesale Grocers Western (Kansas City) Grocers
Unified Western 2.9 0.2 3 Giant Eagle 1.9 3.3 3.0Grocers
Spartan Stores, Inc. 2.1 1.4 3.5 Roundy’s, Inc. 1.8 3.0 4.8
Roundy’s, Inc. 2.0 1.4 3.4 Purity 1.4 0.0 1.4WholesaleGrocers
Giant Eagle 1.6 2.9 4.5 Associated 1.3 0.1 1.4Wholesalers
Total grocery 112.3 122.7general linemerchantwholesale sales2
Top 4 percent of total 34.2 27.3
1Excludes sales at its Grand Union stores.2Excludes manufacturing sales branches and offices. Because general-line grocery wholesale sales, excluding specialty and limited-line whole-salers, are not available in non-Census years, they were assumed to account for 30 percent of merchant sales. This percentage is based on the2002 census year.
Sources: Supermarket News, U.S. Census Bureau, and annual reports filed with the SEC.

Appendix BMajor Changes in Food Industry CensusClassifications in 1997 and 2002
In 1997, the U.S. Census Bureau revised the coding system for industryclassifications from the Standard Industrial Classification (SIC) code to theNorth American Industrial Classification System (NAICS). Major changesaffecting the food industry include:
• Retail bakeries that make and sell products at the same location, andcandy stores that make candy on the premises, which had been classifiedas retail establishments, are now classified as manufacturers.
• Cookie and donut shops, formerly classified as retail establishments, arenow classified as “snack and nonalcoholic beverage bars” under theNAICS code for “foodservices and drinking places.”
• Gas stations with convenience stores, which had been classified as food-stores, are now part of the gas station industry.
• Beer, wine, and liquor stores were moved from the “miscellaneousstore” classification to a new “beer, wine, and liquor stores” classifica-tion, replacing the old SIC code for liquor stores.
• Beverage manufacturing was moved from the “food and kindred products”SIC code to a new “beverage and tobacco product” NAICS code.
In 2002, the NAICS codes were further refined, with significant changes inwholesaling.26 Under the 1997 classifications, agents and brokers, who donot take title to the goods being sold but rather receive a commission or feefor their service, were classified as wholesalers in the “grocery and relatedproducts” industry. Beginning in 2002, agents and brokers were moved tothe “wholesale electronic markets and agents and brokers” industrysegment. In addition to agents and brokers, the wholesale sector iscomprised of merchant wholesalers that sell products on their own account,including:
• Manufacturers’ sales branches and offices, which are maintainedby manufacturers for marketing their products.
• Merchant wholesalers, excluding manufacturers’ sales branches and offices.
Because 1997 was the first year of the new classification system, 1997 and2002 data were used to analyze changes in the number and size of compa-nies and establishments.
50The U.S. Food Marketing System: Recent Developments, 1997-2006 / ERR-42
Economic Research Service/USDA
26Detailed Census information isavailable at 5-year intervals.

51The U.S. Food Marketing System: Recent Developments, 1997-2006 / ERR-42
Economic Research Service/USDA