electronic report from the economic research service - usda ers - home
TRANSCRIPT
United StatesDepartmentof Agriculture
www.ers.usda.gov
Electronic Report from the Economic Research Service
AgricultureInformationBulletin Number 794 New Directions in Global
Food MarketsAnita Regmi and Mark Gehlhar, editors
February 2005
Abstract
Although consumer diets are being upgraded globally, food purchase patternsvary across countries based on income levels. Developing countries are registering rapid increases in retail sales of high-value foods, while developedcountries are seeing a rise in sales of products that meet consumer demandsfor variety, food safety, and quality. To meet these increasingly varied needs,multinational food retailers and manufacturers are expanding their presence indeveloping countries, and food retailers and suppliers are adding value anddifferentiating their products in developed countries. The ongoing changes aredriving food supply chains to adopt closer coordination between producersand retailers to facilitate customizing products to meet consumer demands.Even as the food industry is becoming more global, food markets are increasingly responding to consumer preferences at a local level and cateringto specific demands in each market.
Keywords: Global food markets, retail market, supply chains, high-valuefoods, food manufacturers, private labels, industry concentration.
Acknowledgments
Appreciation is extended to Mary Bohman, John Dunmore, GregPompelli, and Donna Roberts of USDA’s Economic Research Service(ERS) for their support of the project and their review comments, and toMaury Bredahl (University of Guelph) and Spiro Stefanou (PennsylvaniaState University) for their thorough review of the entire publication. Theauthors would also like to extend sincere thanks to John Dyck, SuchadaLangley, Barry Krissoff, Phil Kaufman, Mike Harris, and AldenManchester of ERS; Karen Halliburton, Joani Dong, Dorsey Luchok,

ww
w.er
s.usda.gov
Want to learn more about global food markets? Visit our website at www.ers.usda.gov.
You can also find additional information about ERS publications, databases, and other products at our website.
Visit Our Website To Learn More!
National Agricultural LibraryCataloging Record:
The U.S. Department of Agriculture (USDA) prohibits discrimination in all its programs and activities on the basis of race, color, national origin, sex, religion, age, disability, political beliefs, sexual orientation, or marital or family status. (Not all prohibited bases apply to all programs.) Persons with disabilities who require alternative means for communication of program information (Braille, large print, audiotape, etc.) should contact USDA's TARGET Center at (202) 720-2600 (voice and TDD).
To file a complaint of discrimination, write USDA, Director, Office of Civil Rights, Room 326-W, Whitten Building, 14th and Independence Ave., SW, Washington, DC 20250-9410, or call (202) 720-5964 (voice and TDD). USDA is an equal opportunity provider and employer.
New directions in global food markets.
(Agriculture information bulletin ; no. 794) 1. Food industry and trade. 2. Globalization. 3. International trade. I. Regmi, Anita. II. Gehlhar, Mark J.III. United States. Dept. of Agriculture. Economic Research Service.IV. Title.HD9000.5
iiNew Directions in Global Food Markets / AIB-794
Economic Research Service/USDA
Audrey Talley, Robert Tse and Daniel Whitley of USDA’s Foreign Agri-cultural Service; Steve Gill, Bill Chambers, and Dennis Shields of USDA’sFarm Service Agency; Mike Reed of the University of Kentucky; CherylDeVuyst of North Dakota State University; Luanne Lohr of the Universityof Georgia; Joe Uhl of Purdue University; Mike Boland of Kansas StateUniversity; and Greg Price of the Commodity Futures Trading Commis-sion. Special thanks are extended to John Weber for editorial assistanceand Wynnice Pointer-Napper for design assistance.

Contents
Summary . . . . . . . . . . . . . . . . . . . . . . . . . . . . . . . . . . . . . . . . . . . . . . . . . . .iv
Introduction . . . . . . . . . . . . . . . . . . . . . . . . . . . . . . . . . . . . . . . . . . . . . . . . .1
Chapter 1Factors Shaping Global Food Markets . . . . . . . . . . . . . . . . . . . . . . . . .5Mark Gehlhar and Anita Regmi
Chapter 2Demand for Quality Drives Changes in Food Supply Chains . . . . . .18Robert P. King and Luciano Venturini
Chapter 3Retail Sector Responses to Changing Consumer Preferences:
The European Experience . . . . . . . . . . . . . . . . . . . . . . . . . . . . . . . . .32Jean-Marie Codron, Klaus Grunert, Eric Giraud-Heraud,Louis-Georges Soler, and Anita Regmi
Chapter 4Supermarket Expansion in Latin America and Asia:
Implications for Food Marketing Systems . . . . . . . . . . . . . . . . . . .47Thomas Reardon, C. Peter Timmer, and Julio A. Berdegue
Chapter 5Global Food Manufacturing Reorients To
Meet New Demands . . . . . . . . . . . . . . . . . . . . . . . . . . . . . . . . . . . . . .62Chris Bolling and Mark Gehlhar
Appendix Tables . . . . . . . . . . . . . . . . . . . . . . . . . . . . . . . . . . . . . . . . . . . . .74
iiiNew Directions in Global Food Markets / AIB-794
Economic Research Service/USDA

Summary
Understanding the performance and dynamics of global food markets is nolonger a matter of understanding the fundamentals of international trade. At$3.2 trillion, processed food sales are a major component of global foodmarkets and account for about three-fourths of total world food sales. Still,only 10 percent of processed food sales are traded products. Althoughconsumer demand for processed food continues to grow globally, growth inprocessed food trade has generally stalled since the mid-1990s. While tradepolicy may contribute to this disparity between trade levels and marketperformance, many other factors are at play.
Understanding the competitive nature of the global food industry meansunderstanding changing consumer preferences and the food industry’s effortsto meet these demands. The task of moving food from the farm to the tablehas become more complex, involving diverse local, national, and globalagents and networks. Food markets are constantly evolving, driven not onlyby changes in consumer preferences, but also by technology, linkages betweenmembers of the food supply chains, and prevailing policies and business envi-ronments. Sophisticated supply chains and distribution channels are nowbeing adopted across different regions and national boundaries.
Developing countries are expected to largely account for future increases infood demand, resulting from both increases in population as well as increasesin per capita food consumption. Annual growth rates of retail sales of pack-aged food products in developing countries range from 7 percent in upper-middle-income countries to 28 percent in lower-middle-income countries,much higher than annual growth rates of 2-3 percent in developed countries.
The food industry will continue to evolve in response to specific consumerdemands in individual markets, with significant differences betweenindustry strategies in the developing and the developed countries. Across allcountries, modern food markets are responding to consumer preferences at alocal level, even as the food industry becomes more global.
In mature developed-country markets, product differentiation, value added,and consumer trust are important considerations for retailers seeking toretain market share. Many retailers, particularly in Western Europe, havedeveloped private label products that capture these qualities. To ensure thattheir branded products meet quality and safety standards demanded byconsumers, retailers coordinate and develop relationships with otherupstream sectors in the food supply chain.
In rapidly growing developing-country markets, multinational food compa-nies are expanding and changing regional food industry landscapes. Foreigninvestments by these firms have played major roles in the diffusion andexpansion of supermarkets in Latin America and Asia. While supermarketsaccounted for 15-30 percent of the national food retail sales before the1980s, they currently account for 50-70 percent of the retail sales in manyLatin American countries, registering in one decade the level of growthexperienced in the United States in five decades. Although the supermarket
ivNew Directions in Global Food Markets / AIB-794
Economic Research Service/USDA

sector in Asia is 5-7 years behind in its expansionary process, it is regis-tering faster rates of growth than in Latin America.
In all markets, market forces are expected to push the evolutionary processtoward increased efficiency, higher quality products, and more integratedfood supply chains. Increased private label products in developed-countrymarkets are contributing to the global trend in more integrated food supplychains. Likewise, changes brought about by multinational retailers areupgrading the food marketing sector in many developing countries, whileleading to more integrated supply chains serviced by fewer producers. Thequest for efficiency and cost reduction has encouraged investments in newtechnologies and joint ventures with marketing intermediaries and producerassociations able to meet big volumes and high private standards.
In a food industry driven by consumers’ retail pull, food manufacturers haveto continuously reorient themselves to remain competitive. Firms thatrespond to market signals are better able to adjust and maintain their posi-tions in the industry. Flexible organizational structures that enable firms tomake adjustments at various stages of the production process in response toconsumer demand are better suited for the current industry. Such a businessstructure is possible if firms operate in close coordination with producersand other sectors of the supply chain.
Expansion in foreign markets is contributing to the growth of large multina-tional food manufacturers. But, although significant concentration may existin certain individual product markets at the local level, at the global level,even the largest food company accounts for less than 3 percent of totalworld food sales. The diversity of consumer demand creates opportunitiesfor smaller firms to successfully compete in the marketplace.
vNew Directions in Global Food Markets / AIB-794
Economic Research Service/USDA

Understanding the performance and dynamics of global food markets is nolonger a matter of understanding the fundamentals of international trade. At$3.2 trillion, processed food sales are a major component of global foodmarkets and account for about three-fourths of the total world food sales.Still, only 10 percent of processed food sales are traded products (fig. 1).Although consumer demand for processed foods continues to grow globally,growth in processed food trade has generally stalled since the mid-1990s.While trade policy may contribute to this disparity between trade levels andmarket performance, competition in the global food industry is also influ-enced by many other factors.
Understanding the competitive nature of the global food industry means under-standing changing consumer preferences and the food industry’s efforts to meetthese demands. The task of moving food from the farm to the table isbecoming increasingly complex, involving diverse local, national, and globalagents and networks. Food markets are constantly evolving, driven not only bychanges in consumer preferences, but also by technology, linkages betweenmembers of the food supply chain, and prevailing policies and business envi-ronments. Sophisticated supply chains and distribution channels are now beingadopted across different regions and national boundaries.
The ongoing changes and innovations in global food markets, as well as thetrends in different sectors of the food industry, make up a complex puzzlewith consumers, producers, and global retailing and manufacturing firmsrepresenting the many pieces. A growing trend in food markets is the shift
1New Directions in Global Food Markets / AIB-794
Economic Research Service/USDA
New Direction in Global Food Markets
Introduction
Figure 1
Only 10 percent of $3.2 trillion global processed food sales are traded products, 2002
Source: Trade data from U.N. Comtrade, 2002. Global commerce in processed food is approximated from Euromonitor.
Nontraded–90%
U.S. exports–1%
U.S. imports–1%
Rest of world–5%
Traded–10%
Intra-EU–3%

in growth of food sales from high-income (developed) countries to lowerincome (developing) countries. Despite the shift, per capita commercialsales show wide regional disparities worldwide, though growth in food salesin the developing countries is expected to continue in the coming decade. Inanticipation of this growing market, food firms appear to be repositioningthemselves and investing in many developing countries.
Supply chains are the mechanisms for transmitting signals from consumersto food manufacturers, as well as delivering products from the farm to theconsumer’s table. The major components of a supply chain are input supply,production, processing or manufacturing, and retailing. In response toconsumer demands, suppliers can choose to add value and market productsthat meet specific needs. Additional value can be added at any of the fourpoints in the supply chain prior to reaching the consumer. In the evolvingglobal food economy, signaling the additional value (quality) of the newproduct is as important as developing the product.
Modern technology, such as point-of-sale scanners, provides retailers withfirst-hand information regarding consumer food preferences, positioningretailers to interpret and transmit changing consumer demands. However, foodretailing is a service industry and does not generally engage in the design andmanufacture of new products. Rather, the development of specific productsdesired by consumers requires coordinated efforts and cooperation among allsegments of the supply chain. Degrees of coordination and cooperation amongthe different elements of the supply chain are more pronounced in developedcountries, particularly in the European market, which may serve as a modelfor many markets in high-income countries.
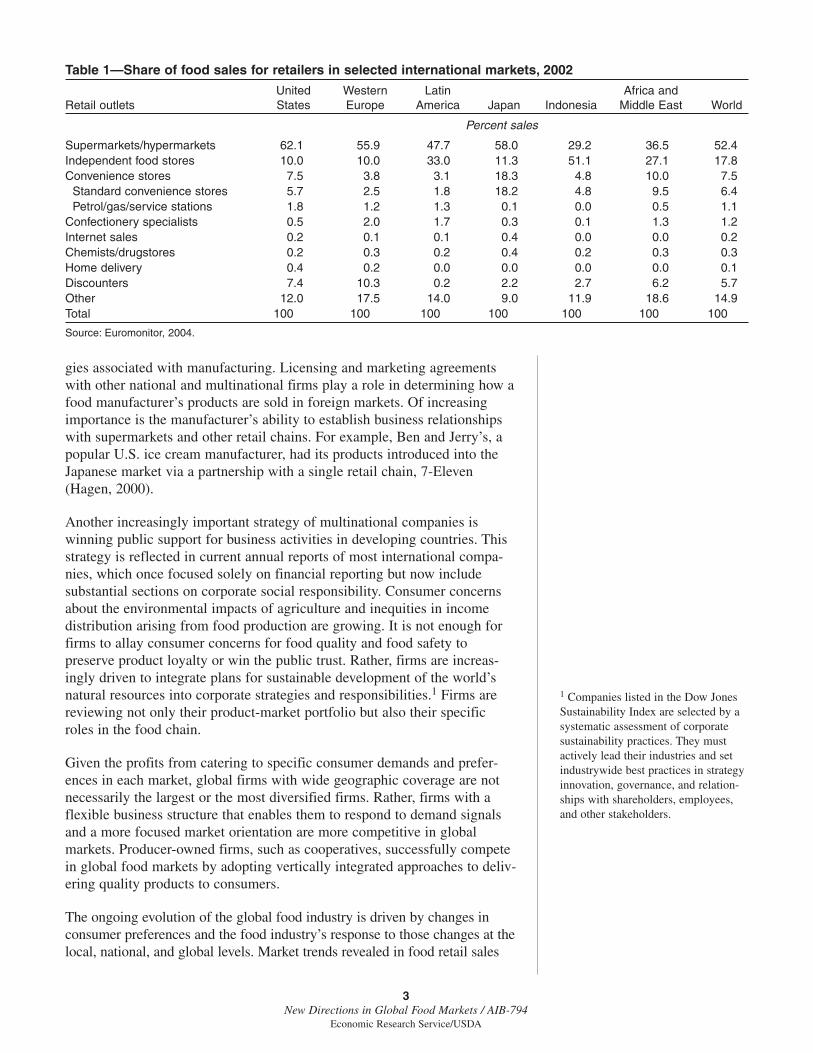
Food distribution/retailing channels differ across regions in the world.Consumer shopping habits, income levels, and lifestyles all influence howthe food retail sector is configured in different countries. However, liberal-ized trade and globally focused commodity and financial markets have initi-ated the move toward convergence of the world food retail structure, asevidenced by the growing presence of supermarkets and hypermarketsacross the globe, often with multinational chains operating across manycountries. In developed countries, a large share of retail food is sold throughsupermarkets/hypermarkets. The United States has the largest share, at 62percent (table 1). Despite developed countries having similarly large sharesof supermarket sales, cultural and lifestyle differences influence the struc-ture of retail outlets in specific developed-country markets. For example,consumer demand for convenience and efficiency in Japan accounts for therelatively high share of food sold through convenience stores and petro-gasoutlets, 18 percent, which is much higher than shares in other developedcountries. In developing countries, where supermarkets/hypermarkets arenewly establishing, independent stores and traditional markets still accountfor very large shares of total retail sales, as shown by the growing presenceof large multinational food retail firms in Latin America and Asia.
The reorientation of global food markets has prompted food manufacturersto adopt more focused growth strategies to maintain leadership positions inspecific sectors. Food manufacturers compete in the retail sector bymarketing and promoting their own products. It is increasingly common forprivate firms to own trademarks, brands, formulas, and processing technolo-
2New Directions in Global Food Markets / AIB-794
Economic Research Service/USDA
gies associated with manufacturing. Licensing and marketing agreementswith other national and multinational firms play a role in determining how afood manufacturer’s products are sold in foreign markets. Of increasingimportance is the manufacturer’s ability to establish business relationshipswith supermarkets and other retail chains. For example, Ben and Jerry’s, apopular U.S. ice cream manufacturer, had its products introduced into theJapanese market via a partnership with a single retail chain, 7-Eleven(Hagen, 2000).
Another increasingly important strategy of multinational companies iswinning public support for business activities in developing countries. Thisstrategy is reflected in current annual reports of most international compa-nies, which once focused solely on financial reporting but now includesubstantial sections on corporate social responsibility. Consumer concernsabout the environmental impacts of agriculture and inequities in incomedistribution arising from food production are growing. It is not enough forfirms to allay consumer concerns for food quality and food safety topreserve product loyalty or win the public trust. Rather, firms are increas-ingly driven to integrate plans for sustainable development of the world’snatural resources into corporate strategies and responsibilities.1 Firms arereviewing not only their product-market portfolio but also their specificroles in the food chain.
Given the profits from catering to specific consumer demands and prefer-ences in each market, global firms with wide geographic coverage are notnecessarily the largest or the most diversified firms. Rather, firms with aflexible business structure that enables them to respond to demand signalsand a more focused market orientation are more competitive in globalmarkets. Producer-owned firms, such as cooperatives, successfully competein global food markets by adopting vertically integrated approaches to deliv-ering quality products to consumers.
The ongoing evolution of the global food industry is driven by changes inconsumer preferences and the food industry’s response to those changes at thelocal, national, and global levels. Market trends revealed in food retail sales
3New Directions in Global Food Markets / AIB-794
Economic Research Service/USDA
Table 1—Share of food sales for retailers in selected international markets, 2002
United Western Latin Africa and Retail outlets States Europe America Japan Indonesia Middle East World
Percent sales
Supermarkets/hypermarkets 62.1 55.9 47.7 58.0 29.2 36.5 52.4Independent food stores 10.0 10.0 33.0 11.3 51.1 27.1 17.8Convenience stores 7.5 3.8 3.1 18.3 4.8 10.0 7.5
Standard convenience stores 5.7 2.5 1.8 18.2 4.8 9.5 6.4Petrol/gas/service stations 1.8 1.2 1.3 0.1 0.0 0.5 1.1
Confectionery specialists 0.5 2.0 1.7 0.3 0.1 1.3 1.2Internet sales 0.2 0.1 0.1 0.4 0.0 0.0 0.2Chemists/drugstores 0.2 0.3 0.2 0.4 0.2 0.3 0.3Home delivery 0.4 0.2 0.0 0.0 0.0 0.0 0.1Discounters 7.4 10.3 0.2 2.2 2.7 6.2 5.7Other 12.0 17.5 14.0 9.0 11.9 18.6 14.9Total 100 100 100 100 100 100 100
Source: Euromonitor, 2004.
1 Companies listed in the Dow JonesSustainability Index are selected by asystematic assessment of corporatesustainability practices. They mustactively lead their industries and setindustrywide best practices in strategyinnovation, governance, and relation-ships with shareholders, employees,and other stakeholders.
data pose questions regarding the long-term impact of these changes onconsumers, small businesses, and the relationship between food exports andforeign direct investment. These questions remain for future investigation.
References
Euromonitor International. 2004, http://www.euromonitor.com.
Hagen, J.M. “Educator Insights: Ben and Jerry’s-Japan: Strategic Decisionby an Emergent Global Marketer,” Journal of International Marketing,Vol. 8, No. 2, 2000, pp. 98-110.
United Nations. COMTRADE, Commodity Trade Data Base, UnitedNations Statistical Division, http://unstats.un.org/unsd/comtrade/
4New Directions in Global Food Markets / AIB-794
Economic Research Service/USDA

Consumers today are upgrading their diets to include more higher valuedproducts than in the past (Regmi, 2001; Rosegrant et al., 2001). Initially,this trend was accompanied by rapid growth in trade for high-valuefoods, fueling speculation of continued trade growth in the sector.However, contrary to conventional wisdom, global food trade patternshave shifted again and the trade share of high-value food, particularlyprocessed products, has started to decline.
Competing in the global food industry is a complex undertaking, as firmsmust continually react to the demands of wealthier and more selectiveconsumers for higher quality and more varied products. Markets for individualfood products, however, are not becoming global. Rather, consumer demandfor food products varies based on income and regional cultural preferences.Successful local, regional, and global firms supplying foods to these diversemarkets employ increasingly sophisticated technologies and business practicesto customize food products to meet local tastes and preferences.
Size and Changing Shape of the GlobalFood Market
Food is sold either through retail stores or through foodservice establish-ments, mainly hotels and restaurants. Global sales of food, including foodsold through foodservice establishments, are estimated at $4 trillion in 2002(table 1-1). Over 40 percent of the total value of global food sales iscurrently accounted for by the foodservice sector. With consumers increas-ingly demanding convenience, it is likely that the value of global foodser-vice sales will overtake global retail food sales in the future. The demandfor convenience is not limited to consumers in developed countries. In thedeveloping countries, rising demand for convenience is reflected by therapidly expanding fast food sector.2
As the food sector is not consistently defined across countries and regions,nor is food sold in the same manner, it is difficult to measure precisely theactual size of the world food market. For example, in developed countries,the foodservice sector accounts for a large and growing share of total foodsold. However, food service covers a wide variety of outlets, and reliabledata are generally hard to obtain across different countries. In developingcountries, a large share of food is traditionally sold through streetside
1 Mark Gehlhar and Anita Regmi areeconomists, Market and TradeEconomics Division, ERS/USDA.
5New Directions in Global Food Markets / AIB-794
Economic Research Service/USDA
Chapter 1
Factors Shaping Global Food Markets
Mark Gehlhar & Anita Regmi1
Modern food markets are responding to consumer preferencesat a local level, as the food industry becomes more global.
2 The World Bank defines high-incomecountries as those with year 2000 percapita Gross National Income (GNI)above $9,266; upper-middle-incomecountries as those between $2,996 and$9,266; low-middle-income countriesas those between $756 and $2,995;and low-income countries as thosebelow $756. Countries in the low- andmiddle-income groups are generallyconsidered to be developing countries.

stalls. Products sold in such markets include food prepared at vendors’homes and sold to consumers in a ready-to-eat form.
At the retail level (which excludes food service), a relatively consistentcomparison across regions is possible through the use of food sales datafrom grocery stores. However, these data fail to completely capture all foodsales, especially in the developing countries. Although supermarkets areincreasingly prevalent in developing countries, the available food sales datafrom these outlets may understate the actual size of individual developingcountry markets. Nevertheless, lacking alternative sources, this study usesretail sales data collected by a commercial vendor, Euromonitor, whichconsists of globally consistent food categories (see box on Euromonitor).
At the retail level, food can be broken down to fresh ($531 billion) andprocessed ($1.7 trillion). Processed product sales are the combined sales ofpackaged food ($1.1 trillion) and beverages ($641 billion). High-incomeregions, including European Union (EU) countries, the United States, andJapan, accounted for over 60 percent of packaged food sales in the world in2002. Packaged food accounts for about half of total food expenditures indeveloped countries but only a third or less in most developing countries(fig. 1-1). In most countries, packaged food accounts for about two-thirds ofall processed products sales, with alcoholic beverages, soft drinks and hotdrinks constituting the remaining one-third. The value of packaged foodsales varies among countries based on per capita incomes (table 1-2).
Market sizes, as indicated by the value of retail sales, are much larger inhigh-income countries, but market growth has generally been faster amongdeveloping countries (table 1-3). Among developing countries, oils and fats,dried food, and dairy products have sizable retail markets with stronggrowth trends. While smaller in terms of retail value, the breakfast cerealsmarket has skyrocketed, registering double- and triple-digit sales growth insome developing countries.
In the mature markets of high-income countries, processed food retail sales aregrowing at a slower pace than in the developing countries. Ready-to-eat mealsare one of the fastest growing sectors in developed countries, while breakfastcereals are making inroads in the nontraditional French and Singaporeanmarkets. As growth rates of ready-to-eat products have risen, growth rates in
6New Directions in Global Food Markets / AIB-794
Economic Research Service/USDA
Table 1-1—Global food sales, 2002
Retail stores Food service Total
Billion dollars
Fresh food 531 382 913Processed products 1,762 1,420 3,182
Packaged food 1,148 828 1,976Beverages 614 592 1,206
Alcoholic drinks 316 422 729Hot drinks 53 12 65Soft drinks 245 167 412
Total food 2,293 1,803 4,096
Source: Euromonitor, 2003.
7New Directions in Global Food Markets / AIB-794
Economic Research Service/USDA
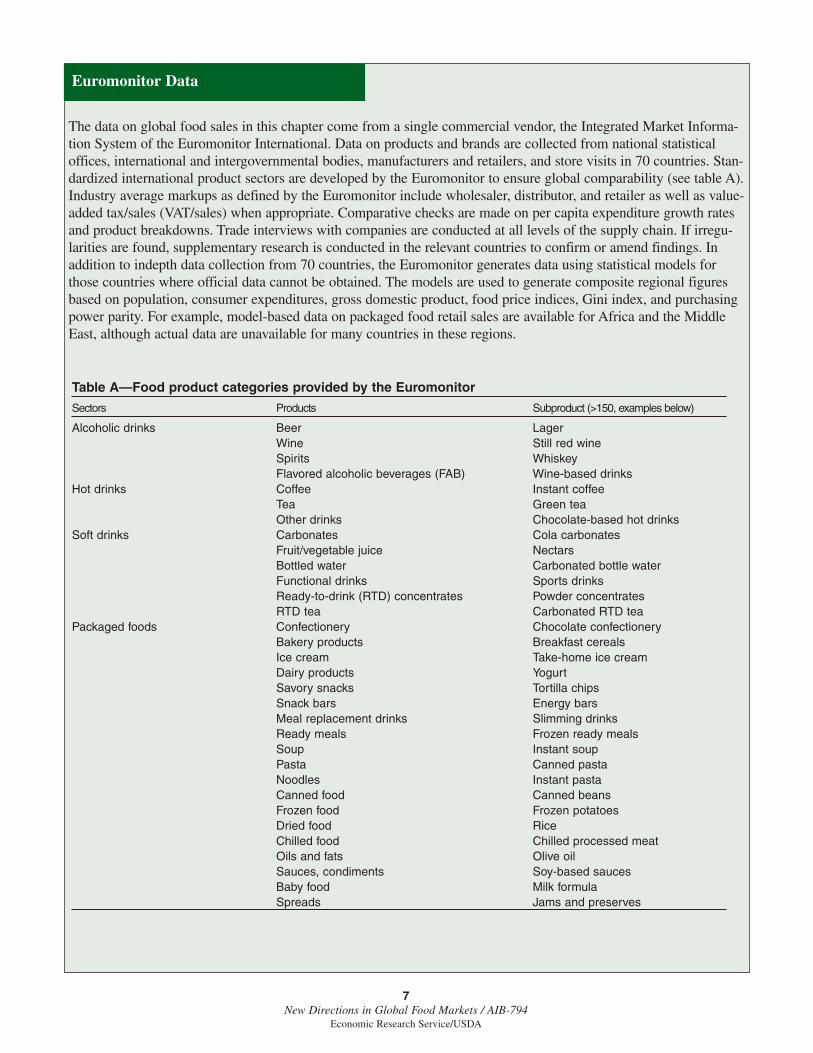
The data on global food sales in this chapter come from a single commercial vendor, the Integrated Market Informa-tion System of the Euromonitor International. Data on products and brands are collected from national statisticaloffices, international and intergovernmental bodies, manufacturers and retailers, and store visits in 70 countries. Stan-dardized international product sectors are developed by the Euromonitor to ensure global comparability (see table A).Industry average markups as defined by the Euromonitor include wholesaler, distributor, and retailer as well as value-added tax/sales (VAT/sales) when appropriate. Comparative checks are made on per capita expenditure growth ratesand product breakdowns. Trade interviews with companies are conducted at all levels of the supply chain. If irregu-larities are found, supplementary research is conducted in the relevant countries to confirm or amend findings. Inaddition to indepth data collection from 70 countries, the Euromonitor generates data using statistical models forthose countries where official data cannot be obtained. The models are used to generate composite regional figuresbased on population, consumer expenditures, gross domestic product, food price indices, Gini index, and purchasingpower parity. For example, model-based data on packaged food retail sales are available for Africa and the MiddleEast, although actual data are unavailable for many countries in these regions.
Euromonitor Data
Table A—Food product categories provided by the Euromonitor
Sectors Products Subproduct (>150, examples below)
Alcoholic drinks Beer LagerWine Still red wineSpirits WhiskeyFlavored alcoholic beverages (FAB) Wine-based drinks
Hot drinks Coffee Instant coffeeTea Green teaOther drinks Chocolate-based hot drinks
Soft drinks Carbonates Cola carbonatesFruit/vegetable juice NectarsBottled water Carbonated bottle waterFunctional drinks Sports drinksReady-to-drink (RTD) concentrates Powder concentratesRTD tea Carbonated RTD tea
Packaged foods Confectionery Chocolate confectioneryBakery products Breakfast cerealsIce cream Take-home ice creamDairy products YogurtSavory snacks Tortilla chipsSnack bars Energy barsMeal replacement drinks Slimming drinksReady meals Frozen ready mealsSoup Instant soupPasta Canned pastaNoodles Instant pastaCanned food Canned beansFrozen food Frozen potatoesDried food RiceChilled food Chilled processed meatOils and fats Olive oilSauces, condiments Soy-based saucesBaby food Milk formulaSpreads Jams and preserves

retail sales of items used in meal preparations, such as oils and fats and driedfood, have slowed or turned negative in many high-income countries.
In Eastern European countries, retail sales of processed food products grewrapidly during the 1990s.3 This growth resulted from ongoing westernizationof both consumers and food marketing sectors in the region. Multinationalcompanies and Western brand products have become increasingly visible inthese markets. At the same time, Eastern European consumers are growingmore sophisticated, with greater demand for products offering health benefitsand convenience. Czech and Hungarian consumers, in particular, haveincreased consumption of nutrient-enriched and low-fat products, such asyogurts and specialty drinks. The busy lifestyles of young professionals andentrepreneurs have accounted for increases in the demand for labor-savingbreakfast cereals, snack foods, and ready-to-eat meals. Sales of such productsas canned ready meals, frozen pizza, and dehydrated soups are high in theregion. Dried food products, particularly pasta and other noodles, have beenone of the most dynamic growth sectors in this retail market. Foreign invest-ments in private label product development have also helped drive the demandfor high-value processed foods in some Eastern European countries.
Retail food sales in Latin America and developing countries in Asia areundergoing changes similar to those in Eastern Europe. However, themarkets in such countries as China and Vietnam are at the early stages oftransformation, with smaller shares of multinational retail chains and limitedpenetration of packaged food products in the rural areas. As in EasternEurope, wealthier consumers in Latin American are purchasing more time-saving products and products associated with higher health attributes. Low-fat yogurt and lean chilled and frozen food products are becoming verypopular in Brazil, while meal replacement drinks are one of the strongest
3 Except Russia, where retail salestrends mirror those of high-incomecountries.
8New Directions in Global Food Markets / AIB-794
Economic Research Service/USDA
Figure 1-1
Food share of total expenditures declines while processed foodshare of food expenditures increases with income, 2002
Source: Euromonitor, 2003. World Bank classification of countries.
Low income Low middle income
Upper middleincome
High income0
10
20
30
40
50Percent
Note: The World Bank defines high-income countries as those with 2000 per capita Gross National Income (GNI) above $9,266; upper-middle-income countries as those with per capita GNI between $2,996 and $9,266; low-middle-income countries as those with per capita GNI between $756 and $2,995; and low-income countries as those with 2000 per capita GNI below $756. Countries in the low- and middle-income groups are generally considered to be developing countries.
Packaged
Nonpackaged

9New Directions in Global Food Markets / AIB-794
Economic Research Service/USDA
Table 1-2—Annual average growth in retail sales of packaged foods
Per capita Per capita Total retail growth Per capita growthCountry group gross national 2002 retail sales
income (2000) 1996-2002 2002-081 1996-2002 2002-081
Dollars Percent Percent
High-income >=9,266 979 3.2 1.7 2.5 1.1Upper-middle-income 2,996-9,265 298 8.1 4.0 6.7 2.8Lower-middle-income 756-2,995 143 28.8 4.4 28.1 3.8Low-income <755 63 12.9 6.1 11.9 5.3
Note: Country classifications as per the World Bank. Retail sales are sales of packaged foods.1 Retail growth projections made by Euromonitor.
Source: Euromonitor, 2003.
Table 1-3—Retail sales size and growth of selected food items
Retail sales, 2002 Average annual growth rate (1998-2003)
Market Oils & Breakfast Ready Dried Dairy Oils & Breakfast Ready Dried Dairyfats cereals meals food products fats cereals meals food products
Million dollars Percent
High-income countries:France 2,294 646 2,924 1,085 14,733 1.3 5.0 4.8 1.5 3.8Germany 2,413 711 1,986 1,969 13,798 -1.7 0.4 3.4 2.2 2.4Japan 2,731 300 11,573 22,510 18,801 -1.8 2.2 4.9 -1.5 0.9Singapore 35 17 22 139 134 2.2 10.0 3.6 3.6 4.7United Kingdom 1,997 1,999 6,172 1,215 10,239 1.1 1.0 5.9 3.5 1.8United States 4,673 9,476 17,278 9,965 46,969 -0.1 1.3 5.8 1.4 3.8
High-middle-income countries:Brazil 2,559 117 203 3,369 7,106 24.0 8.9 17.3 16.1 13.4Chile 250 48 10 217 747 1.0 10.3 4.0 -0.2 3.7Czech Republic 443 19 201 221 1,427 0.8 12.4 10.8 11.3 4.4Hungary 319 40 124 378 1,206 6.9 16.2 10.2 7.9 8.6Mexico 1,105 1,008 36 1,757 7,393 9.6 14.6 13.8 20.8 9.8South Africa 964 144 196 637 1,404 10.4 4.0 3.3 7.9 6.2South Korea 782 141 24 3,936 2,608 4.9 9.2 5.0 4.6 4.1Turkey 2,097 27 33 447 4,692 1.5 2.2 -1.1 -1.8 3.0
Low-middle-income countries:Bulgaria 142 6 4 60 348 2.9 14.5 5.0 4.4 5.1China 1,576 – 665 4,615 4,479 11.2 – 2.9 10.4 15.4Colombia 909 58 20 754 3,266 5.6 11.0 8.9 11.0 13.3Morocco 697 1 1 98 705 3.5 16.1 5.1 5.1 5.9Philippines 492 23 30 305 571 8.0 12.0 4.8 12.0 11.0Romania 270 6 3 169 652 29.4 27.8 34.6 37.3 27.3Russia 3,095 207 618 1,543 3,790 -3.6 2.5 9.3 -3.8 1.8
Low-income countries:India 1,466 16 – 437 1,245 5.5 11.7 – 10.6 9.8Indonesia 404 20 12 1,944 895 6.7 10.8 9.5 3.8 14.8Ukraine 1,177 9 33 457 651 19.6 20.7 12.5 12.6 10.4Vietnam 208 0.2 – 96 156 14.7 182.0 – 30.6 10.6
Note: – = unavailable sales data.Source: Euromonitor, 2003.
growth sectors in Colombia. Latin American consumers are also developinga taste for different ethnic foods, with pasta being the fastest growing driedpackaged product sold in the region.
Reflecting the increased demand for variety as incomes increase, thenumber of products purchased at retail outlets is greater for wealthier coun-tries. For example, the top five product categories account for 71 percent ofprocessed food retail sales for Mexico and 74 percent for India, but only 48percent for the United States and 47 percent for the United Kingdom. Inmost countries, the top five product categories are bakery, dairy, confec-tionery, carbonated drinks, and chilled foods.
As the demand for processed foods is also driven by the demand for higherquality and labor-saving products, the items consumed by countries atdifferent income levels reflect different levels of demand for servicesembodied in the products. For example, ready-to-eat meals account forabout 4 percent of total retail sales in the United States and the UnitedKingdom, but only 0.06 percent in Mexico, 0.55 percent in China, and 0percent in India. On the other hand, intermediate products, such as fats andoils, while accounting for over 7 percent of total processed food retail salesin India, 13 percent in Indonesia, and 5 or more percent in many developingcountries, account for less than 2 percent of retail sales in high-incomecountries (0.79 percent in the United States).
Trends in the soft drink and beverage sector are often an indicator of theability of consumers to purchase higher value foods. For example, growingaffluence in the developing countries is associated with greater expenditureson soft drinks, which, in turn, indicates increased consumer ability topurchase processed foods. In fact, foreign direct investments (FDI) in thebeverage sector often function as a bellwether in the local food industry(Bolling, 2002). The global market for soft drinks is rapidly expanding, withlarge growth in sales in Eastern Europe and Asia (table 1-4). Growth in softdrink sales is particularly high in East Asia, with markets expanding at ratesranging from almost 12 percent (Philippines) to 22 percent (Indonesia) annu-ally. The soft drink markets in developed countries, however, are sluggish,with average annual growth rates for all soft drinks ranging from 3 percent inGermany to about 5 percent in Singapore. The growth in sales of carbonateddrinks is considerably lower in all developed country markets, where manyconsumers seek more healthful alternatives to carbonated drinks, with annualgrowth rates at or below 3 percent, and negative for Singapore. Sales growthdata for soft drinks offer a picture of future growth for processed food sales.
Although high-income countries account for over 60 percent of totalprocessed food retail sales, they are essentially mature markets with limitedfuture growth potential in this sector. In developed countries, growth in foodconsumption is expected to arise mainly from slow rates of population growthrather than from increases in per capita consumption. Developing countries,on the other hand, are expected to account for most future increases in fooddemand, resulting from both increases in population as well as increases inper capita food consumption. Diet upgrades made possible by income growthare expected to double the quantity of meat demanded by consumers in devel-oping countries by the year 2020, as well as increase the demand for otherhigh-value food products (Rosegrant et al., 2001).
10New Directions in Global Food Markets / AIB-794
Economic Research Service/USDA

While retail sales of packaged foods have grown at about 2-3 percent annu-ally in high-income countries, they have grown much faster among devel-oping countries, ranging from 7 percent in upper-middle-income countriesto 28 percent in lower-middle-income countries. The dramatic growthamong middle-income countries is partly due to tremendous growth in salesamong Eastern European countries, such as Romania, Poland, and Hungary.With sales in these countries nearing their peak potential, future growth inpackaged food retail sales among developing countries is expected to bemuch slower, but will continue to exceed the rates for high-income coun-tries. As with retail sales in the soft drink and beverage sectors, a slowdownin sales of packaged foods in Eastern Europe is expected to be offset bygrowth in sales in East Asia. China, Thailand, the Philippines, Indonesia,Vietnam, and India are expected to be some of the fastest growing marketsfor packaged food retail sales in the next 5 years.
Based on per capita income levels, retail sales of different food productsvary across countries, with greater sales in higher value-added productsoccurring in wealthier countries. In fact, high-income countries currently
11New Directions in Global Food Markets / AIB-794
Economic Research Service/USDA
Table 1-4—Retail sales of soft drinks
1997-2002 an. avg. growth
Market 2002 Share of All Carbonatedsales carbonated drinks soft drinks drinks
Million liters —————— Percent ——————
High-income countries:France 12,755 17.4 4.4 2.4Germany 18,920 31.2 2.4 2.9Japan 16,885 16.3 4.5 1.0Singapore 448 41.2 4.9 -0.9United Kingdom 10,031 57.3 3.6 1.9United States 91,286 66.0 3.1 1.4
High-middle-income countries:Brazil 16,630 71.8 5.9 2.5Chile 1,762 85.2 2.4 1.9Czech Republic 2,524 33.3 10.7 8.0Hungary 1,561 44.1 7.0 1.6Mexico 34,874 46.0 8.6 4.1South Africa 2,938 80.1 6.8 6.2South Korea 3,737 33.4 5.7 3.8Turkey 7,508 32.2 6.7 5.2
Low-middle-income countries:Bulgaria 774 52.3 14.3 10.4China 22,952 27.4 15.9 8.8Colombia 3,484 76.0 -0.1 3.3Morocco 961 38.6 3.5 2.8Philippines 4,998 64.2 12.0 8.4Romania 1,561 41.8 13.5 9.9Russia 5,010 47.6 7.9 2.7
Low-income countries:India 3,272 60.3 13.9 7.9Indonesia 9,017 8.9 21.7 7.8Ukraine 1,378 47.7 7.9 6.0Vietnam 539 58.4 4.8 -1.8
Source: Euromonitor, 2003.
account for most global retail sales of processed foods. However, these largemarkets offer little potential for future growth in this sector. On the otherhand, markets for processed foods and beverages are rapidly expanding indeveloping countries.
The Changing Consumer
A primary driving force in the global food market is the consumer. Incomegrowth, lifestyle changes brought about by urbanization, and changingfamily structures have resulted in diet changes among consumers world-wide. Because of either increases in purchasing power or the increasedopportunity cost of time required for preparing food, the demand for highervalue and processed food products has expanded globally. Consumers indeveloping countries, whose diets have traditionally been high in low-value,carbohydrate-rich cereals, have increased their consumption of higher valuemeats, fruits, and vegetables. Similarly, consumers in wealthier countries areincreasingly moving their diets toward relatively higher value foods,although the higher value reflects not increases in quantity and nutrientvalue of the food basket but the value-added service embodied in the prod-ucts, which reduces time required to prepare the foods for consumption.
Although consumers with higher income levels spend more money on food,the food share of total household expenditures is low for wealthierconsumers, who typically spend a larger share of their incomes on moreexpensive items, such as health care, energy, and recreation (Seale, Regmi,and Bernstein, 2003). During the last decade, consumers in high-incomecountries spent an average of 13 percent of their total household expendi-tures on food while consumers in low-income countries spent an average of43 percent (fig. 1-1).4 In 2002, these shares ranged from a high of 55percent of total household expenditures in Indonesia, to 7 percent in theUnited States. Over half of total food expenditures in high-income countriesare attributable to packaged food products. In developing countries, pack-aged foods account for a smaller share of the total food budget. The averageshare in low-income countries is 14 percent.
The increased share of high-value food expenditures in total food expendituresreflects not only consumers’ increased purchasing power but also lifestylechanges brought about by the increased prevalence of household amenities. Forexample, increases in acquisitions of refrigerators may lead to greater house-hold purchases of perishable food products, while increases in ownership ofmicrowave ovens may lead to increased purchases of ready-to-eat foods thatrequire minimal preparation. Ownership of refrigerators has risen significantlyin most developing countries over the last decade (table 1-5).
Microwave oven ownership in high-income and high-middle-income coun-tries increased significantly during the last decade. Over 90 percent ofhouseholds in Japan now possess microwave ovens, compared with about 76percent a decade ago, while over 85 percent of U.S. households possessmicrowave ovens, compared with less than 80 percent in 1990. In lowerincome countries, such as Bulgaria, Brazil, Indonesia, and Mexico, thenumber of households possessing microwave ovens is small but growing(table 1-6). Increased ownership of microwave ovens is likely to increase
4 Food expenditure data excludeexpenses on food consumed awayfrom home.
12New Directions in Global Food Markets / AIB-794
Economic Research Service/USDA

purchases and consumption of prepared foods. Retail sales of ready mealshave increased among some developing countries, with dramatic rates ofgrowth in many middle-income countries in Eastern Europe and LatinAmerica. In developing Asia, total value of retail sales of prepared meals isrelatively small, and annual growth in sales suffered in the late 1990s due tothe Asian financial crisis. Given the region’s financial recovery, ready mealsales are picking up and have registered healthy growth rates between 1998and 2002.
The eating habits among countries at different income levels illustrate thetrend to upgrade diets as incomes grow. As incomes rise, consumers increas-ingly substitute products embodying higher levels of value-added service intotheir diet. For example, in 2000, total per capita consumption in Vietnam was
13New Directions in Global Food Markets / AIB-794
Economic Research Service/USDA
Table 1-5—Refrigerator possession per 100 households
1990 1995 2000 2002
Number
China 1 4 6 6India 5 9 12 13Vietnam 9 14 17 18Indonesia 13 20 24 26Philippines 22 31 38 41Morocco 27 34 41 44Egypt 47 56 69 70Romania 59 66 74 76Brazil 62 75 82 83
Source: Euromonitor, 2003.
Table 1-6—Ownership of microwave ovens and retail sales of ready meals
Ownership of microwave ovens Ready meal sales
An. av. growth An. av. growth 2002 1998-2002 1998-2002
No. per 100 households ————— Percent —————
Brazil 5 7 17Bulgaria 9 23 5Chile 9 6 4Colombia 8 4 9Czech Republic 36 8 11Hungary 47 9 10Indonesia 1 6 10Japan 91 0 5Malaysia 65 1 2Mexico 22 7 14Morocco 0 3 5Russia 4 9 9Singapore 53 6 4South Africa 6 5 3Thailand 3 3 4United Kingdom 87 3 6United States 85 0 6
Source: Euromonitor, 2003.

about 1,200 calories less per day than in the United States (table 1-7).5
However, cereals, which require greater food preparation time, accounted forabout 70 percent of the total calories consumed by the average consumer inVietnam. In contrast, cereals accounted for about 22 percent of the total calo-ries consumed in the United States. Although cereals accounted for a smallershare of total calories in the United States, per capita expenditures on cerealswere higher in the United States ($274 per capita in 2000) than in Vietnam($15 in 2000). The higher expenditures incurred by U.S. consumers reflect theadditional value added embodied in the cereal products.
Changes in expenditures on different food items over time (reflectingincome growth over time) relative to calorie consumption may also capturethe additional premium paid for food quality, preparation, and processingembodied in the product. Between 1996 and 2000, total available caloriesper capita in the United States increased 4 percent; however, per capita foodexpenditures increased over 13 percent. The most dramatic change in theUnited States is noted for dairy and eggs, which increased 3 percent in percapita calories but 15 percent in expenditures. Similarly, across all countries,expenditures on food products have generally grown much faster than percapita calorie supplies. This increase in expenditures may reflect theincreased demand for value added in food products.
Varied Strategies To Meet GrowingDemand in Emerging Markets
Food retailers and manufacturers are adjusting to specific needs in individualmarkets.6 In the developing country markets, changes are primarily driven byincreased demand for different food products. Although Europe remains a
5 Per capita calorie consumption fig-ures are based on FAO’s per capitacalorie availability estimates calculatedfrom the per capita food supply in acountry. Note that these figures repre-sent an upper bound since total foodsupply in a country is generally higherthan the total food consumed.
6 For more information, see chapters2-4.
14New Directions in Global Food Markets / AIB-794
Economic Research Service/USDA
Table 1-7—Expenditures share and calorie contribution of different food products
Fruits & Dairy & Fruits & Dairy &Countries Total Cereals vegetables Meat eggs Seafood Total Cereals vegetables Meat eggs Seafood
1996 per capita calorie supply 2000 per capita calorie supply
Developed 3,203 1,020 163 342 326 46 3,260 1,006 173 342 766 45Developing 2,644 1,494 124 156 100 22 2,679 1,453 135 182 102 23
United States 3,616 639 196 427 431 28 3,772 848 209 446 445 30EU 3,401 838 208 431 362 42 3,487 864 218 441 365 44Brazil 2,868 897 132 299 223 12 2,985 901 123 337 218 10China 2,941 1,736 145 325 76 31 3,029 1,646 176 411 84 35India 2,446 1,549 81 22 114 9 2,428 1,455 93 22 118 8Philippines 2,360 1,203 188 166 50 71 2,379 1,231 181 188 52 63Vietnam 2,508 1,826 98 168 13 33 2,583 1,796 106 203 15 35
1996 per capita expenditures (dollars) 2000 per capita expenditures (dollars)
United States 1,543 247 179 307 176 77 1,745 274 202 337 202 89EU 1,261 204 190 302 170 30 1,440 229 220 341 194 41Brazil 233 34 22 47 37 3 363 46 37 75 64 5China 129 26 30 35 9 11 136 21 35 37 11 14India 87 23 24 2 15 4 129 28 39 3 22 7Philippines 185 63 19 31 16 31 233 71 26 37 21 42Vietnam 48 12 12 8 4 3 61 15 15 10 5 4
Source: Calorie supply from Food and Agriculture Organization of the United Nations (FAO), and food expenditures from Euromonitor.

growing food market, it has noticeably lagged behind other regions in retailfood sales growth. Nestlé, the world’s largest food company, had 37 percentof its total sales in Europe in 1998 but only 32 percent in 2002, with overallEuropean sales growing only 7 percent during the period (table 1-8). In othercountries, Nestlé’s sales grew more rapidly. For example, sales in the Amer-icas grew nearly 30 percent between 1998 and 2002. Similarly, Unileverachieved a mere 3-percent growth in its European market during 1998-2002, amuch slower growth rate than the company’s 19-percent global average overthe period. Europe accounted for 47 percent of total Unilever sales in 1998but only 40 percent in 2002. Markets outside Europe expanded at faster rates.Population, demographics, and economic growth have all contributed toincreased sales in the developing country markets, where food firms continu-ously seek new strategies for expansion.
Food companies have several options for selling in the developing-countrymarkets. Exporting high-value food products remains an option, but most foodcompany sales are generated by investing abroad and processing food inforeign markets. The choice of mode of sale depends on the type of productssold, and is generally based on product characteristics that determine aproduct’s suitability for trade or for FDI. Most food sold in retail outlets can beconsidered as either commodity based or manufactured. Commodity-basedproducts are those that are identifiable with a specific commodity, such asmeat, fruits and vegetables, fish, milk, or sugar, and are typically sold undergeneric labels. A manufactured product undergoes substantial transformationduring manufacturing and includes multiple commodities as ingredients. Forexample, breakfast cereals or bakery products are manufactured from a widevariety of ingredients, such as milled grain, flours, oils, sugar, fruit, nuts, dairy,and eggs. Manufactured products are processed into consumer-ready packagescarrying company brands, which differentiate products in the marketplace.
Commodity-based products are less suited for FDI because production islimited by specific growing conditions. Commodity-based products aregenerally processed close to the location of primary production. Once
15New Directions in Global Food Markets / AIB-794
Economic Research Service/USDA
Table 1-8—Sales growth for leading companies
Sales growthCompany 1998 2002 1998-2002
Billion dollars Percent
Nestlé:Europe 15.9 17.0 7.0Americas 13.4 17.3 29.8Asia, Oceania, and Africa 7.4 8.8 19.7Other (not specified) 5.9 9.7 63.8
Total 42.5 52.8 24.3
Unilever:Europe 11.2 11.6 3.2North America 5.0 7.4 47.9Africa, Middle East, and Turkey 1.3 1.9 40.9Asia and Pacific 3.4 4.5 32.3Latin America 3.0 3.2 8.3
Total 23.9 28.6 19.4
Source: Euromonitor, compiled from company reports.Sales data converted from local currency to U.S. dollars using fixed exchange rate for year 2000.
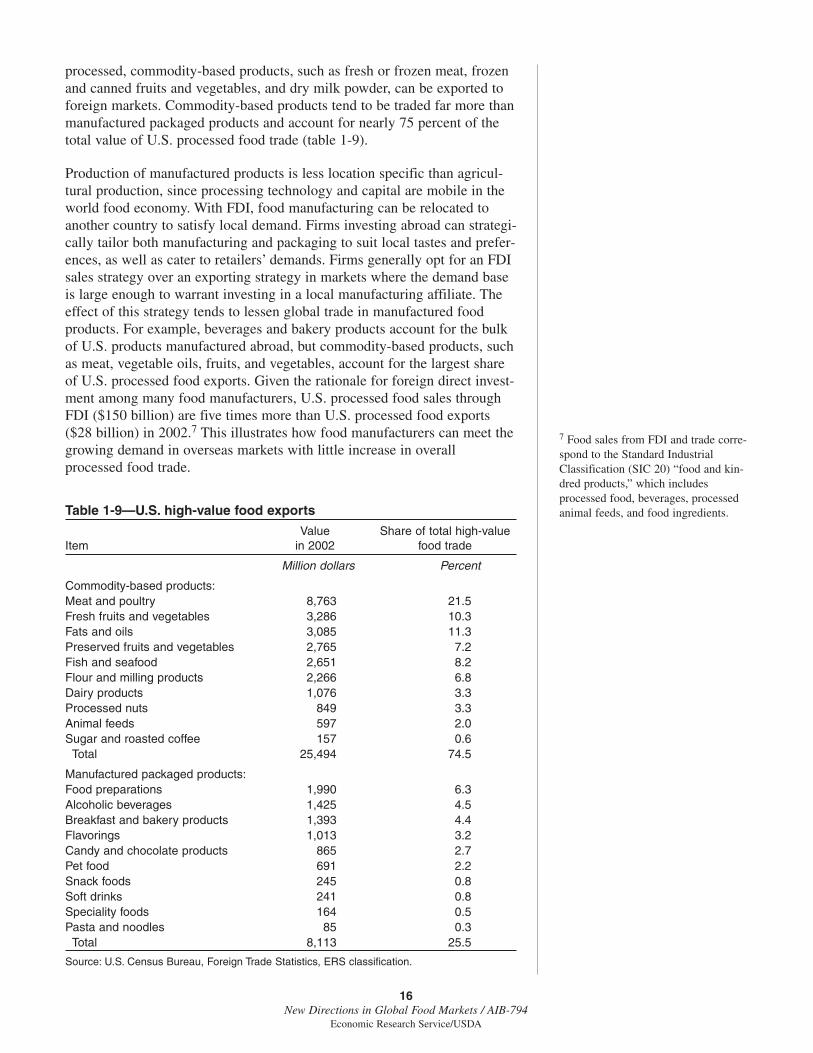
processed, commodity-based products, such as fresh or frozen meat, frozenand canned fruits and vegetables, and dry milk powder, can be exported toforeign markets. Commodity-based products tend to be traded far more thanmanufactured packaged products and account for nearly 75 percent of thetotal value of U.S. processed food trade (table 1-9).
Production of manufactured products is less location specific than agricul-tural production, since processing technology and capital are mobile in theworld food economy. With FDI, food manufacturing can be relocated toanother country to satisfy local demand. Firms investing abroad can strategi-cally tailor both manufacturing and packaging to suit local tastes and prefer-ences, as well as cater to retailers’ demands. Firms generally opt for an FDIsales strategy over an exporting strategy in markets where the demand baseis large enough to warrant investing in a local manufacturing affiliate. Theeffect of this strategy tends to lessen global trade in manufactured foodproducts. For example, beverages and bakery products account for the bulkof U.S. products manufactured abroad, but commodity-based products, suchas meat, vegetable oils, fruits, and vegetables, account for the largest shareof U.S. processed food exports. Given the rationale for foreign direct invest-ment among many food manufacturers, U.S. processed food sales throughFDI ($150 billion) are five times more than U.S. processed food exports($28 billion) in 2002.7 This illustrates how food manufacturers can meet thegrowing demand in overseas markets with little increase in overallprocessed food trade.
7 Food sales from FDI and trade corre-spond to the Standard IndustrialClassification (SIC 20) “food and kin-dred products,” which includesprocessed food, beverages, processedanimal feeds, and food ingredients.
16New Directions in Global Food Markets / AIB-794
Economic Research Service/USDA
Table 1-9—U.S. high-value food exports
Value Share of total high-value Item in 2002 food trade
Million dollars Percent
Commodity-based products:Meat and poultry 8,763 21.5Fresh fruits and vegetables 3,286 10.3Fats and oils 3,085 11.3Preserved fruits and vegetables 2,765 7.2Fish and seafood 2,651 8.2Flour and milling products 2,266 6.8Dairy products 1,076 3.3Processed nuts 849 3.3Animal feeds 597 2.0Sugar and roasted coffee 157 0.6
Total 25,494 74.5
Manufactured packaged products:Food preparations 1,990 6.3Alcoholic beverages 1,425 4.5Breakfast and bakery products 1,393 4.4Flavorings 1,013 3.2Candy and chocolate products 865 2.7Pet food 691 2.2Snack foods 245 0.8Soft drinks 241 0.8Speciality foods 164 0.5Pasta and noodles 85 0.3
Total 8,113 25.5
Source: U.S. Census Bureau, Foreign Trade Statistics, ERS classification.

Looking Ahead
While the United States, the European Union, and Japan currently accountfor about two-thirds of global processed food sales, developing countriesaccount for over three-fourths of total global food consumers. Given thegrowth in demand and projected food sales in developing countries, multi-national food retailers and manufacturers are expected to increasingly focuson those markets. Data on retail sales across regions and FDI in theprocessed food sector tend to support the hypothesis that a global marketmay exist only for limited food products. Food preferences vary based onincome and geographic location. Moreover, processed food products tend tobe manufactured locally, which allows manufacturers to prepare andpackage products to suit local preferences and values. Therefore, while thefood industry becomes more global, with retail chains and multinationalmanufacturers operating across many countries, growth in food trade maynot keep pace with growth in global food demand.
References
Bolling, Chris. “Globalization of the Soft Drink Industry,” AgriculturalOutlook, No. 297, December 2002, pp. 25-27.
Euromonitor International. 2003, http://www.euromonitor.com.
Food and Agriculture Organization of the United Nations (FAO). Statisticaldatabase, www.fao.org
Hentzepeter, V. “Corporate Responsibility: Reporting Beyond Financials,”Elsevier Food International, No. 4, November 2003, pp. 34-38.
Regmi, Anita (ed.). Changing Structure of Global Food Demand and Trade,Agriculture and Trade Report WRS-01-1, U.S. Department ofAgriculture, Economic Research Service, May 2001.
Reardon, T., and J.A. Berdegue. “The Rapid Rise of Supermarkets in LatinAmerica: Challenges and Opportunities for Development” DevelopmentPolicy Review, 2002, 20(4):317-334.
Rosegrant, M., M. Paiser, S. Meijer, and J. Witcover. Global FoodProjections to 2020, 2020 Vision Series, International Food PolicyResearch Institute, 2001.
SAI, www.saiplatform.org, accessed April 2003.
Seale, James, Jr., A. Regmi, and J. Bernstein. International Evidence onFood Consumption Patterns, Technical Bulletin 1904, U.S. Department ofAgriculture, Economic Research Service, October 2003.
U.S. Census Bureau. Foreign Trade Statistics, http://www.census.gov/for-eign-trade/statistics/index.html
U.S. Department of Agriculture. USDA Agricultural Baseline Projections to2011, February 2002.
17New Directions in Global Food Markets / AIB-794
Economic Research Service/USDA

High-value food products have unique characteristics that differentiate themfrom other food products. These characteristics may be related to sensoryattributes, nutritional content, health claims, food safety guarantees, origin,production and processing practices, and/or convenience. High-valuefoods—which include semiprocessed, processed, and other packaged foodproducts—have long been an important part of agricultural trade in local,regional, and interregional markets. For example, the ancient Greeks tradedolive oil and wine throughout the Mediterranean Basin, and trade in spicesand seasonings was the basis for early commercial and cultural linkagesbetween Europe and East Asia. High-value foods constitute a major share oftotal agricultural trade in the contemporary world economy. That share hasincreased significantly in recent years—from 31 percent in 1975 to 69percent in 2000 for the United States, and globally from 73 to 87 percentover the same period (FAO, 2002).
Suppliers of high-value food—farmers, manufacturers, or retailers—facechallenges in creating and preserving the unique characteristics of theirproducts and conveying information about those characteristics toconsumers. Often, suppliers must rely on numerous members of the foodsupply chain, such as farmers, for raw products and key services requiredfor production, and they must work through downstream market intermedi-aries, such as processors and distributors, as their products move toconsumers. This configuration of food chain members complicates informa-tion sharing and the coordination of activities, product monitoring andquality assurance, and the provision of incentives to supply chain membersto ensure equitable and efficient allocation of costs and returns. It alsomakes it more difficult to convey information about product attributes, espe-cially the increasing number of attributes that cannot be observed or inde-pendently verified before or after purchase and consumption (known ascredence goods). The diverse solutions developed to address these problemsare helping to shape the evolving global food market, influencing patterns ofproduction, distribution of revenues and costs, product innovation, productavailability, and economic development.
1 Robert P. King is Professor,Department of Applied Economics,University of Minnesota; and LucianoVenturini is Professor, Istituto diEconomia Agro-Alimentare,Università Cattolica del Sacro Cuore,Piacenza, Italy.
18New Directions in Global Food Markets / AIB-794
Economic Research Service/USDA
Chapter 2
Demand for Quality DrivesChanges in Food
Supply ChainsRobert P. King and Luciano Venturini1
Production and marketing of a differentiated product, in responseto consumer demand, requires adjustments in the traditional foodsupply chain to preserve the product’s identity and provide qualityassurance to consumers.

The problems faced by food suppliers are not new, but recent research onsupply chain design and management puts them in a new light. Writing aboutquality assurance in food supply chains, Venturini and King (2002, p. 58)define a supply chain as “... a linked set of value creating activities encom-passing product design, input procurement, primary production and processing,marketing, distribution, and service.” Supply chain thinking encourages asystemwide view of the chain—focusing as much on the linkages betweentechnologically separable segments as on the management of processes withinthose segments. This perspective is valuable for chain participants as they plansupply chain designs and make management decisions to further the growth ofand benefits from expanding markets in high-value food.
Key Elements of High-Value Food Supply Chains
Supply chains for high-value foods are complex and product specific. Thegeneric supply chain represented in figure 2-1 is highly simplified, but itcaptures key features that are useful for describing and comparing supplychains for different products.
This chain has five technologically separable processes: input supply,primary production, processing/manufacturing, wholesale/retail distribution,and consumption. Of course, not all five segments are relevant for everysupply chain, and in many cases these processes can be further divided intoseparable subprocesses. The configuration of ownership and control oversupply chain segments is one important dimension of supply chain design.Coordination between two processes is often simpler when both arecontrolled by the same firm or when the relationship between distinct firmsis governed by long-term contracts.
There are three major types of flows through the supply chain: product,financial, and information. The first, physical product flows, are unidirec-
19New Directions in Global Food Markets / AIB-794
Economic Research Service/USDA
Figure 2-1
Key elements of a high-value food supply chain
Source: King and Venturini.
Institutions
Infrastructure
Information flows
Product flows
Financial flows
Input supply Primaryproduction
Processing/Manufacturing
Wholesale/ Retail
distributionConsumption
tional in most cases, starting with input supply and ending with consump-tion. In some chains, return flows of defective products and backhauls ofshipping containers can also be significant. Financial resources flows tend tomove in the opposite direction of product flows, with payments going toupstream suppliers as products move downstream toward consumers. Insome cases, however, suppliers who retain ownership of their products asthey move through the supply chain may pay fees to downstream firms forproduction, processing, or distribution services. Information flows move inboth directions throughout the supply chain. From any point in the chain,suppliers convey information about product attributes and availability todownstream customers, while receiving information about product demand,product inventories in downstream segments, and consumer reactions toproduct attributes.
Supply chains operate in a broad environment that is characterized by infra-structure and institutions. Infrastructure includes transportation and telecom-munication systems, multipurpose technologies for packaging and productpreservation, third-party providers of logistics and information system serv-ices, organizations, such as universities, that create and transfer knowledge,and mass media that reach consumers with advertising messages. Marketsand exchanges are also an important component of supply chain infrastruc-ture. Internet-based business-to-business exchanges are transforming tradingpractices in segments of food supply chains that are far removed from thetransactions supported by traditional commodity exchanges.
Supply chain institutions dictate the “rules of the game,” circumscribing theallowable actions of supply chain participants. These institutions may beestablished through international organizations, national or local govern-ments, or nongovernmental organizations, such as trade associations. Theyestablish laws and regulations that govern commercial practices, food safetyand product quality, trade, labor practices, and intellectual property. Theyalso establish industry standards associated with supply chain featuresranging from product packaging and contract provisions to electronic datainterchange and funds transfer.
Infrastructure quality and institutions can have far-reaching impacts on supplychain design for high-value products, and cross-country differences can signif-icantly affect supply chain configuration and the geographical scope ofproduct distribution. For example, suppliers of branded food products maychoose not to enter markets where infrastructure to support advertising islacking and legal institutions that protect brand trademarks are weak.
Finally, there are many possible dimensions for assessing the performanceof high-value food supply chains. However, the following are of criticalimportance to both supply chain participants and society:
● Systemwide efficiency of resource use
● Equitable distribution of costs and returns
● Food safety and quality
● Adaptability and innovation
20New Directions in Global Food Markets / AIB-794
Economic Research Service/USDA

The supply chain design process focuses on the configuration of technologi-cally separable processes and the linkages between them; flows of products,financial resources, and information; and investments in infrastructure andinstitutions. It is iterative and often contentious, but the ultimate aim is tomake progress in these four dimensions.
Influence of Locus of Value Creation on Supply Chain Design
Value can be created in any segment of a high-value food supply chain. Forexample, many food products are distinguished by their place of origin orby unique sensory attributes associated with production practices. Similarly,branded food and beverage products, a growing component of the worldmarket in high-value foods, usually derive their value from processing,packaging, and marketing activities based in the processing/manufacturingsegment of the supply chain. Restaurants operating in the wholesale/retaildistribution segment of the chain are the primary creators of value in fastfood supply chains. Input suppliers are the primary source of value insupply chains for new products with unique nutrition or health attributesbased on genetic characteristics of food product ingredients. Therefore, asillustrated by the following four examples of high-value food supply chains,the locus of value creation often determines the supply chain design.2
Value Created in Primary Production:Label Rouge Poultry Example3
The French Label Rouge system is a national food quality assuranceprogram for products of artisanal farming with a well-defined geographicalorigin. Label Rouge poultry products have been available since 1965, andthey currently account for a significant share of the poultry purchased byFrench households. They are recognized for their taste, appearance, safetyand wholesomeness, and the environmentally friendly practices used inproducing them. As such, the primary production segment of the supplychain is especially critical in creating high value.
Label Rouge poultry products are produced by filière, farmer-centeredsupply chains comprising genetics development organizations, hatcheries,feed mills, farms, and slaughter/processing facilities. Close cooperation andinformation sharing across the input supply, primary production, andprocessing/manufacturing segments of the supply chain is coordinatedthrough procedures and processes established in a cahier des charges, adocument that must be approved by a national agency. Compliance with thecahier des charges is monitored by third-party certification. Noncompliantproducts, identified at any point in the system, are either destroyed ormarketed without the Label Rouge designation, thereby sacrificing a pricepremium 50 to 150 percent above the price for similar non-Label Rougepoultry products (Westgren, 1994, p. 572; 1999, p. 1109). Filière partici-pants are responsible for their losses resulting from noncompliance.
Cahier des charges provisions differ across supply chains, and these differ-ences provide the basis for product branding at the retail level. LabelRouge poultry is packaged and labeled before it leaves the processing
2 These brief supply chain descriptionsare based on longer descriptions pre-sented by Venturini and King (2002,pp. 60-71).3 This description is based on materialpresented by Westgren (1994, 1999)and by Sylvander (1996).
21New Directions in Global Food Markets / AIB-794
Economic Research Service/USDA
plant. The branding protects product identity as the products enter thedistribution/retailing segment of the supply chain with other packaged freshpoultry products.
The Label Rouge poultry supply chain is noteworthy for the degree of coop-eration it achieves among input suppliers, farmers, and processors. To alarge extent, this is made possible by the institutional foundations providedby the laws establishing the Label Rouge program and by the strong organi-zational infrastructure that has developed around the program. The programproduces a high-value product demanded by consumers, while returningadded profits to farmers.
Value Created In Processing/Manufacturing Segment:Wheaties Example4
Wheaties breakfast cereal has been produced and marketed by General Millssince 1921. Wheaties is a revered brand, with a loyal customer base built ona simple but appealing product design, decades of consistent quality control,and advertising centered around sports themes. The cost of the ingredientsin a box of Wheaties is only a fraction of the price General Mills receivesfrom wholesalers and retailers. This cereal is a classic example of a high-value product that derives most of its value from the processing/manufac-turing segment of the supply chain.
Until recently, General Mills procured wheat for Wheaties in traditionalcommodity markets. However, given recent research revealing superiortaste, appearance, and processing attributes of cereal flakes made fromparticular wheat varieties, General Mills has decided to use select wheatvarieties in producing Wheaties. Working through a small line of corpo-rately owned grain elevators in Idaho to control the supply of seed and tocollect and store the harvest, General Mills has established a supply chainthat ensures a supply of identity-preserved wheat to its manufacturingplants. The wheat is grown under contract with growers in the area, who arepaid a small premium—ranging from 5 cents to 25 cents per bushel—forusing approved production practices and for keeping the wheat segregatedfrom other varieties. Through its grain elevators, General Mills monitorscrop production practices, tests for varietal integrity, and implements grainstorage and handling practices designed to minimize risks of contaminationor co-mingling. These measures help minimize quality assurance costs else-where in the chain. Ownership of the grain elevators also makes it easier forGeneral Mills to coordinate the logistics of shipping wheat to its cerealmanufacturing plants and the liquidation of excess supplies through sales inregular commodity markets. The changes in procurement practices have notaffected manufacturing processes for Wheaties. Like Label Rouge poultry,cereal leaves the manufacturing plant packaged, which enables it to moveeasily through wholesale and retail distribution systems.
Value Created in Retailer-Led Supply Chain:Marks & Spencer Beef Example5
Food retailers in the United Kingdom (UK) have been leaders in the devel-opment of high-quality private label products that shift brand identity from
4 This description is based on presen-tations by and conversations withRonald D. Olson, Vice President GrainOperations, General Mills.
22New Directions in Global Food Markets / AIB-794
Economic Research Service/USDA
5 This description is based primarilyon material presented by Fearne, 1998.

the food manufacturer to the retailer. This shift has partly resulted fromimplementation of the 1990 Food Safety Act, which requires retailers to takeprimary responsibility for ensuring the safety of the food products receivedfrom their suppliers. The Act forced retailers to focus more on the upstreamsegments of the supply chain and led to the development of farm qualityassurance schemes that set standards for product traceability, animalfeeding, animal health and welfare, and product transport and handling(Fearne, 1998, p. 220). Subsequently, the outbreak of Bovine SpongiformEncephalopathy (BSE) in the UK has made quality assurance in food evenmore important to British consumers.
The supply chain for beef products sold by Marks & Spencer exemplifies aretailer-led supply chain. Marks & Spencer procures beef exclusivelythrough Scotsbeef, a family-owned slaughter and processing firm that buysall its beef from Marks & Spencer-approved Scottish producers. In this way,Marks & Spencer clearly defines its suppliers back through the primaryproduction segments of the supply chain and establishes linkages with themto facilitate coordination and two-way information flows. Marks & Spencermaintains a database with information on all its producers and conductsregular taste tests that are used to provide feedback to individual farmers(Fearne, 1998, pp. 222-223). This system promotes learning throughout thesupply chain and is mutually beneficial, since it improves both farm-levelperformance and product quality.
Value Created in Input Supply Segment:LoSatSoyTM Oil Example6
In recent years, seed companies have placed increased emphasis on devel-oping varieties with traits well suited for special end uses. For example,Iowa State University developed the low palmitic-acid soybean using tradi-tional breeding methods. Pioneer Hi-Bred International commercialized thevariety under a license agreement. LoSatSoyTM cooking oil produced withlow palmitic-acid soybeans has a level of saturated fat comparable to that incanola oil (Iowa State University Office of Biotechnology, 1997).LoSatSoyTM oil sells for a premium retail price relative to standard soybeanoil. This high-value food product derives its value primarily from activitiesat the input supply end of the supply chain.
The DuPont Company, which owns Pioneer Hi-Bred, faces two difficultchallenges in commercializing low-saturate soybeans. First, these soybeanshave added value only if varietal integrity is maintained during farm produc-tion and as the product moves from the farm to the manufacturer. Second,while DuPont operates at the input supply end of the supply chain, theadded value for the low-saturate soybeans is not realized until the cookingoil produced from the soybeans is sold to end-users. Both identity preserva-tion and value capture are difficult when ownership changes hands severaltimes as a product moves through the supply chain. Working throughPioneer Hi-Bred and two other subsidiaries—Optimum Quality Grains,L.L.C. (OQG) and Protein Technologies International (PTI)—DuPont hasdeveloped an innovative supply chain to address these challenges.
6 This description is based on anunpublished case study by Robert King.Information for that case was collectedfrom the Web sites of Optimum QualityGrains, L.L.C. (now DuPont SpecialtyGrain, http://www.oscar.dupontsg.com)and Protein Technologies International(http://www.protein.com) and from per-sonal communication with Robert E.Kennedy at Optimum Quality Grain.
23New Directions in Global Food Markets / AIB-794
Economic Research Service/USDA
OQG coordinates seed production and distribution, farm production,assembly, and transportation through an Internet-based contracting systemcalled OSCARTM. This system enables farmers to identify nearby grainelevators offering contracts for identity-preserved products. Low-saturatesoybean seeds are sold only to farmers who have contracted through thissystem. The contracts stipulate production practices that ensure varietalintegrity and require farmers to deliver all their production to thecontracting elevator. In return, farmers receive a premium of 25 cents overthe local price for commodity soybeans. Contracting elevators, not OQG,purchase the low-saturate soybeans from the farmers. OQG reimburses theelevators for the identity preservation premium paid to farmers, pays theelevators a small fee for segregating the low-saturate soybeans duringstorage, and directs elevators to ship the identity preserved soybeans tocrushing plants when needed.
PTI coordinates soybean processing and distribution to retail channelsand works with retailers to promote demand for LoSatSoyTM oil. PTIcontracts with crushing and refining plants to ensure the product’s iden-tity throughout processing. PTI never actually owns the soybeans or theoil derived from them. Rather, it pays small quantity-based premiums tocrushers and refiners and then charges a royalty fee to refiners for eachunit of LoSatSoyTM oil sold.
The LoSatSoyTM oil supply chain brings many independent segmentstogether in a well-integrated identity-preserved system that promotes efficiency and responsiveness to consumer demand. As such, it may be amodel for other high-value food products that derive their value fromgenetic attributes. DuPont has developed a system that converts intellec-tual property into a tangible product with value to consumers. DuPontcaptures a large share of the added value in the chain by paying downsteam chain participants for identity preservation while never actually taking title to the low-saturate soybeans or the products derivedfrom them.
In the four examples, it is apparent that successful production andmarketing of high-value products requires coordination between thedifferent segments of the supply chain. The degree and types of coordina-tion and integration among the different segments may vary based on thelocus of value generation. When value is generated in the primaryproduction process, coordination is required among input suppliers,farmers, and primary processors. When value is added at the processingsegment, coordination is required between suppliers of raw material andprocessors. In the case of General Mills’ Wheaties, coordination is furtherfacilitated by General Mills’ ownership of elevators in the wheat-producing areas. When value creation is driven by the retail sector, a highdegree of coordination is required among farmers, processors, andretailers. Finally, when value is created in the input supply segment andproduct identity must be preserved along different levels of the supplychain, coordination is required among many different players, includingproducers of the input (seed), farmers, grain elevators, crushing andprocessing plants, and retailers.
24New Directions in Global Food Markets / AIB-794
Economic Research Service/USDA

Fundamental Principles Behind aSuccessful Supply Chain
Contemporary studies of supply chains have focused on the concept of “leanthinking.” In The Machine That Changed the World, Womack, Jones, andRoos (1991) describe the development of lean production methods byToyota Motor Company and the impacts of those methods on the globalautomobile industry. In their followup book, Lean Thinking, Womack andJones (1996, pp. 15-99) identify five fundamental principles for lean enter-prises and show how they have been applied by firms in a range of indus-tries and locations. Even though these principles are based on theexperiences of nonagricultural firms, they are reflected in the four examplesin this section and in supply chain designs for other successful high-valuefoods.
● Specify value—Firms need to understand the value their product offers toend-users, staying focused on the customers’ points of view rather thantheir own. Supply chains for Label Rouge poultry, Wheaties, and Marks &Spencer beef all focus on delivering products that consumers appreciateand demand. Despite possessing attributes that are important to con-sumers, LoSatSoyTM oil has been less successful than the other three prod-ucts. Input suppliers are far removed from consumers, and conveyingvalue to consumers is generally difficult for makers of biotech products.
● Identify the value stream—The value stream is the entire set of activi-ties required to deliver the product and the value embodied in it to theultimate customer. It includes product design and development, theinformation tasks associated with order processing and scheduling, andthe physical transformation in form, space, and time associated withmanufacturing and distribution. Firms must fully understand the entirevalue stream, including those activities performed by other firms. Thiskind of learning is especially evident in the supply chains for LabelRouge poultry, Marks & Spencer beef, and LoSatSoyTM oil.
● Ensure continuous flow—Firms need to make the value stream flowcontinuously rather than in batches. Traditional manufacturing systemswere characterized by long production runs and large inventories ofintermediate and finished goods, which served as buffers for respondingto demand shocks. Flow is difficult to achieve in agriculture, where pro-duction is seasonal and requires weeks, months, or years. Even thoughprimary production in the Label Rouge poultry and Marks & Spencerbeef chains is in batches, the involvement of many producers who coor-dinate their production makes it possible to achieve a steady flow in theprocessing/manufacturing segment of the chain. Grain storage serves thesame purpose in the Wheaties and LoSatSoyTM chains.
● Govern production through pull—Quite simply, this principle impliesthat production of a product should not begin until requested by a cus-tomer. Pull eliminates the need for large price swings and inventorybuildups but is difficult to fully achieve in food supply chains due to thefundamental nature of agricultural production. In both the Wheaties andLoSatSoyTM supply chains, however, the principle of pull governs move-ments from storage to processing and manufacturing plants. Also, in thefour chains, improved information flows help transmit demand signals
25New Directions in Global Food Markets / AIB-794
Economic Research Service/USDA

more quickly to the input supply and primary production segments thanwould be the case in less integrated chains.
● Strive for perfection—Firms should strive for continuous, incrementalimprovement in their products and processes. They should configure thevalue stream to minimize defects at each stage to reduce the need forcostly reworking and replacement of defective items. Once again, allfour supply chains described in this chapter include quality assuranceprocesses that reduce product contamination. The Wheaties andLoSatSoyTM supply chains achieve this primarily through monitoringand testing. On the other hand, information sharing and the threat ofbeing excluded from the chain for noncompliance with quality standardsare key quality assurance tools in the Label Rouge poultry and Marks &Spencer beef chains.
The idea of transparency is also critical for understanding Womack andJones’ view of the lean enterprise. In almost all cases, the supply chainencompasses several firms, and many of the most difficult challenges inimplementing lean thinking involve eliminating negative externalities firmsimpose on each other and fostering positive externalities. This requiresopenness among firms along the supply chain regarding costs, prices, andprocesses, and some commitment by all to ensuring each firm receives anadequate return on investment (Womack and Jones, 1996, pp. 276-278). Thehigh degree of information sharing in the four chains described here helpspromote transparency. Nevertheless, complete transparency is an ideal thatis difficult to achieve. It is crucial to recognize that noncooperative strategicbehavior continues to be prevalent, even with the focus on efficiency andcollaboration associated with the shift toward the lean enterprise.
Evolving Linkages Shape Food Supply Chain
The problem of supply chain design is one of configuring a set of discreteactivities and processes into an integrated system that creates value anddelivers it to customers. Physical processes are often product specific,though there is usually some degree of choice regarding technology, scale,and location. Linkages between processes are more generic, and linkagesdeveloped for one chain can often be adapted for use in others. Mechanismsfor linking and coordinating processes can be grouped into three broad cate-gories: standards, markets, and organizational coordination mechanisms.
Standards
Standards have long been recognized as a tool for linking discrete processesin the food system. The publicly defined grain grades established under the1916 Grain Standards Act lower transaction costs and are an institutionalfoundation for the decentralized grain marketing system in the United States(Hill, 1998). Even as the system moves away from standard commodities tomore specialized products, public grades and the standard measures thatdefine them continue to be important (Chambers and King, 2002). Standardscan also be established by trade associations or by individual firms. Forexample, the Universal Product Code (UPC) identification number system is
26New Directions in Global Food Markets / AIB-794
Economic Research Service/USDA

the product of an industry-sponsored organization. This system revolution-ized operations at the retail end of the supply chain, not only in thecheckout lane but also in the backroom, where inventory management andproduct ordering are key concerns (Walsh, 1993).
At least three types of standards are likely to play a role in the design ofsupply chains for high-value foods.
● Primary production practice standards often serve as a basis for valuecreation in food supply chains. These standards may simply specify a vari-ety or a time when a production cycle will be initiated, as in the Wheatiesand LoSatSoyTM supply chains; or they may be more complex and far-reaching, as in the Label Rouge poultry and Marks & Spencer beef chains.
● Packaging and logistics standards aid the configuration of new supplychains. “Packaging” used in a very broad sense refers to any technologythat preserves the integrity of a product as it moves through the supplychain. At the distribution/retail end, standards have been developed forreusable pallets and containers used to transport food products frommanufacturers to distributors and retailers. These standardized toolsmake it possible to move large numbers of distinct products from manypoints of origin to many destinations in an efficient manner. As the over-all volume and diversity of identity-preserved products increases, incen-tives emerge to develop new packaging and logistics standards for theupstream segments of food supply chains. For example, greater use ofcontainers to move food products from farms to processors and manu-facturers adds flexibility in transport. This facilitates identity preserva-tion and quality assurance in general purpose logistics systems that maybe able to approach the efficiency of current bulk transportation systems.
● Data transfer standards shape supply chain design. Building on theUPC standards developed in the 1970s and 1980s, food manufacturers,wholesalers, and retailers developed and implemented electronic datainterchange (EDI) standards in the 1990s. More recently, the pace ofdevelopment has increased for Internet business-to-business systems.These systems rely on more generic standards and tools, requiring lessupfront investment by trading partners. They are well suited for datatransfer between small firms and for situations where low volumes ofdata are transferred infrequently.
Standards development greatly influences systemwide efficiency and qualityassurance. New standards alter the level of transparency and the intensity ofcompetition, thereby impacting the distribution of returns within a supplychain. Standards can also affect innovation by making it easier for newfirms to develop the management systems and business practices needed toenter a supply chain segment or establish a supply chain for a new product.Narrowly defined standards, however, may make it difficult to introduceradically new systems and processes.
Markets
Markets are efficient mechanisms for coordinating resource allocation deci-sions and product flows among firms when externalities, public goods, and
27New Directions in Global Food Markets / AIB-794
Economic Research Service/USDA
access to information are not important factors and when there is adequatecompetition among both buyers and sellers. The emergence of greaterproduct diversity at the primary production end of the food system iscreating many new opportunities for market formation. At the same time,the rapid development of electronic commerce is lowering the cost of estab-lishing new markets.
The electronic commerce system for production contracts in the LoSat-SoyTM supply chain helps producers identify delivery points for low-saturatesoybeans and provides information on contract terms and price premiums.DuPont also uses the same system for other crops, making it easier forelevators and other downstream firms to identify and contact potentialfarmer suppliers. The system provides farmers an opportunity to comparedelivery point locations, contract provisions, and price premiums for a rangeof crops.
Though the development of electronic commerce has slowed recently insegments closely linked with primary agricultural production, progresscontinues in developing electronic exchanges that link manufacturers,wholesalers, and retailers. These new markets are having profound effectson the structure of business-to-business linkages and the role of intermedi-aries. The impacts are likely to extend back upstream to the primary produc-tion and input supply segments of food supply chains (Wheatley, Buhr, andDiPietre, 2001). Future developments will continue to be driven byadvances in information technology and by economic research on theoriesof bidding and auction market design (McAfee and McMillan, 1987),helping to clarify the efficiency and distributional impacts of alternativemarket mechanisms.
New markets can lower systemwide costs and alter the distribution ofreturns among chain participants. The presence of markets spanning acrossseveral supply chains should help foster adaptation and innovation if thecontrol of competing supply chains is not highly concentrated. For example,several distinct supply chains compete for supplies of identity preservedgrain in the United States. It is important to consider interchain markets inthe institutional design process. Inter-chain markets can inject competitiveforces and are more likely than markets operating within a single chain tobe the focus for public sector regulation and intervention.
Organizational Coordination Mechanisms
Organizational coordination mechanisms used in supply chain designinclude business practices that may be established through nonprice/quantityprovisions in contracts or through informal interfirm relationships. Theyalso include new organizational forms, such as third-party certificationagencies helping guarantee product quality and joint ventures and alliancesthat coordinate investment, operations, and gain-sharing among otherwiseindependent trading partners.
Information sharing, decision transfer, and decision partnership are threegeneric business practices for coordinating resource allocation and productflows across firm boundaries. Each helps reduce information asymmetries,
28New Directions in Global Food Markets / AIB-794
Economic Research Service/USDA

facilitating trading partners to recognize and reduce the effects of externali-ties they impose on each other. For example, vendor-managed inventorypractices between food manufacturers and distributors use informationsharing and decision transfer to realize efficiency gains. A wholesaler orself-distributing retailer regularly sends product movement data to a manu-facturer, which allows the manufacturer to make decisions regarding replen-ishment flows, subject to restrictions on minimum and maximuminventories at the distribution center. This enables the manufacturer to lowercosts by smoothing production and rationalizing logistics, with cost savingsbeing shared by the two parties. Higher degrees of interdependence andinformation sharing are evident in retailer-led supply chains, such as in thecase of Marks & Spencer beef.
Category management practices at the retail end of the food system illus-trate the value of decision sharing. Manufacturers, brokers, wholesalers, andretailers form teams to make joint decisions about product assortment, shelf-space allocation, pricing, and promotions. Often, these teams are based oninformal ties rather than on contractual agreements. When successful, cate-gory management reduces costs and increases product flows for all parties.
New organizational forms also facilitate coordination. Third-party certifica-tion agencies can play a role in high-value food supply chains whendefining attributes are linked to production practices, as they are in the caseof organic products. In such cases, a group of firms in one segment of asupply chain, a vertical alliance of trading partners, or a government bodymay establish and use an independent certification agency for quality assur-ance. For example, in the Label Rouge case, a third-party certificationagency monitors compliance with cahier des charges. Generally, the certifi-cation process involves a combination of baseline and periodic followupinspections, strict record-keeping procedures, and unannounced audits. Thisprocess can be costly, but in some settings it is more efficient and effectivethan direct monitoring and laboratory testing.
Vertical joint ventures and alliances are also organizational tools for supplychain design. A joint venture may make it possible for independent tradingpartners to establish a service that draws on the unique competence of eachfirm and broadly benefits the entire supply chain. More broad-based alliancesbetween trading partners—for example, an alliance between a cooperative,with members that can source a wide range of identity-preserved raw ingredi-ents, and a food manufacturer requiring ingredients for a diverse productline—may be the basis for efficiency gains across a number of more narrowlydefined high-value product supply chains.
Looking Ahead
The future evolution of high-value food supply chains will be primarilydriven by creative ideas and strategic choices of individuals and firmsresponding to new market opportunities. In general, competitive forces atthe local, national, and international levels can be expected to push thisevolutionary process toward increased efficiency and higher quality prod-ucts. However, some economists voice concern that concentration of owner-
29New Directions in Global Food Markets / AIB-794
Economic Research Service/USDA

ship and control will skew the distribution of costs and returns and impedeinnovation in some segments of the food system.
Public sector organizations will help shape the evolution of high-value foodsupply chains. Perhaps the most important influences will be through publicinvestment in infrastructure and public establishment of institutions. Indeveloping countries, especially, infrastructure and institutions will be amajor factor determining both the ability of suppliers to offer their foodproducts in world markets and the opportunities consumers will have toenjoy efficiency gains of new technology and product development. Indeveloped countries, infrastructure and institutions will have importantimpacts on product diversity, competition, competitiveness, and innovation.
The world food system is undergoing fundamental changes due to techno-logical change, population growth, economic development, and globaliza-tion. The emergence of more highly integrated supply chains for high-valuefoods, increasingly demanded by consumers across all income levels, is animportant part of the overall pattern of change. Sound knowledge of supplychain design principles and thoughtful evaluation of design alternatives willhelp promote change that fosters economic growth, food safety and security,and innovation.
References
Chambers, William, and Robert P. King. “Changing Agricultural Markets:Industrialization and Vertical Coordination in the Dry Edible BeanIndustry,” Review of Agricultural Economics, Vol. 24, No. 2, 2002,pp. 495-511.
Fearne, A. “The Evolution of Partnerships in the Meat Supply Chain:Insights from the British Beef Industry,” Supply Chain Management: AnInternational Journal, Vol. 3, No. 4, 1998, pp. 214-231.
Food and Agriculture Organization of the United Nations (FAO). FAOSTAT,2002, http://apps.fao.org
Hill, Lowell, D. “The Case for Public Grain Grades,” In Structural Changeand Performance of the U.S. Grain Marketing System, Donald W. Larson,Paul W. Gallagher, and Reynold P. Dahl (eds.), Department ofAgricultural, Environmental, and Development Economics, The OhioState University, 1998, pp. 135-150.
Iowa Sate University Office of Biotechnology. “ISU and Iowa CompaniesLaunch First Low-Saturated Soybean Oil,” Biotechnology Update, Vol.XI, Issue 5, October 1997, http://biotech.iastate.edu/biotech_update/Oct_97.html#low_sat
McAfee, R. Preston, and John McMillan. “Auctions and Bidding,” Journalof Economic Literature, Vol. XXV, June 1987, pp. 699-738.
Sylvander, B. “Normalisation et Concurrence Internationale: La Politique deQualité Alimentaire en Europe,” Economie Rurale, Vol. 231, Janvier-Février, 1996, pp. 56-61.
30New Directions in Global Food Markets / AIB-794
Economic Research Service/USDA

Venturini, Luciano, and Robert P. King. “Vertical Coordination and theDesign Process for Supply Chains To Ensure Food Quality,” In EconomicStudies on Food, Agriculture, and the Environment, Maurizio Canavari,Paolo Caggiati, and K. William Easter (eds.), Kluwer Academic/PlenumPublishers, 2002, pp. 57-87.
Walsh, John P. Supermarkets Transformed: Understanding Organizationaland Technological Innovations, Rutgers University Press, 1993.
Westgren, R.E. “Case Studies of Market Coordination in the PoultryIndustries,” Canadian Journal of Agricultural Economics, Vol. 42, 1994,pp. 565-575.
Westgren, R.E. “Delivering Food Safety, Food Quality, and SustainableProduction Practices: The Label Rouge Poultry System in France,”American Journal of Agricultural Economics, Vol. 81, No. 5, 1999,pp. 1107-1111.
Wheatley, W. Parker, Brian Buhr, and Dennis DiPietre. “E-Commerce inAgriculture: Development, Strategy, and Market Implications,” StaffPaper P01-6, Department of Applied Economics, University ofMinnesota, July 2001, http://agecon.lib.umn.edu/mn/p0106.pdf
Womack, James P., and Daniel T. Jones. Lean Thinking, Simon & Schuster,1996.
Womack, James P., Daniel T. Jones, and Daniel Roos. The Machine ThatChanged the World, HarperPerennial, 1991.
31New Directions in Global Food Markets / AIB-794
Economic Research Service/USDA

The Western European countries are a mature market for food, with growthin demand generally associated with growth in population. However,demand patterns of European consumers are changing, with growingdemand for food products with certain characteristics, such as productsperceived to be safer, more healthful, or produced in ways that are morebeneficial to the environment and take animal welfare and equitable laborconcerns into consideration. For example, 80 percent of the consumers inthe European Union (EU) indicate a concern for animal welfare (Blandfordand Fulponi, 1999), and European consumers are increasingly demandingorganic food products and a wider selection of such products (Lohr, 2001).The social concerns for equitable income distribution and sustainable devel-opment are reflected in the growth of sales of products marketed under FairTrade labels. The European Fair Trade market is estimated at $140 millionannually (FAO, 1999), with participation by 50 supermarket chains in 14countries (Lohr, 2001).
The changes noted in food demand patterns of European consumers arerepresentative of certain segments of the population in many affluent coun-tries. Consumer demand changes pose certain challenges and opportunitiesfor food suppliers. In the United States, rising demand for organic productshas resulted in an expansion of area planted to organic crops from 1.3million acres in 1997 to 2.3 million acres in 2001 (Greene and Kremen,2003). Similarly, a small and growing group of livestock producers, such asthe Niman Ranch, are successfully raising animals under conditions thatmeet animal welfare guidelines. Therefore, opportunities exist for foodproducers and suppliers to differentiate their products to meet specificdemands of consumers.
When value is added to products under the retailer initiative, appropriatequality signals are required to convey the information regarding the addedvalue to the consumer. Private retailer brands exist in the United States, butthese brands are generally cheaper substitutes to major brands and are not
1Jean-Marie Codron is a SeniorResearcher, National Institute ofAgronomic Research (INRA),Montpellier, France; Klaus Grunert isProfessor of Marketing and Director ofthe MAPP Research Centre, TheAarhus School of Business, Denmark;Eric Giraud-Heraud and Louis-Georges Soler are Researchers atINRA, Montpellier, France; and AnitaRegmi is an Economist, Market andTrade Economics Division,ERS/USDA.
32New Directions in Global Food Markets / AIB-794
Economic Research Service/USDA
Chapter 3
Retail Sector Responses toChanging Consumer
PreferencesThe European Experience
Jean-Marie Codron, Klaus Grunert, Eric Giraud-Heraud,Louis-Georges Soler, and Anita Regmi1
Private retailer labels have been effective in providing qualityassurance and meeting the highly differentiated demands ofwealthier consumers, particularly in Europe.

necessarily recognized as products associated with additional value added toreflect higher quality or food safety standards. On the other hand, privateretailer brands in the European retail sector are associated with higherquality and food safety standards. It is likely that this trend will spread toother wealthier countries and the shares of private brands associated withimproved quality and safety standards will grow on grocery store shelvesacross these countries.
European Consumers
Food consumption behavior in the EU is rapidly evolving and becomingmore difficult to understand and predict. The complexity of food choices forconsumers stems from increasing differentiation of food products in themarketplace, and the increasing dynamics, complexity, and heterogeneity ofconsumer demands (Grunert, 2002). Consumer food choice is still influ-enced by product prices, product quality, and income levels. But whatconsumers regard as “quality” has changed considerably in recent years andis today more closely associated with four quality attributes for food prod-ucts: sensory attributes, health attributes, process attributes, and convenienceattributes (Grunert, 2003).
Sensory attributes refer to the classical aspects of food quality: taste, appear-ance, and smell, with taste being dominant. Taste is an experience qualitythat can be evaluated only after a product is purchased, and consumers use ahost of market signals, like brand, price, and quality labels, in trying topredict the taste experience.
Health attributes have become increasingly important during the last 50years, and studies indicate that consumers give equal weight to health andsensory attributes (Grunert, 2003). While consumers are aware of the linkbetween eating and health, they do not expect the consumption of a partic-ular product on a particular occasion to have a health implication that theycan experience. Many health effects of food are of a rather abstract nature—like the risks of particular diseases being reduced by a certain percentage—and thus do not lead to consequences that are readily accessible toexperience. Health as a choice criterion for food is thus a question ofcommunicating and interpreting various signals. Some recurring themesamong signals sent by European consumers are that industrial food produc-tion is less healthy than small-scale local production, additives areunhealthy, fat is unhealthy, and vegetables are healthy (Brunsø, Fjord, andGrunert, 2002).
More recently, food manufacturers have used the health criterion in thedevelopment of “functional foods,” food products that have an added posi-tive health benefit (Frewer et al., 2003). These products include yogurts withprobiotic ingredients,2 margarine enriched by cholesterol-reducing ingredi-ents, and juices enriched with calcium and other healthy ingredients. Whilesome functional ingredient benefits may be perceived to enhance short-termwell-being or performance ability, many health benefits envisaged for func-tional foods deal with long-term reductions of risks of certain diseases. Thistype of health benefit is generally invisible for the consumer and is hence aquestion of communication. For this reason, the question of which health
2 Probiotic refers to the use ofmicroorganisms in a way that is bene-ficial to human and animal health.Harmless bacteria may be introducedthrough food to promote their coloniesand prevent the growth and multiplica-tion of harmful bacteria, a techniqueknown as competitive exclusion.
33New Directions in Global Food Markets / AIB-794
Economic Research Service/USDA
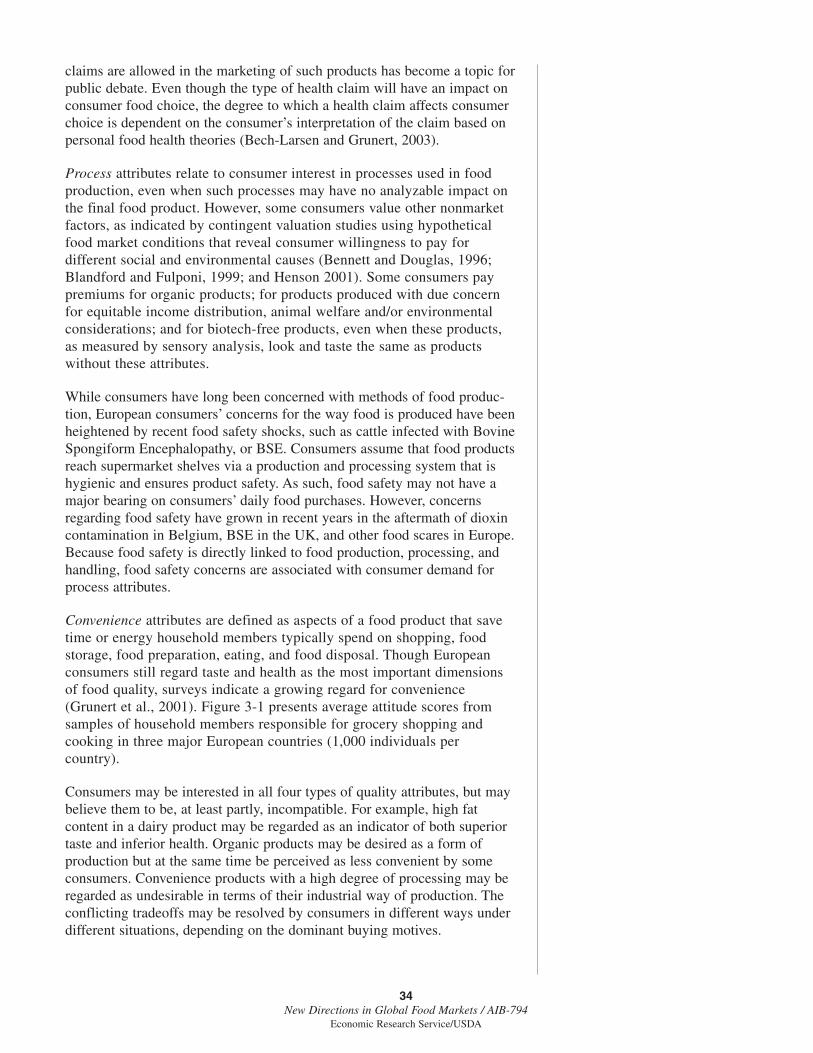
claims are allowed in the marketing of such products has become a topic forpublic debate. Even though the type of health claim will have an impact onconsumer food choice, the degree to which a health claim affects consumerchoice is dependent on the consumer’s interpretation of the claim based onpersonal food health theories (Bech-Larsen and Grunert, 2003).
Process attributes relate to consumer interest in processes used in foodproduction, even when such processes may have no analyzable impact onthe final food product. However, some consumers value other nonmarketfactors, as indicated by contingent valuation studies using hypotheticalfood market conditions that reveal consumer willingness to pay fordifferent social and environmental causes (Bennett and Douglas, 1996;Blandford and Fulponi, 1999; and Henson 2001). Some consumers paypremiums for organic products; for products produced with due concernfor equitable income distribution, animal welfare and/or environmentalconsiderations; and for biotech-free products, even when these products,as measured by sensory analysis, look and taste the same as productswithout these attributes.
While consumers have long been concerned with methods of food produc-tion, European consumers’ concerns for the way food is produced have beenheightened by recent food safety shocks, such as cattle infected with BovineSpongiform Encephalopathy, or BSE. Consumers assume that food productsreach supermarket shelves via a production and processing system that ishygienic and ensures product safety. As such, food safety may not have amajor bearing on consumers’ daily food purchases. However, concernsregarding food safety have grown in recent years in the aftermath of dioxincontamination in Belgium, BSE in the UK, and other food scares in Europe.Because food safety is directly linked to food production, processing, andhandling, food safety concerns are associated with consumer demand forprocess attributes.
Convenience attributes are defined as aspects of a food product that savetime or energy household members typically spend on shopping, foodstorage, food preparation, eating, and food disposal. Though Europeanconsumers still regard taste and health as the most important dimensionsof food quality, surveys indicate a growing regard for convenience(Grunert et al., 2001). Figure 3-1 presents average attitude scores fromsamples of household members responsible for grocery shopping andcooking in three major European countries (1,000 individuals percountry).
Consumers may be interested in all four types of quality attributes, but maybelieve them to be, at least partly, incompatible. For example, high fatcontent in a dairy product may be regarded as an indicator of both superiortaste and inferior health. Organic products may be desired as a form ofproduction but at the same time be perceived as less convenient by someconsumers. Convenience products with a high degree of processing may beregarded as undesirable in terms of their industrial way of production. Theconflicting tradeoffs may be resolved by consumers in different ways underdifferent situations, depending on the dominant buying motives.
34New Directions in Global Food Markets / AIB-794
Economic Research Service/USDA
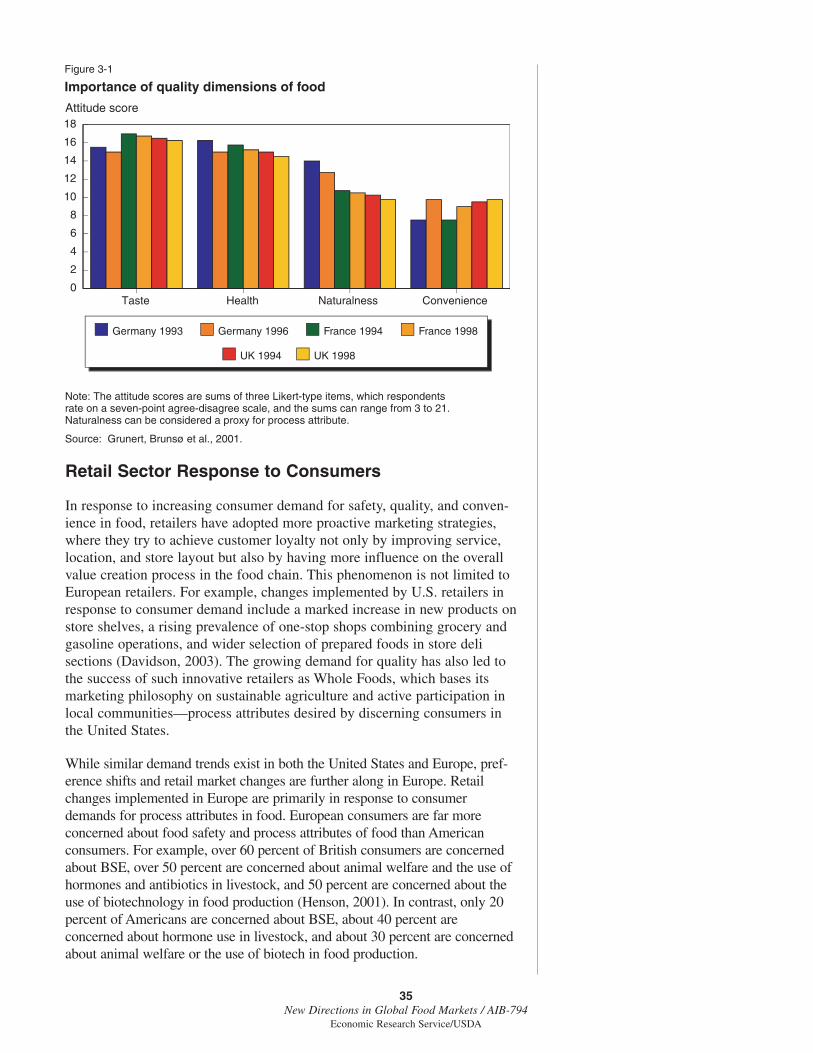
Retail Sector Response to Consumers
In response to increasing consumer demand for safety, quality, and conven-ience in food, retailers have adopted more proactive marketing strategies,where they try to achieve customer loyalty not only by improving service,location, and store layout but also by having more influence on the overallvalue creation process in the food chain. This phenomenon is not limited toEuropean retailers. For example, changes implemented by U.S. retailers inresponse to consumer demand include a marked increase in new products onstore shelves, a rising prevalence of one-stop shops combining grocery andgasoline operations, and wider selection of prepared foods in store delisections (Davidson, 2003). The growing demand for quality has also led tothe success of such innovative retailers as Whole Foods, which bases itsmarketing philosophy on sustainable agriculture and active participation inlocal communities—process attributes desired by discerning consumers inthe United States.
While similar demand trends exist in both the United States and Europe, pref-erence shifts and retail market changes are further along in Europe. Retailchanges implemented in Europe are primarily in response to consumerdemands for process attributes in food. European consumers are far moreconcerned about food safety and process attributes of food than Americanconsumers. For example, over 60 percent of British consumers are concernedabout BSE, over 50 percent are concerned about animal welfare and the use ofhormones and antibiotics in livestock, and 50 percent are concerned about theuse of biotechnology in food production (Henson, 2001). In contrast, only 20percent of Americans are concerned about BSE, about 40 percent areconcerned about hormone use in livestock, and about 30 percent are concernedabout animal welfare or the use of biotech in food production.
35New Directions in Global Food Markets / AIB-794
Economic Research Service/USDA
Figure 3-1
Importance of quality dimensions of food
Source: Grunert, Brunsø et al., 2001.
Attitude score
Note: The attitude scores are sums of three Likert-type items, which respondents rate on a seven-point agree-disagree scale, and the sums can range from 3 to 21. Naturalness can be considered a proxy for process attribute.
Germany 1993 France 1994
Taste Health Naturalness Convenience0
2
4
6
8
10
12
14
16
18
UK 1994 UK 1998
Germany 1996 France 1998
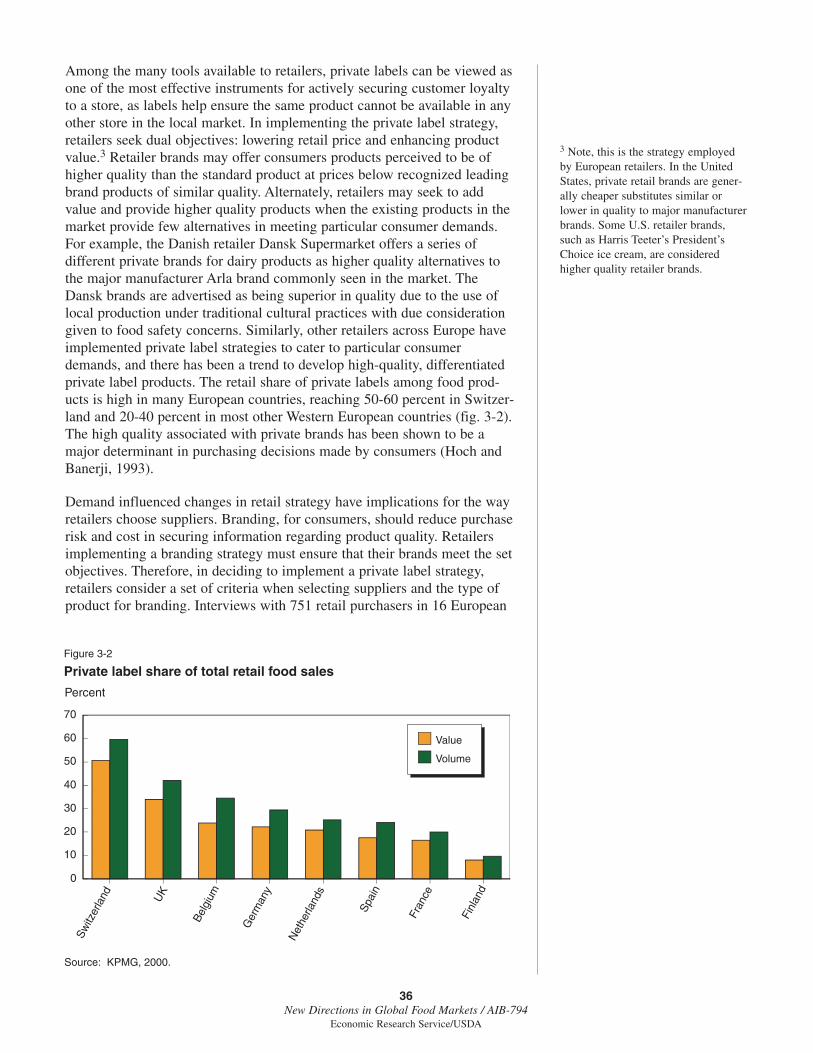
Among the many tools available to retailers, private labels can be viewed asone of the most effective instruments for actively securing customer loyaltyto a store, as labels help ensure the same product cannot be available in anyother store in the local market. In implementing the private label strategy,retailers seek dual objectives: lowering retail price and enhancing productvalue.3 Retailer brands may offer consumers products perceived to be ofhigher quality than the standard product at prices below recognized leadingbrand products of similar quality. Alternately, retailers may seek to addvalue and provide higher quality products when the existing products in themarket provide few alternatives in meeting particular consumer demands.For example, the Danish retailer Dansk Supermarket offers a series ofdifferent private brands for dairy products as higher quality alternatives tothe major manufacturer Arla brand commonly seen in the market. TheDansk brands are advertised as being superior in quality due to the use oflocal production under traditional cultural practices with due considerationgiven to food safety concerns. Similarly, other retailers across Europe haveimplemented private label strategies to cater to particular consumerdemands, and there has been a trend to develop high-quality, differentiatedprivate label products. The retail share of private labels among food prod-ucts is high in many European countries, reaching 50-60 percent in Switzer-land and 20-40 percent in most other Western European countries (fig. 3-2).The high quality associated with private brands has been shown to be amajor determinant in purchasing decisions made by consumers (Hoch andBanerji, 1993).
Demand influenced changes in retail strategy have implications for the wayretailers choose suppliers. Branding, for consumers, should reduce purchaserisk and cost in securing information regarding product quality. Retailersimplementing a branding strategy must ensure that their brands meet the setobjectives. Therefore, in deciding to implement a private label strategy,retailers consider a set of criteria when selecting suppliers and the type ofproduct for branding. Interviews with 751 retail purchasers in 16 European
3 Note, this is the strategy employedby European retailers. In the UnitedStates, private retail brands are gener-ally cheaper substitutes similar orlower in quality to major manufacturerbrands. Some U.S. retailer brands,such as Harris Teeter’s President’sChoice ice cream, are consideredhigher quality retailer brands.
36New Directions in Global Food Markets / AIB-794
Economic Research Service/USDA
Figure 3-2
Private label share of total retail food sales
Source: KPMG, 2000.
Percent
Sw
itzer
land UK
Bel
gium
Ger
man
y
Net
herla
nds
Spa
in
Fran
ce
Finl
and
0
10
20
30
40
50
60
70
Value
Volume

countries show that, in addition to traditional factors like price, quality, andthe ability to supply needed volume, the ability to trace back products andthe willingness of suppliers to engage in long-term relationships withretailers are important selection criteria (Skytte and Blunch, 2001). Theprominence of private labels has likely affected this shift.
A comparison of criteria retailers use to select suppliers in Western Europeand Eastern Europe, where the private label development is still in itsinfancy (Blunch et al., 1999), provides some indication of the relativeimportance of different criteria over time, and perhaps among markets atrelatively different levels of per capita income. For example, product trace-ability is very important to retailers in Germany, who cater to affluentconsumers with a longstanding demand for credence attributes (table 3-1).Traceability has little or no importance for retailers in Poland, who cater toless-affluent consumers unfamiliar with the concepts behind private labels.
The branding function places more responsibility for product design, qualitycontrol, and product liability on the retailer. Therefore, traceability andcloser cooperation with manufacturers is necessary to bring about productsthat bear the retailer’s mark in terms of design, positioning, and qualityconsistency. As shown in the following section, levels of cooperationbetween the retailers and upstream producers and processors can vary basedon the degree of quality differentiation desired by retailers.
The French Beef and Produce Example
France has a long history of quality branding of food products, such asmanufacturer brands for cheeses and the state-certified collective qualityLabel Rouge for poultry. French retailers have sought to maintain customerloyalty by employing policies governing shelf-space and product-quality
37New Directions in Global Food Markets / AIB-794
Economic Research Service/USDA
Table 3-1—Relative importance of criteria in retailer selection of suppliers
Germany Poland
Criteria Fish Cheese Fish Cheese
Importance in percent
Quality 11 11 11 8Price 6 4 5 0Consistency 2 2 0 1Market information 4 6 0 3Traceability 15 24 0 1Sufficient quantity 17 12 4 0Promotion 3 5 5 8Product range 16 14 10 13Long-term relationships 16 14 10 13Reputation 2 0 9 7National/foreign origin 9 5 13 17
Note: Figures in the table are results from a conjoint analysis. The relative importance of thevarious criteria is computed as the range of utility values for the levels of that particular criteri-on divided by the sum of the ranges across all criteria. The relative importance is calculatedseparately for each individual and the figures in the table represent the average across all indi-viduals. When the ranking is similar across all individuals the rankings for all criteria (rankingsin a column) sum to 100.
Source: Blunch et al., 1999.

signaling strategies via branding. These strategies vary based on inherentproduct characteristics. As previously mentioned, retailers may implementbranding to offer lower priced substitutes to leading manufacturers’ brands,particularly in the packaged dry food sectors. However, retailer brands haverecently emerged in the fresh meat and produce sectors, largely as alternateproducts associated with higher quality.
Although retailers respond to consumer demand for sensory attributes infood, retail differentiation and segmentation policies are primarily driven byconsumer demand for process attributes, which arises from food safetyconcerns. Process attributes in the produce sector are considered to be indi-cators of certain sensory attributes and better stewardship of the land. Thelevels of retail segmentation and coordination among the upstream sectorsof the supply chain vary between the beef and produce sectors due to thedifferences in the factors underpinning the retail segmentation.
The beef sector changes in France are largely influenced by food safety scaresin Europe. As elsewhere in Europe, beef consumption declined sharply inFrance following the outbreak of BSE. French consumers are increasinglyconcerned about food safety, with 70 percent indicating an awareness of BSE,and a third of those who are aware indicating concerns about it (Aubril,2002). Given the predominance of food safety concerns, retailer strategiesimplemented for the beef sector are designed to provide safety and qualityassurances to the public. The retailer strategies often lead to close coordina-tion and integration between producers, processors, and retailers.
The retailer strategies for the produce sector (defined as fresh fruit andvegetables), on the other hand, deal with providing assurances regarding thesensory attributes of the product, and also with assurances regarding goodstewardship of the environment. While sensory attributes and environmentalconcerns can have some influence on decisions to purchase beef, food safetyconcerns overshadow all other concerns for French consumers. Food safetyconcerns in the produce sector, however, are less important, and only asmall segment of the French population indicated concerns regarding pesti-cide residues in produce, and most consumers considered themselves ill-informed about this topic (Linéaires, 2002). Retailer strategies for freshfruits and vegetables are also shaped by transportation, handling, andshelving limitations. French consumers are generally reluctant to buyprepackaged fruit, leading to higher costs and labor requirements inshelving and maintaining quality in bulk products. Since sensory attributesof products can vary based on seasonal and regional agronomic factors,retailers are generally hesitant to personally stand behind the product ontheir shelves. Therefore, as the retailer has limited control in assuring thequality of the final product in the produce sector, the levels of coordinationand integration are less than those in the beef sector.
Beef Sector
The French retail sector employs a combination of shelf-space managementand quality signaling to meet specific consumer demands as well as tomaintain market share. Although all beef sold in France must adhere tonationally required safety and quality standards, private label beef is
38New Directions in Global Food Markets / AIB-794
Economic Research Service/USDA

promoted as being safer and higher in quality than the standard product,which is unlabeled and generally sold at a lower price. In the beef sector,private retailer brands can be grouped into three categories. Substitutionbrands, which are similar to basic U.S. grocery store brands, use store labelswithout any specific quality associated with the label. This product under-goes internal retail chain quality control and generally is similar to the stan-dard product. To promote sales, retailers allocate most of their beef shelfspace to the brand. This product may carry up to a 5-percent premium overprices of standard beef products.
Segmentation brands differ from standard beef products in that they areperceived to be of a higher quality that is certified either through internalcontrol or through an independent third party. Segmentation brands carry aCertificate of Product Conformity (CPC). The CPC is an official (govern-ment-controlled) designation that a retailer can acquire only if it implementssafety and quality standards exceeding the national standards. Productslabeled with the segmentation brand get a smaller fraction of the total beefshelf space than the substitution brand. However, segmentation brands carrya greater price premium, up to 10 percent over the standard product.
Chain (filière) brands are recognized for quality and systematically carry theCPC designation. The products are produced via a quality-controlled systemthat may be designed to meet higher product safety standards or specificproduction processes, such as those that incorporate environmental andanimal welfare concerns. In addition to possessing a label that reflectscertain standards, the chain brands also reflect traceability of these products.Therefore, the chain brands are associated with close cooperation and coor-dination between the producers, slaughterers, processors, and retailers.Within this category, further distinctions can be made based on the level ofpartnership between the retailers and the different upstream players in thesupply chain. Based on the level of quality and process assurances provided,the chain brand beef products can carry up to a 25-percent price premium,but generally command a smaller segment of the shelf space.
Two opposing strategies are noted among French retailers. Some retailerstend to maximize private retailer brand sales by allocating a large share ofshelf space to minimally differentiated retailer brands commanding smallpremiums, while others allocate a smaller segment of shelf space to highlydifferentiated retailer brands carrying large price premiums. For example,the French supermarket Intermarché allocates all its beef shelf space tosubstitution brand beef (Jean Rozè la Viande), while other supermarkets,such as Carrefour and Auchan, carry all three types of beef brands—thestandard, segmentation, and chain brands. The organic private brand ofAuchan carries the highest premium, about 40 percent over the price ofstandard products, but accounts for less than 10 percent of the total beefshelf space.
As mentioned earlier, retailer strategies in implementing private labels haveimplications for other upstream sectors. A highly integrated chain involvingmany players may also incur higher costs and have greater risks. For suchproducts, retailers may test the market by allocating the item only to a smallshare of the overall shelf space typically slotted to that product type. Inplanning their strategy, retailers can choose a number of coordination
39New Directions in Global Food Markets / AIB-794
Economic Research Service/USDA

schemes based on the type of branded product to be marketed. The domi-nant scheme in France is a “two-party” relationship where the producer andthe slaughterer enter a contract, and the slaughterer and the retailer enterinto a contract. In such a setup, the retailer makes all decisions regardingproduct quality specifications. The producer and the slaughter must adhereto these specifications. Such a scheme is generally followed in marketingsubstitution brand beef.
In the “three-party” relationship, the retailer develops relationships withboth the producers and the slaughterers (Mazé, 2002). Product quality speci-fications may be drawn up mutually by both the producer and the retailer,while an association consisting of representatives of the producer, theslaughterer, and the retailer may handle the operational management of thesupply chain. The product quality specifications may be certified through apublicly recognized certification process. When the certification isconducted by a third party, the costs to provide quality assurance mayincrease. This type of production scheme is generally adopted for retailerprivate brands that are significantly different from the standard product,such as segmentation and chain brands.
Produce Sector
In the produce sector, retailer private label strategies are largely geared toprovide assurances regarding sensory attributes and the levels of chemicalresidues in products. Private brands in this sector were established muchlater than in the beef sector and are also less segmented in the types ofbranding visible on the retail shelves. Retailer brands for produce are gener-ally associated with the integrated farming movement in France, whichconsumers have associated with a lower use of chemicals, and, to a lesserdegree, better land stewardship. In addition, private labels are also requiredto meet the necessary grades specified by retailers with regard to sugarcontent, firmness, size, and other product characteristics.
Retailers’ cooperation with produce suppliers is less defined than with beefsuppliers. Sensory attributes, much valued by consumers, are difficult forretailers to guarantee and measure and the implementation of control andthe monitoring of such characteristics can be costly. However, cooperationbetween suppliers and retailers can be mutually beneficial and tends toreduce the quality assurance costs for retailers (Brousseau and Codron,1998). Given the risks and uncertainties associated with growing andmarketing produce, suppliers on the other hand, appreciate the guarantee ofan outlet provided under the cooperation with retailers.
The retail branding scheme practiced in the produce sector is mainly of thesubstitution type, where the retailer draws up production standards forsuppliers. The farming practices prescribed are not always precise, andsometimes it may be necessary to ascertain whether the suppliers meet thenecessary standards. Production practices can be measured by maintaining aregister of chemical treatments, planting dates and growth measurements,soil analysis results, and other practices. However, suppliers may be grantedsome leeway, for instance, if chemical treatments are employed when pestpopulations exceed a certain threshold. To avoid this contingency resulting
40New Directions in Global Food Markets / AIB-794
Economic Research Service/USDA
in an erosion of consumer confidence, retailers may employ a set of clearstandard operating rules and ensure that suppliers are knowledgeable aboutthe procedures to be adopted. A third party may be employed to ensure thatsuppliers adhere to the standard. This produce scheme does not lead to thetype of extensive cooperation that exists when a retail brand product (otherthan the substitution type) is produced. However, retailers may also employmore complex schemes where producers and retailers mutually set standardswith the view of adopting measures to enhance environmental quality aswell as the safety and sensory attributes of products. Such arrangementsrequire confidence and long-term relationships between the parties involvedand may result in a well-differentiated product on the retail shelf (Codron etal., 2002).
Impact of Food Retail Changes on Food Quality Standards
The development of retail brands requires appropriate signaling to differen-tiate the retail brand products from standard products. To increase credi-bility, retailers can seek certification by a third party, providing theassurance that the branded products meet the necessary quality standards.Sanitary and environmental quality standards are usually established andmonitored by governments. However, differentiation and segmentation poli-cies of large-scale retailers may create standards that often exceed the setgovernment standards.
The forces in play in the European meat and produce sectors are distinctlydifferent with regard to the use of private standards. The quality and safetyassociated with meat products are clearly labeled and more easily under-stood by consumers than other food safety indicators, such as permissiblechemical residue levels on produce. For both sectors, public standards, setby individual state or European authorities, form the minimal quality stan-dards that retailers are required to meet. The meat sector is essentially anational market and is also subject to strict control by public authorities.However, the various food scares in Europe exposed weaknesses in theexisting system and led to changes in public inspection policies as well aswithin the private sector to further reduce risks associated with foodbornepathogens. State-level authorities were created to oversee food sanitationand also set minimum standards, for example, prohibiting the use of bonemeal in livestock feed.4 Several procedures, requiring regular inspection andannual submission of laws to the European Commission, were also put inplace within the framework of the EU directive 89/397, of 1989 andamended in 1993, which provides guidelines for production, processing,storage and delivery of food products in each member country.
Unlike in the beef sector, quality differentiation in the produce sector, wheresensory attributes are consumers’ primary concern, is generally not accom-panied by explicit labeling, although process attributes are valued andconsidered as contributing to the sensory attributes. Potential producequality and safety indicators, such as levels of permissible chemical residueand other associated safety measures, are also difficult to convey througheasily understood labeling. To meet consumer demand for quality, manyEuropean retailers have sought to devise appropriate labels that reflect
4 For example in France, the FrenchFood Safety Agency (AFSSA) wasestablished in 1999 to evaluate andmonitor food safety risks throughoutthe chain, from production to ultimateconsumption.
41New Directions in Global Food Markets / AIB-794
Economic Research Service/USDA

higher produce quality standards. Using the existing national and interna-tional standards as the basis, retailers have developed several private inte-grated farming standards (Codron et al., 2003). Some, such as the EUREPGAP (Good Agricultural Practices), have greatly exceeded public standards,incorporating product safety and quality, production process hygiene, envi-ronmental impacts, and working conditions.5 EUREP GAP is a collection ofBritish, Dutch, Belgian, and Scandinavian retailers. Some retailers, such asCarrefour and Auchan, view the standard as too expensive to adhere to.French and German retailers have not incorporated the standard in theirmarketing strategies and instead have chosen to differentiate their productsusing the public standard as the basis.6 These retailer standards exceed thepublic standards in some specific ways as desired by the retailer andsupported by the retailer’s consumer base.
Changes in national laws regarding minimum standards of quality mayaffect retail brand policies.7 Raising minimum standards raises differentia-tion costs and may lead large-scale retailers to pull away from theirupstream partners involved in “substitution” type brands and focus more insegments catering to niche markets. On the other hand, retailer brands mayinfluence public standards. Due to their economic weight, retailers are amajor force in driving quality standards. The diversity of retailer brandoptions available in stores often reflects the different retailer expectationsabout future changes in food quality standards. More skeptical retailers mayopt for brands that cover a wide section of their shelf space, while otherswho expect further consumer-driven enhancements in the public standardsmay devise segmentation brands covering smaller sections of the shelves.
Consumer Orientation of the Food Supply Chain
Changes in consumer preferences have driven retailers to differentiate theirproducts by creating additional value in the eyes of the consumer. The addi-tional value generated may be designed to meet consumer demands forspecial tastes, healthfulness, naturalness, and convenience. The extent ofperceived value will, among other factors, depend on the extent the retailerbelieves the supplier will be able to support the retail strategy and the extentto which the products will be perceived as good value by consumers. There-fore, food producers can join together with retailers to create value addedfor end users. A successful product differentiation requires understandingthe consumers, developing new products, and managing relationships amongthe different sectors of the supply chain.
Before retailers can begin a value-creation strategy, they must develop anunderstanding of consumers. The development of trends in consumerdemands opens up new possibilities for adding value and differentiatingproducts. Successful consumer understanding implies, among other factors,understanding the mechanisms underlying consumer food choice, the trendsin the development of major purchase motives, and the role of situationalfactors in food choice. Because of segment-specific and cultural differences,such understanding will not transfer easily from one market to another. Themore a food producer aims to build a competitive advantage based on highvalue-added products, the more it may become necessary to concentrate on
42New Directions in Global Food Markets / AIB-794
Economic Research Service/USDA
5 The EUREP GAP was launched in1997 by a group of European retailers,the Euro-Retailer Working Group, andits full membership is reserved for theretailers. Suppliers, wholesalers, andcertifying organizations can be associ-ate members.6 Among others, these may includestandards such as the Maximum Limitfor Pesticide Residues and EU ornational pesticide or environmentalregulations with regard to waterresources.7 National regulations may also set thegrades for sensory attributes, such asappearance, sugar content, and consis-tency. However, the discussion herehas focused more on standards regard-ing food safety and process attributesof food.
a few markets, where the necessary degree of consumer understanding canbe achieved (Madsen, 1990).
The new product development and differentiation process is closely linkedto markets, whereby market input is provided throughout the product devel-opment process from idea generation through concept testing to the devel-opment of prototypes. In developing new food products matching modernconsumer trends, it should be noted that many of the unique qualities ofthese products, like health effects and methods of production, are invisibleto the consumer and therefore have to be communicated. In these cases,retailers must also develop a mode of communicating and informingconsumers about the new product’s qualities. For food producers, newproduct development can be seen as a way to counter increasing retailerpower. But with the European retailers aiming increasingly for private labelproducts that not only match but surpass manufacturer brands in terms ofquality and value added, new product development in cooperation betweenretailers and producers is a field where producers and retailers can achievecompetitive advantage jointly—if they manage their relationship with thisaim in mind.
Therefore, managing relationships in the supply chain is critical to success-fully launch a private label. From the perspective of food retailers, thisimplies managing relationships with processors and producers to ensure theretailers’ call for product traceability and long-term relationships with thesesupply chain members. The importance of managing relationships becomesevident whenever product differentiation and value adding require changesin raw materials or primary supplies. Differentiation in primary productionor early in the value chain requires segregating products throughout thevalue chain.
Traceability and closer cooperation between retailers and manufacturers helpsbring about products that bear the retailer’s mark in terms of design, posi-tioning, and quality consistency. The availability of point-of-sale scanner dataenables retailers to accumulate a wealth of information regarding sales ofproducts and of determinants of sales that retailers control (such as pricepromotions and shelf allocation). Many retailers, however, have little or noknowledge of the determinants of consumer buying behavior. Manufacturers,who generally concentrate on a more narrow range of products than retailers,have a better understanding of consumer demands. Closer cooperation withupstream sectors enables retailers to draw on this expertise when developingprivate label products. Therefore, a successful new product development maybe a collaborative effort, with frequent cooperation and communicationbetween retailers, producers, and manufacturers.
Looking Ahead
Increased demand for quality has led European retailers to take proactivesteps to maintain a loyal customer base. As evidenced by the French beefand produce sectors, European retailers effectively use a combination ofprivate label and shelf-space management strategies to achieve this goal. Asfood supply chains continue to become more consumer oriented, these
43New Directions in Global Food Markets / AIB-794
Economic Research Service/USDA
strategies may be increasingly employed by retailers worldwide to meetspecific demands of different consumer groups.
The use of private retailer labels places full accountability for productquality and safety on the retailer. To ensure that these retailer-branded prod-ucts meet the desired quality and safety standards, retailers coordinate anddevelop relationships with other upstream sectors in the food supply chain.The level of coordination and cooperation depends on the desired level ofproduct differentiation. A highly differentiated product may requirecomplete coordination, and sometimes, integration of different sectors.Given future expectations of continued growth in retailer brands, foodsupply chains are likely to continue to operate in close cooperation andcoordination with other upstream sectors.
Changes occurring in food retail sectors have implications for food qualityand safety standards. As European consumers remain preoccupied withhealth and food safety issues, retail brands are often designed to assureconsumers that products are safe and wholesome for consumption. Theassurance is generally provided by third-party certification. In the wake ofseveral food scares in Europe, European consumers are often skeptical ofpublic standards. Thus, retailers differentiate products by placing a certifi-cate on the food’s label that indicates that the branded product exceedspublic safety standards. Depending on the market and retailer perceptions ofthe market, safety standards can range over a wide spectrum. With the glob-alization of food markets and multinational retail chains operating acrossnational boundaries, private standards may often be the recognized stan-dards for business transactions in many countries. Therefore, the emergenceof differentiated products and retail brands influence not only the structureof global food supply chains, but also the rules governing internationalmarketing and trade of food products.
References
Aubril, S. “Les Français Divisés Face Aux Risques Alimentaires,” LibreService Actualités, No. 1771-6, June 2002, p. 44.
Bech-Larsen, T., and K.G. Grunert. “The Perceived Wholesomeness of Func-tional Foods: A Conjoint Study of Danish, Finnish and American Consumers’Perception of Functional Foods,” Appetite, Vol. 40, 2003, pp. 9-14.
Bennett, Richard, and Douglas Larson. “Contingent Valuation of the PerceivedBenefits of Farm Animal Welfare Legislation: An Exploratory Survey,” Journalof Agricultural Economics, Vol. 47, No. 2, 1996, pp. 224-235.
Blandford, D., and L. Fulponi. “Emerging Public Concerns in Agriculture:Domestic Policies and International Trade Commitments,” European Reviewof Agricultural Economics, Vol. 26, No. 3, 1999, pp. 409-424.
Blunch, N.J., H. Skytte, and L. Esbjerg. “A Comparative Study of East andWest Europe’s Food Retailers’ Buying Behaviour,” 7th Cross-CulturalResearch Conference, Cancun, Mexico, 1999.
44New Directions in Global Food Markets / AIB-794
Economic Research Service/USDA

Brousseau, E., and J.M. Codron. “La Complémentarité Entre Formes deGouvernance: Le Cas de L’approvisionnement Des Grandes Surfaces enFruits de Contre-Saison,” Economie Rurale, No. 245-246, May-August1998, pp. 75-83.
Brunsø, K., T.A. Fjord, and K.G. Grunert. “Consumers’ Food Choice andQuality Perception,” MAPP Working Paper No. 77, Aarhus School of Busi-ness, Denmark, 2002, http://www.mapp.asb.dk.
Codron, J.M, F. Jacquet, R. Habib, and B. Sauphanor. “Rapport Sur leSecteur Arboricole, Expertise INRA,” Agriculture, Territoire et Environ-nement dans les Politiques Européennes, Les Dossiers de l’Environnementde l’INRA, INRA, France, No. 23, 2003, pp. 27-64.
Codron, J.M., J. Sterns, and X.Vernin. “Grande Distribution et AgricultureRaisonnée Dans la Filière Fruits et Légumes Frais,” Document INRA-CTIFL, Paris, 2002, p. 26.
Davidson, R. “The Emerging Retail Landscape: Winners & Losers,” Paperpresented at “Global Markets for High-Value Foods,” U.S. Department ofAgriculture, Economic Research Service, February 14, 2003,http://www.farmfoundation.org/03-38summaryandpresentations.htm
De Fontguyon, G., E. Giraud-Héraud, L. Rouached, and L.G. Soler.“Qualité des Produits et Marques de Filières,” Sociologie du Travail, Vol.45, No. 1, 2003, pp. 77-94.
Esbjerg, L., and H. Skytte. “Retail and Wholesale Buying Behaviour forTwo Different Food Products in Six Eastern European Countries,” MAPPWorking Paper, No. 66, Aarhus School of Business, Denmark, 1999,http://www.mapp.asb.dk.
Food and Agriculture Organization of the United Nations (FAO). “TheMarket for “Organic” and “Fair-Trade” Bananas,” Committee onCommodity Problems, Intergovernmental Group on Bananas and TropicalFruits, 1999, www.fao.org/docrep/meeting/XII49E.htm.
Frewer, L., J. Scholderer, and N. Lambert. “Consumer Acceptance of Func-tional Foods: Issues for the Future,” British Food Journal, Vol. 105, No. 5,October 2003, pp. 714-731.
Greene, Catherine, and Amy Kremen. “U.S. Organic Farming in 2000-01:Adoption of Certified Systems,” Agriculture Information Bulletin No. 780,U.S. Department of Agriculture, Economic Research Service, February 2003.
Grunert, K.G. “Current Issues in the Understanding of Consumer FoodChoice,” Trends in Food Science & Technology, Vol. 13, 2002, pp. 275-285.
Grunert, K.G. “How Changes in Consumer Behavior and Retailing AffectCompetence Requirements for Food Producers and Processors,” Paperpresented at “Global Markets for High-Value Foods,” U.S. Department ofAgriculture, Economic Research Service, February 14, 2003.
45New Directions in Global Food Markets / AIB-794
Economic Research Service/USDA

Grunert, K.G., K. Brunsø, L. Bredahl, and A.C. Bech. “Food-RelatedLifestyle: A Segmentation Approach to European Food Consumers,” In L.J.Frewer, E. Risvik, H.N.J. Schifferstein and R. von Alvensleben (eds.), Food,People and Society: A European Perspective of Consumers’ Food Choices,Springer Verlag, 2001, pp. 211-230.
Henson, Spencer. “Food Safety and the European Consumer,” Paperpresented at “The Food Consumer in the Early 21st Century” conference,71st EAAE Seminar, Zaragoza, Spain, April 19-20, 2001.
Hoch, S.J., and S. Banerji. “When Do Private Labels Succeed?” SloanManagement Review, Vol. 34, 1993, pp. 57-67.
KPMG. “Customer Loyalty and Private Label Products,” KPMG, London,2000.
Linéaires. Le Panorama des MDD au Rayon des Fruits et Legumes, No.174, 2002, pp. 186-192.
Lohr, L. “Factors Affecting International Demand and Trade in OrganicFood Products,” In Regmi (ed.), Changing Structure of Global FoodConsumption and Trade, Agriculture and Trade Report No. WRS-01-1, U.S.Department of Agriculture, Economic Research Service, May 2001.
Madsen, T.K. “Virksomhedens Internationale Konkurrenceevne,” Nation-aløkonomisk Tidskrift, Vol. 128, 1990, pp. 160-173.
Mazé, A. “Retailers’ Branding Strategies: Contract Design, OrganisationalChange and Learning,” Journal on Chain and Network Science, Vol. 2,No. 1, 2002, pp. 33-45.
Skytte, H., and N.J. Blunch. “Food Retailers’ Buying Behaviour: AnAnalysis in 16 European Countries,” Journal on Chain and NetworkScience, Vol. 1, No. 2, 2001, pp. 133-145.
46New Directions in Global Food Markets / AIB-794
Economic Research Service/USDA

In the past decade, the number of supermarkets2 increased in the two devel-oping regions that are growing the most rapidly—Latin America andEast/Southeast Asia. These two regions are home to 3 billion consumers,including about 700 million middle-class consumers, and are registering thefastest growth in food demand in the world. Rising consumption of fruitsand vegetables is a key component of this growth due to factors accountedfor in Bennett’s Law (Bennett, 1941), which states that the food share ofstarchy staples declines as incomes increase.
Having rapidly penetrated the food retail sector in the two regions, super-markets have triggered an upstream transformation of the fruits and vegeta-bles marketing system, all the way to the farmers. Supermarkets havebecome major buyers of local produce in the two regions, in many casesrivaling or even dwarfing the exports from the region to the rest of theworld. In countries with traditional two-tier produce markets (higher qualityexport market and a lower quality domestic market), local supermarketshave created a third market for intermediate to high quality products. At thesame time, retailers are adding upward pressure to improve product qualityand food safety in the domestic market, and the difference in qualitybetween products destined for local and export markets is narrowing.
The Rise of Supermarkets in Latin Americaand East/Southeast Asia
The diffusion and expansion of supermarkets in the developing countries isdriven by several factors. These factors are similar across countries and leadto similar results in the evolution of the retail sector. The determinants ofthe growth of supermarkets include socioeconomic factors, such as rapidurbanization, income growth, and improvements in domestic infrastructureduring the 1980s and 1990s. These changes were accompanied by womenentering the away-from-home workforce and thus experiencing an increase
1 Thomas Reardon is Professor,Michigan State University; C. PeterTimmer is Senior Research Fellow,Center for Global Development,Washington, DC; and Julio A.Berdegué is President, Rimisp,Santiago, Chile. We are grateful toDavid Boselie, Lawrence Busch, Jean-Marie Codron, Anita Regmi, andLoren Stoddard for comments.2 We use the term “supermarkets” toindicate large self-service stores,whether as part of a chain or inde-pendent. Supermarkets are generally350 to 4,000m2 in size, and have threeor more cash registers operating simul-taneously, while hypermarkets arelarger. Other large format storesinclude warehouse stores and member-ship clubs.
47New Directions in Global Food Markets / AIB-794
Economic Research Service/USDA
Chapter 4
Supermarket Expansion inLatin America and Asia
Implications for Food Marketing Systems
Thomas Reardon, C. Peter Timmer, and Julio A. Berdegué1
Economic growth and consumer demand have allured super-markets to developing countries, where they are replacing tra-ditional food retail outlets and dramatically transforming existingfood supply chains.

in their opportunity cost of time. Lifestyle changes reflected in rapid growthin ownerships of cars, access to affordable urban transport systems, and theacquisition of refrigerators in homes are also associated with supermarketgrowth. These factors are similar to the factors that have contributed to thegrowth of supermarkets in the United States over the past six decades.
The in-flow of foreign direct investment (FDI), induced by the liberalizationof FDI regulations (APEC, 2003), has also been a key determinant in theintroduction and diffusion of supermarkets in the two regions (China in1992; Brazil, Mexico, Argentina in 1994; Indonesia in 1998). While overallFDI to each region was about $9 billion per year in the early 1990s, by 2000the figure had grown to roughly $90 billion (UNCTAD, 2001). The pace ofgrowth of U.S. FDI in Asian and Latin American food industries mirrorsoverall FDI growth in the two regions (BEA, 2000).
Latin America has led the way among developing regions in the growth ofthe supermarket component of the food retail sector. While a small numberof supermarkets existed in most countries during and before the 1980s, theywere primarily financed by domestic capital and tended to exist in majorcities and wealthier neighborhoods. That is, they were essentially a nicheretail market accounting for 10-20 percent of the national food retail sales.However, by 2000, supermarkets had risen to occupy 50-60 percent ofnational food retail among the Latin American countries, almostapproaching the 70-80 percent share for the United States or France. Thus,in little more than a decade, supermarket development in Latin Americareached a level that took five decades to reach in the United States.
The supermarket share of food retail store sales for the leading six LatinAmerican countries averages 45-75 percent (table 4-1). Brazil has thehighest share, followed by Argentina, Chile, Costa Rica, Mexico, andColombia. These six countries account for 85 percent of the income and 75percent of the population in Latin America. Other countries in the regionhave also experienced rapid growth in their supermarket sectors, but forthese countries, expansion of the food retail sector started later and from alower base. For example, supermarkets accounted for 15 percent of nationalfood retail sales in Guatemala in 1994 and today account for 35 percent.
48New Directions in Global Food Markets / AIB-794
Economic Research Service/USDA
Table 4-1—Supermarket share in national food retail (Latin America)
Supermarket share in national retail
Country Past 2001
Percent
Argentina 17 in 1985 57Brazil 30 in 1990 75Chile NA 50Colombia NA 38Costa Rica NA 50Guatemala 15 in 1994 35Mexico NA 45
United States 5-10 in 1930 80 in 2000
Note. NA = not available.
Source: Reardon, T., and J.A. Berdegué, 2002.

The development of the supermarket sector in East/Southeast Asia is gener-ally similar to that of Latin America, but the “takeoff” stage of supermarketsin Asia started, on average, some 5-7 years behind that of Latin America,and it has registered even faster growth. The average share of supermarketsin overall food retail sales (urban plus rural, excluding fresh food in theACNielsen statistics, hence excluding fruits and vegetables, fresh meat, andfish) is 33 percent for several Southeast Asian countries (such as, Indonesia,Malaysia, and Thailand), but is 63 percent for East Asian countries(Republic of Korea, Taiwan, and Philippines). As applicable in LatinAmerica, supermarket share of national retail sales of fresh foods usually isroughly one-half of the share of sales of processed foods, hence the super-market share is 15-20 percent in Southeast Asia and 30 percent in East Asia,excluding China. In 2001, the supermarket share of Chinese urban foodsales was 48 percent, up from 30 percent in 1999 (table 4-2). Assuming theurban share of the total Chinese population to be approximately one-third,the supermarket share of national retail sales of processed foods is around20 percent, similar to the supermarket share of overall food retail sales forBrazil or Argentina in the early 1990s. However, the rate of growth in thenumber of stores is three times faster in China than it was in Brazil andArgentina in the 1990s.
Three major trends have characterized the development of the supermarketsector in the two regions. First, the supermarket sector is increasinglyforeign owned. In Latin America, for example, global multinationals consti-tute roughly 70-80 percent of the top five supermarket chains per country onaverage. The in-flow of FDI in the food retail sector was led by global retailmultinationals. For example, in the first eight months of 2002, five globalretailers (British Tesco, French Carrefour and Casino, Dutch Ahold andMakro, and Belgian Food Lion) invested 6 billion bhat, or $120 million, inThailand (Jitpleechep, 2002). Wal-Mart invested $660 million over the pastyear in Mexico to build new stores. Licensing agreements have also addedto the growth of supermarkets in Asia, without requiring FDI.
Second, the supermarket sector is undergoing rapid concentration in the tworegions, mirroring trends in the developed regions. In Latin America, the topfive chains per country account for 65 percent of the supermarket sectorsales (compared with 40 percent in the United States and 72 percent inFrance). About 3 of every 10 pesos’ worth of food expenditures in Mexicoare captured by Wal-Mart—rates are similar for Ahold in Costa Rica and
49New Directions in Global Food Markets / AIB-794
Economic Research Service/USDA
Table 4-2—Supermarket share in national food retail (Asia)
Supermarket share in national retail
Country 1999 2001
Percent
China (urban) 30 48Indonesia 20 25Korea 61 65Malaysia 27 31Philippines 52 57Taiwan 65 69Thailand 35 43
Source: Hu et al., 2005.
Carrefour in Argentina. Concentration in the sector results from foreignacquisition of local chains, facilitated by an in-flow of FDI.
Third, supermarkets are no longer niche operations catering only to the richor even the middle class—they have spread well beyond to penetrate thefood markets of the poor. They have also spread from big cities to interme-diate towns, and, in some countries, even to small towns in rural areas.About 40 percent of Chile’s smaller towns now have supermarkets. Andsupermarkets are spreading fast beyond the top 60 cities of coastal China tosmaller cities, including those in the poorer and more remote northwest,southwest, and the interior.
The success and proliferation of supermarkets are linked to their ability tooffer low prices, allowing them to compete with—and beat—wetmarkets(produce markets in central plazas or streets) and small family-run stores.To expand beyond their traditional niches among higher income consumers,supermarket chains in Latin America and Asia emphasize price competitive-ness and products of a quality consistently higher than that found in tradi-tional marketplace. The focus on quality and product differentiation,particularly among upper income segments, is similar to supermarket strate-gies in Europe.3 Supermarkets have sharpened this focus by improvingdistributional channels through logistical improvements to the procurementprocess. These changes are noted both for processed/packaged goods(including processed fruits and vegetables), where large stores have anatural advantage due to economies of scale, and for fresh produce.
Fruits and Vegetables Retail Sector
The replacement of traditional markets with supermarkets has been slowerin the fresh produce sector, compared with other food sectors. Small shopsand wetmarkets, such as feria libres in Chile or warungs in Indonesia,continue to be convenient options for urban residents shopping for produce.However, competitive prices and higher quality produce are helping super-markets make inroads in this area. Supermarkets offer convenient “one-stop” shopping, with an increasing range of products and services, includingbanking facilities, food courts, and nonfood products. Additionally, super-markets are mimicking the sales styles and appearance of wetmarkets as away to gain competitive edge by presenting a familiar and reassuring atmos-phere to customers. In Chile, for example, some supermarkets sell fruits andvegetables in big wooden bins and emphasize personalized attention toshoppers, similar to strategies employed in the traditional feria libres.
Municipal government regulations designed to improve sanitary conditionsand reduce urban congestion have added further pressure on wetmarkets, ineffect favoring the growth of supermarkets. Wetmarkets in China, forexample, are increasingly targets of municipal government regulations andpressures (Moustakerski and Brabant, 2001).
Facing competition from supermarkets and pressures from municipalgovernments, wetmarkets have been forced to change. In Chile andMalaysia, for example, recent movements to upgrade wetmarket facilitiesand improve procurement processes are emerging. Some wetmarkets have
3 The emphasis in Europe is to providedifferentiated products that meet con-sumer perceptions of higher quality,which may generally result in higherprices.
50New Directions in Global Food Markets / AIB-794
Economic Research Service/USDA
even adopted hygienic practices and collective, large-volume procurementarrangements employed by supermarkets. Thus, suppliers to the “traditionalretail sector” are facing procurement practices very much like those used inthe supermarket sector. Therefore, the emergence of supermarkets in devel-oping countries has implications for the entire food marketing system.
In Latin America, the supermarket share of the fruits and vegetables retailsector is about one-half to two-thirds of the supermarket share in overallfood retail. For example, supermarkets have 50 percent of the fresh producemarket in Brazil but 75 percent of overall food retail. In Argentina, theshares are approximately 30 percent (fresh produce) and 60 percent (overallretail). Still, the growth in supermarket sales of fruits and vegetables, thoughslower than sales of other food products, has been significant. In Brazil,fresh fruits and vegetables were sold nearly exclusively outside supermar-kets during the 1980s, but now make up about 50 percent of total freshproduce sales in the country.
Fresh fruits and vegetables typically constitute about 8-12 percent of totalsupermarket food sales in Latin America and Asia. Fresh produce is strategi-cally important in attracting customers into the stores. As incomes rise,consumer demand for fresh produce is expected to grow, increasing theimportance of this food category to retailers. As the demand for year-roundavailability of high-quality, diverse, fresh produce and value-added productsin the region grows, retailer demand for these products from local producerswill also grow. The conventional belief that two produce markets exist—thelocal market (associated with lower standards) and the export market (asso-ciated with high standards)—is changing with the emergence of local super-markets as a new market for produce. Latin American supermarkets sellroughly 2.5 times more produce to local consumers than the quantityexported from the region to the rest of the world (Reardon and Berdegué,2002). In Asia, sales of fruits and vegetables through supermarkets are simi-larly sizeable, with Chinese supermarket sales of fruits and vegetablesapproximating $2 billion, compared with Chinese exports at $1.7 billion onaverage over 1995-2000 (Gale, 2002). According to the Food and Agricul-ture Organization of the United Nations, Indonesian supermarkets soldroughly $500 million of fruits and vegetables (nearly all bought from localfarmers) in 2001. Indonesian produce exports during the period were about$286 million.
The Changing Supply Chain
Compared with practices in North America or Europe, produce marketing inLatin America and Asia is constrained by poor institutional support and aninadequate public infrastructure (such as roads). Private infrastructure, suchas packing houses, cold chain facilities, and shipping equipment linkingsuppliers and distributors, may also be inadequate. Risks and uncertainties,both in output and in responsiveness to incentives, prevail. The risks mayarise due to lack of timely availability of sufficient credit, third-party certifi-cation, inadequate market information, and onerous regulations. These prob-lems constrain supplier response to incentives. For example, vegetablesuppliers to Hortifruti, the buying agent for the main supermarket chain in
51New Directions in Global Food Markets / AIB-794
Economic Research Service/USDA

Nicaragua, are hampered by the country’s restrictions on vegetable seedimports (Gonzalez, 2002).
Therefore, supermarkets in these regions face considerable challenges indeveloping an efficient supply chain to support profitable sales of fruits andvegetables. In Thailand, 250 suppliers delivered perishable products directlyto the backdoor of supermarkets (Ahold chain) at least three times a week in2002. Incidents of out-of-stock were common and shrinkage in the storeswas high. The lead times between the farms and supermarket shelves wasup to 60 hours, and due to the lack of pre-cooling and cooled transportation,the post-harvest losses were high. It was impossible to trace products backto the farm; there was no insight into farming practices and post-harvestpractices. There were no clear uniform product specifications that could becommunicated throughout the supply chain (Boselie, 2002, p. 5.)
As supermarkets strive to compete in fruit and vegetables markets and to meetthe varied demand of consumers, they must also develop a procurementsystem that reduces purchase and transaction costs and raises product quality.In many developing countries, supermarkets attempt to do this by imple-menting a series of changes in the marketing system, ranging from adjust-ments in the procurement system to technological and institutional changes.
Centralization of Procurement
As the number of stores in a given supermarket chain grows, there is atendency to shift from a per store procurement system to a centralized distri-bution system serving several stores in a given zone, district, country, orregion (which may cover several countries). Centralization is generally char-acterized by increased use of centralized warehouses. Additionally, central-ization extends to procurement decision-making processes and physicalproduce distribution processes. Centralization can increase efficiency ofprocurement by reducing coordination and other transaction costs, althoughit may increase transport costs by extra movement of the actual products.
Large global retailers have made or are making shifts toward more central-ized procurement systems in all the regions in which they operate. Wal-Martuses a centralized procurement system in most of its operating areas.Carrefour has centralized procurement in France, and is moving quickly tocentralize its procurement systems in other countries, such as Brazil, whereit established a distribution center in São Paulo to serve three BrazilianStates (with 50 million consumers) with 50 hypermarkets in the southeastregion, and in China. Ahold centralized its procurement systems in Thailand(Boselie, 2002) and is also moving to centralize its distribution centers inCentral America in the next 1-2 years via a specialized wholesaler,Hortifruti (see box on Hortifruti).
Regional chains, such as China Resources Enterprises (CRE) of HongKong, which operates Vanguard stores in southern China, are also central-izing their procurement systems. CRE operates approximately 456 foodretail outlets in Hong Kong and mainland China, many in the provinces ofShenzhen and Guangdong. In anticipation of growth following its planned$680-million investment in China over the next 5 years, CRE is shifting
52New Directions in Global Food Markets / AIB-794
Economic Research Service/USDA
from store-by-store procurement to a centralized system of procurementcovering each province. In 2002, CRE completed construction of two largedistribution centers.
Logistics Improvements
To defray some of the added transport costs that arise with centralization,supermarket chains have adopted (and required that suppliers adopt) bestpractice logistical technology. In accordance with these changes, super-market suppliers are required to adopt practices and make physical invest-ments that enable a more seamless interface with the chain’s warehouses.The “Code of Good Commercial Practices” signed by supermarket chainsand suppliers in Argentina illustrates the move toward requiring the use ofbest practice logistics by retail suppliers (Brom, 2002). Similar trends arenoted in Asia. For example, Ahold instituted a supply improvement programfor vegetable suppliers in Thailand, specifying post-harvest and productionpractices to ensure consistent supply and improve the efficiency of theiroperations (Boselie, 2002).
As evident elsewhere,4 retail chains in Latin America and Asia increasinglyoutsource logistics and wholesale distribution functions, entering jointventures with other firms. For example, the Carrefour distribution center inBrazil is the product of a joint venture of Carrefour with Cotia Trading (amajor Brazilian wholesaler distributor) and Penske Logistics (a U.S. globalmultinational firm). Similarly, Wu-mart of China announced in March 2002(CIES, 2002) that it will build a large distribution center to be operated jointly
4 For example, several Ahold chains(Stop and Shop, Tops, and Giant) in thenortheastern part of the United Statesoutsource wholesale distribution for drygoods with C&S Wholesale Grocers,Inc. located in Vermont.
53New Directions in Global Food Markets / AIB-794
Economic Research Service/USDA
Hortifruti is the “buying arm” of most of the stores belonging to theCentral American Retail Holding Company (CARHCO). This companycomprises 253 stores, with retail store sales of about $1.3 billion per yearin five countries. CARHCO is a joint venture of Ahold, with majorityinterest, and two retail chains in the region, La Fragua (based inGuatemala) in 1999, and CSU (based in Costa Rica) in 2002. Hortifruti hasemerged as the regional chain’s specialized produce wholesaler for three ofthe five countries in which the chain operates in the region (all but ElSalvador and Guatemala). Hortifruti contracts with farmers and distributesthe produce to retail stores with the private label “Hortifruti” on a widevariety of fruits and vegetables. A visit to any of the Hortifruti warehousescan provide a perspective on the large scale of its operation. For example,the Hortifruti warehouse in Nicaragua contains a variety of vegetables fromCosta Rica; onions from California and Canada; apples from Michigan,Oregon, Washington, and Chile; and garlic from China. About 30 percentof the produce in CARHCO stores in Nicaragua is currently imported.Although some products may come from countries in Asia, most productsare imported from other countries in the region, especially Costa Rica.Most of the imported produce reaches CARHCO’s retail shelves throughits main buying arm, Hortifruti.
Hortifruti, A Specialized Wholesaler for a Central American Regional Chain

with Tibbett and Britten Logistics (a British global multinational firm).Ahold’s distribution center for fruits and vegetables in Thailand is operated inpartnership with TNT Logistics of the Netherlands (Boselie, 2002).
Specialized Wholesalers
Changes in supplier logistics have moved supermarket chains toward newintermediaries, sidestepping or transforming the traditional wholesale system.Supermarkets are increasingly working with specialized wholesalers, dedi-cated to and capable of meeting retailers’ specific needs. These specializedwholesalers cut transaction and search costs and enforce private standardsand contracts on behalf of the supermarkets. The emergence and operation ofspecialized wholesalers has promoted the convergence, in terms of playersand product standards, of the export and the domestic food markets.
Supermarkets naturally tend toward relationships with export and agribusinessfirms in the belief that these companies can provide the requisite quality assur-ance, the necessary volumes, and consistent and on-time delivery. Therefore,many supermarket chains in Latin America sought to reduce reliance on tradi-tional wholesale markets (Gutman, 2002; Farina, 2002, Mainville, 2002).Various leading agribusiness firms in the region established new divisions intheir companies to cater specifically to supermarkets in their countries(Schwentesius and Gomez, 2002). Moreover, there is emerging evidence thatsupermarket chains sourcing imported produce tend to do so mainly viaspecialized importers. For example, hypermarkets in China tend to work withspecialized importers/wholesalers of fruit, and in turn sell nearly half of theirimported products to supermarket chains (Produce Marketing Association,2002). Similarly, Hortifruti functions as the buying arm of most stores of themain supermarket chain in Central America (see box on Hortifruti).
However, some traditional wholesalers have upgraded their operation tomeet the new demands of the retailers. For example, a number of whole-salers operating in the traditional wholesale market in Brazil set up special-ized large-scale operations catering to the supermarkets (Mainville, 2002). Anumber of grower/packer organizations have made needed investments tointerface with the logistics systems of the specialized wholesalers and/orsupermarket distribution centers. These alliances between the retailer andthe wholesaler or the grower/packer tend to be bound by contractualarrangements. Smaller and more regional/local chains tend to continue torely on traditional wholesale markets.
Producer Alliances
As supermarkets are driven to reduce transaction costs and seek one-stopalliances with suppliers and wholesalers, there is a concomitant change inthe organization of the upstream segments of the supply chain, includingamong the suppliers. This upstream change is closely associated withretailer strategies. The increasing concentration of the supermarket sector,combined with the goal of supermarkets to have year-round supplies ofvarious fresh products, has induced a growing wave of horizontal jointventures and other strategic alliances between produce firms in the Northernand Southern Hemispheres. Suppliers in different hemispheres that form
54New Directions in Global Food Markets / AIB-794
Economic Research Service/USDA

partnerships are no longer constrained in meeting the necessary volume andyear-round demand of the retail sector. For example, Global Berry Farmswas formed in 2000 as a 50/50 joint venture owned by Michigan BlueberryGrowers Marketing (a cooperative) and Hortifrut (a private firm) of Chile.Global Berry Farms markets all fresh fruits for Michigan Blueberry Growersworldwide and Hortifrut’s fresh fruit in the North American market. InAugust 2002, the two firms were joined by Naturipe, a strawberry coopera-tive in California (see box on cross-hemisphere alliance).
Information Exchanges
The use of electronic data exchange (EDI) is becoming increasinglycommon between large chains and their major suppliers in different regions,particularly dry goods supplies. The EDI system of Wal-Mart has been andis a model for the industry,5 allowing Wal-Mart to send out orders, verifythe receipt of orders by suppliers, schedule delivery, and provide data onsales to enable suppliers to manage inventory.
Internet exchanges are also used by chains globally to reduce coordinationcosts and outsource logistics operations. Similar to the way they outsourcephysical procurement logistics through wholesale distributors, retailers maynow outsource produce transactions, distribution, and inventories throughInternet exchanges.6 These may include Internet business-to-business (B2B)exchanges, and e-procurement and logistics services. Globally, there areseveral main “general” Internet B2B exchanges into which large retailchains made major investments during the late 1990s and early 2000s (seebox on WorldWide Retail Exchange). Each exchange has a perishablesexchange component, generally strengthened by a joint venture with anexchange specializing in perishables. As day-to-day management of perish-ables transactions is costly, Internet exchange services specializing in freshproduce may likely grow.
Private Standards
While fruits and vegetables retailing in Latin America and Asia previouslyoperated with limited use of certifications and standards, emerging trendssignal a rapid rise in the implementation of standards. Retailers use privatestandards to standardize product requirements over suppliers, who maycover many regions or countries. Standards specify and harmonize theproduct and delivery attributes, thereby enhancing supply chain efficiencyand lowering transaction costs. Private standards of a given chain may alsobe designed to ensure (at a minimum) that public standards are met in allthe markets in which the retail chain operates. Often, retailers may designprivate standards as substitutes for missing or inadequate public standards(Reardon and Farina, 2002). In this respect, private standards can functionas competitive arms against other retail outlets by supporting claims ofsuperior product quality attributes. The private standards may cover detailedquality specifications as well as food safety requirements, normally goingbeyond public food safety regulations. For example, Ahold’s private stan-dards are implemented across its chains in Central America, includingGuatemala, where the food safety law enacted in 2001 has yet to be imple-mented (Flores, 2002).
5 Wal-Mart China is known to screensuppliers in part on their ability tointerface via EDI (www.wal-martchina.com, 2003).
6 The exception is Wal-Mart, whichexclusively uses its own electronicdata exchange system.
55New Directions in Global Food Markets / AIB-794
Economic Research Service/USDA

The evolution of private standards in Latin America and Asia is also drivenby multinational retailers striving to converge between the private standardsapplied by the chain in developed countries and in developing countries. Atthe global level, the Global Food Safety Initiative of CIES (Food BusinessForum, headquartered in Paris), the global association of the top 250retailers and roughly the same number of their major suppliers, seeks toimplement a scheme to benchmark food safety standards among retailersand their suppliers worldwide by 2004. European retailers have developed
56New Directions in Global Food Markets / AIB-794
Economic Research Service/USDA
Global Berry Farms was formed in 2000 as a joint venture betweenMichigan Blueberry Growers Marketing and Hortifrut of Chile. Created in1936 and with sales exceeding $63 million in 2000, Michigan BlueberryGrowers is the single largest marketer of fresh and processed cultivatedblueberries in North America. It represents over 550 producers inMichigan, Indiana, Georgia, and Florida. Hortifrut (separate fromHortifruti) is a leading bush berry grower in Chile, Mexico, and Spain. In2002, Global Berry Farms added a strawberry supplier, Naturipe of Cali-fornia, to the joint venture. The combined resources of its founding part-ners enable Global Berry Farms to offer almost year-round delivery of thecomplete berry category (blueberries, blackberries, raspberries, and straw-berries) to retailers in the Americas and, increasingly, in Europe (Nevenand Reardon, 2002).
Cross-Hemisphere Producer Alliance Assures Year-Round Fruit Supply
WorldWide Retail Exchange is the largest Internet-based business-to-busi-ness (B2B) exchange for food retailers and their suppliers, with annualtransactions of $9 billion. WWRE currently has 62 members includingAhold and Tesco, as key food retail “anchors.” WWRE also includes anumber of Asian and Latin American retailer participants. Some partici-pating chains from those regions include Dairy Farm International of HongKong, which has annual sales of $3.7 billion from 2,160 retail outlets ofdiverse formats in Southeast Asia, China, and, recently, India; the LotteGroup of South Korea; Makro-Asia (Makro is based in the Netherlands);and Comerci—a joint venture with Costco operating in Mexico.
To improve its services in the fruits and vegetables sector, WWRE entereda joint venture with Agribuys in April 2001. Agribuys is an Internet B2Bexchange headquartered in the United States, with offices in the UnitedStates and Japan. Agribuys specializes in fresh produce supply chain andtransaction management, including orders, deliveries, auctions, and inven-tories. WWRE also enhanced its supply and delivery management systemthrough a joint venture with www.globalsources.com, an Internet B2Bnetwork featuring 140,000 Asian suppliers and 369,000 buyers in 230countries and territories (www.globalsources.com, 2002a).
WorldWide Retail Exchange, the Largest Internet Exchange for Retailers

the EUREP GAP standard for farm and post-harvest level food safety andphytosanitary practices. Pick N Pay supermarkets in South Africa imposethis standard on local suppliers (Weatherspoon and Reardon, 2003). Conver-gence of standards and practices is not only driven by retailers but also byconsumers and nongovernmental organizations. For example, Greenpeacepicketed Carrefour stores in Thailand in 2002 requesting that the Thai storesimplement the same biotech labeling as implemented by Carrefour stores inEurope.
Contracts
The “formality” of contracts is relatively new in one of the most personal-ized, informal markets in the food sector, the produce sector. Producesuppliers in Asia and Latin America traditionally operated under verbalinformal contracts, renewed upon continued good performance. This systemis increasingly being replaced by formal contracts drawn between retailersand suppliers to guarantee supply volumes with lower risks and reducedtransaction costs. Additionally, contracts ensure retailers of on-time deliveryand the delivery of products with desired quality attributes. Contracts alsoserve as incentives to the suppliers to stay with the buyer and, over time,make investments in assets (such as learning and equipment) specific to theretailer’s specifications regarding the products.
Although supermarkets in the two regions are increasing their use ofcontracts, contract use still appears to be patchy. Contract use is generallylimited among smaller farmers selling to the supermarkets (Lourenzani etal., 2002; Boselie, 2002). In many cases, the supermarkets may procure theirproduce from specialized wholesalers (under contract), direct informal rela-tionships with growers, and traditional wholesale markets (see box onprocurement strategies). Supermarkets announce the needed volumes, theprocurement prices, and the requisite private standards for the products. Thesuppliers then vie for this market, which offers modest to moderatepremiums over the traditional wholesale market. In such an arrangement,formal contracts are not used with growers and suppliers from the tradi-tional wholesale market.
However, in conjunction with the establishment of private standards, contractuse is increasing and several supermarket chains have implemented “lead” or“preferred” suppliers programs. These programs involve setting benchmarksand entering into annual contracts with suppliers. Supermarkets often main-tain a list of preferred suppliers who meet the necessary specifications andare reliable and consistent. Such programs have been implemented by manymultinational retailers. For example, Ahold undertook a vegetable supplychain improvement program in Thailand. This program has evolved from theobjective of optimizing chain performance by reducing handling losses toconcepts of HACCP management and environmental land-use practices,including reducing pesticide use (Boselie, 2002). The achievement of theselater objectives required more formal contractual arrangements.
Supermarket chains may also employ intermediaries, such as Hortifruti inCentral America, to set up lists of producers. This system functions as aninformal contract in that the growers are selected and provided input credit
57New Directions in Global Food Markets / AIB-794
Economic Research Service/USDA

and product specifications. The growers are informed of the needed volumesand prices, delivery dates, and the required private standards of quality andsafety. The intermediaries set up collection centers in different growing areasand deliver the produce to the stores from these centers. Suppliers can bedelisted if they do not comply with the specifications or pay back their credit.
The changes in the food retail sector have also contributed to the establish-ment of voluntary codes of conduct between the involved sectors of the foodsupply chain. These codes, implemented in the private sector, emerged afterprivate sector conflict and negotiations, usually under the regulatory over-sight of a government competition commission (Brom, 2002). The codes are“voluntary” versions of similar codes embedded in public regulations, suchas PACA (Perishable Agricultural Commodities Act) in the United States.The codes focus on requiring transparent and fair contracts, reasonablepayment periods, and investments by both parties to promote convergenceof logistical interfaces to increase efficiency in the supply chains. In severalcountries, such as Argentina (Code of Good Commercial Practices of 2001),the voluntary codes were followed by the enactment of related public regu-lations. Among other things, the regulations include time limits for retailerpayments to suppliers.7 Similar voluntary codes are emerging in Costa Ricaand Colombia and are also currently being considered in Brazil.
Looking Ahead
The changes taking place in produce marketing in Latin America and Asiaare deeply transforming the sector. A wider variety of products associatedwith higher quality and safety standards are available year-round at afford-able prices. With growing consumer demand and improvements in retailing,local supermarkets have emerged as an important market for locallyproduced fruits and vegetables. As supermarkets employ quality standards,there is a trend (with the speed varying over countries and zones) toward
58New Directions in Global Food Markets / AIB-794
Economic Research Service/USDA
Supermarkets employ complex procurement strategies to meet their supplyrequirements. At times, these strategies may involve contracts with somesuppliers to “lock in” the best suppliers for a portion of their produce andsuccessfully communicate their private standards. This arrangement isillustrated by the citrus market in Mexico (Schwentesius and Gomez,2002). Supermarket chains in Mexico employ a trifurcated procurementsystem. For about one-half to two-thirds of oranges, retailers may signcontracts with large-scale suppliers, while for one-third to one-half of theneeded supply of oranges, retailers may accept deliveries by medium-sizedgrowers directly to their distribution centers without entering a formalcontract. In the latter case, retailers rely on short-term verbal agreementsand an implicit understanding that the supplier is required to meet theprivate standards and the logistics-interface requirements. Finally, for one-tenth to one-fifth of the needed supply of oranges, supermarket procure-ment agents send trucks to the wholesale (spot) markets and pick the bestand cheapest oranges, supplied mainly by smaller growers.
Complex Procurement Strategies Meet Supply Requirements
7 Similar regulation was enacted bythe Prompt Payment Law of 1993 inthe United States.

convergence of local and international standards, with decreasing distinc-tions between products destined for the local market and the export market.
The general upgrading of standards and the modernization of the sectoroffers opportunity to those producers who can adapt to the changes. Forexample, securing contracts with Carrefour has been particularly profitablefor melon growers in northeast Brazil, both for sales in Brazil and for salesto Carrefour in other countries through the international procurement systemof Carrefour, as local supply contracts can be parlayed into export opportu-nities. However, increasing use of standards and contracts can present chal-lenges to smaller farmers and firms in marketing their products. The higherstandards demanded often require investments that the smaller firms andfarms may be unable to undertake. Accordingly, the emerging evidencepoints to a preference by supermarkets to source from larger producers, andthus, controlling for procurement volumes, to relative exclusion of smallerfarmers in Latin America and Asia. For example, ASUMPAL (a cooperativesupplying salad tomatoes, with stringent specifications, to McDonald’s inGuatemala) experienced a decrease in members from 330 in 2000 to 30 in2001 to 6 in 2002 (Flores, 2002). Similarly, during the course of the 1990s,the 12 largest milk processors delisted 60,000 small dairy farmers in Brazil(Farina, 2002). The exclusion of smaller suppliers is not limited to LatinAmerica, in 2001, the number of vegetable suppliers to Tops Supermarket(Ahold chain) in Thailand fell from 250 to 60 (Boselie, 2002).
The decline in the number of small producers supplying supermarkets isparticularly of concern in Latin America and Asia, where millions of ruralpoor seek agricultural diversification and urban markets as an escape routefrom poverty. Therefore, local governments and donors need to considerpolicies aimed at enhancing the ability of small farmers to compete in thechanging retail food sectors. For example, a small-farmer vegetable cooper-ative in Purranque became the vegetable supplier for a regional chain insouthern Chile, with the help of INDAP, the Chilean Agricultural Develop-ment Agency.
References
APEC. 2003, http://203.127.220.67/apec/about_apec.html.
Bureau of Economic Analysis (BEA). U.S. Direct Investment Abroad:Operations of U.S. Parent Companies, U.S. Department of Commerce,2000. http://www.bea.gov/bea/di/di1usdbal.htm.
Bennett, M.K. “Wheat in National Diets,” Wheat Studies, Vol. XVIII, No. 2,Food Research Institute, October 1941, pp. 37-76.
Boselie, D. Business Case Description: TOPS Supply Chain Project,Thailand, Agrichain Competence Center, Den Bosch, KLICTInternational Agri Supply Chain Development Program, 2002.
Brom, F. Experiencia Argentina: Relación Entre Los Proveedores Y LosSupermercados, Speech at the 7th Biennial Congress of the Costa RicanFood Industry Chamber of Commerce, Costa Rica, June 2002.
59New Directions in Global Food Markets / AIB-794
Economic Research Service/USDA

China Resources Enterprise. “Retailing Strategies and Execution Plan, July2002,” posted on Web site of China Resources Enterprise, Limited, 2002,Hong Kong.
CIES. “Wu-mart Sets Sights on Major Expansion in China,” Food BusinessForum—News of the Day, February 5, 2002.
CIES. “Wellcome Pursues Store Development,” Food BusinessForum—News of the Day, September 2, 2002.
CIES. 2003, http://www.ciesnet.com.
Farina, E.M.M.Q. “Consolidation, Multinationalisation, and Competition inBrazil: Impacts on Horticulture and Dairy Products Systems,” DevelopmentPolicy Review, Vol. 20, No. 4, September 2002, pp. 441-457.
Flores, L. “Private Standards for Food Safety and Supermarkets inGuatemala,” Working Paper, Michigan State University, 2002.
Gale, F. “China at a Glance: A Statistical Overview of China’s Food andAgriculture,” in Fred Gale (ed.), China’s Food and Agriculture: Issues forthe 21st Century, Agriculture Information Bulletin No. 775, U.S.Department of Agriculture, Economic Research Service, 2002.
GlobalSources.com. “Global Sources Reports Profitable Third Quarter andContinued Expansion in China,” Press release, November 21, 2002.
Globalsources.com. “WorldWide Retail Exchange and Global Sources ToDevelop Asian Supplier Sourcing Program,” Press release, November 25,2001.
Gonzalez, Armando. Personal communication with author, Director ofHortifruti, Nicaragua, November 2002.
Gutman, G.E. “Impact of Rapid Rise of Supermarkets on Dairy ProductsSystems in Argentina,” Development Policy Review, Vol. 20, No. 4,September 2002, pp. 409-427.
Hu, Dinghuan, Thomas Reardon, Scott Rozelle, Peter Timmer, and HonglinWang. “The Emergence of Supermarkets With Chinese Characteristics:Challenges and Opportunities for China’s Agricultural Development,”Development Policy Review, Vol. 22, No. 5, September 2005, pp. 557-586.
Jitpleechep, S. “Who Is Who,” Bangkok Post, August 28, 2002, posted onwww.siamfuture.com.
Lourenzani, A.E.B.S., S.M.D.A. Schiavi, A.L. da Silva, and H.M. de SouzaFilho, “Avaliação da Domercialização de Produtos Hortícolas asProvenientes da Agricultura Familiar: Barreiras e Oportunidades,”Sociedade Brasileira de Economia e Sociologia Rural (SOBER), PassoFundo, Rio Grande do Sul, July 29-31, 2002.
Mainville, D.Y. “Fresh Produce Markets in São Paulo: RecentDevelopments, Trends and Implications for Market Structure,” SociedadeBrasileira de Economia e Sociologia Rural (SOBER), Passo Fundo, RioGrande do Sul, July 29-31, 2002.
Moustakerski, P., and L. Brabant. “People’s Republic of China: Retail FoodSector Report 2001,” Global Agricultural Information Network Report
60New Directions in Global Food Markets / AIB-794
Economic Research Service/USDA
No. CH1810, U.S. Department of Agriculture, Foreign AgriculturalService, November 2001.
Neven, D., and T. Reardon. “Modal Choice in International AlliancesBetween Producers of Horticultural Products,” Selected paper, 12thAnnual IAMA Meetings, June 2002.
Produce Marketing Association. “China: Produce Industry Market ResearchStudy,” Final report submitted to 2001 Emerging Markets Program, U.S.Department of Agriculture, Foreign Agricultural Service, 2002.
Reardon, T., and J.A. Berdegué. “The Rapid Rise of Supermarkets in LatinAmerica: Challenges and Opportunities for Development,” DevelopmentPolicy Review, Vol. 20, No. 4, September 2002, pp. 317-334.
Reardon, T., and E.M.M.Q. Farina. “The Rise of Private Food Quality andSafety Standards: Illustrations from Brazil,” International Food andAgricultural Management Review, Vol. 4, 2002, pp. 413-421.
Schwentesius, R., and M. Gomez. “Supermarkets in Mexico: Impacts onHorticulture Systems,” Development Policy Review, Vol. 20, No. 4,September 2002, pp. 487-502.
United Nations Commission on Trade and Development Geneva (UNCTAD). World Investment Report 2001: Trends and Determinants,2001.
Weatherspoon, D.D., and T. Reardon. “The Rise of Supermarkets in Africa:Implications for Agrifood Systems and the Rural Poor.” DevelopmentPolicy Review, May 2003, Vol. 21, No. 3, pp. 333-355.
61New Directions in Global Food Markets / AIB-794
Economic Research Service/USDA

Global food manufacturing comprises a wide array of industries, each usingdifferent inputs and producing goods that require specific marketingexpertise and brands for individual markets. Unlike other manufacturingindustries, such as the automobile industry, the chemical industry, and thepharmaceutical industry, the food industry is not dominated by large firmswith manufacturing facilities in a few locations. Rather, manufacturingactivities are dispersed across the globe, as manufacturers prefer to locatetheir production units relatively close to their consumer base. Both large andsmall food firms have unique advantages that allow them to coexist incommon markets. In the United States, for example, the largest firms arefurther expanding and, at the same time, many smaller firms are entering themarket (Rogers, 2001).
Size, degree of product diversification, and ownership structure areimportant characteristics of food companies. Some companies arepublicly owned, others are privately owned, while others, known as coop-eratives, are owned by producers of raw agricultural commodities.Regardless of the size or the ownership structure, successful firms estab-lish a recognized identity by manufacturing products noted for theirquality, value, or other attributes desired by consumers. Firms with flex-ible organizational structures that enable adjustments at various stages ina supply chain are particularly well suited for reorienting themselves incontinuously changing markets.
Capital constraints for investment abroad and member resistance to organi-zational changes render cooperatives less likely to compete globally(Gehlhar et al., 2004). Accordingly, some cooperatives are experiencingdifficulties, but others are emerging as players in the global marketplace inpart because of their members’ willingness to produce products better suitedfor the supply chain. Given their link to other members of the supply chain,producer-owned cooperatives would seem to be well equipped to respond tochanging consumer demand.
1 Chris Bolling and Mark Gehlhar areeconomists, ERS/USDA.
62New Directions in Global Food Markets / AIB-794
Economic Research Service/USDA
Chapter 5
Global Food ManufacturingReorients To Meet
New DemandsChris Bolling and Mark Gehlhar1
Consumer-driven adjustments in food supply chains are shap-ing the strategies and realignments of food manufacturing firmsas they strive to take advantage of the shifting and newdemands of global consumers.
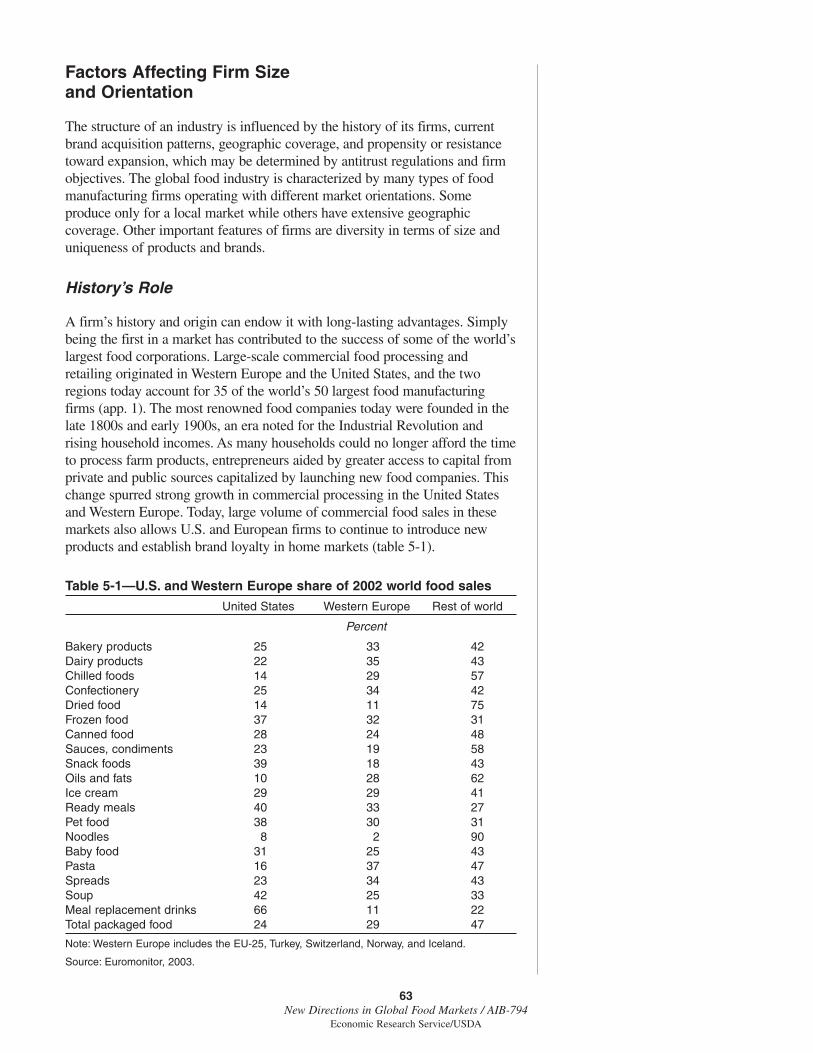
Factors Affecting Firm Size and Orientation
The structure of an industry is influenced by the history of its firms, currentbrand acquisition patterns, geographic coverage, and propensity or resistancetoward expansion, which may be determined by antitrust regulations and firmobjectives. The global food industry is characterized by many types of foodmanufacturing firms operating with different market orientations. Someproduce only for a local market while others have extensive geographiccoverage. Other important features of firms are diversity in terms of size anduniqueness of products and brands.
History’s Role
A firm’s history and origin can endow it with long-lasting advantages. Simplybeing the first in a market has contributed to the success of some of the world’slargest food corporations. Large-scale commercial food processing andretailing originated in Western Europe and the United States, and the tworegions today account for 35 of the world’s 50 largest food manufacturingfirms (app. 1). The most renowned food companies today were founded in thelate 1800s and early 1900s, an era noted for the Industrial Revolution andrising household incomes. As many households could no longer afford the timeto process farm products, entrepreneurs aided by greater access to capital fromprivate and public sources capitalized by launching new food companies. Thischange spurred strong growth in commercial processing in the United Statesand Western Europe. Today, large volume of commercial food sales in thesemarkets also allows U.S. and European firms to continue to introduce newproducts and establish brand loyalty in home markets (table 5-1).
63New Directions in Global Food Markets / AIB-794
Economic Research Service/USDA
Table 5-1—U.S. and Western Europe share of 2002 world food sales
United States Western Europe Rest of world
Percent
Bakery products 25 33 42Dairy products 22 35 43Chilled foods 14 29 57Confectionery 25 34 42Dried food 14 11 75Frozen food 37 32 31Canned food 28 24 48Sauces, condiments 23 19 58Snack foods 39 18 43Oils and fats 10 28 62Ice cream 29 29 41Ready meals 40 33 27Pet food 38 30 31Noodles 8 2 90Baby food 31 25 43Pasta 16 37 47Spreads 23 34 43Soup 42 25 33Meal replacement drinks 66 11 22Total packaged food 24 29 47
Note: Western Europe includes the EU-25, Turkey, Switzerland, Norway, and Iceland.
Source: Euromonitor, 2003.
The three largest food companies, Nestlé, Kraft, and Unilever, continue tohave their highest volumes of sales in products they established early intheir history. The Nestlé Company, founded in 1865 in Switzerland by HenriNestlé, initially focused on infant nutrition and later expanded to other milk-based and confectionery products. Nestlé is now the world’s largest foodcompany and continues its focus on its initial core products. In 1903, JamesKraft began a wholesale cheese business in Chicago that later became KraftFoods. It is now the leading food company in North America. Unilever’sroots can be traced to the 1930 merger between a Dutch margarine manufac-turer, Margarine Unie and the British company, Lever Brothers, a companythat had previously diversified into ice cream from soap. Currently, Unileveris the global leader in ice cream and oils and fats.
Companies have long realized the need to differentiate their products fromthose of competitors to retain and expand their customer base. Initially, tech-nology employed by food processing firms was relatively unsophisticated andcould easily be replicated by competing firms. Thus, firms find it essential toestablish brands as a way to preserve product identity and prevent displace-ment by competitors using similar processing technology. For example, KraftFoods would not have attained its global presence without its famous brands,patented trademarks, and the longstanding goodwill earned from consumers.In the food industry, such intangible assets are often more important thancapital and technology, and may generate higher returns (Reyner, 2000).
Brand Acquisition
In today’s global food market, it is uncommon for firms to use the introduc-tion of new products and brands as a strategy for expansion. Rather, foodcompanies typically expand by acquiring existing brands. Most of the largestfood manufacturers entering new markets in recent years have employed thisstrategy. U.S. firms entered foreign markets through acquisitions, and foreignfirms entered the U.S. market by acquiring familiar U.S. brands.2
Large diversified companies have achieved growth by accumulatingpremium brands in their core product categories. Firms vie for leadershippositions in new markets by acquiring products and high-performancebrands. For example, Nestlé and Unilever compete in ice cream marketsglobally by acquiring the most successful brands. In 2000, Unileveracquired the U.S. ice cream manufacturer Ben and Jerry’s Homemade IceCream. Nestlé, on the other hand expanded its ice cream core business byacquiring General Mill’s stake in Ice Cream Partners USA, giving it owner-ship of the premium Häagen-Dazs in the U.S. market. In 2002, Nestlé alsoacquired a majority stake in Breyer’s Grand Ice Cream, further expandingits popular brands in the U.S. ice cream sector.
Firm rivalries in U.S. and foreign markets often drive brand acquisitionstrategies. For example, as Nestlé acquired a pet food company with highlyrecognizable brands in the United States, the U.S.-based Mars Companycounteracted by acquiring pet food brands in the Western European market.3
A strategy combining technology and branding has helped Unilever differ-entiate its oils and fats products against its rival ConAgra in the U.S.
2 For example, Unilever’s acquisitionof the successful meal replacementdrink (Slim Fast) significantly helpedthe company in this product categoryin the U.S. market.
3 Nestlé acquired Ralston Purina in2001, which was followed by Marsacquiring Royal Canin in 2002 andregaining its global market share.
64New Directions in Global Food Markets / AIB-794
Economic Research Service/USDA

market. This strategy has been particularly helpful in allowing Unilever tocompete with ConAgra’s strong domestic margarine brands.
Geographical Expansion
As mentioned earlier in this report, geographical expansion is becoming moreimportant as a future growth strategy as the North American, Japanese, andWestern European markets become saturated and incomes and populationgrow more rapidly outside these regions. U.S. and European firms are increas-ingly seeking stronger footholds in Latin America and Asia. In addition tohelping firms expand sales, a wider geographic coverage helps firms mitigatethe effects of temporary economic downturns in individual regional markets.
Some food manufacturing firms seek geographic expansion, while otherstend to operate in regional markets (fig. 5-1). A more specialized firm withwide geographic coverage can reap benefits from economies of scale insales and distribution. In some cases, geographic specialization helps firmsfocus on specific tastes and preferences of a region using differentiated localbrands. Yet, in other cases, large multinational companies have both a widegeographic coverage and a diversified product portfolio.
Firms with a global presence almost always have extensive expertise incertain product categories, which provides them with inherent technologicaland marketing advantages. Product category expertise helps manufacturersstrengthen relationships with worldwide retailers demanding higher qualityand reliable suppliers. Nestlé, with extensive geographic reach, relies on thestrength of its core products—baby foods—to gain a foothold in new
65New Directions in Global Food Markets / AIB-794
Economic Research Service/USDA
Figure 5-1
Food firms: Size and orientation
Source: Euromonitor, 2003.
Number of countries
0
20
40
60
80
100
120
140
160
0 2 4 6 8 10 12 14 16 18 20
Fonterra/New Zealand($2.3bn)
Wrigley Jr. Co./U.S. ($2.4bn)
Parmalat/Italian($5.2bn)
Ferrero/Italy($3.9bn)
Heinz/U.S. ($5.5bn)
Danone/France($9.6bn)
UnileverDutch/UK($23bn)
PepsiCo/U.S. ($17bn)
Nestlé/Switz. ($27bn)
Dean Foods/U.S.($6.2bn) Meiji Dairies/Japan
($5.5bn)
Arla Foods Amba/Denmark ($4.3bn)
ConAgra/U.S. ($12.4bn)
General Mills/U.S.($6.9bn)
Number of food categories
Note: Dollar amounts are values of packaged food sales only, in billions.

markets (table 5-2). Nestlé’s success in the global baby food market is partlydue to its extensive research and development program in infant food formu-lation. Similarly, smaller firms have relied on product development andmarketing expertise to help them become global players. For example, theWrigley Jr. Company, which specializes in confectionery, and the FonterraGroup, which specializes in dairy, sell their products in over 140 countries.
Most companies continuously seek new markets to expand their sales.PepsiCo is focusing on expanding its snack foods sales in Eastern Europeand Asia. Danone is developing a stronger presence in Africa and theMiddle East through investments in fresh dairy products and bakery prod-ucts. Similarly, Heinz is capitalizing on strong growth potential in EasternEurope and Asia-Pacific by strengthening its presence in those regionsthrough local acquisitions and joint ventures. Italy’s leading confectionerycompany, Ferrero, is expanding its operations in North America, Australia,Asia-Pacific and Eastern Europe. Firms that have not previously had muchexposure outside their home markets are also exporting geographic expan-sion. Arla Foods Amba, Europe’s largest cooperative operating mainly inWestern Europe, is venturing out to the Middle East with the establishmentof a subsidiary in the United Arab Emirates. Meiji, a leading Japanese dairy,ice cream, and baby food manufacturer, is targeting Southeast Asia throughits subsidiaries in Indonesia and Thailand.
Resistance to Firm Expansion
A multinational firm’s quest for geographic expansion may at times beconstrained in certain foreign markets. National firms with a long historical
66New Directions in Global Food Markets / AIB-794
Economic Research Service/USDA
Table 5-2—Global sales share of top six manufacturers by product category, 2002
Nestlé Kraft Unilever PepsiCo Danone Mars
Percent
Confectionery 9.0 5.6 9.4Bakery products 0.5 3.0 1.0 1.2 1.7Ice cream 8.9 0.1 19.3 0.2 1.9Dairy products 4.4 3.7 0.3 4.8Savory snacks 0.1 3.0 32.4 0.3 0.3Snack bars 3.1 4.0 5.7 9.9 1.3 1.7Meal replacement drinks 0.2 38.7Ready meals 9.7 5.7 3.0 0.2 0.8Soup 6.9 0.2 17.3Pasta 4.6 3.1 0.1 0.4Noodles 1.3 0.4 1.3Canned food 0.7 0.6 1.1 0.4Frozen food 6.1 2.6 4.2 0.4Dried food 2.3 3.2 3.3 0.2 0.8Chilled food 0.9 2.6 0.2Oils and fats 0.3 0.4 13.4 0.6Sauces, dressings,
condiments 3.0 4.3 10.7 0.8 0.7 0.7Baby food 16.9 0.2 0.2 0.1 2.6Spreads 0.6 2.2 7.1 0.2 0.4Dog and cat food 25.7 0.5 24.0
Source: Euromonitor, 2003.
presence in a country establish strong customer loyalties, making it moredifficult for foreign firms to enter these markets. For example, multinationalfirms have a more difficult time expanding to Scandinavian countries, wherenational firms lead in total food sales (app. 2). Similarly, local companieslead in total food sales in East Asian countries, where consumers tradition-ally show strong support for locally owned and managed companies. Forexample, nationally owned companies make up the top four food manufac-turing firms in Korea (Lotte, Nong Shim, Namyang Dairy Products, andCheil Jedang) and Japan (Meiji, Morinaga, Yamazki, and Snow Brand).
In addition to customer loyalty to local manufacturers, resistance towardforeign firms is also influenced by national regulations regarding foreigndirect investments. Liberalization of investment laws in many developingcountries has greatly enhanced the ability of multinational manufacturers tolocate in these countries, particularly in Latin America, where the leadingmanufacturing companies are Nestlé, Unilever, Danone, and other multina-tionals. In contrast, investment laws in many Asian countries are morerestrictive, requiring substantial participation by local entities and the use oflocal raw materials. This factor has partly contributed to the slower penetra-tion of multinational manufacturers into Asian markets.
Sometimes resistance to foreign firm expansion is reflected by local effortsto block mergers and acquisitions. For example, Nestlé’s takeover of theU.S. Hershey company in 2002 was prevented by legal stipulations attachedto the takeover by authorities in the State of Pennsylvania, under strongpressure from the local public. More often, oppositions to mergers andacquisitions involve Federal competition authorities.4 Acquisition approvalrequires meeting various criteria that serve to allay concerns regarding thelikelihood of increased industry concentration following the acquisition.
Food Manufacturers Lean Toward Focused Growth
Food companies today are increasingly sharpening their focus and rational-izing their portfolios, in sharp contrast to portfolio expansion strategies ofpast decades. Globalization and consolidation in the food retail sector hasforced leading food manufacturers to take necessary actions to improve theircompetitiveness. Many companies have chosen to expand in those areaswhere they have the greatest competency through selective acquisitions anddivestitures of many of their noncore product categories.5 For example, theHeinz Company in 2002 reorganized to stay focused on what it calls “powerbrands” in condiments, frozen meals, and snack foods. As part of its restruc-turing, it sold some of its noncore categories, such as pet food and cannedsoups and vegetables, to Del Monte Foods. Many specialized firms, such asWrigley and Ferrero, are reluctant to expand beyond core products. Thesefirms have historically not been active in acquisitions. Ferrero has resistedthe temptation of going public to raise capital for acquisition of otherbrands, and has instead invested a higher share of sales on research anddevelopment leading to expansion of existing brands into new products.
Given the trend toward focused growth, no food manufacturer commands asubstantial share of total world processed food sales. In fact, Nestlé, the largest
4 The U.S. Federal Trade Commissionconsidered blocking the mergerbetween Nestlé and Dreyers as itbelieved it would eliminate competi-tion and raise prices for super-pre-mium ice cream. In order to gainapproval for the takeover of the petfood manufacturer Ralston Purina,Nestlé had to sell two of Ralston’s drycat food brands.
5 A notable example is the acquisitionof Bestfoods in the United States byUnilever in 2001. This was followed bya period of almost no further acquisitionactivity, but over 30 disposals, manyrelated to the Bestfoods acquisition.
67New Directions in Global Food Markets / AIB-794
Economic Research Service/USDA

food manufacturer, accounts for only 3 percent of global packaged food sales(table 5-3). The world’s top 25 firms together account for less than 25 percentof global packaged food sales. However, as a consequence of focused growth,concentrated markets are visible at specific product and country levels.
Firm dominance is most evident within a market sector covering a firm’score categories in individual countries. For example, shares of total pack-aged food sales for Nestlé range from 1.3 percent in Asia-Pacific to 6.3percent in Latin America. But Nestlé’s shares are substantially higher in itscore baby food products, exceeding 60 percent in Latin America. At a moredetailed subproduct/country level, Nestlé has a near-monopoly position(over 91 percent) in baby milk formula in Brazil, where it has marketed itsproducts using popular local brands. Similarly, market shares for other coreproducts in regional markets are much higher, with Nestlé capturing almost60 percent of the dehydrated soup market in Russia, almost 50 percent ofthe milk market in the Philippines, and 40 percent of the cat food market inthe United States.
Food manufacturers may choose to focus on different core products indifferent markets. Similar to Nestlé, Unilever, the world’s second largestfood manufacturer, has extensive geographic coverage. However, Unilever’smarket shares vary considerably in core products in specific markets. Forexample, in the Western European ice cream market, Unilever capturesalmost 60 percent of total ice cream sales in Austria (table 5-4). Unilever’smarket shares for the impulse category are even higher, accounting for over81 percent of total individual-bought nonstore sales in Austria.6 In contrast,in Norway, Unilever is not visible in the ice cream sector.
The same is true for Unilever’s core products in other markets. Although, itsoils and fats market in the Asia-Pacific region is generally weak due to strong
6 The “impulse” category refers tosales from vending machines, street-side kiosks, and other outlets whereice cream is sold in individually pack-aged pieces.
68New Directions in Global Food Markets / AIB-794
Economic Research Service/USDA
Table 5-3—Nestlé's market share at regional, country, and product levels
Product category Total packaged food
Market GlobalMarket share % 3.2
Market W. Europe E. Europe N. America Latin America Asia-Pacific Africa and Middle EastMarket share % 4.0 2.3 2.3 6.3 1.3 5.8
Product category Confectionery Soup Pet food Baby food Dairy products Bakery products
Market Global Global Global Global Global GlobalMarket share % 9.0 17.3 25.7 13.0 4.4 0.5
Market W. Europe E. Europe N. America Latin America Asia-Pacific Africa and Middle EastMarket share % 12.5 25.7 30.7 60.7 5.2 1.5
Market U.K. Slovakia United States Brazil Philippines IsraelMarket share % 20.2 52.5 31.0 82.4 37.2 8.0
Product category Chocolate Dehydrated soup Cat food Milk formula Milk Biscuits
Market U.K. Russia United States Brazil Philippines IsraelMarket share % 24.6 58.9 40.0 91.2 48.3 42.4
Source: Euromonitor, 2003.

competition from Japanese brands, Unilever accounts for more than a third ofIndonesia’s oils and fats market. Strong colonial ties of the Dutch-based firmand the use of a single well-recognized brand (Blue Brand) has allowedUnilever to capture nearly 84 percent of Indonesia’s spreadable oils and fatsmarket. Similarly, Unilever’s focused category management strategy has alsobeen highly successful, with the Knorr brand of soup in Europe, and with theHellman’s brand of catsup and condiments in Latin America.
The trend for the largest firms to focus and acquire brands in core categorieshas contributed to higher firm concentration among certain high-marginproducts with globally recognized premium brands. For example, themarkets for pet food, soups, breakfast cereals, and baby food are heavilyconcentrated with the top four firms accounting for over 50 percent ofglobal sales (fig. 5-2). Nestlé alone accounts for 26 percent of global babyfood sales, with brands such as Enfamil, Gerber, and Similac dominating theworld market. Similarly, Campbell’s, Knorr, and Maggi brands togetheraccount for nearly 50 percent of global soup sales. Small firms have beenless successful in markets, such as soups, where differentiation is achievedthrough heavy advertising of popular brands.
Role of Producer-Owned Firms in Evolving Food Markets
As restructuring continues in the global food industry, producer-ownedfirms, also known as cooperatives, have taken on new roles in response tothe changing marketplace. Some of the largest U.S. cooperatives face finan-cial constraints, raising concerns about their viability, but others thrive bymaking necessary adjustments to adapt to new consumer-driven forces inthe market. Given these mixed signals, the outlook for cooperatives in the
69New Directions in Global Food Markets / AIB-794
Economic Research Service/USDA
Table 5-4—Unilever's market share at regional, country, and product levels
Product category Total packaged food
Market GlobalMarket share % 2.7
Market W. Europe E. Europe N. America Latin America Asia Pacific Africa and Middle EastMarket share % 4.2 1.4 2.7 3.6 0.9 3.0
Product category Ice cream Soup Replacement Sauces, Oils, fats Spreadsdrinks condiments
Market Global Global Global Global Global GlobalMarket share % 19.3 32.9 38.7 10.7 13.4 7.1
Market W. Europe E. Europe N. America Latin America Asia Pacific Africa and Middle EastMarket share % 30.5 25.7 49.9 32.6 4.4 22.0
Market Austria Poland United States Argentina Indonesia South AfricaMarket share % 59.6 38.4 50.1 43.0 37.2 46.6
Product category Impulse Instant Slimming drinks Catsup Spreadables Yeast-based spreads
Market Austria Poland United States Argentina Indonesia South AfricaMarket share % 81.2 76.5 79.1 76.8 83.9 94.9
Source: Euromonitor, 2003.

evolving world food industry appears to be unclear. In some cases, it mayeven appear that the inherent business structure of a cooperative is animpediment to success.
In contrast to investor-owned firms, cooperatives are owned and controlledby members who also share the benefits of the organization. While theprimary purpose of cooperatives is to generate benefits for their members,they are also considered a means of correcting or mitigating market failures(Rogers and Petraglia, 1994). Therefore, public policy has generally beengeared toward differential treatment of cooperative business entities in theUnited States and other countries.7
Historically, agricultural cooperatives have emerged as an avenue for producersto market farm products. Currently, some cooperatives struggle to sell theirproducts, as they lack coordination mechanisms and operate with little infor-mation about market conditions and consumer preferences. At times, thesecooperatives are faced with oversupplies, which in turn depress market pricesfor their products. Some agricultural cooperatives have looked to expand tovalue-added products to capture a greater share of consumer sales. However,the experience of Ocean Spray Cranberries proves this strategy may not guar-antee success if supply control is not coordinated with demand. While OceanSpray enjoyed growing consumer popularity, overproduction in the 1990s,resulting from lack of supply control pushed cranberry growers toward finan-cial ruin (Ananor-Boadu et al., 2003).
Some other cooperatives involved in value-added products have not been ableto compete and respond to market signals as well as investor-owned firms. Forexample, Tri Valley Growers was the largest fruit and vegetables cooperative inthe United States, competing directly with Hunts, Heinz, Campbell’s Soup, and
7 The Capper-Volstead Act of 1922gave U.S. agricultural cooperativeslimited exemption from antitrust laws.In addition, the 2002 Farm Act andother ongoing USDA programsaddress issues related to rural develop-ment and cooperative business.
70New Directions in Global Food Markets / AIB-794
Economic Research Service/USDA
Figure 5-2
Higher market concentration in sales of branded products
Source: Euromonitor, 2003.
Percent of global sales by top four firms
Firm 1
Firm 2
Bread
Rice
Milk
Cheese
Ready meals
Confectionary
Ice cream
Noodles
Snack food
Baby foods
Breakfast cereals
Soups
Pet food
0 10 20 30 40 50 60 70
Firm 3
Firm 4
Del Monte. It purchased raw products at a noncompetitive price from itsmembers and sold processed goods through a diversified portfolio of marketingchannels. But because of its overly generous payment to producers, it accumu-lated excessive debt and was forced to declare bankruptcy in 2000. Despite itsgenerous payments to members, the cooperative business structure did notdirectly contribute to Tri Valley Growers failure (Sexton and Hariyoga, 2004).Rather, it was unable to meet shifting consumer demand for different tomato-based products and generate sufficient revenues to cover its expenses.
Overdiversified portfolios have affected some of the largest U.S. coopera-tives in recent years. As previously discussed, many of the large global foodfirms have restructured to attain the right portfolio size and focus. However,U.S. cooperatives have been slow to make the necessary restructuring deci-sions. Agway, once the largest U.S. cooperative, ranking 97th on the Fortune500 list, filed for bankruptcy in 2002. Similarly, too vast a portfolio ledFarmland Industries to sell its assets and declare bankruptcy in 2003.
Although these examples highlight failed agricultural cooperatives, it is notclear that the cooperative business structure is itself an impediment. Somecooperatives are taking the necessary steps to realign their operations to meetconsumer demands. For example, the U.S. cooperative Sunkist Growers hasstarted sourcing products from foreign producers to meet retailer andconsumer demand for year-round supply of citrus. Similarly, other coopera-tives are performing successfully in global markets. The Fonterra Dairy Coop-erative of New Zealand and Danish Crown of Denmark have stronginternational orientations, each exporting over 80 percent of its products.
A characteristic common among successful international cooperatives is closevertical and horizontal coordination from primary production to finalconsumers. The cooperative structure of a vertically integrated firm enables itto tailor products to specific markets and respond to changing consumerdemands at the farm level and higher. Second, greater vertical and horizontalcoordination enable a firm to reduce transaction costs while enhancingproduct quality. The cooperative business structure is best suited for producingand marketing certain agricultural commodities, such as meats, dairy, andhorticultural products, with strong backward links to the producers.
The Danish livestock cooperative has successfully evolved in response tochanging consumer demands. As with all successful food firms, the cooper-ative is supported by a strong research and technology base, and an organi-zational framework that allows quality-assured products to be developed asdesired by consumers. In 1998, Danish Crown and Vestjyske Slagterier,another Danish cooperative, merged to create the largest hog producing andslaughter cooperative in Europe.8 Despite an inherent cost disadvantage dueto limited natural resources, this cooperative operates an exceedingly wellcoordinated supply chain management system from genetics in primary hogproduction to processing and exporting final products. The strength of thecooperative lies in its superior knowledge of different foreign markets andclose coordination along the supply chain, which enables it to respond tospecific consumer needs. For example, the cooperative raises pigs for theUK market that must conform to special animal welfare and food safetyrequirements. Farmers contracted for the UK market are paid premiums,subject to meeting the additional requirements.
8 The company accounts for 50 per-cent of Denmark’s total exports and isthe world’s largest exporter of pork,with sales reaching more than $2 bil-lion in 2002.
71New Directions in Global Food Markets / AIB-794
Economic Research Service/USDA

Similarly, the cooperative structure has successfully propelled NewZealand’s dairy cooperative into prominence in international markets. TheFonterra Cooperative Group is heavily export oriented. It is the world’sleading dairy exporter and the 12th largest dairy product manufacturer.Owned by 13,000 dairy farmers, Fonterra is fully vertically integratedand manages dairy herds, manufactures milk products, and distributesfinal products in retail markets. It integrates packaging, transportation,shipping and quality control. Similar to the success of Danish Crown,Fonterra’s success has much to do with superior knowledge of milkproduction, processing technology, and consumer markets, and its verti-cally integrated structure.
Despite strong competition from multinationals, such as Danone, Parmalat,and Nestlé, Fonterra has become a global company, marketing dairy ingredi-ents and consumer dairy products for retail and food service through astrong research base, a flexible integrated supply chain, and key businessalliances with companies in foreign markets.9 Marketing dairy productsinternationally requires flexibility in tailoring products to specific markets, astrength of Fonterra. While servicing markets with strict requirements, suchas the UK, Fonterra maintains tight control over the raw products. In othermarkets with less stringent regulations, Fonterra may resort to outsourcingwithin the supply chain.
As evident from these examples, the key to success lies with cooperativesdeveloping an understanding of their markets and having an integratedstructure that allows them to cater specifically to individual markets. More-over, gaining thorough knowledge of markets and developing an ability tocater to markets is only possible if cooperatives limit their focus to a fewsectors. With sound business decisions and appropriately sized portfolios,the cooperative business structure is very well suited for the global foodindustry. An allegiance to suppliers, control and flexibility of the supplychain, product traceability, member loyalty, and the growing positive atti-tudes of consumers toward cooperatives portend well for future growthpossibilities. Recent changes in consumer values and preferences offercooperatives, which have close ties to primary producers, the opportunity tomarket specific product attributes, such as organic and free range. Forexample, Fonterra has promoted its brands through its wholesome image ofcows feeding off natural New Zealand pastures, the image simultaneouslyreinforcing its rural identity while signaling the product to be high quality,healthful, natural, and ecologically responsible.
Looking Ahead
A wide range of food firms with diverse orientations and sizes are expectedto remain sustainable as they make greater strides to specialize and bettercater to consumer demands. In doing so, food manufacturers will adjust toconsumer demand signals as transmitted via the retail sector, which isincreasingly becoming consolidated. Both large and small firms withspecific expertise are now able to enter the market through alliances withretailers. These current market trends indicate a positive outlook for thecoexistence of diverse manufacturing firms.
9 In 2002, Fonterra Group formed anagreement with Dairy America, a mar-keting company representing major U.S.cooperatives, for exporting skimmedmilk powder from the United States. Itestablished the first commercial produc-tion of milk protein concentrate in theUnited States with an agreement withDairy Farmers of America.
72New Directions in Global Food Markets / AIB-794
Economic Research Service/USDA

With increasing consumer demand for higher value products, food firms arelikely to secure or increase their market shares in value-added products inwhich they have greater competencies. These demand patterns have led to afocused growth strategy among many food firms, which in turn hascontributed to a more concentrated regional market for specific products.While the largest multinational food companies will likely become evenlarger in the next decade as they continue to expand in developing countries,the increasing diversity in consumer demand presents opportunities formany small firms to successfully compete in the same markets. Establishingbrand names may remain a significant barrier for small firms, but small-scale manufacturing involving expertise in specific processing technologiesof different ingredients and flavorings offers potential for new entrants.
In the evolving global food industry, food manufacturers have to continu-ously reorient themselves to remain competitive. Firms that respond tomarket signals are better able to adjust and maintain their positions in theindustry. Manufacturers with flexible organizational structures that enablethem to adjust the production process at various stages in response toconsumer demands will be well suited to compete in the world food market.A flexible organizational structure is possible if firms operate in close coor-dination with producers and other sectors of the food supply chain. There-fore, producer-owned cooperatives involved in value-added productionactivities have the potential to succeed in global food markets.
References
Ananor-Boadu, V., M. Boland, and D. Barton. “Ocean Spray Cranberries in2003,” in A.A. Thompson (ed.), Case Studies in Strategy: Winning in theMarketplace, McGraw Hill Publishing, 2003.
Euromonitor International. 2003, http://www.euromonitor.com.
Gehlhar, M., A. Regmi, S. Stefanou, and B. Zoumas. “Strategies of aCooperative in Foreign Markets: Fonterra’s Foothold in the WesternHemisphere,” Paper presented at Vertical Markets and CooperativeHierarchies: The Role of Cooperatives in the International Agri-FoodIndustry conference, Chania, Crete, September 3-7, 2004,http://www.foi.dk/coop04.htm.
Reyner, Michael. “Restructuring the Food Industry: The Challenge forManufacturers,” in Bill Ramsay (ed.), The Global Food Industry:Strategic Directions, Financial Times Retail and Consumer, FinancialTimes Business Ltd., 2000.
Rogers, T. Richard. “Structural Change in the U.S. Food Manufacturing,1958-1997,” Agribusiness, Vol. 17, No. 1, 2001, pp. 3-32.
Rogers, T. Richard, and Lisa M. Petraglia. “Agricultural Cooperatives andMarket Performance in Food Manufacturing,” Journal of AgriculturalCooperation, Vol. 9, 1994, pp. 1-12.
Sexton, Richard, and Himawan Hariyoga. “The Canning of Tri Valley,”Rural Cooperatives, U.S. Department of Agriculture, Rural Business andCooperative Service, September-October 2004, pp. 20-24.http://www.rurdev.usda.gov/rbs/pub/sep04/sep04.pdf
73New Directions in Global Food Markets / AIB-794
Economic Research Service/USDA

74New Directions in Global Food Markets / AIB-794
Economic Research Service/USDA
Appendix Tables
Appendix 1—World's leading food manufacturing firms
Rank based Packaged foodon 2002 Company Country of share of firm's food sales name registry total sales
Percent
1 Nestlé Switzerland 51.72 Kraft Foods USA 30.43 Unilever UK/Netherlands 50.24 PepsiCo USA 61.25 Danone France 73.96 Mars USA 50.47 Kellogg USA 97.78 ConAgra Foods USA 81.09 Heinz Co. USA 58.2
10 Campbell Soup USA 90.411 General Mills USA 87.112 Dean Foods USA 100.013 Hershey Foods USA 99.014 Parmalat Italy 66.315 Cadbury Schweppes UK 43.916 Ferrero SpA Italy 100.017 Bimbo Mexico 96.018 Meiji Dairies Corp. Japan 86.619 Morinaga Milk Industry Japan na20 Sara Lee USA 28.621 Yamazaki Baking Co. Japan 92.922 Lotte Group South Korea 100.023 Wrigley Jr. Co. USA 100.024 Arla Foods Amba Denmark 94.225 Snow Brand Milk Products Japan 90.026 Sodiaal SA France 89.327 Pfizer Inc. USA 6.328 George Weston Ltd. Australia na29 Nissin Food Products Co. Japan 100.030 Barilla G. R Flli SpA Italy 100.031 Interstate Bakeries Corp. USA 100.032 Procter & Gamble Co. USA 10.533 Bristol-Myers Squibb Co. USA 9.834 Lactalis/Groupe France 85.535 Ezaki Glico Co Ltd. Japan na36 Fonterra Co-operative Group New Zealand 40.137 Hormel Foods Corp. USA 79.338 United Biscuits (Holding) Plc. Belgium na39 Ajinomoto Co. Inc. Japan na40 Bongrain SA France na41 Abbott Laboratories Inc. USA 7.142 Perfetti Van Melle Group Italy 100.043 Orkla Group Norway 28.844 Morinaga & Co. Japan na45 Del Monte Foods Co. USA 78.646 Friesland Coberco Dairy Foods Netherlands na47 Tine Norske Meierier BA Norway na48 Meiji Seika Kaisha Ltd. Japan 65.449 SanCor Cooperatives Unidas Argentina na50 Ting Hsin International Group China na
Note: na = not available.
Source: Euromonitor, 2003.

75New Directions in Global Food Markets / AIB-794
Economic Research Service/USDA
Appendix 2—Leading packaged food manufacturers by country
Country Firm 1 Firm 2 Firm 3 Firm 4
Argentina Danone SanCor Cooperative Nestlé AncorAustralia Nestlé Goodman Fielder Cadbury Schweppes Campbell SoupAustria Unilever Benalandmilch Kraft Foods FerreroBelgium Danone Unilever Nestlé Kraft FoodsBrazil Nestlé Unilever Parmalat DanoneBulgaria Obedinena Kraft Foods Boni Oborot NestléCanada Kraft Foods Saputo Maple Leaf Foods ParmalatChile Nestlé Soprole Unilever Empresas CarozziChina Ting Hsin Uni-President Long Fong Hai Pa WangColombia Alpina Nestlé Parmalat Productos NaturalesCzech Republic Nestlé Hame Danone UnileverDenmark Arla Foods Amba Danish Crown Amba Unilever Toms FabrikkerEgypt Nestlé Cadbury Schweppes Salvala Hayed SaeedFinland Valio Oy Fazer Oy Ingman Foods UnileverFrance Danone Nestlé Lactilis UnileverGermany Unilever Nestlé Ferrero Kraft FoodsGreece Philippou Chipita Unilever Friesland CobercoHong Kong Nestlé Garden Golden Resources NissenHungary Pick Szeged Unilever Friesland Coberco ParmalatIndia Gujarat Cooperative Unilever Danone GlaxoSmithKlineIndonesia Indofood Sukes Nestlé Unilever Friesland CobercoIreland Unilever Glanbia Cadbury Schweppes KerryIsrael Tnuva Central Co-op Nestlé Vadash Strauss-EliteItaly Barilla Unilever Nestlé FerreroJapan Meiji Dairies Morinaga Yamazki Baking Snow Brand MilkMalaysia Nestlé Friesland Coberco Jasmine Food Yep Hiap SengMexico PepsiCo Bimbo Nestlé GanaderosMorocco Centrale Laitier Montedison Indusalim MargarinerieNetherlands Unilever Campina Mekunia Friesland Coberco United BiscuitsNew Zealand Fonterra Goodman Fielder Heinz DanoneNorway Tine Norske Meirerier Orkla Kraft Foods NestléPhilippines Nestlé San Miquel JG Summit UnileverPoland Unilever Danone Nestlé Cadbury SchweppesPortugal Unilever Nestlé Fonterra NutrinvestRomania Napolact Topway Prodlacta Kraft FoodsRussia Cherkizovo Nestlé Wimm Bill Dann BabayevskySaudi Arabia Nestlé Al Marai Danone Abdul-KadirSingapore QAF Nestlé Faser Neavel Kraft FoodsSlovakia Nom Ag Henkel Nestlé Kraft FoodsSouth Africa Tiger Brands Unilever Nestlé DanoneSouth Korea Lotte Nong Shim Namyang Dairy Cheil JedangSpain Danone Nestlé Sos Arana UnileverSweden Arla Foods Amba Orkla Unilever Spira ABSwitzerland Migros Nestle Unilever ChocoladefabrikenTaiwan Uni-President Wei Chuan Foods I-Mei Foods Kraft FoodsThailand Nestlé Saha Pathana Friesland Coberco UnileverTurkey Ulker Gida Unilever Nestlé Eti GidaUkraine Shepetovsky Cherkasskaya Keivsky KamenentsUnited Kingdom Unilever Cadbury Schweppes Mars NestléUnited States Kraft Foods PepsiCo ConAgra Dean FoodsVenezuela Empresas Polar Cargil Parmalat Kraft FoodsVietnam Haihaco Kinh Do Generics Vietnam Dairy
Source: Euromonitor, 2003.