the u.s. economy— - corporate and individual financial ... · phenomenon to investors and...
TRANSCRIPT

GLOBAL POSITIONING SYSTEMS:RECALCULATING IN LIGHT OF DETOURS, BUMPS, AND BLIND SPOTS
Capital Markets Forecast
2018
Love and hope may spring eternal but—recent appearances to the contrary—bull markets do not. Though neither do they die of old age. Which brings us to the primary question as we reset for the year ahead: Will the eight-year-long running of the bulls be brought to its knees in the next 12 months? Notwithstanding many telltale signs of a late-stage (or pre-recession) economy, we believe the equity market likely has legs. This economic cycle continues to defy historic norms and the current stage is no exception.
The stock market bottomed in March of 2009 with the U.S. economy following soon thereafter, but the ensuing recovery has proved slow and plodding throughout its extended life. Held back by deleveraging of the private sector and the demographic headwinds of an aging population, the hallmarks of a healthy expansion, such as strong inflation and robust economic growth, have not materialized. Instead, we find ourselves deciphering the paradox of strong labor markets, elevated stock market valuations, rising interest rates, and a flattening yield curve—all quintessential late-cycle signals—against the presence of continued low inflation, loose financial conditions, strong consumer confidence, and even now, the strong likelihood of historic fiscal stimulus.
As confounding as this singular set of signs may appear, our analysis is straightforward: We believe this economy has room to run at least for the year ahead and perhaps beyond. Even without factoring the potential lift to the economy of a major tax package, we expect organic economic growth of 2.25% in 2018; fold in the potential impact of tax reform, and we believe it would add another 0.5%–0.75% of growth for the year from consumer spending and business capital expenditures. Add to this an ever-convalescing manufacturing sector and the ongoing availability of easy financing on the back of weak inflation, and we see little reason for this economy to take an untoward turn for the worse.
And so our annual commentary delves into the subtleties of the U.S. economy’s middle-to-late cycle status; the mystery of solid growth with uncharacteristically weak inflation through domestic and global lenses; and the potential for alternative investments to prosper in the face of rich valuations, low yields, and expectations of higher volatility.
As we continue on this journey together, know that we seek what we believe to be the most prudent, not always the fastest, route to accomplishing our clients’ financial goals. And as we move forward, we strive to sidestep hazards and recalculate as necessary to stay on a realistic path aimed at our perennial long-term goals of asset preservation and growth.
Best,
Tony RothChief Investment Officer, Wilmington Trust Investment Advisors, Inc.

c o n t i n u e d
©2017 Wilmington Trust Corporation and its affiliates. All rights reserved. page 1
t h e m e i
The U.S. economy— late-cycle emergence
This time it’s different—really
A term often bandied about in economic circles, “this time it’s different,” seeks to explain why some look askance at the telltale forerunners of recession. Its overuse notwithstanding, we truly believe this time the economic cycle is different, and there are important distinctions that make it so.
American businesses have created more than 17 million jobs over the course of the recovery. The unemployment rate coming down to about 4% at the end of 2017 (from a post-crisis high of 10%) constitutes the tightest labor market in 16 years. Even when considering discouraged workers who have stopped looking for full-time work and those who can only find part-time work, the labor market is quite strong and, in our judgment, at the stage where wage pressures will increase. In fact, economic theory would tell us that not only should wage growth accelerate, but also that overall inflation should be higher. While we readily agree on the likely path of wages, unraveling the broader inflation puzzle is a more monumental challenge. But it is one well worth undertaking. In our view, nothing is more vital in forecasting the near-term path of the economy and markets than pinpointing the drivers of inflation and tracing their likely path.
The omission of inflationary pressures during this recovery has been perhaps the most baffling
KEY THEMES
t h e m e I The U.S. economy—late-cycle emergence
t h e m e I I Inflation and growth—global-U.S. divergence
t h e m e I I I Valuations, yields, and volatility— alternative resurgence
c o v e r i m a g e
Chris KennyIsland (2013 )
Photograph courtesy England & Co Gallery, Londonwww.chriskenny.co.uk
Capital Markets FORECAST 2018

f i g u r e 1The economy cycles through a repeated pattern of expansions and recessions
Early, middle, and late stages have their own unique characteristics.
The National Bureau of Economic Research counts 33 full cycles since 1854, with 11 in the post-WWII period.
Source: WTIA
Early Middle Late Recession
Financial markets peak 6–9 months before economic growth
Signs of middle cycle
• Low inflation
• Stable profit margins
• Easy overall financial conditions
• Low yields
Financial market performance
Financial market performance
Economic cycle
Economic cycle
Signs of late cycle
• Elevated valuations
• Tight labor market
• Gradual tightening of monetary policy
• Accelerating wages
• Flattening of the yield curve
}WE ARE HERE
Gro
wth
Time
As the economy cycles through its stages, financial markets follow a similar, usually predictive pattern. The financial cycle is not in perfect sync with the economic cycle, however, as investors seek to maximize return by anticipating the ebbs and flows (peaks and troughs) of the economy in advance of them actually taking place.
tt

phenomenon to investors and policymakers alike. In fact, it now stands as the key indicator suggesting the U.S. economy is more middle than late cycle (Figure 1). Since 2009, the price index for core personal consumption expenditures (the Federal Reserve’s preferred inflation measure) has consistently missed the Fed’s 2% target (Figure 2). This continues to be the case—despite the U.S. labor market tightening sufficiently to bring down the unemployment rate to levels last seen in 2001, and the market climbing more than 65% above its pre-recession peak.
In our view, key forces are now working together to keep inflation at bay, dampening the Fed’s tightening efforts and ultimately extending the economic cycle (Figure 3). Two are well understood; the third less so. We identify the main drivers of low inflation as follows:
Demographics. About 10,000 baby boomers retire from the workforce every day. This has key implications for wages, a leading inflationary indicator, as lower-paid, less-experienced workers replace higher-paid, more-experienced workers. That dynamic slows overall wage growth and, coupled with retirees’ lower propensity to spend, translates to milder inflationary pressure. And as sure as this phenomenon is at home, it is even more pronounced in the developed world outside the U.S.
Global disinflation. Closer connections through trade and technology have made the world smaller than it was a few decades ago, and countries’ inflation rates are more closely linked as well. We are seeing low inflation in the developed world and declining inflation in many emerging markets, resulting in the U.S. “importing” low inflation.
Technology. Technological innovations and their impact on inflation are difficult to quantify but impossible to ignore. New business models have unquestionably altered supply chains, increased cost-effectiveness, and removed the middleman from the equation—all of which have served to tamp down inflation. One has but to look at Uber, Airbnb—and, of course, Amazon.
Capital Markets FORECAST 2018
©2017 Wilmington Trust Corporation and its affiliates. All rights reserved. page 3
f i g u r e 2Inflation has consistently missed the mark this cycleThe price index for core personal consumption expenditures minus Federal Reserve’s 2% target
c o n t i n u e d
Low U.S. inflation is clearly contributing to the slow pace of Fed policy normalization.
Sources: Bloomberg, Bureau of Economic Analysis
Source: WTIA
–1.5%
–1.0%
–0.5%
0.0%
0.5%
2000 2002 2004 2006 2008 2010 2012 2014 2016
In�ation above Fed’s target
In�ation below Fed’s target
f i g u r e 3Several factors contributing to low inflationCauses of low inflation are likely numerous but difficult to quantify
Technology: Supply chain disruption is real but challenging to quantify
Global disinflation: With the world increasingly connected, and China’s growth slowing, low inflation in other parts of the world is affecting the U.S.
Demographics: Downward wage pressures from higher-paid baby boomers retiring, resulting in a larger, aging segment of the population that tends to spend lessLow
U.S. inflation

page 4©2017 Wilmington Trust Corporation and its affiliates. All rights reserved.
c o n t i n u e d
Over the past decade, Amazon has become the world’s largest online retailer, responsible for about a third of domestic e-commerce. Though its total revenue is still dwarfed by retail giants like Walmart, Amazon’s accelerated pace of growth since 2008 is critical for prices. The ability of consumers to compare prices instantaneously at minimal cost via the ubiquitous use of smart phones forces retailers to compete relentlessly on price and has spillover effects that keep prices low for all retailers. Combine the price-suppressing impact of Internet retail on consumer goods with similar impacts from Uber on public transportation and Airbnb on lodging and one can easily see a key reason why inflation has remained so low (Figure 4).
Valuations, rates, and portfolios
The forces described previously all contribute to muted inflation, even though we are eight years into the recovery, and this leads to a Fed that is cautious, deliberate, and gradual in the tightening of monetary policy (Figure 5). Low inflation is suggestive of an economy in the middle stage of the economic cycle and is strongly shaping our strategy recommendation for
Capital Markets FORECAST 2018
maintaining an overweight to equities and an under-weight to fixed income. But we must acknowledge the elephant in the room: equity valuations.
U.S. equity valuations are the highest they have been since the tech bubble in the year 2000, with the price of the S&P 500 trading at around 18 times earnings estimates over the next 12 months. This compares to an average price-to-earnings (P/E) ratio since 1990 of 16 times. Equities seem even pricier when analyzing a cyclically adjusted ratio, such as Shiller P/E, which smooths out fluctuations in earnings by looking at the current price divided by the prior 10 years’ earnings, with both adjusted for inflation (Figure 6).
Current U.S. equity valuations are not moving us to reduce portfolio risk as prevailing interest rates also matter, and critically so. On average, valuations have historically been higher in environments with low inflation and low bond yields, in part because low yields mean bonds provide lower total return (price appreciation plus income). Therefore, on a relative basis, investors tend to be willing to pay more for the return potential of equities. We believe yields could rise (particularly at the short end of the curve, which is driven by Fed interest rate policy), but will remain contained while the 10-year Treasury yield (which more closely follows inflationary trends) is unlikely to reach even mid-single digits. When considered in conjunction with the positive momentum in the economy, this “lower (yields) for longer” drumbeat suggests valuations could well remain elevated and may even move higher.
In sum, the risk of a sudden market pullback at elevated valuations is not something we take lightly. But valuations are a poor predictor of short-term returns, and selling out of equities too early when economic fundamentals are solid can represent a significant opportunity cost, particularly while yields on safe assets like money market accounts remain inadequate to compensate for downside risks.
f i g u r e 4Technology is disrupting the supply chainInflation rates on selected goods and services
2002–2008 2009–2016
–3%
–2%
–1%
0%
1%
2%
3%
4% Hot
els
Tran
spor
tati
on
Pers
onal
car
e
Book
s
Tele
com
m
Hou
seho
ld it
ems
Spor
ting
goo
ds
Toys
& o
ther
Clot
hing
& s
hoes
Inflation rates on many goods and services are well below those experienced in the previous expansion.
Source: Bureau of Economic Analysis

f i g u r e 6The elephant in the room: equity valuationsS&P 500 cyclically adjusted price-to-earnings ratio
The cyclically adjusted price-to-earnings ratio represents the current price divided by the prior 10 years’ earnings, with both adjusted for inflation. This measure is meant to smooth out sharp fluctuations in company earnings and provide a more indicative buy/sell signal for investors.
Source: Shiller, R. Irrational Exuberance. Princeton University Press, 2000; Broadway Books 2001, 2nd ed., 2005; current data at http://econ.yale.edu/~shiller/data.htm
f i g u r e 5The Fed has been particularly slow to act this cycleChange in federal funds target rate for each cycle
0%
2%
4%
6%
8%
10%
12%
12 24 36 48 60 72 84 96
Months since last rate cut
1980–19811976–1979
2003–2007
1998–2000
1992–19951986–1989
2009–present
0x
5x
10x
15x
20x
25x
30x
35x
40x
45x
1950 1960 1970 1980 1990 2000 2010
Shiller cyclical adjusted P/E
32xSecond-highest P/E in 67 years
This rate cycle has been the most gradual of any prior cycle, as inflationary pressures are slow to materialize.
Sources: Bloomberg, Federal Reserve, WTIA
©2017 Wilmington Trust Corporation and its affiliates. All rights reserved. page 6
Capital Markets FORECAST 2018
c o n t i n u e d
At an unemployment rate that is expected to exceed 9% at the end of 2017, European labor markets still have room for improvement before meaningful wage pressure should materialize. Indeed, inflation is still moribund as we near the close of the year, prompting the ECB to commit to at least nine more months of exceptionally easy financial conditions via large-scale purchases of financial assets—a clear contrast to the Fed, which is now almost two years into its interest-rate hiking cycle and is taking steps to reduce the size of its balance sheet.
Japan’s economy for its part has endured two subsequent recessions since the global downturn, in 2012 and 2014, also putting it in a very different stage of the economic cycle compared to the U.S. Admittedly, the unemployment rate in Japan is extremely low, and is projected to register below 3% at the end of 2017, but the combination of a declining population and nonexistent inflation indicates significant economic slack. This has similarly prompted the Bank of Japan to keep its foot on the monetary policy accelerator with negative interest rates and asset purchases, both of which are almost certain to continue over the course of 2018.
Emerging markets
Several major emerging markets economies suffered after the 2014–2015 collapse of commodity prices. Commodity exporters such as Brazil and Russia experienced the sharpest economic declines, while others that have structurally higher rates of growth, particularly in Asia, have posted at least one marked slowdown in recent years. And so nearly all international economies—developed and emerging alike—are exhibiting weak inflation, leading central banks around the world to either hold steady or, in some cases, further reduce policy rates.
Financial markets and portfolios
Credit growth, an important indicator of an economy’s health, also shows a diverging pattern between the U.S. and international counterparts. From 2012–2014, the
t h e m e i i
Inflation and growth— global-U.S. divergenceThe most recent U.S. recession of 2008–2009 was truly a shock felt round the world in terms of global economic decline. Perhaps underappreciated on our own shores is that many other countries endured subsequent though less severe economic recessions at different points in the past decade, while the U.S. continued to expand, albeit modestly. So while domestic data as described earlier are still encouraging, no one can deny the aging of the U.S. recovery, particularly when compared to other developed and emerging economies, which appear to be earlier in their respective economic cycles (Figure 7).
Developed international
International economies have had quite a different experience from the U.S. since the financial crisis, most easily seen in the eurozone and Japan, which represent the second- and fourth-largest economies, respectively. The eurozone endured a subsequent recession in 2012, following a too-early, misguided move by the European Central Bank (ECB) to start raising interest rates when the European economy remained in exceptionally weak condition. Labor markets had only just begun to improve before some of the starkest cracks in the foundation of the European experiment were laid bare. Then, the second recession brought more layoffs and drove the unemployment rate above 12% at its peak in mid-2013, a full three years after the U.S. labor market had begun to improve.
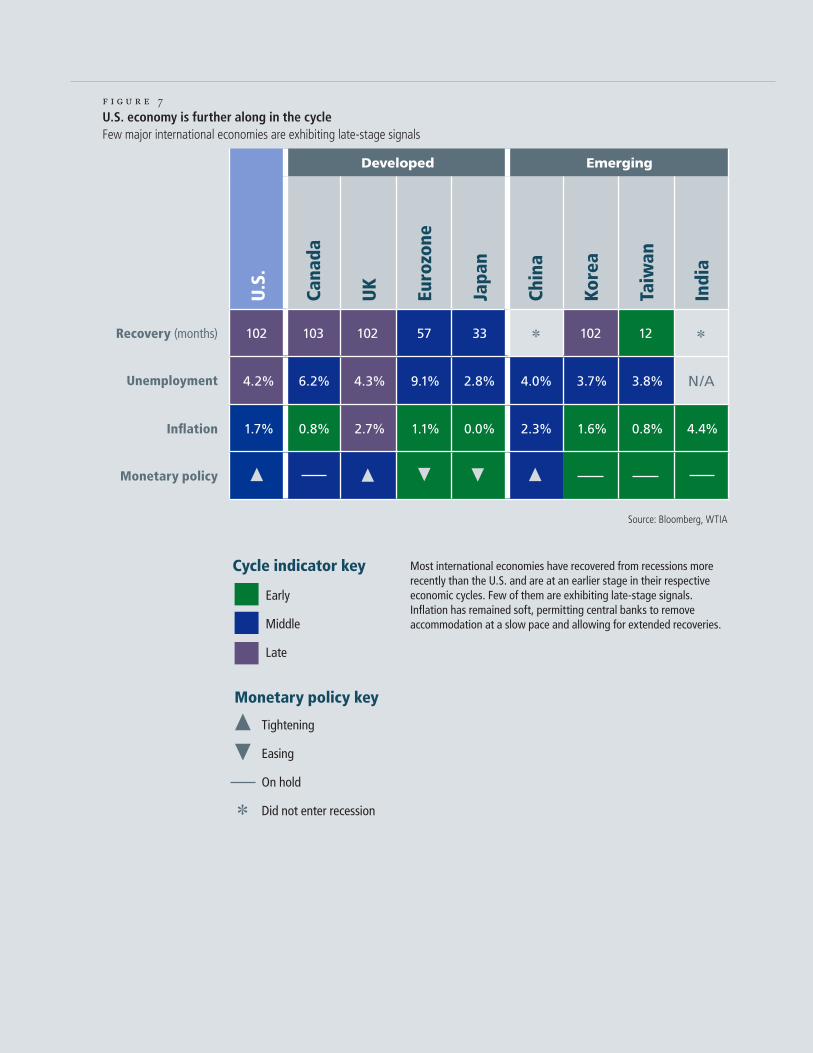
f i g u r e 7U.S. economy is further along in the cycleFew major international economies are exhibiting late-stage signals
Source: Bloomberg, WTIA
U.S
.
Developed Emerging
Cana
da
UK
Euro
zone
Japa
n
Chin
a
Kore
a
Taiw
an
Indi
a
Recovery (months) 102 103 102 57 33 102 12 Unemployment 4.2% 6.2% 4.3% 9.1% 2.8% 4.0% 3.7% 3.8% N/A
Inflation 1.7% 0.8% 2.7% 1.1% 0.0% 2.3% 1.6% 0.8% 4.4%
Monetary policy
Early
Middle
Late
Cycle indicator key
Tightening
Easing
On hold
Did not enter recession
Monetary policy key
*
Most international economies have recovered from recessions more recently than the U.S. and are at an earlier stage in their respective economic cycles. Few of them are exhibiting late-stage signals. Inflation has remained soft, permitting central banks to remove accommodation at a slow pace and allowing for extended recoveries.
* *

f i g u r e 9Low yields are a global phenomenon10-year global government bond yields
Global pressure on yields leaves few reasonable alternatives for income-seeking investors.
As of November 30, 2017.
Source: Bloomberg
0%
1%
2%
3%
4%
5%
6%
7%
8%
Japan Germany France UK CanadaItaly
U.S.
SouthKorea
Mexico Brazil Greece India
DEVELOPED MARKETS
EMERGING MARKETS
Valuations are a better predictor of returns over the medium term than the short term, and the outlook is lackluster.
Includes data beginning January 1977 through November 2017.
Source: Shiller, R. Irrational Exuberance. Princeton University Press, 2000; Broadway Books 2001, 2nd ed., 2005; current data at http://econ.yale.edu/~shiller/data.htm
f i g u r e 8High valuations foreshadow meager returnsS&P 500 index five-year forward returns vs. Shiller cyclically adjusted P/E
R² = 0.34
–10%
–5%
0%
5%
10%
15%
20%
25%
30%
0x 5x 10x 15x 20x 25x 30x 35x 40x 45xShiller cyclically adjusted P/E
Retu
rns
We are here
t h e m e i i i
Valuations, yields, and volatility—alternative resurgence Despite our view that the global economic backdrop is encouraging, there remain challenges facing investors in the form of low expected returns in the conventional equity and fixed income asset classes for the following reasons:
Elevated equity valuations. Current valuations coupled with the sheer length of the recovery strongly suggest poor relative return prospects over a longer time horizon. For example, over 10-year timeframes, higher valuations have coincided with lower long-term forward average returns. Today, the Shiller cyclically adjusted P/E ratio would suggest annualized returns of 5% over the next five years (Figure 8), meaningfully less than the market’s 75-year average return of 10%. This does not mean a healthy allocation to stocks is unwise but that investors should reduce their medium-term return expectations.
Low yields. Not only is the bond market arguably pricier than the stock market, bonds will likely provide little income and may lose value as yields rise in the future. Yet, U.S. government bond yields eclipse those of other large industrialized countries and are on par with some emerging nations, which generally come with greater risk versus the U.S. (Figure 9). Demand for the yield advantage of U.S. debt over developed counterparts is capping long-term yields, a trend we see likely to continue as major central banks maintain easier monetary policy than that of the Fed. In sum,
©2017 Wilmington Trust Corporation and its affiliates. All rights reserved. page 9
c o n t i n u e d
Capital Markets FORECAST 2018
U.S. saw an acceleration of total credit growth to the private nonfinancial sectors, a sign of an improving economy in the early and middle stages. This growth plateaued over 2015–2016 but remains healthy. Contrast this to developed international economies, where credit growth for the two main players (eurozone and Japan) only began to pick up in 2016, and is now an encouraging signal of early-cycle growth. Credit expansion in emerging markets is also indicative of an early cycle, with the exception of China, where the economy continues to decelerate from dizzying rates of growth fueled by post-recession government stimulus.
Last, we are keenly aware of the relative attractiveness of global equity markets’ valuations. Contrast valuations in the U.S to those in the rest of the world and you see yet another indicator that the domestic economy is further along in the cycle. We believe equity valuations—and with them, return prospects—are more attractive in other developed and also emerging markets than in the U.S. and therefore recommend an overweight to those regions.
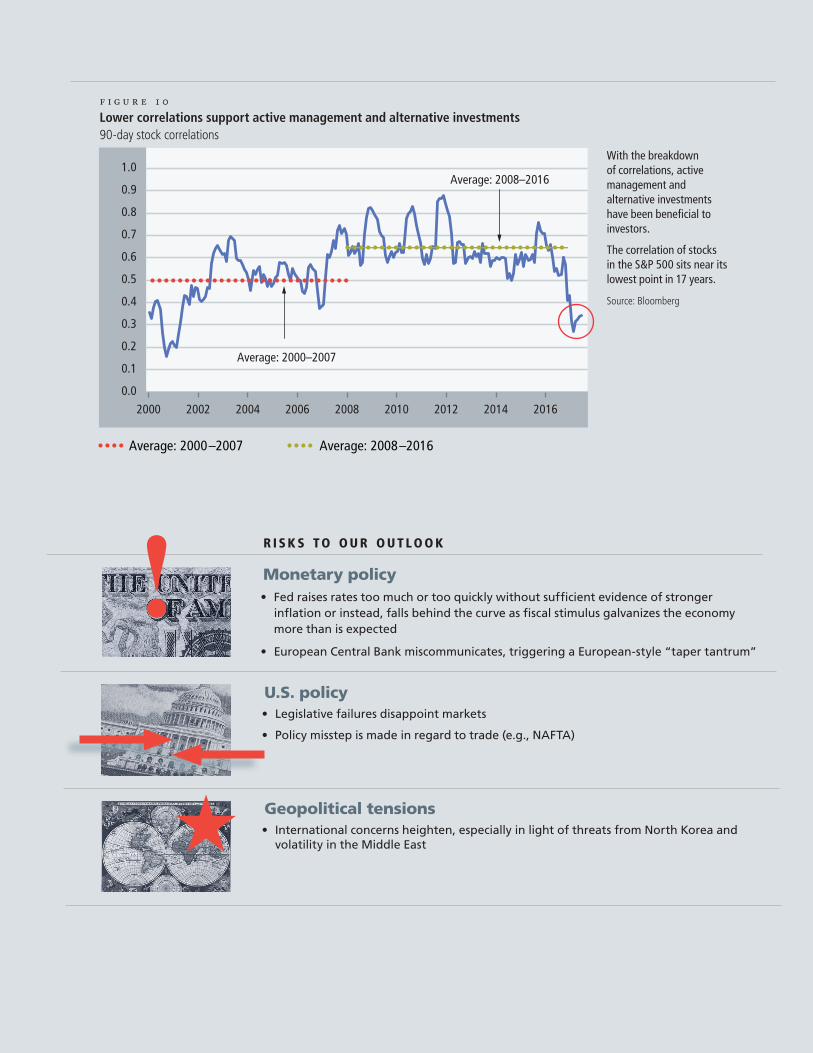
f i g u r e 1 0Lower correlations support active management and alternative investments 90-day stock correlations
With the breakdown of correlations, active management and alternative investments have been beneficial to investors.
The correlation of stocks in the S&P 500 sits near its lowest point in 17 years.
Source: Bloomberg
0.0
0.1
0.2
0.3
0.4
0.5
0.6
0.7
0.8
0.9
1.0
2000 2002 2004 2006 2008 2010 2012 2014 2016
Average: 2000–2007 Average: 2008–2016
Average: 2000–2007
Average: 2008–2016
r i s k s t o o u r o u t l o o k
Monetary policy• Fed raises rates too much or too quickly without sufficient evidence of stronger
inflation or instead, falls behind the curve as fiscal stimulus galvanizes the economy more than is expected
• European Central Bank miscommunicates, triggering a European-style “taper tantrum”
!
H
U.S. policy• Legislative failures disappoint markets
• Policy misstep is made in regard to trade (e.g., NAFTA)
Geopolitical tensions• International concerns heighten, especially in light of threats from North Korea and
volatility in the Middle East

low yields globally for the foreseeable future give bonds limited investment appeal.
Higher expected volatility. Against a backdrop of some significant geopolitical risks anticipated in 2017—such as uncertain U.S. fiscal policy, major elections in several European countries, and acute saber-rattling with North Korea—one of the biggest surprises was low volatility, with annual realized volatility of the S&P 500 the second lowest in the last 50 years. In our view, volatility has been unsustainably low, and we expect it to increase, though perhaps to more normal levels rather than dramatically higher. Typically, higher volatility means a more challenging environment for equity returns.
Hence, we believe it will be difficult to attain a moderate rate of return and a healthy income stream via customary means. These circumstances warrant greater allocations to alternative (nontraditional) asset classes at some point in the near future.
Looking for return in alternative places
We believe certain alternative investments that have historically offered a greater contribution of return from alpha (the excess returns above a market benchmark attributable to an active manager’s decisions) than beta (an asset’s movement with the overall market), will be attractive in the years ahead. In addition, certain private market investments that focus on disruptive corners of the economy (such as technology, information security, and healthcare) with less informational parity may offer more compelling advantages than traditional investment vehicles.
In the post-recession bull market, returns from active management disappointed and, for most investors, gaining exposure to broad market returns (even without positive incremental return from manager skill), proved satisfactory for meeting investment goals. In fact, many active managers struggled through the boom years, leaving their clients worse off after fees than they would have been had they simply invested
©2017 Wilmington Trust Corporation and its affiliates. All rights reserved. page 11
c o n t i n u e d
Capital Markets FORECAST 2018
in passive vehicles tracking underlying benchmarks. Equities rose broadly as an asset class overall, making it difficult for active managers to distinguish their funds’ performance from that of passive funds. However, for the first time this cycle, intra-equity market correlations are breaking down (Figure 10). We also expect volatility to increase from extremely low levels, providing greater opportunity for active management and alternative asset outperformance.
Alternatives by no means provide a “silver bullet” in stock and bond markets offering meager return prospects, but should volatility increase to more normal levels and rough patches emerge in the later stages of the economic cycle, these vehicles may help diversify a portfolio and add return while potentially decreasing overall portfolio risk. The key is to choose the right managers and partners in this space, with an eye toward a differentiated investment process, prudent management, reasonable fees, and often managers seeking to successfully deploy smaller pools of capital. We therefore recommend qualified investors consider allocations to the following asset types:
Liquid alternatives. These are mutual or exchange-traded funds that pursue strategies outside of standard stock and bond long-only approaches (where the expectation is that an investment’s value will generally rise only as the broad markets rise). Given how much this now-crowded space has exploded since the recession, we carefully screen for managers that—in addition to the potential for greater diversification at lower cost and less risk—have large scale. The last is especially important as funds of this nature require size and advanced investment infrastructure, which is why the last five years have seen larger funds outperform their smaller counterparts by a significant margin.
Hedge funds. These pooled investment vehicles are not publicly traded, so they are exempt from stringent regulations to which public funds are subject. Positions might be taken in a variety of asset classes that are long

©2017 Wilmington Trust Corporation and its affiliates. All rights reserved. page 12
or short (where, for the latter, the expectation is that an investment’s value will fall), or levered exposures (where borrowed capital is used in an effort to boost return). There is usually a degree of illiquidity through a “lock-up” period, in which investors are restricted from selling their shares. In aggregate, hedge funds have delivered disappointing after-fee performance over the past few years, and hedge fund managers were punished with net outflows of $112 billion in 2016.
In our view, it is not surprising that a strong bull market saw sub-par performance for hedge funds, which “hedge” market exposures by taking positions that offset potential negative price movements in the primary market. In the last two recessions, for example, hedge funds added compelling downside protection versus a traditional long-only equity allocation. The diversified hedge fund index gained 8% during the tech crash while U.S. large-cap stocks lost 37%; and hedge funds lost 11% compared to a –33% return for U.S. large-cap stocks from 2007–2008.
Private markets. Funds that invest in private companies may use a degree of leverage to finance their investments, and also play an active role either in restructuring or helping to manage a company’s business operations. While usually requiring a significant lock-up of invested dollars for five to ten years, private markets have historically generated rates of return well in excess of public markets. We see private markets as an important part of a qualified investor’s portfolio, as they offer access to niche markets and private companies at exciting times in their business life cycles. Private markets also operate on a much less level playing field in terms of information flow than public markets, which contributes to their being less efficient and more fragmented, and may create greater investment opportunities. Interestingly, unlike liquid alternatives, fund size usually works against investors in the private markets space as more deployable capital requires sourcing more quality opportunities. Accordingly, we focus on smaller, boutique-like offerings in this arena.
c o n c l u s i o n
Recalibrating the route on an ever-changing road
We have been here before and we will be here again. As a modern private wealth manager that spans generations, we have carefully shepherded client assets through numerous economic cycles and capital markets—from boom to bust and bull to bear. Through it all, we act as fiduciaries, so our clients’ best interests always come first.
Be empowered by a disciplined yet flexible investment process, decades of investment experience, and investment intelligence that is delivered through the selection of high-quality solutions in which anticipated value is expected to outweigh costs. To bring the full breadth of investment strategies and planning resources to bear on your complex wealth scenario, and understand how this year’s projected trends may impact your customized, risk-measured portfolio, we invite you to reach out to your Relationship Manager.
For more on our 2018 Capital Markets Forecast, including video content featuring our senior executives, please go to www.wilmingtontrust.com/cmf.

Disclosures
Advisory service providers Wilmington Trust is a registered service mark. Wilmington Trust Corporation is a wholly owned subsidiary of M&T Bank Corporation. Investment management and fiduciary services are provided by Wilmington Trust Company, operating in Delaware only; Wilmington Trust, N.A., a national bank; and Manufacturers and Traders Trust Company (M&T Bank), member FDIC. Wilmington Trust Investment Advisors, Inc., a subsidiary of M&T Bank, is an SEC-registered investment adviser providing investment management services to Wilmington Trust and M&T affiliates and clients. Brokerage services, mutual funds, and other securities are offered by M&T Securities, Inc., a registered broker/dealer, wholly owned subsidiary of M&T Bank, and member of the FINRA and SIPC. Wilmington Funds are entities separate and apart from Wilmington Trust, M&T Bank, and M&T Securities.
General–suitability Wilmington Trust’s 2018 Capital Markets Forecast is provided for informational purposes only and is not intended as an offer or solicitation for the sale of any financial product or service or as a recommendation or determination that any investment strategy is suitable for a specific investor. Investors should seek financial advice regarding the suitability of any investment strategy based on the investor’s objectives, financial situation, and particular needs. The investments or investment strategies discussed herein may not be suitable for every investor. The material is not designed or intended to provide legal, investment, or other professional advice since such advice always requires consideration of individual circumstances. If legal, investment, or other professional assistance is needed, the services of an attorney or other professional should be sought.
The forecasts presented herein constitute the informed judgments and opinions of Wilmington Trust about likely future capital market performance. Forecasts are subject to a number of assumptions regarding future returns, volatility, and the interrelationship (correlation) of asset classes. Assumptions may vary by asset class. Actual events or results may differ from underlying estimates or assumptions, which are subject to various risks and uncertainties. No assurance can be given as to actual future market results or the results of Wilmington Trust’s investment products and strategies. The estimates contained in this presentation constitute Wilmington Trust’s judgment as of the date of these materials and are subject to change without notice. The information in this presentation has been obtained or derived from sources believed to be reliable, but no representation is made as to its accuracy or completeness.
Investment products are not insured by the FDIC or any other governmental agency, are not deposits of or other obligations of or guaranteed by Wilmington Trust, M&T, or any other bank or entity, and are subject to risks, including a possible loss of the principal amount invested.
Some investment products may be available only to certain “qualified investors” — that is, investors who meet certain income and/or investable assets thresholds. Any offer will be made only in connection with the delivery of the appropriate offering documents, which are available to pre-qualified persons upon request.
Securities listed or mentioned are provided for illustrative purposes only and are not intended to be representative of current recommendations or holdings. It should not be assumed that these securities were or will be profitable.
An overview of our asset allocation strategies Wilmington Trust offers five model asset allocation strategies each for taxable and tax exempt investors with particular sets of risk tolerances: Aggressive, Growth, Growth & Income, Income & Growth, and Conservative. Each strategy can be implemented with or without allocations to hedge funds. On a quarterly basis we publish the results of all of these strategy models versus benchmarks representing static investments without tactical tilts. Model Strategies may include exposure to the following asset classes: U.S. large capitalization stocks, U.S. small-cap stocks, developed international large-cap, developed international small-cap and emerging market stocks, inflation hedges (including global inflation-linked bonds and commodity-related and global real estate-related securities), investment-grade bonds (corporate or municipal), high yield corporate bonds and floating-rate notes, and cash equivalents. Directional and absolute return hedge funds are distinct to the strategies with hedge funds. Each asset class carries a distinct set of risks, which should be reviewed and understood prior to investing.
Impact of fees The following is a hypothetical example of the impact over time of fees charged by Wilmington Trust to a client’s account. It is not meant to suggest actual fees, which may vary, and does not reflect actual returns. Assuming an initial investment of $1,000,000 account value and an average annual return of 10%, an annual fee of 100 basis points (i.e., 1%) would result in account level fees of $10,641 the first year, $35,351 over three years, and $65,458 over five years. A schedule of Wilmington Trust’s fees is available upon request.
Investing involves risk and you may incur a profit or a loss.
Past performance is no guarantee of future results.
Diversification does not ensure a profit or guarantee against a loss.
There is no assurance that any investment strategy will be successful.
Indices are not available for direct investment. Investment in a security or strategy designed to replicate the performance of an index will incur expenses, such as management fees and transaction costs, that would reduce returns.
The names of actual companies and products mentioned herein may be the trademarks of their respective owners.

Wilmington Trust Wealth Offices:
California: 310.300.3050
Delaware: 302.651.2079
Florida: 800.814.3429
Georgia: 404.760.2100
Maryland: 800.624.4116
Massachusetts: 617.457.2000
New Jersey: 201.368.4545
New York: 212.415.0500 (NYC) 315.424.4075 (Upstate New York)
Pennsylvania: 610.520.1430
Virginia: 703.748.5500
Washington, D.C. 202.434.7027
National: 866.627.7853
wilmingtontrust.com
©2017 Wilmington Trust Corporation and its affiliates. All rights reserved.
Through our Capital Markets Forecast, we seek to
understand the forces that may help to shape investors’
experiences in the years ahead. As always, we encourage
you to contact us at any time to discuss our forecast
and your individual portfolio.
CS16971 12-2017