"the united states of america country update 2015" · proceedings world geothermal...
TRANSCRIPT

Proceedings World Geothermal Congress 2015
Melbourne, Australia, 19-25 April 2015
1
The United States of America Country Update 2015
Tonya L. Boyd1, Alex Sifford
2, John W. Lund
1
1Geo-Heat Center, Oregon Institute of Technology, Klamath Falls, Oregon, 2 Sifford Energy Services, Neskowin, Oregon
Keywords: The Geysers, electric power, direct-use, ground-source heat pumps, energy savings, well drilled, manpower,
investments
ABSTRACT
Geothermal energy is used for electric power generation and direct utilization in the United States. The present installed capacity
(gross) for electric power generation is 3,477 MWe (installed) with 2,542 MWe net (running) delivering power to the gird
producing approximately 16,517 GWh per year for a 74% net capacity factor. Geothermal electric power plants are located in
California, Nevada, Utah and Hawaii with recent installation in Alaska, Idaho, New Mexico and Oregon, with 312 MWe being
added the last five years. The two largest concentrations of plants are at The Geysers in northern California and the Imperial Valley
in southern California. The Geysers continues to receive waste water from Clear Lake and Santa Rosa, California that is injected
into the field and has resulted in the recovery of approximately 200 MWe of power generation. The lowest temperature installed
plant is at Chena Hot Springs in Alaska, where binary cycle plants uses 74oC geothermal fluids to run three units for a total of 730
kW (gross). With the recent passing of the production tax credit by the federal government (2.0 cents/kWh) and renewable portfolio
standards requiring investments in renewable energy, the annual growth rate for electric power generation over the past three years
is 3.6 percent. The direct utilization of geothermal energy includes the heating of pools and spas, greenhouses and aquaculture
facilities, space heating and district heating, snow melting, agricultural drying, industrial applications and ground-source heat
pumps. The installed capacity is 17,416 MWt and the annual energy use is 75,862 TJ or 21,074 GWh. The largest application is
ground-source (geothermal) heat pumps (88% of the energy use), and the next largest direct-uses are fish farming and swimming
pool heating. Direct utilization (without heat pumps) remained nearly static over the past five years with gains balancing losses;
however, ground-source heat pumps are being installed at a 8% annual growth rate with 1.4 million units (12 kW size) in operation.
The energy saving from all geothermal energy use is about 11.2 million tonnes of equivalent fuel oil per year (74.7 million barrels)
and reduces air pollution by almost 10.0 million tonnes of carbon and 28.0 million tonnes of CO2 annually (compared to fuel oil).
1. INTRODUCTION
Geothermal resources capable of supporting electrical generation and/or direct use projects are found primarily in the Western
United States, where most of the recent volcanic and mountain building activity have occurred (Figure 1). The San Andreas Fault,
running through California from the Imperial Valley to the San Francisco area, the subduction zone off the coast of northern
California, Oregon and Washington and Cascade volcanism are the source of much of the geothermal activity in the United States.
However, geothermal (ground-source) heat pumps extend the utilization to all 50 states. The total identified potential for electrical
production is estimated at 21,000 MWe (above 150oC) and 42 EJ (between 90o and 150oC) of beneficial heat (Muffler, 1979), and a
recent estimate by the U.S. Geological Survey estimates a mean probability of electrical power generation from identified
geothermal resources in12 western states during the next 30 years of 8,866 MWe (USGS, 2008), which would nearly triple the
existing electrical capacity.
Figure 1: Geothermal resource map of the United States.

Boyd, Sifford and Lund
2
Achieving this electric capacity potential will be dependent upon a number of factors including competing prices for energy and
incentive programs that encourage development of renewable energy resources. Recently passed Renewable Portfolio Standards
(RPS) in a number of states along with the extension of the Production Tax Credit (PTC) by Congress to 2015, which provides a
2.0 cent per kilowatt hour credit, have attracted developers to start new projects. Other incentives are the recent stimulus funds for
geothermal energy, at US$400 million, approved by Congress was allocated for various types of geothermal projects, along with a
tax credit (30% of the cost up to US$1,500) for geothermal heat pump installations under the 2005 Energy Policy Act and extended
by the American Recovery and Reinvestment Act of 2009. All of these measures will greatly improve geothermal’s ability to
compete with fossil fuel generation, both for electrical energy and direct-use. The federal government has also approved a 30%
investment tax credit as a grant for commercial operation of power plants. A recent report by the Energy Information
Administration (EIA, 2009), confirms the continued growth of renewables as fossil fuel use plummet and nuclear power stalls.
The United States continues to lead the world in installed geothermal power capacity as well as in electrical generations, and along
with geothermal heat pumps, is one of the leaders in direct-use applications.
Geothermal energy remains, however, a small contributor to the electric power capacity and generation in the United States. In
2013, geothermal plants constituted about 0.30 percent of the total operable power capacity, and those plants contributed an
estimated 0.41 percent of the total generation.
Since the last U.S. Country Update was completed in 2010 gross geothermal electrical production capacity has increased in the
United States by approximately 312 MWe to a total an installed capacity of 3,477 MWe and a net running capacity of 2,542 MWe
due to derating of plants in The Geysers, for a capacity factor of 0.74. This low value is due to plants, especially in The Geysers,
operating in a load following mode rather than in a base load mode. Total generation in 2013 was 16,517 GWh and the geothermal
electric power generation accounted for 3% of the total renewable based electricity consumption in the United States. On a state
level, geothermal electric generation is a major player in California and Nevada. It is a minor source of power in the other states.
The generation in California provides about 4.4% of the state’s energy consumption. It is also significant on the Big Island of
Hawaii where it now provides approximately 20% of the electricity requirements. Recent projects have brought several new states
into the electricity “club”, including, Alaska, Idaho, New Mexico and Oregon. Alaska is most noted, as a 250 kW binary cycle
generator installed in 2006 uses the lowest temperature geothermal fluid in the world to produce electricity at 74oC, however, it
should be noted that it also has 4oC cooling water from a stream allowing for an acceptable “T” (Lund, 2006). The growth in
installed capacity during the 1980s was about 11 percent, however, from 1990-1998 it averaged on 0.14 percent due to a leveling
off of new plant construction, and from 2000 to 2004 only approximately 70 MWe of new capacity was added. Since, 2010, the
growth has been almost 11 percent.
Direct-use, other than geothermal heat pumps, has remained static with increases being balanced by closing of some facilities. The
main increases has been in expanding the Boise City District Heating System from 48 to 58 buildings; adding additional wells for
space heating in Klamath Falls; expanding the snow melting system on the Oregon Institute of Technology campus from 316 m2 to
3,753 m2, increasing the amount of aquaculture product being produced, mainly Tilapia; starting two biodiesel plants with one
having shut down during this reporting period; adding an absorption chiller for keeping the Ice Museum at Chena Hot Springs in
Alaska intact during the summer months, and adding additional space heating to the Peppermill Casino in Reno. Losses have been
the closing of the district heating systems at the California Correctional Center (now using natural gas) and the New Mexico
University heating system (due to difficulty with maintenance), and the closing of the Empire onion dehydration plant (due to
competition with imported garlic from China) near Gerlach, Nevada.
Geothermal heat pumps have seen the largest growth, increasing from an estimated 1.0 million to 1.4 million equivalent 12 kW
installed units. The estimated installation rate is about 80,000 units per year, or about an 8 percent annual growth, with most of the
growth taking place in the mid-western and eastern states. A few states have tax rebate programs for geothermal heat pumps, and as
mentioned above, Congress has established a tax credit of 30% of costs up to $1,500 for installations. Otherwise, there is little
support for implementing direct-use projects.
Enhanced (Engineered) Geothermal Systems (EGS) is the current R&D interest of the U.S. Department of Energy, Office of
Geothermal Technologies as part of a revived national geothermal program. EGS includes the earlier hot dry rock technology, but
now includes any other method in which to improve geothermal reservoir performance. EGS is associated with both magmatic and
high heat producing crustal sources of geothermal energy commonly at depths of about 4 to 5 km to reach 200oC, but also having
applications with normal gradient resources. However, EGC projects are currently at an early experimental demonstration stage.
Several technological challenges need to be met for widespread efficient use of EGS. The key technical and economic changes for
EGS over the next two decades will be to achieve economic stimulation of multiple reservoirs with sufficient volumes to sustain
long term production, with low flow impedance, limited short-circuiting fractures and manageable water loss (Tester et al., 2006).
Over the next 10 to 30 years, lessons learned while deploying early EGS power plants can reasonably be expected to facilitate
wider, efficient deployment of EGS technologies for both power production and direct use, or as in Europe in a combined heat and
power installation. One of the public relations problems associated with EGS projects, is the generation of micro earthquakes
(usually <3.5 on the Richter scale), that has slowed, threatened or shut down projects.
In a Massachusetts Institute of Technology (MIT)-led assessment (Tester et al., 2006), the U.S. geothermal resource was estimated
to be 14 million EJ with a technically extractable capacity of about 1,200 GWe to depths of 10 km. The report estimated that with
reasonable investment in R&D, EGS could provide 100 GWe or more of cost-competitive generating capacity in the next 50 years.
It further stated: “…EGS provides a secure source of power for the long term that would help protect American against economic
instabilities resulting from fuel price fluctuations or supply disruptions.” Unfortunately, a current project near The Geysers has
been placed on hold due to the inferred generation of micro earthquakes affecting nearby residences.

Boyd, Sifford and Lund
3
2. PRODUCTION OF ELECTRICITY
Table 1 presents operable electric production capacity and power generation in the United States from all sources for 2010-2013.
All data in this table came from the USDOE Energy Information Administration (EIA, 2014) and the Geothermal Energy
Association (GEA, 2013). Geothermal power production is summarized in Table 2 by plant and location. The total installed
capacity in 2013 was 3,447 MWe producing 16,517 GWh from a running capacity of 2,542 MWe. A total of 312 MWe has been
installed since the WGC2010 report (to 2013), amounting to a 7.2 percent increase or 2.5 percent annual increase over those three
years.
2.1 Installed and Future Capacity Update
2.1.1 Alaska
Alaska’s first geothermal power plant came online in 2006 in Chena Hot Springs. It produces electricity from the area’s low
temperature 74°C (165°F) geothermal resource. With recent additions it now has an installed production capacity of 730 kWe
(gross).
Alaska currently has 25 to 70 MWe of planned geothermal production coming down the pipeline. Of projects with potential to
come online, the Southwest Alaska Regional Geothermal Energy Project of 25 MWe is in an exploratory drilling and resource
confirmation phase. Other notable projects are Mt. Spur (50 MWe), Unalaska (10–50 MWe), Akutan (10 MWe), and Chena Hot
Springs II (0.7 - 5 MWe). (GEA, 2014).
2.1.2 Arizona
Geothermal power production does not currently occur in Arizona. However, the Arizona Public Service investigated the Clifton
geothermal project (Lund et al, 2010). GreenFire Energy is developing a demonstration project at St. Johns Dome, on the central
AZ and NM border.
2.1.3 California
Current geothermal electricity production capacity in California is approximately 2,711 MWe. In 2012, 4.4% of California’s
electricity generation came from geothermal power plants, amounting to a net total of 13,230 GWh. The 50 MWe Hudson Ranch
facility is the state’s most recent geothermal power plant addition. Generally, geothermal power generation remains concentrated in
California with the majority of production occurring at The Geysers in the north and Imperial Valley in the south. The installed
capacity at The Geysers I is 1,472 MWe (including 220 MWe from the two NCPA plants). However, only 685 MWe are currently
operating in the main field.
California has approximately 607 to 1,412 MWe of planned geothermal resource production in various stages of development.
Production drilling and facility construction are underway at US Geothermal’s recently acquired former Unit 15 site (26 MWe) at
the Geysers as well as EnergySource’s Hudson Ranch II (49.9 MWe). Development continues on Ormat Technologies East
Brawley project, Calpine Corporations Buckeye-North Geysers and Wildhorse-North Geysers (30 MWe) projects, and CalEnergy’s
Black Rock 1, 2, and 3 units (GEA, 2014).
2.1.4 Colorado
Although there are no geothermal power plants currently producing electricity in Colorado, exploration is taking place at Mount
Princeton Hot Springs, Poncha Hot Springs and Aspen sites. Colorado currently has 20 to 60 MWe of planned geothermal
production coming down the pipeline.
2.1.5 Hawaii
There is only one geothermal power plant facility which is comprised of two air-cooled power plants, a combined cycle system and
a binary system, in the state of Hawaii, located on the Island and County of Hawaii. Located on the “Big Island”, the Puna
Geothermal Venture facility had a 35 MWe nameplate capacity, until an 8 MWe expansion in 2011. The plant delivers 33 to 43
MWe of energy on a continuous basis and supplies up to 25% of the electricity demand on the big island. PGV has permits
allowing it to expand another 22 MWe in the future at its current location. Possible geothermal energy resources are being explored
in West Hawaii and on the island of Maui. (Hawaiian Electric Co., 2014)
2.1.6 Idaho
Idaho’s first geothermal power plant, Raft River, came online in January 2008. Raft River is a binary plant that uses a 150°C
(300°F) resource and has a nameplate production capacity of 15.8 MWe. Current net production output is between 10.5 and 11.5
MWe. US Geothermal is securing a PPA and final permitting for a 16 MWe expansion of the Raft River plant.
Other companies are developing a number of projects throughout Idaho. Total potential geothermal production for Idaho is 63 to
314 MWe (GEA, 2014).
2.1.7 Nevada
Nevada’s electrical generation capacity from its geothermal plants is second only to California. In 2013, Nevada had 24 geothermal
power plants with a total nameplate capacity of 596 MWe and with a total gross output of 3,456,382 MWh. Since 2010 Nevada
increased its installed geothermal capacity with the addition of the Tuscarora Project 32 MWe (ENEL), McGinness Hills Project 52
MWe (ORMAT), San Emidio “Repower” Project 8.4 MWe (US Geothermal), and Don A. Campbell Project 22.5 MWe (ORMAT).
Currently Nevada has more developing projects and it is expected that gross capacity will continue to increase significantly in the
future. Many other companies are in the process of securing PPA’s and final permitting for a number of projects and other
companies are in the early exploratory stages of developing numerous geothermal resources. Nevada currently has 176 to 718 MWe
of geothermal capacity in development (GEA, 2014).

Boyd, Sifford and Lund
4
2.1.8 Montana
The Dewhurst Group (DG) is collaborating with the State of Montana Governor’s Office of Economic Development on a feasibility
study for Montana’s first geothermal power plant at Warm Springs. The State of Montana donated the test site in June of 2012.
2.1.9 North Dakota
North Dakota has 0.6 MWe of geothermal capacity in development using co-produced hydrothermal and lower temperature
resources. (GEA, 2014).
2.1.10 New Mexico
In December of 2013, The Dale Burgett Geothermal Plant was commissioned and started delivering electricity to Public Service
Company of New Mexico under a long term power purchase agreement. Located near the city of Animas, the first phase of this
binary project has a 4 MWe of capacity. The plant uses geothermal brine at a temperature of 165°C (300°F) from a reservoir depth
of 400 to 1,000 meters (1,200 to 3,000 feet). Development of the Lightning Dock No. 2 expansion is underway with an additional 6
MWe of generation planned for installation.
2.1.11 Oregon
Power production today in Oregon occurs at three locations, Klamath Falls, Neal Hot Springs and Paisley. In Klamath Falls the
Oregon Institute of Technology is the first campus in the world that uses both heat and power from geothermal resources directly
beneath the campus. A first 280 kWe gross power plant using the 89oC (192oF) water was installed in February 2010. The Pure
Cycle© unit was supplied by United Technologies Corp. and intereconnected to the grid in April of that year. A new 1.75 MWe
geothermal power plant was completed in April 2014. Both new and existing plants use organic Rankine cycle technology. The
second plant was supplied by Johnson Controls. The school will meet its goal of supplying all energy needs with geothermal
heating, geothermal power and solar power.
Neal Hot Springs, located 23 km (14 mi.) northwest of Vale in eastern Oregon, is the site of US Geothermal Inc. 22 MWe net Neal
Hot Springs project. Using 141ºC (287ºF) water the Neal Hot Springs project uses a supercritical R134a refrigerant working fluid
process, as well as pre-fabricated modular construction of major plant components. The project was built in three 7.3MWe binary
cycle modules by Turbine Air Systems. U.S. Department of Energy (USDOE) supported the project with a $96.8 million project
loan guarantee for the Neal Hot Springs project. The Neal Hot Springs project began operating in the fourth quarter of 2012.
The latest plant to come online is at Paisley in Lake County where the Surprise Valley Electrification Corp. completed construction
in 2014 of a 2.5 MWe power plant. Two 110oC (230oF) production wells and one injection well supplies the binary plant. The
modular plant was built by Turbine Air Systems. This project was operational in June 2014.
Overall there are 58 to 318 MWe of potential geothermal power capacity under development in Oregon (GEA, 2014).
2.1.12 Utah
Currently, Utah has three power plants online. Unit 1 of the Blundell Plant has a gross capacity of 26 MWe and Unit 2 has a
capacity of 12 MWe. Utah’s third power plant came online in December 2008 and was the first commercial power plant in the state
in more than 20 years. The Thermo Hot Springs power plant, a Cyrq Energy (formerly Raser Technologies) operation, came online
in 2009 and has a gross capacity of 10.3 MWe. In 2011, Thermo No. 1 solicited proposals and selected Ormat technologies to
provide more efficient generation equipment. With the May 2013 upgrade the plant now operates at or near the rated output of 10.3
MWe.
ENEL North America has begun exploratory drilling and resource confirmation operations at its Cove Fort project site. Cyrq
Energy and Standard Steam Trust have 12 other potential geothermal prospects in the early stages of planning/development and
overall Utah has 20 to 65 MWe of planned geothermal capacity for future production (GEA, 2014).
2.1.13 Washington
Although Washington is not currently producing power from any of its geothermal resources, Gradient Resources is planning to
develop the Mt. Baker geothermal resource. AltaRock Energy is pursuing an EGS project in Snohomish County.
2.1.14 Wyoming
In August 2008, a 250 kWe Ormat binary power unit was installed at Rocky Mountain Oil Test Site and a month later it began
operating. As of January 2009, the unit had produced more than 485 MWh of power from 413,000 tonnes of hot water annually.
The demonstration project operated until 2013 when testing was officially completed. RMOTC investigated developing another site
for the installation of a 0.28 MWe GHCP unit in 2010, but nothing has been developed to date (GEA 2011).
3. GEOTHERMAL DIRECT UTILIZATION
3.1 Background
Geothermal energy is estimated to currently supply for direct heat uses and geothermal (ground-source) heat pumps 75,862 TJ/yr
(21,074 GWh/yr) of heat energy in the United States. The corresponding installed capacity is 17,416 MWt. Of these values, direct-
use is 9192 TJ/yr (2,553 GWh/yr) and 616 MWt, and geothermal heat pumps the remainder. It should be noted that values for the
capacity and energy supplied by geothermal heat pumps are only approximate (and probably conservative) since it is difficult to
determine the exact number of units installed, and since most are sized for the cooling load, they are generally oversized in terms of
capacity for the heating load.
Most of the direct use applications have remained nearly constant increasing slightly over the past five years; however geothermal
heat pumps have increased significantly. A total of three new projects have come on line in the past five years. Agricultural drying

Boyd, Sifford and Lund
5
has decreased the most due to the closing of the onion/garlic dehydration plant at Empire, Nevada. Two district heating projects
have also shut down; the Litchfield Correctional Facility in California and the New Mexico State University system, however one
at Boise State University has come on line. There have been a slight increase in snow melting, cooling and fish farming, with a
major increase in industrial process heating due to one biodiesel plants (Nevada – the one in Oregon has been shut down), a
brewery (Oregon) and a laundry (California) coming on line. In summary, when considering direct-use without geothermal heat
pumps, the distribution of annual energy use is as follows: 34% for fish farming, 28% for bathing and swimming pool heating, 15%
for individual space heating, 9% for greenhouse heating, 9% for district heating, 3% for agricultural drying, 2% for industrial
process heating, <1% for cooling and <1% for snow melting. Geothermal heat pumps accounts for 88% of the annual use, and has
increased 1.4 times in the past five years with a 8% annual growth rate.
Figure 2 shows the direct-use development over the past 35 years, without heat pumps. A summary of direct-heat use by category is
presented in Table 5.
Figure 2. Direct-use growth in the United States (without geothermal heat pumps).
3.2 Space Heating
Space heating of individual buildings (estimated at over 2,000 in 17 states) is mainly concentrated in Klamath Falls, Oregon where
about 600 shallow wells have been drilled to heat homes, apartment houses and businesses. Most of these wells use downhole heat
exchangers to supply heat to the buildings, thus, conserving the geothermal water (Culver and Lund, 1999). A similar use of
downhole heat exchangers is found in the Moana area of Reno, Nevada (Flynn, 2001).
3.3 District Heating
There are 21 geothermal district-heating systems in the United States, most being limited to a few buildings. Two small district
heating projects have also shut down; the Litchfield Correctional Facility in California and the New Mexico State University
system. The newest is a project in Lakeview, Oregon connecting five schools, the local hospital and health care facility with an
annual energy use of 16.35 TJ/yr and installed capacity of 1.6 MWt. In the rural community of Canby, geothermal heat is used for
heating buildings, a greenhouse, and most recently driers and washers in a laundry (Merrick, 2009). The city system in Boise, Idaho
has a total of 58 buildings on their system consisting of 380,000 m2 of floor area using 700,000 m3 of water running through 21 km
of pipelines at 77oC. The system was extended across the Boise River in 2012 to Boise State University. At the university nine
buildings are heated covering 60,000 m2 of floor area. The system has an estimated installed capacity of 4.85 MWt producing 50
TJ/yr. Klamath Falls system has expanded by adding an additional greenhouse of 0.4 ha.
3.4 Aquaculture Pond and Raceway Heating
There are 51 aquaculture sites in 11 states using geothermal energy. The largest concentration of this use is in the Imperial Valley
in southern California and operations along the Snake River Plain in southern Idaho. There is a report that some of the facilities in
the Imperial Valley have closed, but reliable information is lacking. A large facility at Kelly Hot Springs in northern California has
been expanding and now produces slightly over half a million kg of tilapia annually. Two unique aquaculture related projects are in
operation in Idaho and Colorado – that of raising alligators, the former for their meat and skins, and the latter as a tourist attraction
(Clutter, 2002). Recent trends in the U.S. aquaculture industry have seen a decline in growth due to saturation of the market and
competition from imports.
3.5 Greenhouse Heating
There are 44 greenhouse operations in nine states using geothermal energy. These cover an area of about 45 ha, have an installed
heat capacity of 97 MWt and an annual energy use of 800 TJ/yr (222 GWh). The main products raised are potted plants and cut
flowers for local markets. Some commercial tree seedlings and vegetables (organic tomatoes and peppers) are also grown in
0
2500
5000
7500
10000
An
nu
al
En
erg
y (
TJ
/yr)
1975 1980 1985 1990 1995 2000 2005
Resorts / Spas Space Heating Aquaculture
Greenhouses Industrial Processes
Boyd, Sifford and Lund
6
Oregon; however raising vegetable is normally not economically competitive with imports from Central America, unless they are
organically grown.
3.6 Industrial Applications and Agricultural Drying
One biodiesel plant is still in operation in Nevada whereas the one in Oregon has been shut down. This plant primarily uses
geothermal energy for the distillation of waste grease from restaurants. Small industrial uses include clothes driers and washer
installed in Canby, California, and a brewery using heat from the Klamath Falls district heating system for brewing beer and
heating the building (Chiasson 2006, Merrick, 2009). The main loss is the closing of an onion/garlic dehydration plant at Empire,
Nevada due to competition with imported garlic from China. The spider mites raising facility near Klamath Falls has also been shut
down. The installed industrial capacity for these applications is 38 MWt and the annual energy use 493 TJ/yr (137 GWh/yr) for
eight facilities located in three states.
3.7 Cooling and Snow Melting
The two major uses of geothermal energy are for pavement snow melting, on the Oregon Institute of Technology (OIT) campus,
and keeping the Aurora Ice Museum frozen year-round at Chena Hot Springs, Alaska. OIT campus snow melt system is at 3,753 m2
and the ammonia absorption chiller in Alaska keeps a 1,000 tonnes of ice frozen as the building’s walls and roof, even though it
reaches 32oC outside in the summer. Over 10,000 visitors a year visit the facility that has a bar, beds and many ice sculptures
(Holdman and Erickson, 2006). The installed capacity for this application is 2.3 MWt and the annual energy use is 48 TJ/yr (13
GWh/yr).
3.8 Spas and Swimming Pools
This is one of the more difficult applications to quantify and even to find all the actual sites, as most owners do not know their
average and peak flow rates, as well as the inlet and outlet temperatures. Most of the locations and some of the data have come
from a number of hot spring/spa publications available for most states. As a result, we often have to estimate the capacity and
energy use based on our experience with similar facilities. There are 242 facilities in 17 states that we have identified, with an
estimated installed capacity of 113 MWt and annual energy use of 2,557 TJ/yr (711 GWh/yr).
3.9 Geothermal (Ground-Source) Heat Pumps
The number of installed geothermal heat pumps has steadily increased over the past 15 years with an estimated 80,000 equivalent
12 kWt units installed each of the past five years – a decrease from the 100,000 to 120,000 units per year during the previous five
years. Even though the actual number of installed units is difficult to determine, the present estimate is that there are at least 1.4
million units installed, mainly in the mid-western and eastern states. Of these approximately 60% of the units are installed in
residences and the remaining 40% in commercial and institutional buildings. The current trend is that most of the newer units are
being installed in commercial institutional buildings (60%) and only 40% in residential locations. Approximately 90% of the units
are closed loop (ground-coupled) and the remaining open loop (water-source). Within the residential sector, of the closed loops
systems, approximately 30% are vertical and 70% horizontal, as the latter are cheaper to install. In the institutional and commercial
sector, 90% are vertical and only 10% horizontal, constrained by ground space in urban area. Presently, the ratio of new installation
to retrofit installations is 3:1. The estimated full load hours in heating mode is 2,000/yr, and in cooling mode is 2,200/yr. The
installation cost is estimated at US$6,000 per ton (3.5 kW) for residential and US$7,000 per ton (3.5 kW) for commerical. The units
are found in all 50 states and are growing about 8% a year. It is presently a US$2 to US$3 billion annual industry. The current
installed capacity is 16,800 MWt and the annual energy use in the heating mode is 66,670 TJ/yr (18,500 GWh/yr). The largest
installation (130 tons (455 kW)) currently under construction is for Ball State University, Indiana where 4,100 vertical loops are
being installed.
3.9 Conclusions – Direct-Use
The distribution of capacity and annual energy use for the various direct-use applications are shown in Table 5 and are based on
records keep at the Geo-Heat Center. We estimate that the estimates are anywhere from 5 to 10% under reported, due to their small
sizes, lack of data and often isolated locations.
The growth of direct use over the past five years is all due to the increased use of geothermal heat pumps, as traditional direct-use
development has remained almost flat as shown in Figure 2. Unfortunately, there is little interest for direct-use at the federal level,
as their interests are mainly in promoting and developing Enhanced (Engineered) Geothermal Systems (EGS). There are few
incentives for the traditional direct-use development, but as mentioned earlier, there are tax incentives for geothermal heat pumps at
the federal level and in some states such as Oregon. Since, most direct-use projects are small, there are few, if any, developers
and/or investors who are interested in supporting these uses.
4. WELLS DRILLED
Most wells drilled for geothermal use were for power generation. Assuming 3 MWe per well, and each approximately 2,500 meters
deep (deeper at The Geysers and shallower in Nevada where most of the wells were drilled), the increase of 312 MWe added
approximately 258 km (vertical) including exploratory and injection wells, and direct use added approximately 4 km. Most direct-
use work concentrated on improving and refurbishing existing wells. See Table 6 for details. Geothermal heat pumps wells, which
are not included in this table, probably added 200,000 vertical holes at 75 m each for a total of 15,000 km over the five years.
5. PROFESSIONAL GEOTHERMAL PERSONNEL
Professional geothermal personnel with university degrees are higher mainly due to an increase in the installed capacity of power
plants. Geothermal Power plants are estimated to employ 1.7 person/years per installed megawatt (Kagel, 2006). It is assumed that
approximately 0.5 person/year is due to professional personnel. Due to an increase in funding from USDOE Office of Geothermal
Technologies, personnel in the private industry as well as with the government institutions, as well as National Laboratories and
Universities increased. Only about 50 person/years are due to direct-use geothermal. See Table 7 for details.

Boyd, Sifford and Lund
7
6. INVESTMENT IN GEOTHERMAL
Again, the majority of the investment in geothermal was for geothermal electric power plants. We estimate that US$4,000 (Western
Governor’s Association, 2006) is invested for every kilowatt of installed capacity. Thus, for the new 312 MWe of installed capacity
over the past five years, US$1.2 billion was invested. Above half of this was for field and plant development and 25% each for
R&D and for the operation. Direct-use only added about US$2,000 million; however, not shown in Table 8 is the approximately
US$2.5 billion spent annually on geothermal heat pump installations and equipment (personal communication, John Geyer, Oct.
2009).
7. ENERGY AND CARBON SAVINGS
The total electricity produced from geothermal energy in the U.S. is equivalent to savings 28.1 million barrels (4.2 million tonnes)
of fuel oil per years (generating at 0.35 efficiency). This produces a savings of 3.69 million tons of carbon annually. The total direct
utilization including geothermal heat pump energy use in the U.S. is equivalent to saving 17.8 million barrels (2.70 tonnes) of fuel
oil per years (producing heat at 0.70 efficiency). This produces a savings of 2.36 million tonnes of carbon annually. If the savings in
the cooling mode of geothermal heat pumps is considered, then this is equivalent to an additional savings of 9.26 million barrels
(1.38 million tonnes) of carbon annually.
In total, the savings from present geothermal energy production in the U.S., both electricity and direct-use amounts to 55.2 million
barrels (8.28 million tonnes) of fuel oil equivalent (TOE) per year, and reduces air pollution by 7.26 million tonnes of carbon
annually. CO2 reduction is estimated at 20.6 million tonnes
8. ACKOWLEDGEMENTS
Ben Mateek of the Geothermal Energy Association for his valuable assistance with power plant data.
REFERENCES
Albuquereque Business Journal, 2014, http://www.abqjournal.com/336816/news/excerpt-tapping-hot-water-for-electricity-cyrq-
works-on-energy-frontier-2.html
California Energy Almanac, 2014, http://energyalmanac.ca.gov/electricity/total_system_power.html, California Energy
Commission
Calpine, 2014, Houston, TX, from their website: www.calpine.com
Chaisson, A., 2006, From Creamery to Brewery with Geothermal Energy: Klamath Basin Brewing Company, Geo-Heat Center
Quarterly Bulletin 27/4, Oregon Institute of Technology, Klamath Falls, OR, pp. 1-3.
Clutter, T., 2002, Out of Africa – Aquaculturist Ron Barnes Uses Geothermal Water in Southern Oregon to Rear Tropical Fish from
African Rift Lake, Geo-Heat Center Quarterly Bulletin, 23/3, Oregon Institute of Technology, Klamath Falls, OR, pp. 6-8.
Culver, G and J. W. Lund, 1999, Downhole Heat Exchangers, Geo-Heat Center Quarterly Bulletin, 20/3, Oregon Institute of
Technology, Klamath Falls, OR, pp. 1-11.
Cyrq Energy, 2014, http://www.cyrqenergy.com/projects/lightning-dock-geothermal/
EIA, 2009, Energy Information Agency, Washington, DC, from their website: www.eia.gov.
EIA, 2009, Energy Information Agency, Washington DC, from their website: www.eia.gov/electricity
Geothermal Energy Association, 2014, Annual U.S. & Global Geothermal Power Production Report, GEA, Washington DC
Geothermal Energy Association, 2013, Annual U.S. Geothermal Power Production and Development Report, GEA, Washington
DC
Geothermal Energy Association, 2011, Annual U.S. Geothermal Power Production and Development Report, GEA, Washington
DC
Geyer, J., 2009, John Geyer and Assoc., Vancouver, WA, personal communication
Hawaiian Electric Company, 2104, http://www.hawaiianelectric.com/heco/Clean-Energy/Renewable-Energy-Basics/Geothermal#2
Holdmann G., and D. C. Erickson, 2006, Absorption Chiller for the Chena Hot Springs Aurora Ice Museum, Geo-Heat Center
Quarterly Bulletin 27/3, Oregon Institute of Technology, Klamath Falls, OR, pp. 5-6.
Kagel, A., 2006, Handbook on the Externalities, Employment, and Economics of Geothermal Energy, Geothermal Energy
Association, Washington, DC, 65 p.
Lund, J. W., 2006, Chena Hot Springs, Geo-Heat Center Quarterly Bulletin, 27/3, Oregon Institute of Technology, Klamath Falls,
OR, pp. 2-4.
Lund, J. W. and T. L. Boyd, 2009, Geothermal Utilization on the Oregon Institute of Technology Campus, Klamath Falls, Oregon,
Geothermal Resources Council Transactions, 33, Davis, CA (CD-ROM).
Lund, J., et al, 2010, The United States of America Country Update 2010, Proceedings World Geothermal Congress 2010, Bali,
Indonesia, 25-29 April 2010.
Merrick, D., 2009, Canby’s Geothermal Laundromat, Geothermal Resources Council Transactions, 33, Davis, CA (CD-ROM).

Boyd, Sifford and Lund
8
MidAmerican Renewables, 2014, from their website: www.midamericanrenewablesllc.com
Montana Dept. of Commerce, 2014, http://commerce.mt.gov/energy/geothermal.mcpx
Muffler. L.J.P., (editor), 1979, Assessment of Geothermal Resources in the United States – 1978. U.S. Geological Survey Circular
790, U.S. Department of Interior, Arlington, VA.
Nevada Bureau of Mines and Geology, 2014, http://minerals.state.nv.us/ogg_nvgeorespro.htm
Tester, J. W., B.J. Anderson, A. S. Batchelor, D.D. Blackwell, R. DiPippo, and E.M, Drake (editors), 2006, The Future of
Geothermal Energy Impact of Enhanced Geothermal Systems on the United States in the 21st Century, prepared by the
Massachusetts Institute of Technology for the U.S. Department of Energy, Washington, D. C., 358 p.
Western Governor’s Association, 2006, Geothermal Task Force Report, Western Governor’s Association, Denver, CO, 66 p.
STANDARD TABLES
TABLE 1. PRESENT AND PLANNED PRODUCTION OF ELECTRICITY
TABLE 2. UTILIZATION OF GEOTHERMAL ENERGY FOR ELECTRIC POWER GENERATION AS OF 31
DECEMBER 2013
Locality Power Plant Name Year
Com-
missioned
No.
of
Units
Status Type
of
Unit
Total
Installed
Capacity
Total
Running
Capacity
Annual
Energy
Produced
(2013)
Total under
Constr. or
Planned
MWe* MWe* GWh/yr MWe
AK - Chena Hot
Springs
Chena 2006 3 B 0.7
CA-Coso Navy I 1987 3 2F 102.4
CA-Coso BLM 1988 3 2F 99.9
CA-Coso Navy II 1989 3 2F 100
CA-Honey Lake Wineagle 1985 2 B 0.7
CA-Honey Lake Amedee 1988 2 B 1.6
CA-Honey Lake Honey Lake 1989 2 B 1.5
CA-Mammoth Mammoth II 1990 3 B 30
CA - Mammoth Mammoth Complex
Repowering
2013 4 B 7.5
CA-East Mesa Ormesa I 1986 2 B 20.7
CA-East Mesa Ormesa II 1987 1 2F 21.9
CA-East Mesa Ormesa IH 1988 1 B 11.8
CA-East Mesa Ormesa IE 1988 2 B 11.7
CA-East Mesa GEM II 1989 1 2F 18
CA-East Mesa GEM III 1989 1 2F 18
CA-East Mesa GEM Bottoming Unit 2007 1 B 9
CA-East Mesa Ormesa II Upgrade 2007 B 4.3
CA-Heber Heber I 1985 2 2F 52
CA-Heber Heber II 1993 7 B 51
CA-Heber SIGC 1993 7 B 40.2
CA-Heber Goulds ll 2005 B 13.3
In operation in
December 2013
3,477 17 878,340 2,739 78,241 269 107,938 789 76,891 253 1,144,887 4,067
Under construction
in December 2014
Funds committed,
but not yet under
construction in
December 2014
Estimated total
projected use by
20204,027
Total
Other Renewables
(specify)
Capacity
MWe
Gross
Prod.
GWh/yr Capacity MWe
Gross
Prod.
GWh/yr
Geothermal Fossil Fuels Hydro Nuclear
Capacity
MWe
Gross
Prod.
GWh/yr
Capacity
MWe
Gross
Prod.
GWh/yr
Capacity
MWe
Gross
Prod.
GWh/yr
Capacity
MWe
Gross
Prod.
GWh/yr

Boyd, Sifford and Lund
9
CA-Heber Goulds l 2006 2 B 10
CA-Heber Heber South 2008 1 B 13.3
CA-North
Brawley
North Brawley 2008 B 50
CA-Salton Sea Salton Sea I 1982 1 1F 10
CA-Salton Sea Vulcan 1986 1 2F 40
CA-Salton Sea Salton Sea III 1989 1 2F 54
CA-Salton Sea Del Ranch (Hoch) 1989 3 2F 49
CA-Salton Sea Elmore 1989 1 2F 49
CA-Salton Sea Leather 1990 1 2F 49
CA-Salton Sea Salton Sea II 1990 3 2F 20
CA-Salton Sea Salton Sea IV 1996 1 2F 48
CA-Salton Sea Salton Sea V 2000 1 2F 58
CA-Salton Sea CE Turbo 2000 1 1F 10
CA-Salton Sea John L. Featherstone
(Hudson Ranch 1)
2012 1 3F 50
CA-The Geysers McCabe (5&6) 1971 2 D 106
CA-The Geysers Ridgeline (7&8) 1972 2 D 106
CA-The Geysers Eagle Rock (11) 1975 1 D 110
CA-The Geysers Cobb Creek (12) 1979 1 D 110
CA-The Geysers Sulphur Spring (14) 1980 1 D 109
CA-The Geysers Big Geyser (13) 1980 1 D 97
CA-The Geysers Socrates (18) 1983 1 D 113
CA-The Geysers Sonoma (3) 1983 1 D 72
CA-The Geysers Calistoga (19) 1984 1 D 80
CA-The Geysers Grant (20) 1985 1 D 113
CA-The Geysers Lake View (17) 1985 1 D 113
CA-The Geysers Quicksilver (16) 1985 1 D 113
CA-The Geysers West Ford Flat (4) 1988 2 D 28
CA-The Geysers Bear Canyon (2) 1988 2 D 20
CA-The Geysers Aidlin (1) 1989 2 D 20
CA-The Geysers NCPA I 1983 2 D 110
CA-The Geysers NCPA II 1985 2 D 110
CA-The Geysers Bottle Rock 2007 1 D 55
HI-Puna Puna 1992 1 B 30
HI-Puna Puna Expansion 2011 10 B 8
ID- Raft River Raft River 2008 2 B 15.8
NM- Lightening
Dock
Lightening Dock 2013 1 B 4
NV - Beowawe Beowave 1985 1 2F 17.7
NV - Beowawe Beowawe 2 2011 3 B 2
NV - Blue
Mountain
Faulkner 2009 B 49.5
NV - Brady Hot
Spring
Brady Hot Spring 1992 3 2F 26.1
NV - Brady Hot
Spring
Brady 2002 B 5.3
NV - Deadhorse
Wells (Wild
Rose)
Don A. Campbell
(Wild Rose)
2013 B 16
NV - Desert Peak Desert Peak II 2006 2 B 23
NV - Desert Peak Desert Peak II EGS 2013 1 EGS 1.7
NV - Dixie Valley Dixie Valley 1988 1 2F 64
NV - Dixie Valley Dixie Valley 2012 B 6.2
NV - Dixie Valley Jersey Valley 2010 B 19.4
NV - Florida
Canyon Mine
Florida Canyon Mine 2012 Co-
produ
ction
0.1
NV - Hazen
(Black Butte)
Patua Phase 1 2013 B 30
NV - Hot Sulphur
Springs
Tuscarora 2012 B 32
NV - McGinness
Hills
McGinness Hills 2012 B 52
NV - Salt Wells
(Eightmile Flat)
Salt Wells 2009 B 18.1
NV - San Emidio
(Empire)
San Emidio 1987 B 4.8

Boyd, Sifford and Lund
10
NV - San Emidio
(Empire)
San Emidio Repower 2012 B 13
NV - Soda Lake Soda Lake 1 1987 4 B 5.1
NV - Soda Lake Soda Lake 2 1991 6 B 18
NV - Steamboat Steamboat I 1986 7 R B 7
NV - Steamboat Steamboat IA 1988 2 R B 2
NV - Steamboat Steamboat 2 1992 2 B 29
NV - Steamboat Steamboat 3 1992 2 B 24
NV - Steamboat Galena l (Richard
Burdette)
2005 2 B 27
NV - Steamboat Galena II 2007 1 B 12.4
NV - Steamboat Galena III 2008 1 B 27.5
NV - Steamboat
Hills
Steamboat Hills 1988 1 1F 14.4
NV - Steamboat
Hills
Steamboat Hills 2007 1 B 4.6
NV - Stillwater Stillwater 2009 1 B 47.3
NV - Wabuska Wabuska I 1984 2 B 1.1
NV - Wabuska Wabuska II 1987 1 B 1.1
OR- Klamath
Falls
OIT 2009 1 B 0.3
OR- Neal Hot
Springs
Neal Hot Springs 2012 3 B 33
UT- Cove Fort Cove Fort 2013 B 25
UT- Roosevelt Blundell 1 1984 1 1F 26.1
UT- Roosevelt Blundell 2 2007 1 B 12
UT- Thermo Hot
Spring
Thermo Hot Spring 2009 52 B 10
Total 3,477 17 550
1F = Single Flash, 2F = Double Flash, 3F = Triple Flash, D = Dry Steam, B = Binary (Rankine cycle), H = Hybrid, O = Other
TABLE 3. UTILIZATION OF GEOTHERMAL ENERGY FOR DIRECT HEAT AS OF 31 DECEMBER 2014 (other than
heat pumps)
I = Industrial process heat, C = Air conditioning (cooling), A = Agricultural drying (grain, fruit, vegetables), F = Fish farming, S =
Snow melting, H = Individual space heating (other than heat pumps), D = District heating (other than heat pumps), B = Bathing and
swimming (including balneology), G = Greenhouse and soil heating
Maximum Utilization Capacity Annual Utilization
Locality Type Flow Rate Temperature (oC) Enthalpy (kJ/kg) Ave. Flow Energy Capacity
(kg/s) Inlet Outlet Inlet Outlet (MWt) (kg/s) (TJ/yr) Factor
Alaska H,G,B,C 7.8 156.2 0.6
Arkansas H 0.4 7.3 0.7
Arizona H,F,B 23.5 317.4 0.43
California D,H,G,F,B 105.1 2183.6 0.7
Colorado D,H,G,F,B 29.5 627.6 0.7
Georgia H,B 0.6 11.0 0.6
Idaho D,H,G,F,B 94.2 1479.1 0.5
Montana H,G,F,B 15.8 297.8 0.6
New Mexico D,H,G,F,B 38.7 335.7 0.3
Nevada D,H,F,A,B 74.8 1153.6 0.5
New York H,B 0.9 12.1 0.4
Oregon D,H,G,F,I,A,S,B 77.8 802.8 0.3
South Dakota D,H,F,B 66.3 577.6 0.28
Texas H,B 4.0 27.4 0.2
Utah H,G,F,B 45.8 449.9 0.3
Virginia H 0.3 3.1 0.3
Washington B 1.9 45.5 0.8
West Virginia B 0.1 3.7 0.8
Wyoming H,G,F,S,B 28.3 701.0 0.8
TOTAL 615.9 9192.2 0.47
Boyd, Sifford and Lund
11
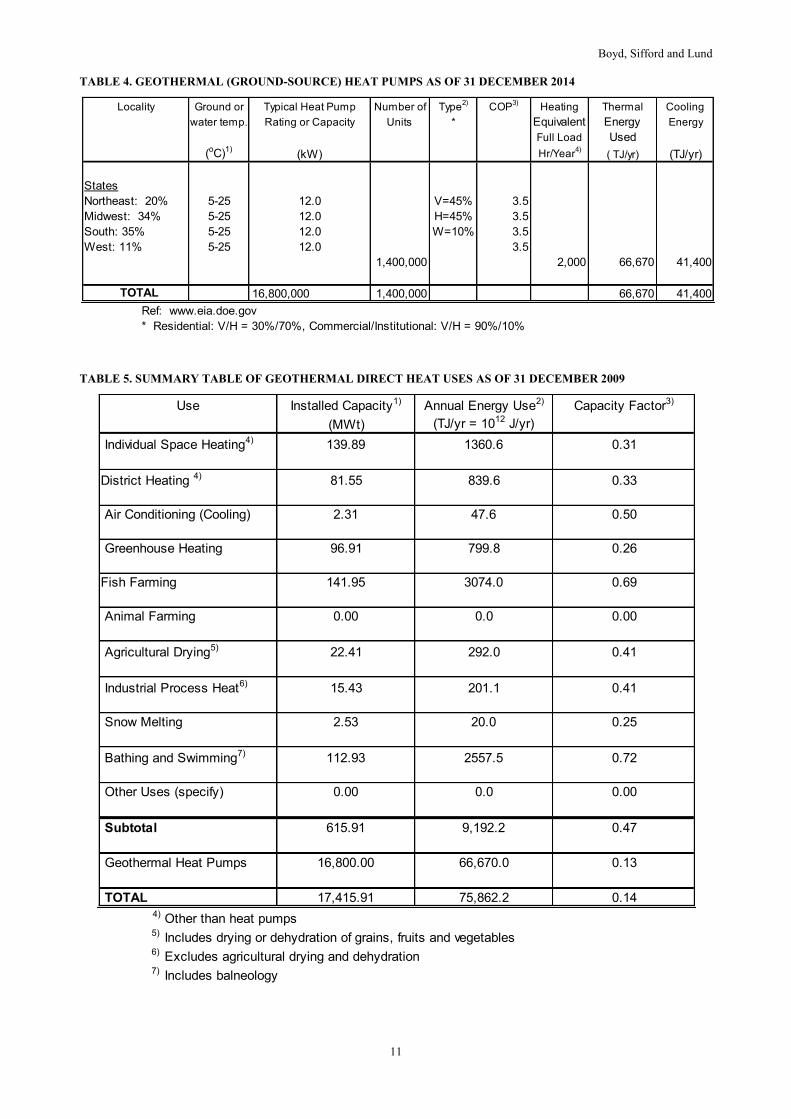
TABLE 4. GEOTHERMAL (GROUND-SOURCE) HEAT PUMPS AS OF 31 DECEMBER 2014
TABLE 5. SUMMARY TABLE OF GEOTHERMAL DIRECT HEAT USES AS OF 31 DECEMBER 2009
Locality Ground or Typical Heat Pump Number of Type2)
COP3)
Heating Thermal Cooling
water temp. Rating or Capacity Units * Equivalent Energy Energy
Full Load Used
(oC)1)(kW) Hr/Year
4)( TJ/yr) (TJ/yr)
States
Northeast: 20% 5-25 12.0 V=45% 3.5
Midwest: 34% 5-25 12.0 H=45% 3.5
South: 35% 5-25 12.0 W=10% 3.5
West: 11% 5-25 12.0 3.5
1,400,000 2,000 66,670 41,400
TOTAL 16,800,000 1,400,000 66,670 41,400
Ref: www.eia.doe.gov
* Residential: V/H = 30%/70%, Commercial/Institutional: V/H = 90%/10%
Use Installed Capacity1) Annual Energy Use2) Capacity Factor3)
(MWt) (TJ/yr = 1012 J/yr)
Individual Space Heating4) 139.89 1360.6 0.31
District Heating 4) 81.55 839.6 0.33
Air Conditioning (Cooling) 2.31 47.6 0.50
Greenhouse Heating 96.91 799.8 0.26
Fish Farming 141.95 3074.0 0.69
Animal Farming 0.00 0.0 0.00
Agricultural Drying5) 22.41 292.0 0.41
Industrial Process Heat6) 15.43 201.1 0.41
Snow Melting 2.53 20.0 0.25
Bathing and Swimming7) 112.93 2557.5 0.72
Other Uses (specify) 0.00 0.0 0.00
Subtotal 615.91 9,192.2 0.47
Geothermal Heat Pumps 16,800.00 66,670.0 0.13
TOTAL 17,415.91 75,862.2 0.14
4) Other than heat pumps
5) Includes drying or dehydration of grains, fruits and vegetables 6) Excludes agricultural drying and dehydration 7) Includes balneology

Boyd, Sifford and Lund
12
TABLE 6. WELLS DRILLED FOR ELECTRICAL, DIRECT AND COMBINED USE OF GEOTHERMAL RESOURCES
FROM JANUARY 1, 2010 TO DECEMBER 31, 2014 (excluding heat pump wells)
TABLE 7. ALLOCATION OF PROFESSIONAL PERSONNEL TO GEOTHERMAL ACTIVITIES (Restricted to
personnel with University degrees)
TABLE 8. TOTAL INVESTMENTS IN GEOTHERMAL IN (2014) US$
Exploration1) (all) 114 4 5 15
>150o C 14 0 1 0
150-100o C 67 0 0 0
<100o C 0 5 2 0
Injection (all) 36 1 4
Total 231 10 12 15 258.37
41.03
72.13
Production 20.66
124.34
Purpose Wellhead
TemperatureNumber of Wells Drilled Total Depth (km)
Electric
Power
Direct
UseCombined Other
(specify)
0.21
(1) (2) (3) (4) (5) (6)
2 2 10 0 0 1,825
6 2 10 0 0 1,875
6 2 10 0 0 1,992
6 2 10 0 0 2,045
2 2 10 0 0 2,049
22 10 50 0 0 9,785
(1) Government (4) Paid Foreign Consultants
(2) Public Utilities
(3) Universities (6) Private Industry
(5) Contributed Through Foreign Aid Programs
2014
Total
Year Professional Person-Years of Effort
2010
2011
2012
2013
Direct Electrical Private Public
Million US$ Million US$ % %
1995-1999
2000-2004 100 200 80 20
2005-2009 2 500 95 5
2010-2014 375 70 30 713 750
N/A N/A
250 200
500 100
Funding Type
Million US$ Million US$
Period
Research &
Development Incl.
Field Development
Including Production
Utilization