the two faces of enron - danielsethics.mgt.unm.edu index enron case... · the authors use enron as...
TRANSCRIPT

Predicting Sustainable
Corporate Performance
The Integrity Index™ Case Study
The Two Faces of Enron
By:
CINDY OLSON (Enron’s Former Head of Global Human Resources – 16(b) Insider)
LYNN BREWER (Founder and CEO of The Integrity Institute)
RYAN PATRICK KENNEDY (Professor – University of Houston)
Table of Contents Abstract ...................................................................................................................................................... 1
Foreword ..................................................................................................................................................... 2
Introduction .............................................................................................................................................. 9
Background - The Two Faces of Enron .............................................................................................. 11
Case Study - A New Model for Predicting Sustainable Corporate Performance ...................... 27
Conclusion ................................................................................................................................................ 33
Appendix
A) The Integrity Index – Random Sample of Analytical Results
B) Predicting Unsustainable Corporate Performance
C) The Integrity Index (Selectorate Theory Model)
© 2010 The Integrity Institute Inc. No portion of this white paper may be copied or distributed without the express
written approval of The Integrity Institute Inc. or the authors. The Integrity Institute Inc. and the authors own the
copyrights to all written materials contained herein, with the exception of Appendix C, which is owned by the
authors, Bueno de Mesquita and Smith and is included for informational and educational purposes only.

1
Predicting Sustainable Corporate Performance THE INTEGRITY INDEX CINDY OLSON Enron‘s Former Head of Global Human Resources – 16(b) Insider
Foremost Enron Historian Author: The Whole Truth . . . So Help Me God – An Enlightened Testimony from Inside Enron‘s Executive Offices. Chief Operating Officer and President – The Integrity Institute LYNN BREWER
Author: Confessions of an Enron Executive: A Whistleblower‘s Story Managing Risks for Corporate Integrity Founder and Chief Executive Officer – The Integrity Institute
RYAN PATRICK KENNEDY
Assistant Professor – University of Houston Head of Research and Model Development – The Integrity Institute
The authors use Enron as a case study for advancing a method of game theory called Selectorate Theory to predict sustainable corporate performance as an example of the application and validation of The Integrity Index. The theory explains how structures within publicly-traded companies affect the ability of leaders to maintain their position within the company, why some companies are more prone to unsustainable corporate performance, and how the level and focus of self-interest defines the culture that can impact the structural integrity of the company and its ability to sustain its performance. The original dataset used in the validation of The Integrity Index included companies in the S&P 500 over an eight year period. The Selectorate Theory model has proven to be 73% accurate in predicting unsustainable performance at least two years in advance and had proven the point at which there is an 84% chance the company will have to manipulate their earnings to sustain their performance. 100% of the companies rated below 453 (out of a possible score of 1000) were ultimately accused of having committed securities fraud.

2
THE INTEGRITY INDEX CASE STUDY THE TWO FACES OF ENRON
“You can’t manage what you can’t measure.”
Dr. W. Edwards Deming
In December 2001, the fifth largest corporation in the United States filed for bankruptcy. Its demise came
virtually without warning. Over a ten year period, ending December 31, 2000, Enron would present
investors with a total return of 1,415%. Compared to the S&P 500 meager 383% return, Enron was
considered the darling of Wall Street. Much of Enron‘s rapid growth had come as a result of its trading of
derivatives with Wall Street firms such as BearStearns, Lehman Brothers, and GoldmanSachs. Despite
being named the ―Most Innovative Company‖ for six years in a row by Fortune Magazine, suddenly
Enron imploded much the same way BearStearns and Lehman Brothers did only last year. This begs us to
ask the question—
How do we predict sustainable performance?
Risk is inherent in any business. Business models require us to accept, manage and mitigate risk to the
greatest extent possible in order for us to sustain our performance. In order to do so, we must be able to
measure the risk. As the father of total quality management said, ―You can‘t manage what you can‘t
measure.‖ This leads us to ask the question which every CEO should be asking–
What risk does culture and internal structures play in the ability to sustain our performance?
In 1996, Ken Lay, then Enron‘s CEO and Chairman of the Board, knew something was changing as
energy trading became more of the central source of the company‘s revenue. While the world began to
focus on the external face of Enron – success based solely on external metrics – accolades and rapid rise in
stock price, Ken Lay began grappling with the internal face of Enron – a changing culture. In early 2000,
as the executive management team began determining a new vision for the company, Ken Lay‘s vision
was that Enron would become ―The Most Respected Company.‖ Jeff Skilling, Lay‘s successor, on the
other hand, suggested that Enron would become ―The Coolest Company on the Planet,‖ as he envisioned
a pair of giant sun glasses on the top of Enron‗s 50-story office building in downtown Houston. The
difference in their individual visions is but one of the many examples that will illustrate the different
leadership styles and cultures that developed within Enron from 1993 until its downfall in 2001.
As Enron‘s culture became more aggressive in pursuit of better and better earnings to support an
increasing stock price, Ken Lay watched the accolades grow in number as Fortune Magazine hailed Enron
the Most Innovative Company for six years in a row. Ken Lay held a Ph.D. in economics. Modeling and
metrics were the foundation for his leadership. While the accolades and stock price provided Wall Street
with a measure of Enron‘s success, Ken Lay was asking an essential question for which no metric existed.
Is our culture strong enough to sustain our performance?

3
Recognizing the failure of the current metrics to predict Enron, BearStearns, or Lehman‘s downfall, or
WorldCom, RiteAid, or General Electric‘s securities fraud, Lynn Brewer founded The Integrity Institute
in 2004 to predict and promote sustainable corporate performance. Based upon her personal experiences
at Enron, her own failure to tell Ken Lay she had suspected bank fraud at the hands of the CFO in 1998,
and ultimately realizing when she met with Ken Lay just two weeks before his untimely death, he never
had the tools necessary to manage the culture effectively as there was no measure of the risk that Enron‘s
culture was not healthy enough to sustain its performance. The lack of a predictable metric at the time of
Enron‘s failure proved to be at the core of Enron‘s downfall. In 2009, Cindy Olson, a member of Enron‘s
Executive Committee, the former head of Global Human Resources, and the foremost historian on Enron
joined The Integrity Institute based upon the belief that The Integrity Institute‘s model for predicting
sustainable performance will provide every CEO with an actionable measure of risk which she could not
provide to Ken Lay during her 23 years with the company.
The Integrity Institute uses a proprietary model based on game theory to predict sustainable corporate
performance at least two years in advance. The Integrity Institute‘s mission is to launch commercially
viable subscription-based forecasting tools that provide meaningful indicators and actionable processes to
mitigate risks for internal and external stakeholders. In 2010, The Integrity Institute will use its own
proprietary predictive model to launch the first-ever Integrity Index™ – an external metric designed
specifically to rate all public companies on the three US stock exchanges on their ability to sustain their
performance.
The Integrity Index model (the ―Integrity Index‖) is based upon a variety of social science theories,
including Selectorate Theory, and statistics which allows us to understand whether the structures in a
company are sufficient to keep employees engaged while at the same time reducing the risk of securities
fraud. The Selectorate Theory Model (the ―Model‖) is driven by the foundational understanding that all
human beings are driven by self-interest – this includes everyone from CEOs to receptionists. Generally
speaking, our self-interest comes in one of two forms: 1) Passion or 2) Legacy. For Mother Teresa, her
self-interest was passion for the children of Calcutta; for suicide bombers, their self-interest could be the
legacy of being a martyr. Self-interest is as unique as the individual. For some it can be the passion of
working for a company that does great things for the community or passion for the lifestyle their income
provides. Likewise, for some it can be the legacy we leave our children, or the legacy of being named the
CEO of a Fortune 500 company. The Model does not ―judge‖ moral issues of right and wrong or good
and bad. It simply identifies the structures required to support sustainable performance.
The Model proves, contrary to popular belief, the self-interest of CEOs and 16(b) Insiders is not driven by
greed and hubris; it is driven by a common thread among all employees – they simply want to keep their
job. This self-interest then drives the pressures and decisions facing CEOs. Among the greatest of those
pressures is meeting the targets Wall Street establishes as the quarterly earning potential of the company.
Miss the target and the CEO risks losing his/her job as institutional investors may become dissatisfied
with the stock‘s performance and their ROI. To sustain his/her position, the CEO must maintain the
support of institutional investors. To achieve this objective, the company (CEO) must distribute ―Public
4
Goods‖ (increased share price or dividends to shareholders) sufficient to maintain the support required to
keep his/her job. For instance, in the case of Carly Fiorina‘s role as CEO at Hewlett-Packard, she
ultimately lost her job because the stock price failed to increase and Wall Street had lost all faith in her.
Because the self-interest of investors was not met with an increase in the distribution of ―Public Goods,‖
Fiorina was ultimately fired by the board of directors.
The ability to increase the distribution of Public Goods requires a company sustain its performance. This
is where the health of the corporate culture can make or break a CEO‘s ability to achieve his/her strategic
objectives. An unhealthy culture makes meeting those objectives nearly impossible as efficiencies break
down with infighting and land-grabbing or power struggles. Too few CEOs focus on the significance of
corporate culture as a requirement for them to keep their job, and why should they – as long as they can
meet the earnings target. However, the Model proves an essential element – in order to sustain the
performance required to keep their job, a CEO must have the support of employees and Insiders which
requires an increase in the distribution of ―Private Goods‖ (increased compensation). If employees become
demanding, due to an unhealthy corporate culture, as was the case at Enron, the ability to maintain the
support necessary becomes too costly if compensation requires excessive cash. Many companies ultimately
resort to increasing the Private Gods by offering or increasing stock options to Insiders which only delays
the inevitable if the CEO is unable to increase the share price and thus the value of the stock options.
Despite the best intentions of the CEO, it becomes a proverbial house of cards.
Culture, Culture, Culture
Culture is a dynamic, ever-changing element of institutions. Whether it is the culture of our political,
banking, religious or capital market institutions, structural integrity requires a culture that will sustain
its existence or else it will fall like the Roman Empire. Governance, management, and compensation
structures are designed to provide the right balance between oversight, direction and incentive for
members of the institution. In the face of a changing culture, these structures can be diminished or if not
strong enough in the first place, can allow inadvertent changes in the culture that can impact the long-
term sustainability of the company without the CEO or board‘s knowledge until it is too late.
In public companies, meeting the targets of quarterly earnings is a primary requirement for CEOs to keep
their job. The intensity of the CEO‘s focus on quarterly earnings can have an indirect and yet dynamic, if
not devastating, impact on the overall health of the corporate culture. In order for ―members‖ or
employees to remain actively engaged in the institution or company, there must be sufficient Private
Goods distributed (e.g. compensation, benefits). If employees become disengaged or disenfranchised due to
diminished compensation (e.g. value of stock options or salary), the leader may not be able to achieve the
strategic objectives required to meet their quarterly earnings target.
Although compensation, direct or indirect, can become a driver of employee behavior, power (even
perceived power) can be a driver of certain cultural behavior. Depending upon how the influence of power
within the corporation is viewed, if the balance of power is reduced to an exclusive few, whether within

5
the c-suite or individual business units, it can further impact the culture of the corporation as employees
who feel ―left out‖ begin to look for ways to enrich themselves or may ultimately decide to simply leave
the company – taking with them the knowledge gained and/or trade secrets to their next employer who
just happens to be your biggest competitor.
As the narrow focus of quarterly earnings trickles down, if 16(b) Insiders feel their job is at risk, there can
be a propensity to overstate revenue or understate costs, if necessary for the company to meet its quarterly
earnings. This can occur often times without the CEO knowing, despite the belief that the CEO knows or
should know absolutely everything that occurs within the corporation. In fact, many will do so in support
of the CEO because if the CEO loses their job, the Insider‘s own job may be at risk as a new CEO could
decide to bring in a new senior management team.
As in political institutions, corporations have coalitions. The group which selects the leader/CEO and has
a say in the leader/CEO keeping his or her job is considered the Selectorate coalition. In a public company
this would be the board of directors and, to a greater extent, the institutional investors. Once in a position
of power, there is always opposition—internally there are people who want to succeed the leader, while the
external opposition could be a corporate raider or large private equity investment firm who is stimulated
to act if a drop in the stock price reduces the ROI or creates the opportunity or threat of a hostile takeover.
In each instance, the opposition can be considered a threat to the leader maintaining his position. His
strategy must be to build support for his agenda in order for him to keep his job. To meet this objective,
the leader must have a group of supporters who has greater power or influence than those of his
opposition. This group is called the Winning coalition. The benefits or compensation provided to this
coalition depends upon the amount of support necessary to sustain his position and the power and ability
of the individuals within the Winning coalition to influence others. In essence, in both the Selectorate and
Winning coalitions, the leader must satisfy the self-interest of the members of the coalition by distributing
―Private‖ or ―Public‖ Goods through compensation, power, or return on investment. The game begins as
the leader seeks to sustain his position of power, hold his opposition at bay, and provide a greater return
on investment than his competition which leads us to the two faces of Enron.
The Two Faces of Enron
Enron had two faces – the external face of accolades, awards, and stock price and the internal face of its
employees, most of whom contributed to Enron‘s success in one way or another over the years, all of
whom watched as the two faces of Enron‘s leadership divided its culture to a point where the company‘s
structural integrity was no longer sufficient to withstand market forces.
For a very long time, Enron managed to succeed based upon its ―external beauty‖ until its ―internal
ugliness‖ became obvious and the honeymoon with Wall Street came to an abrupt end. That is when
investors suddenly claimed they had been duped, somewhat like Cinderella‘s carriage which turned into a
pumpkin at the stroke of midnight. Enron was not a fairy tale and its employees did not go to work every
day to manipulate markets and steal from investors – quite the opposite. Enron, like most companies,

6
wanted to ―change the world.‖ Author Malcolm Gladwell describes this phenomenon in his article in the
New Yorker Magazine on January 8, 2007 entitled ―Open Secrets‖ (Enron, Intelligence and the Peril of
Too Much Information). While not the subject of this paper, Gladwell rightly argues it was not that
Enron hid the truth, but that it was openly transparent and despite the risk, people wanted what Enron
was selling – for better or for worse. The purpose of this paper is not to defend or criticize Enron but to
provide a better understanding of how the two faces of Enron (or any company for that matter) was
created and introduce a model that allows us to remove our rose colored glasses and finally see clearly that
which has often been hidden even from CEOs until it is too late.
Enron was not unique in its structure – a public company, traded on the New York Stock Exchange,
until late 2001. The company‘s Selectorate coalition consisted of a board of directors, all of whom had
stellar reputations, and very large institutional investors, like Janus and the California Public Employees
Retirement System (CalPERS) which is the United States largest pension fund. The Winning coalition
consisted of the best and brightest employees with MBAs who had graduated from Harvard, Yale, and
Princeton and worked on Wall Street. Meeting the self-interest of these coalitions seemed to require one
thing . . . rapid growth in earnings. Ultimately, Enron‘s demise was predictable as the demands of these
two groups exceeded Enron‘s ability to sustain its performance to meet their needs. In the end, the brazen
self-interest of the CFO caused him to find a way to benefit at a rate greater than Enron‘s traders, by
creating his own Ponzi Scheme, outside the purview of the board of directors, in pursuit of his own brazen
self-interest. There was only one problem, the Ponzi Scheme was dependent upon the CFO‘s ability to
exploit Enron‘s underperforming assets, which ultimately required him to commit securities fraud by
transferring those assets to his external hedge fund. Unfortunately, the structures within Enron had leant
themselves to the creation of an aggressive culture where the CFO‘s personal agenda was all too easy for
him to achieve. The validate the application of the Model to The Integrity Index, we analyzed over 400
companies so far, and were able to identify the weakening of the structural integrity of the company. The
Index, based upon the Model as an example, would have provided a smoking gun to Enron‘s Board of
Directors and CEO Ken Lay long before the CFO was able to commit the fraud.
Externally, Enron had a face that Wall Street loved – rapid growth in earnings allowing the Selectorate
coalition to remain satisfied with the leadership. As we will discuss within this paper, that external face
was often at conflict with the internal face of the two leadership styles that created the culture. One leader
was concerned with the change in culture brought about by the traders, while the other promoted the
aggressive culture of trading necessary to produce the results and benefits demanded by the various
coalitions. The ultimate result was a company that was not sustainable because the culture was not
unified in its support of the leadership and strategic direction necessary to sustain its performance.
Throughout the history of Enron, there were meta-coalitions built and destroyed as companies were
acquired, mergers occurred, and leaders rose through the ranks – each with their eye on the role of
succeeding Ken Lay as CEO. In 1993, it was Jeff Skilling and Rebecca Mark who were at war over the top
spot. That war would last from 1993 until 2000 when Rebecca Mark conceded to Jeff Skilling. Ultimately,

7
Skilling would manage to dethrone nearly everyone who ever held the title of vice chairman, believing
they would overthrow him in his quest to build his legacy as Enron‘s CEO.
By 1996, Jeff Skilling was becoming a force to be reckoned with. His focus on trading revenues and
building new businesses supported the earnings Wall Street demanded but created a cut-throat culture.
Although Ken Lay had concerns about the shift in Enron‘s culture under Jeff Skilling‘s leadership, Wall
Street appeared to validate Jeff Skilling‘s leadership skills, as the external metrics continued to provide
Enron‘s Board of Directors with the assurance that Jeff Skilling was doing all the right things by leading
Enron into new businesses. For those of us inside Enron, we had the rare opportunity to experience a
palatable cultural shift that had a significant impact to Enron‘s ultimate sustainability.
The purpose of this paper is to present a case study for a new model that predicts sustainable corporate
performance at least two years in advance by measuring the structural integrity of a company‘s culture
and the level of risk present in its structures to determine whether a company can sustain its projected
growth. For this, we present a compelling case that proves culture is a measurable risk that can be
managed by presenting the two leadership styles of Ken Lay and Jeff Skilling, both of which shaped the
culture of Enron, to a point, under Jeff Skilling, where the performance was no longer sustainable. From
those who knew them best, Lay‘s self-interest was driven from his passion to create a company where all
employees could use their ―God given‖ talent to accomplish things they never imagined, whereas
Skilling‘s self-interest was driven from his legacy or ego and always by the metrics dictated by the outside
world.
We should point out that the culture at Enron was not unique. General Electric faces a similar set of
circumstances. Jack Welch was driven by the self-interest of legacy (similar to Jeff Skilling) whereas Jeff
Immelt appears to be driven by the self-interest of passion for his company, employees, stakeholders,
environment, etc. (similar to Ken Lay). We might add that General Electric uses a very similar formula
for performance review designed and recommended by management consulting firm McKinsey. Known
fondly within the company as ―Rank and Yank‖ for its forced ranking, this system that breeds fear among
employees that they may lose their job which the Integrity Index model identifies as a driver of behavior
and creates unnecessary risk within the culture.
Fortune Magazine reported in 2006 that Jack Welch, often admired for his aggressive style (similar to Jeff
Skilling), was no longer the quality of leader required to sustain a company‘s performance. The cover
article said ―Welch‘s rules for winning don‘t work anymore.‖ The Old Rules of Jack Welch outlined
below are eerily a mirror reflection of Jeff Skilling – who by the way had little regard for Welch. The New
Rules, outlined by Fortune, mirror Ken Lay‘s ―rules.‖

8
New Rules vs. Old Rules
1 Agile is best; being big can bite you.
Big dogs own the street.
2 Find a niche, create something new. Be No. 1 or No. 2 in your market.
3 The customer is king. Shareholders rule.
4 Look out, not in.
Be lean and mean.
5 Hire passionate people. Rank your players; go with the A's.
6 Hire a courageous CEO. Hire a charismatic CEO.
7 Admire my soul. Admire my might.
When management expert Jim Collins (author of ―Good to Great‖ and ―Built to Last‖) was asked about
Jack Welch, he said two profound things: 1) ―Jack Welch did not make GE great, GE was already great.‖
and 2) ―Jeff Immelt will have to manage down what Jack Welch managed up.‖ Apparently Jeff Immelt
found that to be more difficult than expected because in 2009, General Electric was found to have
committed securities fraud beginning in 2001 – the year Welch retired. The company was ordered to pay
a $50M fine to the Securities and Exchange Commission, spending more than $200M in legal and
accounting fees, and losing $170B in market capitalization. While Ken Lay died before he was able to
restore his reputation, Jack Welch, who‘s own reputation was tarnished by scandal, is now attempting to
restore his authority as a leader with his 2009 comments to the Financial Times ―On the face of it,
shareholder value is the dumbest idea in the world. Shareholder value is a result, not a strategy . . . your
main constituencies are your employees, your customers, and your products.‖ Welch, no longer at risk of
losing his job as CEO of General Electric, seems to be acknowledging on some level he managed for short
term profits manipulating or managing earnings in pursuit of shareholder value.
As a former member of Enron‘s Executive Committee and the head of Enron‘s Global Human Resources,
Cindy Olson has put together a formal case study (relying upon her two decades of experience and inside
knowledge of Enron) that proves the validity and value of The Integrity Index™ Model as an enhancement
to the current corporate performance metrics. This revolutionary approach to predicting sustainable
performance succeeds where other metrics fail. The paper examines the key elements the Model uses to
predict unsustainable performance as they existed at Enron – which was among the original data set used
in the validation used for this paper as an example in the application of The Integrity Index. Olson gives
perspective that only a 16(b) Insider and senior executive can provide as to how decisions were made at
the highest levels within the company and the impact they had on the culture. It should also be noted here
that Olson, upon the death of Ken Lay, remains as the standing historian for the company, being the
highest executive that lived through the creation of Enron, through all of the mergers and growth of the
9
new businesses and ultimately the fallout from the companies downfall including the many
investigations, trials and convictions. Within the Model, she explains how the result ultimately caused
the structural integrity of Enron to be weakened to the point that the CFO was able to commit securities
fraud, out of his own brazen self-interest, without anyone, including the auditors, knowing, except for a
few mid-level executives. Assisting in the technical correlation of the Model to The Integrity Index
elements was Professor Ryan Kennedy of the University of Houston who oversees model design and
development of The Integrity Index for The Integrity Institute.
Olson outlines in the paper the fact that like most companies, Enron relied upon experts, like McKinsey,
Towers Perrin, Arthur Andersen, and the company‘s outside counsel, Vinsen & Elkins, to recommend to
management many of the structures that the Model in fact identifies as weaknesses leading to
unsustainable performance. Additionally, Enron spent millions of dollars implementing the SAP business
intelligence solution designed specifically to mitigate the risks, The Integrity Index model identifies as
predictors of unsustainable performance. However, Olson rightly argues that strategies created
independent of one another and/or the wrong technology can create the silos of information that often can
unintentionally impact the future performance of a company by weakening the culture without the
experts knowing. The value of The Integrity Index model, when launched, will be is its integrated
approach to predict the impact these strategies can have collectively on producing unsustainable results or
worse yet, in the case of Enron, identifies the structural weaknesses that were exploited by a CFO who
engaged in self-dealing behavior.
Unfortunately without reliable metrics, the Board of Directors, senior executives (except for the self-
dealing CFO) and investors were blindsided. Had The Integrity Index existed, Enron‘s Board of Directors
would have had a reliable predictive metric that would have identified the structural weaknesses in
sufficient time in which to make the structural changes required to manage Enron‘s culture to reduce the
risk of securities fraud at the hands of the CFO.
The purpose of this case study is to demonstrate the practical application in advancing game theory by
converting the Model into The Integrity Index as a predictive measure of sustainable corporate
performance. The translation of analytical results of the initial data set is included in Appendix A and
Appendix B demonstrates the correlation of the value of The Integrity Index model in proving the
diminished culture and structure of companies in that 100% of the companies which scored 453 or less
were ultimately accused of having committed securities fraud. A white paper outlining the methodology
used in validation of the Selectorate Theory Model can be found in Appendix C.
INTRODUCTION
As the head of Global Human Resources for what was once the 5th largest corporation, I believe
corporate culture is the primary driver of a company’s performance. With a degree in
accounting, I understand how underperforming assets can drain a company’s resources and

10
define its balance sheet. However, if employees are encouraged to and rewarded for acquiring
assets for short term gains that ultimately underperform then the long-term sustainability of the
company’s performance can be at risk. If employees are rewarded for violating their trading
limits and making trades that have no legitimate business purpose except for manipulating the
markets then there is something terribly wrong with the culture. I can assure you as the “Chief
Compensation Officer,” such behaviors at Enron, if rewarded, were done so without the full
extent of these structures being understood by Human Resources, Ken Lay and the
Compensation Committee of Enron’s Board of Directors.
I have had plenty of time since leaving Enron to reflect on the problems that existed, as well as
how we could have prevented the events that caused Enron to fail. I hope to present within this
paper a solution which I know would have provided the information necessary for Enron’s
CEO and Board of Directors to understand the quantifiable impact our structures and culture
had on our sustainability. The key would have been to provide such information in a timely
manner allowing for corrective action to be taken before it was too late.
Like any large international company, silos of information existed within Enron, as coalitions
were created that promoted a win-at-all-cost culture. Culture is not created overnight and for a
period of nearly two decades I watched Enron go from a values-based company lead by Ken
Lay to an earnings-driven company lead by Jeff Skilling. I’m not saying that you have to
sacrifice earnings for values. Quite to the contrary, CEOs will now be able to integrate values
and earnings as The Integrity Index identifies the structural integrity of the structures and
culture to mitigate risks (whether at a cultural or structure level) that may be impacting a
company’s ability to sustain its performance. I have gained perhaps the best understanding of
the leadership required to sustain a company’s performance and how a culture is shaped by its
leader because of the experience I had within Enron. Reporting to and knowing both Skilling
and Lay was a unique experience giving me a clear view of the “Two Faces of Enron.” Having
said that, I believe the argument presented in this paper provides the evidence that any CEO
and/or Board of Directors requires to determine when the structure and culture of the
organization is having a negative impact on their company’s performance before it is too late.
As a 16(b) Insider at Enron, I can assure you that I and my colleagues at the senior management
level were surprised as the rest of the world that our CFO had run an external Ponzi Scheme, as
much as the world was surprised by Bernie Madoff. When those of us inside Enron suddenly
and unexpectedly learned that our results had been falsified by our CFO we made every
attempt to prevent a run on the bank, including calls by Ken Lay to the President of the United
States. Similar to the sudden liquidity crises that hit the Wall Street banks, Enron was faced
with a liquidity crisis. Unlike the Wall Street banks, the Bush administration decided to let
Enron fail similar to the way they handled BearStearns and Lehman Brothers. What we now
know is that BearStearns, Lehman Brothers, Enron, the companies that were “saved” by the

11
government and even companies that watched and corrected the situation before they
imploded, had structures, systems and cultures in place which resulted in unsustainable
performance.
In 2002, Lynn Brewer wrote, “Look to Enron to foretell the future.” I echoed that sentiment in
my OpEd piece in the Houston Chronicle on October 4, 20081, “The current economic crisis is a
repeat of Enron, only on a bigger scale.” Even President Obama admits not much has changed
in chasing the deals. First it was Enron and the rest of Wall Street has followed.
Inside every company is a well-intentioned CEO relying on well-paid, top executives,
employees and expert consultants to do their jobs and to advise them, or accounting firms to
identify when they are at risk of committing securities fraud. CEOs also rely upon credit rating
agencies and their fundamental models to recognize weaknesses that may exist. Wall Street
analysts who pride themselves as being the smartest guys in the room attempt to find cracks in
the foundation of public companies with their models. Even the media plays a role in the
investigation of problems when the regulators fail to do so. With all of this scrutiny we must ask
ourselves why does history repeat itself?
The purpose of this paper is not to defend Enron but to provide insight from my personal
experiences I gleaned from 23 years at the company and the 8 years of fallout from its demise. I
believe that we can learn from our mistakes and I believe that The Integrity Index model will
provide a solution that will measure and quantify how a company’s structures and culture
impacts the sustainability of its performance before it is too late.
BACKGROUND
My career with Enron spanned over nearly two decades during which time I rose to hold
perhaps two of the most powerful positions inside Enron – I served on Enron’s Executive
Committee and headed Enron’s Global Human Resources. From both a tangible and intangible
perspective, I came to understand the key performance drivers upon which Enron relied and
which drove its business. While many remember Enron for its failures, I remember Enron for its
successes, which is why I was as surprised as anyone to learn that our CFO had perpetrated
securities fraud. Along with everyone else I have found myself asking the question – how could
this have happened?
Of course, when a CFO or Bernie Madoff is determined to commit fraud, he doesn’t tell
everyone – he keeps it quiet. He enlists or buys off those he needs to in order to perpetrate his
1 http://www.chron.com/disp/story.mpl/editorial/outlook/6039711.html

12
crimes and lies to those who he believes will stand in his way of achieving his objective. With
the exception of a handful of mid-level executives, no one knew of, engaged in, or benefited
from the fraud committed by Enron’s self-dealing CFO. For those working in collusion with the
CFO, their individual financial gain was enormous; for those who would never engage in such
behavior, the CFO left us in the dark through a series of lies to Wall Street and insiders.
Speaking for myself and my colleagues at the senior level, we all believed we were paying our
external consultants (and we paid them very large sums of money) to recommend structures
and accounting treatment so that investors in our company had confidence that what we were
doing was not only legal and met accounting standards but they were appropriate for our
organization. Coupled with the outside scrutiny of analysts, we believed that any structural
weaknesses that would have resulted in a risk of fraud being committed, including that carried
out by the CFO, should have ultimately been identified by the highly paid auditors, consultants
or the outside analysts. Given there was absolutely no collusion on the part of Enron’s
consultants, it means the CFO was just better at hiding the truth than the consultants were at
finding it. This is why the Model as an example in the application of The Integrity Index is such
a revolution because it not only identified the securities fraud; it predicted it one year before it
actually occurred.
As law abiding citizens, with insufficient metrics, we believed the external accolades confirmed
Enron was a company that had achieved enormous success including being named Fortune
Magazine’s “Most Innovative Company” for six years in a row and one of the “Best Places to
Work.” If that wasn’t enough evidence, rapid growth in our stock price affirmed our success.
By the end of 2000, Enron employed nearly 21,000 employees worldwide. The question is not
whether Enron was a good company or a bad company, but how is it that all of the internal and
external metrics missed the mark. The Model is the only valid metric I have seen that actually
predicted Enron’s outcome as far back as 1993. Although Enron momentarily regained its
strength within The Integrity Index when the Model is applied as an example, within a few
years, by 1995, Enron’s rating began to fall again and by 1998, it was clear that Enron did not
possess the essential governance structures to sustain its performance into 2000 – despite its
stock price reaching $90 before it was split. I am certain that had The Integrity Index existed at
the time, based on the Model, our CFO could not have perpetrated the crimes he did. For this
reason, I present what I believe to be a compelling argument as to why advancing social science
theories and statistics such as the Model, will make The Integrity Index the single greatest
evolution in corporate performance analysis.
In the spirit of full disclosure, I want to point out that I came to consider Ken Lay among my
most cherished mentors which is why I feel not only qualified but obligated to find a solution
that could have not only saved Enron but will save other CEOs who may find themselves in the

13
same predicament as Ken Lay . . . wondering how did this happen? For this reason, in 2009, I
joined The Integrity Institute because I know The Integrity Index is the answer. Let me start by
graphically demonstrating Enron’s position within The Integrity Index, had it existed between
1991 and 1999.
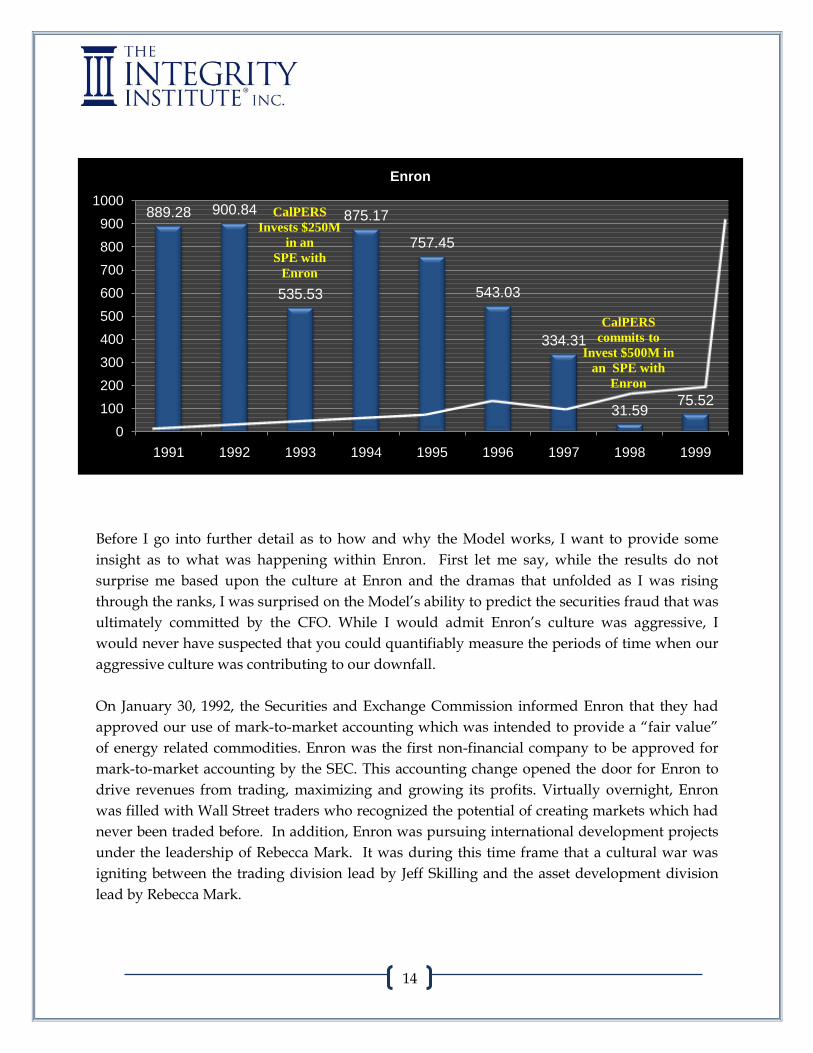
It is important to note that at the two times (1993 and 1998) that the United States’ largest
pension fund (CalPERS) invested $250M and $500M respectively, not in Enron stock, but in the
special purpose entity or off the balance sheet partnership that was at the core of Enron’s
downfall (JEDI), Enron’s score within The Integrity Index predicted Enron’s performance was
unsustainable. The Integrity Index rating could have saved CalPERS millions of dollars, as 100%
of the companies which scored below 453 in the validation of The Integrity Index, in the original
sampling of the S&P 500 ultimately are alleged to have committed securities fraud to artificially
sustain their performance.
889.28 900.84
535.53
875.17
757.45
543.03
334.31
31.59
75.52
0
100
200
300
400
500
600
700
800
900
1000
1991 1992 1993 1994 1995 1996 1997 1998 1999
14
889.28 900.84
535.53
875.17
757.45
543.03
334.31
31.5975.52
0
100
200
300
400
500
600
700
800
900
1000
1991 1992 1993 1994 1995 1996 1997 1998 1999
Enron
CalPERS
Invests $250M
in an
SPE with
Enron
CalPERS
commits to
Invest $500M in
an SPE with
Enron
Before I go into further detail as to how and why the Model works, I want to provide some
insight as to what was happening within Enron. First let me say, while the results do not
surprise me based upon the culture at Enron and the dramas that unfolded as I was rising
through the ranks, I was surprised on the Model’s ability to predict the securities fraud that was
ultimately committed by the CFO. While I would admit Enron’s culture was aggressive, I
would never have suspected that you could quantifiably measure the periods of time when our
aggressive culture was contributing to our downfall.
On January 30, 1992, the Securities and Exchange Commission informed Enron that they had
approved our use of mark-to-market accounting which was intended to provide a “fair value”
of energy related commodities. Enron was the first non-financial company to be approved for
mark-to-market accounting by the SEC. This accounting change opened the door for Enron to
drive revenues from trading, maximizing and growing its profits. Virtually overnight, Enron
was filled with Wall Street traders who recognized the potential of creating markets which had
never been traded before. In addition, Enron was pursuing international development projects
under the leadership of Rebecca Mark. It was during this time frame that a cultural war was
igniting between the trading division lead by Jeff Skilling and the asset development division
lead by Rebecca Mark.

15
By 1993, after experiencing nearly two years of a very successful trading business, Ken Lay
began to realize the significance of these cultural changes. Kurt Eichenwald, author of
Conspiracy of Fools recognizes it in his book:
In 1993 the fuse was lit. Enron would soon be pursuing wildly contradictory strategies.
One brought in huge earnings but little cash, and depended on Enron's credit ratings to
survive. The other would devour cash while producing next to no earnings for years,
potentially putting the credit rating at risk. Enron was on a collision course with itself.
It was in 1993 that Enron’s Integrity Index score took a sudden drop indicating a shift in the
structure. Inside the company, compensation structures became a major point of contention
between Jeff Skilling’s trading group and Rebecca Mark’s international asset group.
By 1994, Enron rebalanced its structures as salaries came in line with earnings as the war
between Skilling and Mark waged on. A Department of Labor audit in 1995 also helped to
bring salaries into balance, but around that same time frame, Enron’s culture was driving
changes in its structure causing its Integrity Index score to drop by approximately 15%. Not to
be left behind, Andrew Fastow, who had been trading financial derivatives, sought to be
recognized for his contribution to Enron’s revenue by being appointed as the CEO of the new
retail business (later known as Enron Energy Services or EES).
By 1996, Enron purchased Portland General Electric – bringing in yet another strong trading
culture to the mix with what was already forming. Making the integration of the cultures all the
more difficult was PGE was based in Portland, Oregon and while a few traders moved from
Houston to Portland, none of the traders were willing to move from Portland to Houston. This
caused yet another divide in the culture between Houston and Portland. The inability to
integrate these two cultures ultimately created the platform for the manipulation of power
prices at the hands of those employees in Portland who felt the need to prove themselves to
Corporate. Unfortunately, while Enron managed its trading risk books, the management of the
cultural divide was becoming more difficult, given the revenue being generated by Portland
and Houston’s desire to beat what it saw as the competition – Enron’s West Power Trading
Desk. Meanwhile Ken Lay was being pursued by AT&T as the new CEO, a position which he
ultimately turned down based upon his passion for the employees, customers and investors in
Enron. By the end of 1996, Rich Kinder was leaving Enron and the COO position was vacant.
In 1997, a major asset deal that Enron had been developing in Teeside, England was near
completion. As the liquefied natural gas (LNG) plant was nearing completion, the market price
of the commodity dropped to a low causing Enron to have to take a significant loss on its
trading books. Jeff Skilling’s group of traders blamed the failure on Rebecca Mark’s asset group
for taking longer than expected for the newly constructed gas plant to come on line. The loss
was a huge hit for Enron financially. Looking for revenue became a major objective requiring
16
the use of aggressive accounting methods approved by Arthur Andersen. By end of December
1997, to cover the loss, Andrew Fastow used an off-the-balance sheet partnership referred to as
Kitty Hawk Funding to secure a loan from Bank of New York that allowed Enron to book
revenue using mark-to-market accounting. Unbeknownst to anyone, the revenue generated to
prepay the loan was artificially inflated. Later that year, Fastow was appointed CFO of Enron,
shortly after Jeff Skilling’s appointment to the corporate COO position vacated by Rich Kinder.
By early 1998, comfortable with the placement of Jeff Skilling as COO, Ken Lay began to focus
his efforts outside the company. He lead the Houston United Way Campaign, helped the city of
Houston build a new baseball stadium (which ultimately was named Enron Field), chaired the
Economic Council Conference in Tokyo and served as Chairman of the Texas Governor’s
Business Council serving George W. Bush as Governor of Texas, and was working on George
W. Bush’s Presidential election fund raising campaign. Enron also kicked off a worldwide
advertising campaign with the first ad running at the Super Bowl that year. All of those things
were pursued by Ken Lay as a part of Enron’s branding strategy to let the world know who
Enron was as the push came to deregulate retail power to allow consumers a choice and
competition. The ad campaign also allowed us the ability to attract the best talent in the world.
In addition, it is critical to note that Ken Lay formed an internal “Vision and Values” committee
with the objective of driving his values within the organization. Having successfully united the
culture that resulted from the merger of InterNorth and Houston Natural Gas, Ken Lay clearly
recognized without a set of defined values, Enron would not be able to maximize the value it
could offer to its customers and shareholders.
By 1999, Jeff Skilling figured out a way to move Rebecca Mark into a role that cleared the way
for him to be the next CEO of Enron. Although she remained a board member of Enron Corp.,
as the CEO of Enron’s new water subsidiary, her power to give pushback was drastically
diminished, allowing Jeff Skilling’s culture to become fully developed. From this point, the
employees of Enron viewed Jeff Skilling as the clear winner to succeed Ken Lay as CEO and
from a management perspective, Jeff Skilling was making most of the day to day decisions and
the culture was changing rapidly as the short term focus of the traders became the driving force
of compensation.
In 2000, to offset the enormous bonuses given to traders, Jeff Skilling worked with McKinsey
(and my team in Human Resources) to create a compensation model for the executives
consisting of vice president and above that would be designed similar to a partnership, like
McKinsey. This structure provided enormous stock option grants that allowed for immediate
vesting of stock.
By 2001, Enron’s culture had driven structural changes that could no longer sustain the
company’s performance. In a matter of nine short years, from the time Enron was approved to

17
use mark-to-market accounting in 1992 and December 2001, the company had become
unbelievably successful using the metrics that existed at the time. Unfortunately, by that time,
The Model identifies the structures and culture had put Enron at risk and that our performance
was clearly no longer sustainable. However, those of us who remained at Enron, despite the
downturn in our stock price remained optimistic as Ken Lay returned to the position of CEO
when Jeff Skilling suddenly announced his resignation on August 14, 2001.
I began my career at what would ultimately become Enron in 1979 and lived through the
merger of two very different cultures that existed at InterNorth and Houston Natural Gas in
1985. Ken Lay had successfully lead Enron through many changes that had occurred in the
company since that time and I along with most employees that had been along on that roller
coaster ride believed that the worst was over and we could withstand anything. However,
reflecting back, I believe that Ken Lay was concerned in 1996 that the culture shift occurring in
the 1990s was of bigger concern than the 1980s because it was associated with the most
successful, growing part of our business – trading. At the time, Enron Corp. operated primarily
as a holding company for the various business units, including Enron Capital & Trade
Resources (ECT) which was Enron’s trading division responsible for all of the marketing, sales,
and pricing of energy commodities. As the head of “back-office” operations, I was responsible
primarily for the operational performance of Enron’s trading subsidiary and I reported directly
to Jeff Skilling, who was at the time, President of ECT.
As the leading “people” person at Enron, Ken Lay had always maintained an interest in my
career as I moved from Omaha in 1986, shortly after the merger of Houston Natural Gas (which
Ken Lay headed) and InterNorth (based in Omaha). The merged companies became known as
Enron which was based in Houston, Texas, while the company maintained a presence in
Omaha. Despite my background in accounting and the linear thinking of calculating numbers, I
too have always been a people person which is why ultimately I would rise to head Global
Human Resources and Community Relations at Enron. But in 1996, as the head of operations
for Enron’s trading unit, Ken Lay asked me a key question which gave me insight into what he
believed the impact our traders were having on the culture of the rest of the company. I think
he was truly concerned but was unable to quantify the impact of that changing culture. He
knew in my position that I would know how the traders (who were seen as the primary source
of the company’s revenue) treated other employees (who were seen solely as support for the
traders). My answer, in retrospect, probably said more about how much the traders had
subversively changed the culture than I realized at the time. “They are kind of rough but they
make a lot of money for us.” I said.
18
It is important to point out a key fact that few remember, except those of us who had survived
the merger between Houston Natural Gas and InterNorth, the culture at Enron during its early
days, after the merger, was horrendous to say the least. The blending of the two cultures was
like blending a family – it was horribly painful and took years to correct. Ken Lay knew I had
been through the painful experience of the merger with the rest of the employees and that I had
perspective that by 1996, few had, since very few employees from Omaha had actually
transferred to Houston. The infighting and “land-grabbing” that occurred was horrendous and
to be honest, it is a wonder that Enron did not fail at that time but I believe that speaks to Ken
Lay’s leadership qualities and values. He had not only successfully merged two companies
from different geographic locations, he had successfully financed the merger, despite taking on
enormous debt, and he had succeeded where 90% of mergers fail – he had managed to blend
two diverse cultures – each with their own self-interest. Ken Lay was seen as an “outsider” or
corporate raider – yet the employees of Omaha, including myself, came to trust Ken Lay’s
ability to create a healthy culture.
I had watched Ken Lay masterfully heal the culture the way I doubt very few leaders could
have, given the circumstances. I believed, as I imagine so too did Ken, that if we had survived
1985, we could survive anything – we were wrong. The culture was significantly worse than
1985, as the brazen self-interest of traders had turned Enron into a company where “power
broker” became a double entendre for trading megawatts of power and the power most
employees believed the traders wielded within the company. However, in the end, in August,
2001, more than 3000 employees, only a few of whom remembered the cultural pains of the
merger in 1985, stood in awe of Ken Lay, giving him a standing ovation, at the all-employee
meeting following Jeff Skilling’s departure, knowing if anyone could save Enron and repair the
company’s battered culture – it was Ken Lay. Sadly, the market’s lack of faith in Ken’s ability to
turn the company around was really a statement as to the lack of faith in Enron’s employees
more than anything. While I don’t blame the markets, I realize without The Integrity Index, the
market chose to cut and run. Having said that, I must also admit that Enron’s Integrity Index at
the time, was indicative of a company that was severely handicapped and was likely too far
along in its battle with cancer to be saved. However, had The Integrity Index existed in 1996,
Ken Lay would have taken the corrective action long before it was too late. He would have
sought the help necessary to ensure Enron’s long-term success. He had done it before and he
could have done it again.
Ken Lay’s question that day in 1996, my answer, and my inability, without any quantifiable
metric, to stop the cultural erosion has haunted me since the Enron implosion because
ultimately it was the aggressiveness of the traders that drove a culture where our dependence
upon the revenue generated by traders and the aggressive (but not illegal) accounting became
essential in meeting our earnings projections and driving our stock price. Ultimately, I believe
19
the self-interest and jealousy among employees of the personal financial gain of our traders was
a destructive force within the culture as well and more importantly, the driving force that
caused the CFO to feel a sense of entitlement that would drive him to enrich himself and
commit securities fraud.
It has taken me ten years to find the metric Ken Lay was looking for – what every CEO wants to
know – Is our culture strong enough to sustain our performance? I would come to learn as I was
promoted to head human resources that what Ken needed was measurable proof as to just how
big of a risk our culture and structures were to our future, which I unfortunately was never able
to provide him prior to his death. I am convinced The Integrity Index will prove to be the single
greatest predictor of unsustainable performance. The greatest value of The Integrity Index is not
in diagnosing the problems within the structure but rather providing sufficient time and
opportunity for CEOs to make the necessary changes given the ability to predict unsustainable
performance at least two years in advance.
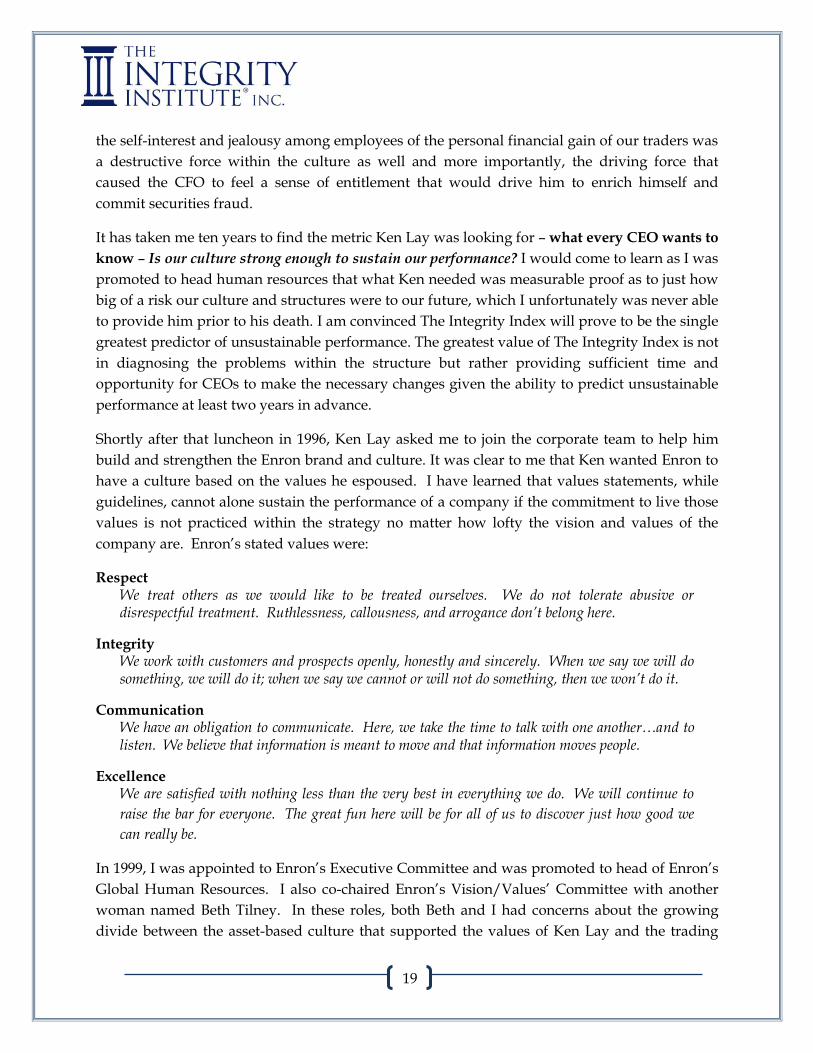
Shortly after that luncheon in 1996, Ken Lay asked me to join the corporate team to help him
build and strengthen the Enron brand and culture. It was clear to me that Ken wanted Enron to
have a culture based on the values he espoused. I have learned that values statements, while
guidelines, cannot alone sustain the performance of a company if the commitment to live those
values is not practiced within the strategy no matter how lofty the vision and values of the
company are. Enron’s stated values were:
Respect We treat others as we would like to be treated ourselves. We do not tolerate abusive or disrespectful treatment. Ruthlessness, callousness, and arrogance don‘t belong here.
Integrity We work with customers and prospects openly, honestly and sincerely. When we say we will do something, we will do it; when we say we cannot or will not do something, then we won‘t do it.
Communication We have an obligation to communicate. Here, we take the time to talk with one another…and to listen. We believe that information is meant to move and that information moves people.
Excellence We are satisfied with nothing less than the very best in everything we do. We will continue to
raise the bar for everyone. The great fun here will be for all of us to discover just how good we
can really be.
In 1999, I was appointed to Enron’s Executive Committee and was promoted to head of Enron’s
Global Human Resources. I also co-chaired Enron’s Vision/Values’ Committee with another
woman named Beth Tilney. In these roles, both Beth and I had concerns about the growing
divide between the asset-based culture that supported the values of Ken Lay and the trading

20
culture that supported the values of Jeff Skilling as it became clear Jeff Skilling was the person
that would soon replace Ken Lay as CEO. Although Beth and I both voiced our concerns to Ken
Lay, we found it hard to quantifiably demonstrate the impact the culture was likely to have on
Enron’s long-term performance because the external metrics, such as the countless accolades by
reputable business magazines, positive recommendations by Wall Street analysts, a strong
credit rating, and Enron’s stock price continued to climb in the exuberance of the dot.com era.
I’m afraid, without a reliable metric to counterbalance the exuberance, we were simply
perceived as two women who didn’t care for Jeff Skilling’s management style. Without metrics,
we faced a losing battle to demonstrate how the very culture that was making enormous
amounts of money for Enron was also destroying the company’s future.
Today, as I understand Model and specifically Enron’s score, I know, had The Integrity Index
existed, we would have been able to demonstrate to Ken Lay the underlying components that
contributed to the likelihood that Enron would not be able to sustain its performance. I also
know from first-hand experience and knowledge that had The Integrity Index existed, there is
no doubt in my mind that Ken Lay and Enron’s Board of Directors would have insisted that we
determine how we could improve our score as we had done with all of the Fortune Magazine
indices that we used as indicators of our success.
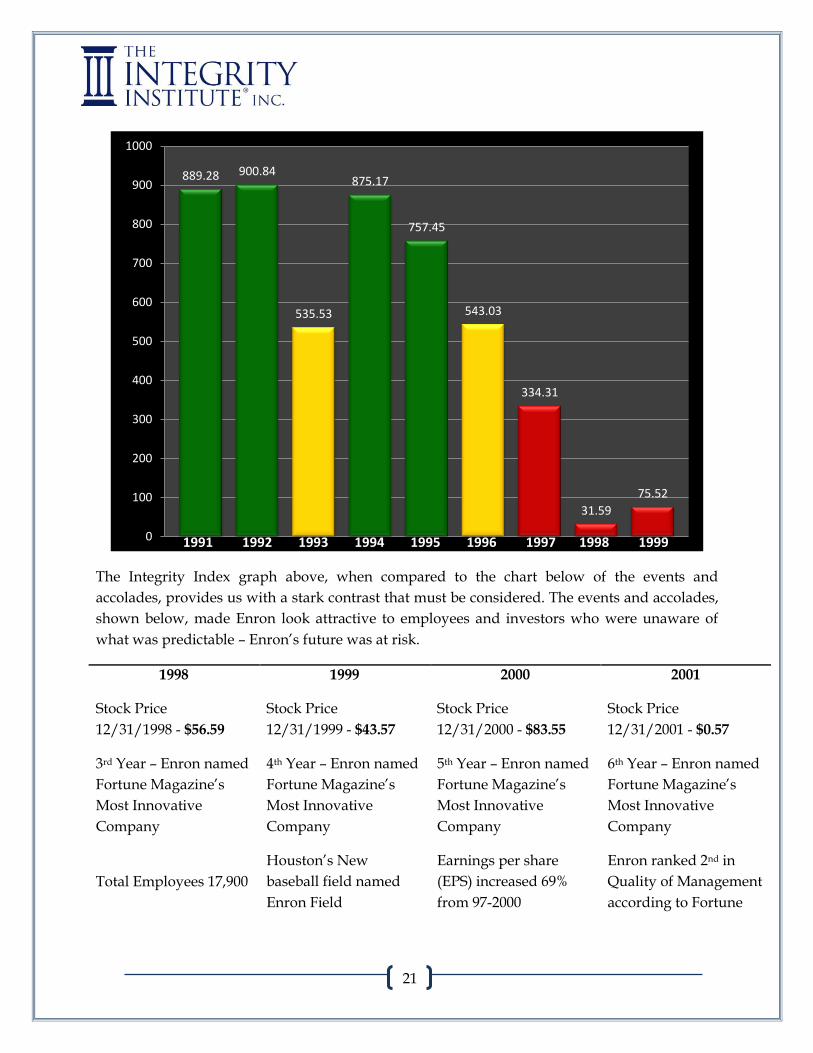
As we continue with the theme of the two faces of Enron, we see the company’s Integrity Index
scores told a story that was very different from the external metrics seen as “indicators” of
Enron’s future success.
21
The Integrity Index graph above, when compared to the chart below of the events and
accolades, provides us with a stark contrast that must be considered. The events and accolades,
shown below, made Enron look attractive to employees and investors who were unaware of
what was predictable – Enron’s future was at risk.
1998 1999 2000 2001
Stock Price
12/31/1998 - $56.59
Stock Price
12/31/1999 - $43.57
Stock Price
12/31/2000 - $83.55
Stock Price
12/31/2001 - $0.57
3rd Year – Enron named
Fortune Magazine’s
Most Innovative
Company
4th Year – Enron named
Fortune Magazine’s
Most Innovative
Company
5th Year – Enron named
Fortune Magazine’s
Most Innovative
Company
6th Year – Enron named
Fortune Magazine’s
Most Innovative
Company
Total Employees 17,900
Houston’s New
baseball field named
Enron Field
Earnings per share
(EPS) increased 69%
from 97-2000
Enron ranked 2nd in
Quality of Management
according to Fortune
889.28 900.84
535.53
875.17
757.45
543.03
334.31
31.59
75.52
0
100
200
300
400
500
600
700
800
900
1000
1991 1992 1993 1994 1995 1996 1997 1998 1999

22
20% Employees with
Advanced Degrees
Enron issues 12M
shares of Common
Stock
Corporate Giving is 1%
of EBIT
Enron ranked 4th in
Employee Talent
according to Fortune
Trading of broadband
announced
Enron hires 6,200 new
employees
Enron ranked 5th in
Quality of
Products/Service
according to Fortune
Enron forms a Vision
and Values Task Force
Enron breaks ground
on new corporate
headquarters
Raptor’s Off the
Balance Sheet
Partnership is created
Enron ranked 7th on
Fortune 500 list
Joe Sutton named Vice
Chair
Enron Online is
launched
Enron ranked 18th on
list of Most Admired
Companies
Nelson Mandela named
recipient of Enron’s
Humanitarian Award
Enron ranked 24th on
Best Companies to
Work For according to
Fortune
Enron ranked 22nd on
Best Companies to
Work For according to
Fortune
Azurix, Enron’s water
subsidiary, is launched. Enron Oil and Gas sold
New Power Company
formed/ AOL/ IBM
Enron ranked 29th as
Fastest Growing
Companies according
to Fortune
Ken Lay brings Michael
Milken to Management
Conference
Enron ranked 62nd on
Fortune’s Global 500
list
Blockbuster and Enron
announce 20 year
broadband content
delivery deal
2/21/01 - Jeff Skilling
named CEO
Enron named Company
of the Year by Financial
Times of London
Enron terminates deal
with Blockbuster

23
1998 1999 2000 2001
Enron Announces
Skilling to become CEO
05/01 Cliff Baxter, Vice
Chairman resigns
08/14/01 Jeff Skilling
resigns as CEO
08/28/01 Greg Whalley
/ Mark Frevert
appointed co-Vice-
Chairmen
November
Dynegy/Enron agree to
merge
November 28
Agreement dissolves
Enron files for
bankruptcy
December 2, 2001
Enron’s consistent ranking among the “Most Admired Companies,” allowed us to continue to
attract the best and brightest employees, all of whom were extremely talented and certainly
responsible for Enron’s success. As Enron continued to rise within the external metrics, the
internal employee surveys demonstrated to us that the enthusiasm for Enron grew as the stock
price rose, yet between 2000 and late 2001, as the stock price dropped, those employees who felt
the company was well managed dropped significantly.
As the culture of Enron began to be divided between traders (who were seen as driving revenue
for the company) and non-traders (who were seen as draining revenue from the company)
resentment grew. As the gap between these two factions widened, the two faces of Enron
became profound to Beth Tilney and myself, as the employee survey results began to display
the discontent. While compensation remained high for all of Enron’s employees, in part because
of stock options, soon no matter what employees made – if it wasn’t as much as the traders,
jealously caused dissatisfaction with their own compensation and ultimately eroded any
cohesiveness within the culture.

24
As the internal employee survey results below show, the satisfaction of employees rose and fell
with the stock price which supports the theory of self-interest as the primary motivating factor.
Pulse Survey Results 1996 1999 2000 Aug 2001
Stock Price $43.31 $43.57 $83.55 $42.00
Decisions communicated well 40% 41% 50%
Feel Free to voice Opinion 29% 29% 55%
Acts on Suggestions of Employees 28% 45% 52%
Communication is good 34% 30% 34%
Challenge Status Quo 37% 42% 47% 47%
Treated with Respect 58% 69% 73% 60%
Company is well managed 58% 64% 67% 42%
Information Believable 59% 59% 74%
Supervisor Encourages Team 61% 70% 73%
Overall Paid Fairly 65% 53% 52%
Pulse Survey Results (continued) 1996 1999 2000 Aug 2001
Satisfied with Pay 62% 52% 53%
Satisfied with Benefits 68% 81% 82%
Recommend Enron as place to work 61% 67% 72% 59%
Employees feel commitment to ENE 44% 61% 65% 64%
I would invest my money in ENE 60%
I have talent not utilized 70% 54%
By August 2001, as Enron’s stock price fell virtually overnight, it was apparent after Jeff
Skilling’s abrupt resignation that Enron was in for a challenge to maintain its reputation. Our
external face was severely bruised and we were now taking our pulse internally with the “Lay it
on the Line” survey to determine whether we were also at risk of losing our talent which was

25
essential to our survival. We conducted an internal survey and identified where employees had
concerns. Those internal results are shown below:
“Lay it on the Line” Survey (Run after Skilling
resigned) Top five issues of concern to employees 2001
Drop in Stock Price 60%
Internal Employee Morale 50%
PRC (Performance Review Committee) 50%
External Reputation and image 40%
Walking the talk of Integrity and Respect 30%
Earlier in 2001, an external survey had been conducted by our Public Relations group that
showed how the outside world viewed Enron compared to a year earlier. This survey showed
that Enron was seen as more self-serving and arrogant and less ethical and trustworthy. Enron
was no longer the company that Ken Lay had built. Below are those results:
2000 vs. 2001 – The extent you think of Enron:
More Uncertain Less
Entrepreneurial 28.50% 37.80% 23.70%
Innovative 38.80% 35.70% 24.60%
Self Serving 41.90% 38.60% 7.50%
Ethical 17.00% 45.10% 28.10%
Trustworthy 14.90% 39.00% 36.90%
Concerned for Communities 34.50% 44.90% 10.40%
Arrogant 39.10% 32.40% 13.30%

26
While we pursued our efforts to obtain relevant metrics that would lead Ken Lay to a
quantifiable understanding as to how the culture was shifting, clearly survey results tended to
follow the value gained from stock options which were available to all employees. To
demonstrate my point, little did I know the most telling metric may have actually come too late.
Below is the comparison of 2000 to 2001 in the internal whistle blowing reports prepared by our
Internal Audit Department, that neither myself, nor Ken Lay, had seen prior to Lynn Brewer
showing them to us in 2006. Although the number of reports is not significant, the dramatic
increase in 2001 indicates that the apparent tolerance for misdeeds had dropped as
precipitously as Enron’s stock and employees were beginning to raise red flags to the Chief
Controls Officer, Rebecca Carter-Skilling. Unfortunately, those reports prepared in the fall of
2001 by internal audit do not appear to have ever been shared with either Ken Lay or myself
prior to Enron’s implosion.
In the end, from my perspective, both as a member of Enron’s Executive Committee and as the
head of Global Human Resources, I can attest to Ken Lay’s surprise, as much as my own that
Enron’s end had come virtually without warning. What surprised me and I wish Ken Lay were
alive to see what The Integrity Index would have told us . . . Enron’s future was predictable –
not because the CFO was corrupt but because the very things we believed we were doing right
– providing lucrative stock options to our employees – turned out to be a motivator of
destructive behavior in pursuit of higher stock value. As we look at the drill down into the
drivers of Enron’s Integrity Index rating, we see that the Model identified structures within
Enron, recommended or approved by expert consultants, that allowed the cultural shift to breed
corrupt behavior of a few to destroy the long-term value of the company and its ability to
Cumulative Reported Incidents
0
10
20
30
40
50
60
70
January February March April May June July August September
2000
2001

27
sustain its performance. Unfortunately, not even our consultants could tell us what the Model
could have.
A NEW MODEL FOR PREDICTING SUSTAINABLE CORPORATE PERFORMANCE
The Model is driven from the primary understanding that all human behavior is driven by self-
interest which on its face is not bad; however, personally speaking I can assure you that the self-
interest of Ken Lay was very different than that of Jeff Skilling. By their very nature, they were
two different individuals with different values. While both were brilliant, Ken Lay was driven
from internal self-worth, whereas Jeff Skilling was driven from external metrics of self-worth.
As Enron’s two faces of leadership became more apparent, the culture shifted from the values of
Ken Lay to the values of Jeff Skilling (shared by the traders). We find that Ken Lay’s leadership
style promoted an inclusive culture and Enron’s Integrity Index score reflected this whereas Jeff
Skilling’s style promoted an exclusive culture where revenue drove rewards and Enron’s
Integrity Index score dropped as Jeff Skilling rose in prominence within the company. Let me be
very clear here – I am not saying that Jeff Skilling’s management style was in any way criminal;
it was simply a radical shift from the culture that Ken Lay had created for the company.
Certain cultures demand certain governance structures and a culture developed under a
leadership style similar to Jeff Skilling would require very different structures than a culture
under Ken Lay’s leadership. The Integrity Index model uses quantitative measures to determine
when the governance structures are no longer sufficient to promote sustainable performance.
When structures become weakened, the ability to offset brazen self-interest is diminished. The
chart below highlights four areas of concern for Enron that might have alerted managers to the
potential for fraud prior to 2001. As Ryan Kennedy, Assistant Professor at the University of
Houston, translates the elements of the Model that predicts those areas that creates weaknesses
and increases risk that can lead to unsustainable performance.
Enron’s Integrity Index Rating 1991 1992 1993 1994 1995 1996 1997 1998 1999
Fraud Alleged NO NO NO NO NO YES YES YES YES
Performance
Compensation for Insiders
Compensation for Shareholders
Oversight Structure
Management Structure
As prepared by Bruce Bueno de Mesquita and Alastair Collins
PERFORMANCE

28
Analytical / Technical Comment: There is some indication that, around 1993, Enron adopted a
structure of compensation for shareholders that relied less on dividends and more on share
prices. While this only gives a weak indication of fraud potential in the Enron case, such a
structure places heavy emphasis on meeting or exceeding market expectations. It also does not
require that the company have cash on hand to pay shareholders. This gives managers an
incentive to potentially commit fraud to hide disappointing performance and keep share prices
high. It may also give an early indication that share prices have reached unsustainable levels
that cannot be supported by the company's actual performance.
Author’s Comment: It should be noted that the external analysts all recommended Enron as a
buy or strong buy until days before the implosion. In fact Forbes.com reported:
Despite many reports to the contrary, all of the four Wall Street analysts testifying said
they felt no pressure either from their own firms or from Enron to tout the stock. Rather,
they all believed, based on public information and their own analyses, that Enron's ‗core
business‘ was sound and profitable and that its business model was ‗portable‘ beyond
buying and selling energy to other markets. The analysts say they reached their
conclusions separately. But, even in a universe where two-thirds of the recommendations
are "buy," the mathematical odds of a dozen analysts all reaching the same conclusion
independently are less than one-in-100.2
This speaks directly to the value of The Integrity Index to achieve success where other metrics
fail. Like the analysts, The Integrity Index uses publicly available data to achieve its rating.
Studies have found over and again that humans tend to “underestimate” the quality of their
analysis which provides a solid case for the value of a predictive computer model such as The
Integrity Index. The false positives generated through the validation of the computer model
actually demonstrate the Model’s ability to work better than designed – thereby predicting
unsustainable performance three or more years in advance – rather than two.
Additionally, while much of Enron’s performance, beginning in 1993 was driven by its
accounting methodology of mark-to-market, most of which involved derivatives (similar to the
Credit Default Options (CDOs) that largely contributed to the economic crises of 2007), Arthur
Andersen not only provided consulting services for the financial transactions but audited the
accounting methodology of those transactions. Andersen also signed off on all major accounting
entries prior to them being reflected in Enron’s books. Ultimately, the quality of Arthur
Andersen’s audit was called into question when it was discovered that the transactions
designed by the CFO did not meet the requirements of Generally Accepted Accounting
Principles (GAAP) and the 3% transfer of risk.
2 Congressional Hearings; “Enron Analysts: We Was Duped”; Ackerman, Dan Forbes.com; 02/27/02

29
Enron’s downfall came when the structural weaknesses, all of which The Integrity Index
identified, were exploited by the CFO in his pursuit of brazen self-interest while he was lying
both to Arthur Andersen and the Chief Accounting Officer. It should also be noted, when one
seeks to perpetrate securities fraud for their own self-interest, they are looking out for
themselves and thus rarely invite anyone to the party who will quash their efforts.
Although Ken Lay and those of us in human resources may have noticed a shift within the
culture, we had no metrics (other than the surveys) to counterbalance the external metrics, such
as countless accolades, Wall Street analysts’ recommendations, and rapid growth in our stock
price. These metrics would ultimately leave us blindsided as the structural weaknesses were
exploited by the CFO. It is my opinion as well as most of my colleagues who knew Ken Lay best
that Ken Lay and the other board members relied upon these same metrics which appear to
have had as much influence on our success as well as our failure when the metrics ultimately
proved unreliable. In my opinion The Integrity Index would have provided the necessary
warning signal for those of us inside the company that Wall Street analysts and Arthur
Andersen were missing the mark. And certainly would have provided our consultants with a
far better understanding as to the impact the structures we were creating would have had when
integrated across the organization.
30
COMPENSATION FOR INSIDERS
Analytical / Technical Comment: One of the clearest indicators for fraud potential in Enron was
the compensation structure for company insiders. Beginning in 1993, Enron's compensation for
its senior management and directors began relying less on salary and more on stock options and
perquisites. These forms of compensation tie management compensation to maintaining share
prices, providing incentives to cover disappointing news that might adversely affect the stock.
The focus on share prices may also cause managers to ignore, or not to seek out, information
that adversely affects share prices. Additionally, much like dividends, a focus on non-salary
payments may be an early indication that the company's share price is at unsustainable levels
and/or that the company lacks the cash assets for salary increases commensurate with publicly
reported performance.
Author’s Comment: It should be noted that in late 1999 and 2000, the compensation structures of
Enron Insiders (and the entire company for that matter) were designed by Skilling, based on
recommendations by McKinsey, and validated by Towers Perrin. Enron’s target compensation
level was the 90th percentile and we relied upon Towers Perrin’s research data to achieve this
objective. The structures were approved and adopted by Enron’s Board of Directors once we
had achieved the objectives set by the Board based upon the validation of Towers Perrin. Like
many companies, we incentivized executives with a low base salary, and then applied a
measured bonus structure based upon a performance review system in part designed and
recommended by McKinsey.
In order to compete with other firms in attracting talent in the dot.com era, Enron generously
offered stock options. Although the Enron Employee Stock Option Plan (ESOP) allowed for a
grant of 2% of the base salary of employees in stock options for each year of employment
during the Plan, with the strike price established at the beginning of the plan or at the time of
their hire, whichever came later, the Model relies upon compensation of Insiders which was
significantly more (5x to 6x base salary) which was granted in options to vice presidents and
above, a small group of approximately 200 employees. The level of options, like the bonuses,
was based upon performance reviews. As Enron’s stock price rose rapidly, more employees
were more than happy to accept options as a form of compensation and benefited dramatically
from the immediate profit realized when the options were exercised.
While the world is just becoming aware of excessive executive compensation by Wall Street
firms, this practice has been going on since the days of Enron. In fact, it was the very firms that
are now under scrutiny for paying large bonuses that Enron competed with for talent. So while
I cannot argue with the outcome of The Integrity Index and the predictive capacity of the Model
to recognize the role compensation for Insiders plays in predicting unsustainable performance,
it is important to note Enron’s level of compensation was established based upon research by

31
Towers Perrin’s analysis of market practices which included a comparison of Wall Street firms.
In fact, in light of the unsustainable performance of Wall Street firms, with whom Enron
competed, I can only argue in support of the value The Integrity Index plays as the Model once
again has proven to predict another wave of unsustainable performance by publicly traded
companies.
COMPENSATION TO SHAREHOLDERS
Analytical / Technical Comment: There is some weak indication of problems in Enron's
compensation to shareholders – measured by the number of shares provided by the company
and larger-than-expected levels of market capitalization. Stock splits increase the liquidity of
shares, and generally broaden shareholder ownership. This decreases the ability of
shareholders to organize and exercise collective oversight. This, in turn, makes fraud more
likely. A larger-than-predicted level of market capitalization provides an early indication that
share prices may be unsustainable, and management efforts to maintain the stock price will
more likely involve fraud by someone at some level.
Author’s Comment: While I cannot argue against maximizing shareholder wealth and Enron’s
rapid growth in its share price certainly contributed to significant shareholder wealth, what this
variable outlines is the influence “internal” shareholders had in the share price. Enron’s own
employees developed transactions specifically designed to drive share price higher to increase
their compensation received not as an employee but as a shareholder holding stock options.
While many consider shareholders external to the company, clearly the influence of internal
shareholders cannot be underestimated especially if one of those shareholders is a self-dealing
CFO.
While share price is often the driver of the level of attention a public company receives, such
compensation to shareholders based upon stock price is never seen as bad unless it is artificially
inflated, of course. The Model’s ability to predict unsustainable performance provides insight
into when the share price may be artificially inflated or unsustainable as was the case at Enron.
Although I was shocked to see the Model identify that somehow Enron’s stock price was an
indicator of unsustainable performance, now I understand why stock price alone should not be
relied upon as the primary indicator of future success.
OVERSIGHT STRUCTURE
Analytical / Technical Comment: The only area where Enron appears to have performed
extremely well consistently over time was in the structure of its oversight or board. The Model
analyzes a variety of factors, including the amount of money given to external directors. When
an external director is paid a minimal salary, he/she is unlikely to dedicate much effort in
oversight functions. On the other hand, where the external director is lavishly compensated for

32
attending board meetings, there is a danger of the external director becoming co-opted by
management and no longer providing oversight.
This variable is common in many governance models as it provides a frame of reference. Where
there are a larger number of external directors, they have a higher capacity to provide oversight
and this lowers the propensity for fraud. The larger the proportion of stock held by institutional
owners, the lower the likelihood of fraud. As the CEO’s primary “self-interest” according to
Selectorate Theory is maintaining his/her job, low levels of stock ownership concentration
among insiders decreases the risk that a CEO will be removed.
Author’s Comment: It does not surprise me that Enron scored extremely well in this variable of
the Model because our Board was all outsiders, with the exception of Ken Lay. Despite their
esteemed reputation and experience, they were caught blindsided like others when our CFO
committed securities fraud. Clearly when the Board convened, their own reputations would
have given no rise for concern. Like the rest of senior management (except for the self-dealing
CFO), the Board wondered “How could this have happened without any warning?” Enron’s
Board of Directors paid an enormous amount of personal wealth to satisfy the claims against
them which may in and of itself offer the incentive for directors of all public companies to
consider the value of The Integrity Index to provide insight as to what they may be missing in
their capacity as fiduciaries.
MANAGEMENT STRUCTURE
A management structure that consists of a larger than expected number of officers and
directors, and which has a larger number of officer and directors receiving stock, may indicate
an incentive for fraud. This is because, as predicted by Selectorate theory, a larger number of
insiders make it more difficult for the company to provide salary-based rewards. As
compensation for company Insiders relies increasingly on growing the company’s performance
and meeting market expectations, incentives for fraudulent reporting increase. Conversely,
incentives for seeking adverse information about sectors that appear to perform well decreases.
Author’s Comment: It should be noted that beginning in 1991, the management structures at
Enron were reviewed with and discussed in great deal with McKinsey, which played a pivotal
role in Enron’s strategy and operations until the very end. Over the next 10 years, the structures
were approved and adopted by Enron’s board of directors based upon the recommendations of
McKinsey. This very fact increases the importance of The Integrity Index as an external metric
that provides the only integrated and holistic methodology of understanding the cumulative
impact and/or the correlation these decisions can have on the ultimate structural weaknesses
given the Model’s predictive capabilities. McKinsey who is among the best strategic /
33
management consultants now admits the value of predicting outcomes using Selectorate Theory
as was first published in the McKinsey Quarterly, 2001 Number 2.
CONCLUSION
Having known Ken Lay professionally and then personally; having worked personally with the
consultants to establish compensation practices, and; having served on Enron’s Executive
Committee, I am certain that Ken Lay found himself in the position of so many CEOs entrusting
those around him to tell him the truth. When Lynn Brewer discovered in 1998, what she
believed to be bank fraud committed by our CFO, she felt disempowered to bring such
knowledge to the attention of anyone within Enron after having been told by her immediate
supervisor to remain silent, because she believed she would have been fired. Her assumption
was probably accurate, given what we now know about attempts by the CFO to fire Sherron
Watkins when she revealed her concerns to me in 2001. It wasn’t until two weeks before his
untimely death that Lynn Brewer met with Ken Lay and informed him what she knew – long
after he was in a position to do anything about it. Sadly, the culture at Enron, to which I discuss
within this paper, contributed to the failures at Enron. Our cultural handicap not only allowed
our own Bernie Madoff to rise through the ranks but disallowed a channel for those who
recognized problems to voice their concerns. The value of The Integrity Index is its ability to
overcome a company’s cultural “handicap” by identifying structural weaknesses and
quantifiably measuring the risk such a handicap may have on a company’s ability to sustain
their performance.
What has surprised me most about the Model is it identifies areas where the decisions we made
with the best of intentions and with the expertise of external consultants, proved to actually
destroy value. Enron employees seemed all too thrilled to receive stock in lieu of increasing
base salary compensation given the upside growth of Enron’s stock. The variables used by the
Model indicate that given the other parameters, this decision actually allowed Enron to appear
healthier than it was and may have actually weakened the company’s ability to sustain its
performance – not because it is inherently wrong to reward employees but because
compensation taken in the form of stock causes a company to appear to have more cash flow
than it actually does and at the same time encourages behavior focused on increasing the stock
price. However, when compensation paid out does not rise congruent with the stock price, it is
among the leading indicators the Model identifies as one of the ways a company may attempt to
hide the real condition of the company’s cash position.
In 1999-2000, I worked closely with Jeff Skilling to increase the compensation for all officers of
the company at the vice president and above level. A significant amount of our compensation
for a rather small group of 200 employees was based in stock options that vested immediately.
While it should come as no surprise, for those of us at Enron – success was everything. Not

34
unique to Enron was the external pressure placed on the company that we had to beat Wall
Street’s quarterly projections and the stock price had to continue to rise. Unfortunately, the very
compensation structures we put in place, encouraged short term behavior and rewarded
employees who asked “How can this be done?” rather than “Can this be done at all?” In fact, it
was at this time Enron engaged in a nationwide commercial advertising campaign based
around our innovative approach to everything we did – “Ask not why. . . Ask why not.”
While compensation alone is not sufficient to destroy a company, when combined with other
elements of governance structures, the Model provides a clear understanding as to where
weaknesses can cause the company to become vulnerable. In the case of Enron, because other
factors were at play, the CFO was ultimately able to steal from Enron through a variety of
financing vehicles created out of his own self-interest. Meanwhile others became as aggressive
as the law and rules would allow with accounting and financing designed to help Enron appear
healthier than it was through its rising stock price and ever growing list of external metrics –
both of which have proven to consistently be unreliable measures of future success.
Had The Integrity Index been available in 1996, it is my strong belief that Ken Lay would have
had sufficient data to understand the structures in place at Enron were not sufficient to sustain
its performance, particularly given its aggressive culture. The Index would have provided the
quantifiable measures necessary to indentify weaknesses that allowed the CFO to exploit the
structures that ultimately destroyed the company. Unfortunately, there was nothing either
externally or internally at the time that gave us a clue that we were on a path to self-destruction
except for the external survey done in 2001 that used qualitative data obtained from our
customers and competitors. Unfortunately, by that time, it was obviously too late.
While Enron is one of a dozen companies whose performance was ultimately found to be
artificially inflated and thus unsustainable in the early 2000s, nearly 10 years later, our capital
market once again hangs in the balance, likely filled with dozens of companies like Enron who
are finding ways to report earnings as high as possible to meet external targets which is
precisely what the Model has identified as the foundational motivation of senior executives in
pursuit of keeping their jobs.
Until now no one has presented a reliable metric that can predict unsustainable performance,
which is why I am personally committed, as are many of my former Enron colleagues, to bring
The Integrity Index to market. Speaking from personal experience, The Integrity Index is at least
a first step to rebuilding the investor trust that firms like Enron and others destroyed – not
intentionally – but because we all simply trusted metrics that were then, as they remain now,
unreliable . . . yet we continue to rely upon them. I believe that is what Einstein called the
definition of insanity.

35
While The Integrity Index model will not identify who or where a company’s own “Bernie
Madoff” may be working, it will provide a far better understanding as to how great the risk is,
that if such a person is operating as the CFO of the company, his/her behavior may be having
an impact on the company’s ability to sustain its corporate performance. Most importantly, The
Integrity Index model will define the structures necessary to offset that risk that brazen self-
interest can lead to unsustainable performance. The essential benefit of The Integrity Index is
that it provides sufficient time for CEOs to make strategic decisions before there is a proverbial
run on the bank as there was at Enron.
Having been at Enron from beginning to end, and having had a close personal and professional
relationship with the CEO, I know that Ken Lay intuitively knew – the health of Enron’s culture
was essential to the company’s long-term sustainability. Unfortunately, the old adage “If you
can’t measure it, you can’t manage it” drove us to rely upon that which could be measured –
external metrics from accolades to stock price driven by smart people whose models were
insufficient to predict what The Integrity Index, based upon the Model, did – Enron’s
performance was unsustainable which can only lead us to accept that the current methodology
is insufficient and the time has come for advancing the science of corporate performance
analysis.
Perhaps the greatest value of The Integrity Index has yet to be proven. Once, launched,
application of The Integrity Index could range from an investigative tool by the SEC to an audit
quality assessment tool by the PCAOB. In the case of enforcement actions by the SEC, we find
that using the Model, 100% of those companies which scored below 453 were later alleged to
have committed securities fraud. The Model actually predicted or identified the fraud 2 to 12
years ahead of the SEC filing an enforcement action. In the application of audit quality given the
apparent failure of accounting firms to detect or predict the fraud that lead to enforcement
action by the SEC, certainly The Integrity Index could be used as a risk metric for accounting
firms. Finally, The Integrity Index ultimately provides a real measure of risk from D&O to E&O
to actual reputation risk products for insurance providers.
The predictive capabilities of The Integrity Index will provide CEOs with the ability to change
direction when necessary, it will provide boards of directors with the ability to change
leadership when necessary, and it will provide the market assurance that if a company hits
bumps in the road, if their Integrity Index score is strong then, fear will be minimized and crises
management will be unnecessary. If, however, the company’s Integrity Index score has had a
sudden drop or a consistently low score, then the leader will have the opportunity to
demonstrate his/her ability to become a sustainable leader. The Integrity Index will provide the
information necessary for both internal and external stakeholders to make informed decisions –
something neither Ken Lay, nor the market had available to them at the time Enron failed and
history will no longer have to repeat itself.
Appendix A
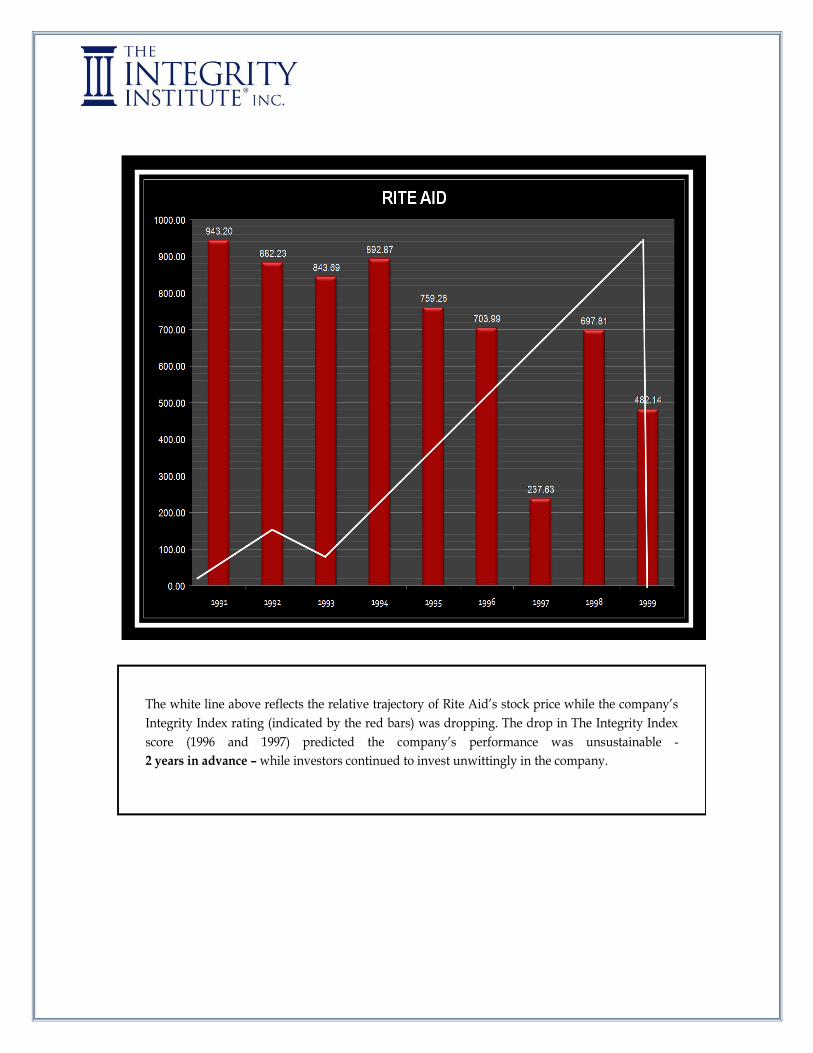
The white line above reflects the relative trajectory of Rite Aid’s stock price while the company’s
Integrity Index rating (indicated by the red bars) was dropping. The drop in The Integrity Index
score (1996 and 1997) predicted the company’s performance was unsustainable -
2 years in advance – while investors continued to invest unwittingly in the company.

The white line above reflects the relative trajectory of Waste Management’s stock price while the
company’s Integrity Index rating (indicated by the blue bars) was dropping. The drop in The
Integrity Index score (1996 and 1997) predicted the company’s performance was unsustainable -
2 years in advance – while investors continued to invest unwittingly in the company.

0
200
400
600
800
1000
1200
ALASKA AIR GROUP CONTINENTAL AIRLINES
NORTHWEST AIRLINES
1996
1997
1998
The comparison above demonstrates an industry comparison for the airline industry between
Alaska, Continental and Northwest Airlines. The Integrity Index scores, while consistent for
Alaska Airlines, demonstrate both Continental and Northwest took corrective action to sustain
their performance.

0
100
200
300
400
500
600
700
800
900
1993 1995 1996 1997 1998
PAGING NETWORK
0
100
200
300
400
500
600
700
800
900
1000
1993 1994 1995 1996 1997 1998
MICRO WAREHOUSE
Paging Network was sold to Arch
Paging on 11/13/2000 after credit
downgrade from C- to D & forced
into Bankruptcy by creditors.
Note: A consistent low rating in The
Integrity Index for two years in a
row (1995 and 1996) would predict
the likelihood the company’s
performance is unsustainable –
4 years ahead of the change in
control.
According to the 10K filed by the
Company for FYE 12/31/98 – in
September 1997, the Company settled
the consolidated securities class
action lawsuits relating to the
restatement of their financial
statements. In September 1998 the
Company consummated the Court-
approved settlement and paid $30
million in cash to the class plaintiffs.
Note: A dramatic drop in the
company’s Integrity Index score in
1995 for two consistent years (1995
and 1996) would predict the indicates
the likelihood the company’s
performance is unsustainable –
2 years ahead of the restatement.

0
100
200
300
400
500
600
700
800
900
1000
1990 1991 1993 1994 1995 1996 1998
HOUSEHOLD INTERNATIONAL
In May 2009, a jury found in a securities fraud action entitled Lawrence E. Jaffee Pension Plan v.
Household International, Inc., filed in August 2002, that from March 23, 2001 (the date of Statement
No. 14, with respect to which two of the defendants were found to have acted knowingly), the
allegedly misleading statements inflated Household’s share price by as much as $23.94. In the third
quarter of 2002, the company took a $600 million charge and restated its financial statements for the
preceding eight years, and in October 2002, the company announced that it had entered into a $484
regulatory settlement regarding its lending practices. On November 14, 2002, the company announced
that it was to be acquired by HSBC Holdings. The Integrity Index score, based upon the Model,
predicted the securities fraud between 1993 and 1995.

Appendix B

The Model is designed to predict whether a company’s performance is sustainable at least two years in
advance. The Model has proven to be 73% accurate in its predictive capabilities. Application, validation,
and translation of the Model into The Integrity Index model has proven that 100% of companies whose
Integrity Index score falls below 453 are ultimately alleged to have committed securities fraud. Although
securities fraud is a clear indication that a company’s performance is unsustainable, the purpose of The
Integrity Index is simply intended to be a risk metric that provides sufficient opportunity for changes in
strategic direction for Senior Management, the Board of Directors and investors. Below are The Integrity
Index scores for those companies which scored less than 453 in the original data set comprised of the S&P
500. Of the Top 10 largest frauds (reflected in Table 8, pg. 44 of Appendix C), the only company which was
alleged to have committed securities fraud that scored above 453 was Cisco Systems which scored 610.82
(1994); 518.21 (1996); and 619.83 (1998). The fraud was alleged to have occurred in 1999.
COMPANY NAME TICKER YEAR INDEX
XEROX CORP XRX 1997 1.2902
BANK OF AMERICA CORP. BAC 1997 1.4211
BANK OF AMERICA CORP. BAC 1996 4.4592
XEROX CORP XRX 1998 18.417
WASTE MANAGEMENT WMI 1992 22.9012
ENRON ENE 1998 31.5862
ENRON ENE 1999 75.5228
INFORMIX IFMX 1996 161.9737
INFORMIX IFMX 1999 176.4334
ORACLE ORCL 1991 211.2003
RITE AID RAD 1997 237.6318
CHAMBERS DEVELOPMENT CDV.A 1991 248.1451
WASTE MANAGEMENT WMI 1997 284.4696
NETWORK ASSOCIATES NETA 1998 298.3855
MEDAPHIS MEDA 1996 321.4151
HOUSEHOLD INTERNATIONAL HI 1998 321.6111
CHAMBERS DEVELOPMENT CDV.A 1994 325.8851
COMPARATOR SYSTEMS IDID 1996 332.2784
WASTE MANAGEMENT WMI 1993 333.0475
ENRON ENE 1997 334.3079
WASTE MANAGEMENT WMI 1990 355.6345
WASTE MANAGEMENT WMI 1996 383.0098
CENDANT CD 1993 396.6501
BOSTON SCIENTIFIC BSX 1997 398.107
BANK OF AMERICA CORP. BAC 1994 402.8483
COMPARATOR SYSTEMS IDID 1995 410.7668
WASTE MANAGEMENT WMI 1991 414.8365
CHAMBERS DEVELOPMENT CDV.A 1990 423.8852
INFORMIX IFMX 1995 440.4927
SUNBEAM SOC 1997 453.1275

BANK OF AMERICA CORP. 1993 919.73
BANK OF AMERICA CORP. 1994 402.85
BANK OF AMERICA CORP. 1995 828.73
BANK OF AMERICA CORP. 1996 4.46
BANK OF AMERICA CORP. 1997 1.42
BANK OF AMERICA - 03/15/04: The SEC settled with Bank of America for securities fraud charges arising from arrangements to permit timing of certain Nation Funds mutual funds and for facilitating market timing and late trading to certain customers. Bank of America has agreed to pay a total of $375M in fines. Bank of America was ordered to pay more than $141 million to a dozen institutional plaintiffs in connection with its 1998 sale of $648 million in securities by the furniture company Heilig-Meyers, at the time a darling of Wall Street. Bank of America, directly or indirectly, violated Section I4(a) of the Securities Exchange Act of 1934 ("Exchange Act") [15 U.S.C. § . 78n(a)) and Rule I4a-9 thereunder [17 C.F.R § 240.l4a-9]. Unless permanently restrained and enjoined, Bank of America will again engage in the acts and transactions set forth in this complaint or in acts and transactions of similar type and object. Source: www.SEC.gov NOTE: The Integrity Index predicted the securities fraud in 1996 (2 years in advance of the occurrence of securities fraud and 6 years in advance of the SEC action).
919.73
402.85
828.73
4.46 1.420.00
100.00
200.00
300.00
400.00
500.00
600.00
700.00
800.00
900.00
1000.00
1993 1994 1995 1996 1997
Inte
gri
ty I
nd
ex
Rati
ng
Year
Bank of America

BOSTON SCIENTIFIC 1993 639.03
BOSTON SCIENTIFIC 1994 536.16
BOSTON SCIENTIFIC 1995 613.62
BOSTON SCIENTIFIC 1996 543.08
BOSTON SCIENTIFIC 1997 398.11
BOSTON SCIENTIFIC - 08/22/2000: The SEC revealed that Boston Scientific had materially overstated its net income, and understated net losses, in quarterly and annual reports for the periods ended March 31, 1997, through June 30, 1998. In 1997 and 1998, Boston Japan recorded thousands of false sales collectively totaling more than $75 million. As a result, Boston Scientific materially overstated its net income and/or understated its net losses for all four quarters in 1997, the fiscal year ended December 31, 1997, and the first two quarters in 1998, by amounts ranging from 10% to 46% of net income.
Source: www.SEC.gov
NOTE: The Integrity Index predicted the securities fraud in 1994 (3 years in advance of the
occurrence of securities fraud and 6 years ahead of the SEC action).
639.03
536.16613.62
543.08
398.11
0.00
100.00
200.00
300.00
400.00
500.00
600.00
700.00
800.00
900.00
1000.00
1993 1994 1995 1996 1997
Inte
gri
ty I
nd
ex
Rati
ng
Year
Boston Scientific

CENDANT 1992 884.73
CENDANT 1993 396.65
CENDANT 1994 688.60
CENDANT 1996 692.55
CENDANT 1997 1000.00
CENDANT 1999 970.21
CENDANT - 02/28/2001: SEC Charged Walter A. Forbes and E. Kirk Shelton, Former Top Officers of CUC International Inc. and Cendant Corp., with directing and profiting from massive financial fraud for the period 1995-1997 alone, pre-tax operating income reported to the public by CUC was inflated by an aggregate amount of over $500 million.
Source: www.SEC.gov
NOTE: The Integrity Index predicted the securities fraud in 1993 (2 years in advance of the
occurrence of securities fraud and 7 years ahead of the SEC action).
884.73
396.65
688.60 692.55
1000.00 970.21
0.00100.00200.00300.00400.00500.00600.00700.00800.00900.00
1000.00
1992 1993 1994 1996 1997 1999
Inte
gri
ty I
nd
ex
Rati
ng
Year
Cendant
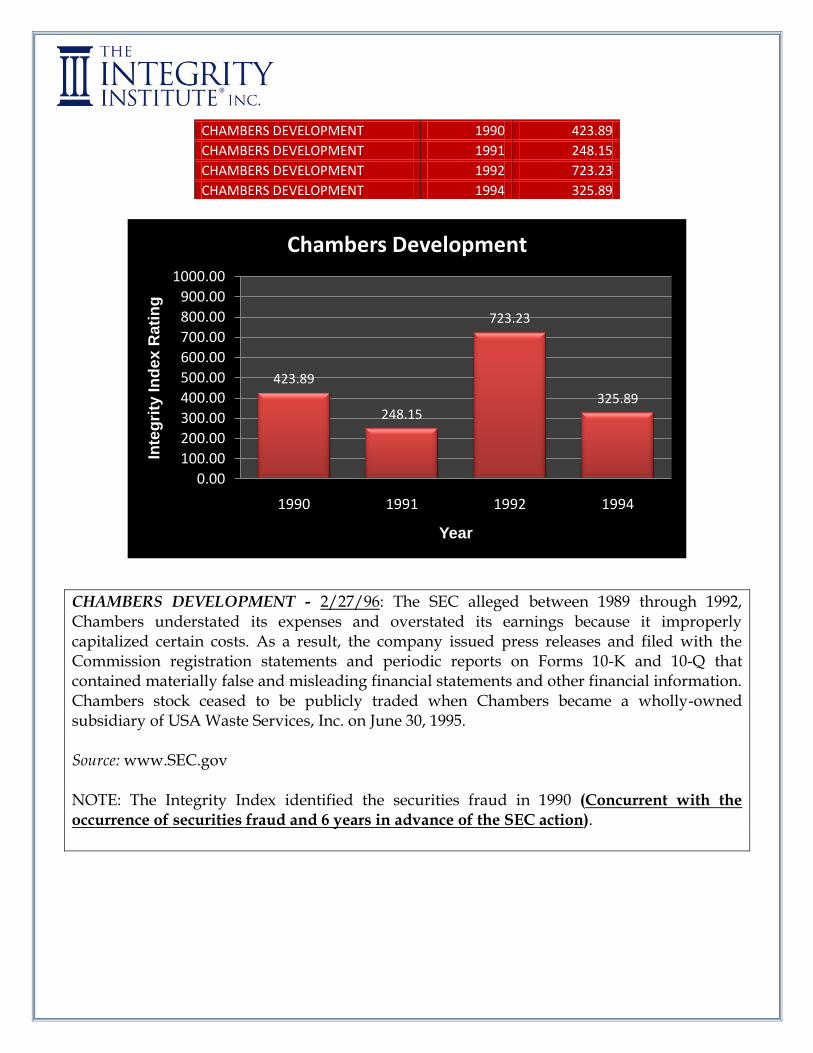
CHAMBERS DEVELOPMENT 1990 423.89
CHAMBERS DEVELOPMENT 1991 248.15
CHAMBERS DEVELOPMENT 1992 723.23
CHAMBERS DEVELOPMENT 1994 325.89
CHAMBERS DEVELOPMENT - 2/27/96: The SEC alleged between 1989 through 1992, Chambers understated its expenses and overstated its earnings because it improperly capitalized certain costs. As a result, the company issued press releases and filed with the Commission registration statements and periodic reports on Forms 10-K and 10-Q that contained materially false and misleading financial statements and other financial information. Chambers stock ceased to be publicly traded when Chambers became a wholly-owned subsidiary of USA Waste Services, Inc. on June 30, 1995. Source: www.SEC.gov NOTE: The Integrity Index identified the securities fraud in 1990 (Concurrent with the
occurrence of securities fraud and 6 years in advance of the SEC action).
423.89
248.15
723.23
325.89
0.00
100.00
200.00
300.00
400.00
500.00
600.00
700.00
800.00
900.00
1000.00
1990 1991 1992 1994
Inte
gri
ty I
nd
ex
Rati
ng
Year
Chambers Development

COMPARATOR SYSTEMS 1990 725.09
COMPARATOR SYSTEMS 1990 960.52
COMPARATOR SYSTEMS 1991 893.74
COMPARATOR SYSTEMS 1993 762.39
COMPARATOR SYSTEMS 1994 579.59
COMPARATOR SYSTEMS 1995 410.77
COMPARATOR SYSTEMS 1996 332.28
COMPARATOR SYSTEMS 1997 976.95
COMPARATOR SYSTEMS – 05/31/96: The SEC complaint alleges that Comparator Systems issued false and misleading financial statements for the fiscal years ending June 30, 1994 and June 30, 1995 and for the first three quarters of fiscal year 1996, which grossly inflated the company's assets throughout that period. The Complaint further alleges that Rogers, Hitt and Armijo caused Comparator to file these false financial statements for the purpose of enabling Comparator common stock to remain listed for trading on the National Association of Securities Dealers' Automated Quotation ("NASDAQ") SmallCap Market System and to facilitate the sale of Comparator common stock to the public. Source: www.SEC.gov NOTE: The Integrity Index identified the securities fraud in 1994 (Concurrent with the
occurrence of securities fraud and 2 years in advance of the SEC action).
725.09
960.52893.74
762.39
579.59
410.77332.28
976.95
0.00100.00200.00300.00400.00500.00600.00700.00800.00900.00
1000.00
1990 1990 1991 1993 1994 1995 1996 1997
Inte
gri
ty I
nd
ex
Rati
ng
Year
Comparator Systems

ENRON 1991 889.29
ENRON 1992 900.85
ENRON 1993 535.53
ENRON 1994 875.17
ENRON 1995 757.45
ENRON 1996 543.03
ENRON 1997 334.31
ENRON 1998 31.59
ENRON 1999 75.52
ENRON – 10/02/02: The SEC announced that starting in at least early 1997, CFO Andrew Fastow, Michael Kopper, and others devised a Scheme to defraud Enron's security holders through transactions with certain Enron SPEs. Some of these SPEs were not eligible for off-balance-sheet treatment because the SPE and supposedly independent third-party investors were controlled by Fastow, Kopper, and others, the outside equity requirement was not met, and the third-party "investment" was not truly at risk. Thus, these SPEs should have been consolidated onto Enron's balance sheet. Further, Fastow, Kopper and others used their simultaneous influence over Enron's business operations and the SPEs as a means to secretly and unlawfully generate millions of dollars for themselves and others.
Source: www.SEC.gov
NOTE: The Integrity Index predicted the securities fraud in 1996 (1 year in advance of the occurrence of securities fraud and 6 years ahead of the SEC action).
889.29 900.85
535.53
875.17
757.45
543.03
334.31
31.5975.52
0.00100.00200.00300.00400.00500.00600.00700.00800.00900.00
1000.00
1991 1992 1993 1994 1995 1996 1997 1998 1999
Inte
gri
ty I
nd
ex
Ra
tin
g
Year
Enron
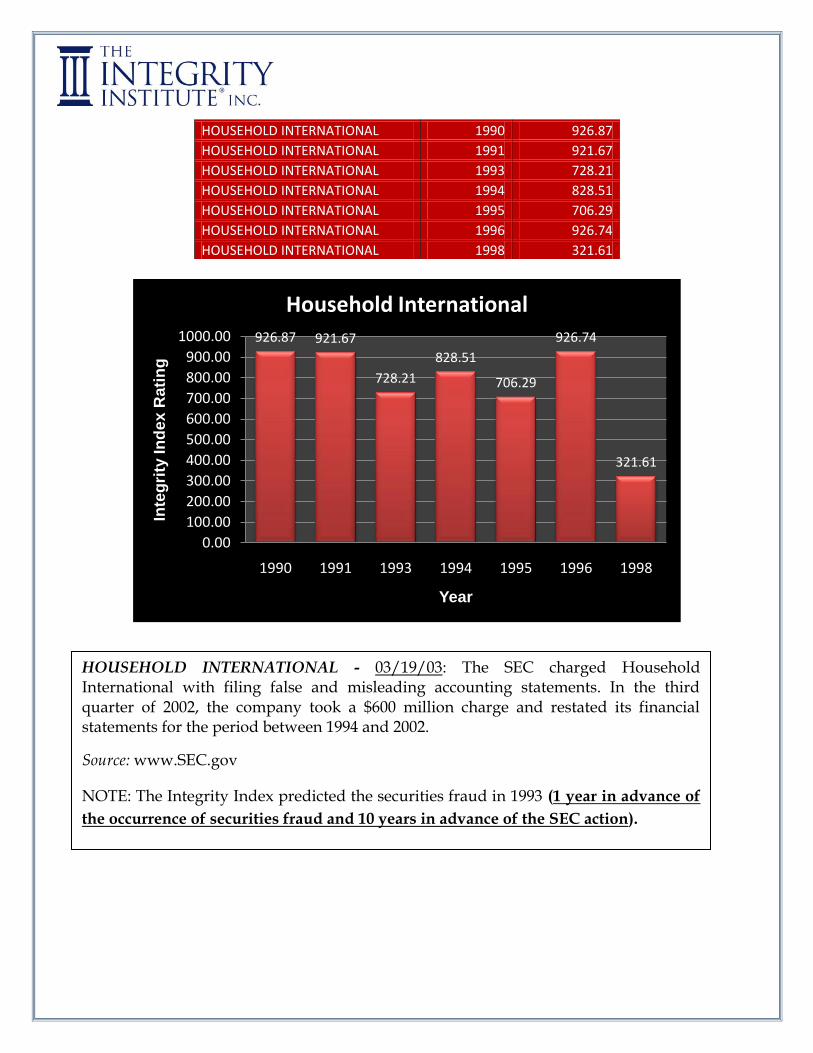
HOUSEHOLD INTERNATIONAL 1990 926.87
HOUSEHOLD INTERNATIONAL 1991 921.67
HOUSEHOLD INTERNATIONAL 1993 728.21
HOUSEHOLD INTERNATIONAL 1994 828.51
HOUSEHOLD INTERNATIONAL 1995 706.29
HOUSEHOLD INTERNATIONAL 1996 926.74
HOUSEHOLD INTERNATIONAL 1998 321.61
926.87 921.67
728.21
828.51
706.29
926.74
321.61
0.00
100.00
200.00
300.00
400.00
500.00
600.00
700.00
800.00
900.00
1000.00
1990 1991 1993 1994 1995 1996 1998
Inte
gri
ty I
nd
ex
Rati
ng
Year
Household International
HOUSEHOLD INTERNATIONAL - 03/19/03: The SEC charged Household International with filing false and misleading accounting statements. In the third quarter of 2002, the company took a $600 million charge and restated its financial statements for the period between 1994 and 2002.
Source: www.SEC.gov
NOTE: The Integrity Index predicted the securities fraud in 1993 (1 year in advance of
the occurrence of securities fraud and 10 years in advance of the SEC action).

INFORMIX 1990 807.34
INFORMIX 1991 897.52
INFORMIX 1992 661.21
INFORMIX 1993 523.23
INFORMIX 1994 547.05
INFORMIX 1995 440.49
INFORMIX 1996 161.97
INFORMIX 1997 734.34
INFORMIX 1999 176.43
INFORMIX – 11/21/01: The SEC alleges that, at the end of July 1997, Informix's financial staff and independent auditors discovered the secret side agreements CEO, Phillip White was concealing. Informix ultimately restated its 1996 financial statements to reflect substantial decreases in its earnings and income caused by, among other things, discovery of the two side agreements White concealed and various other side agreements. Informix's amended 1996 Form 10-K revealed that, instead of earning net income of $97.8 million as Informix originally reported, Informix suffered a net loss of $73.6 million in 1996. IBM acquired the database business from Informix Software for $1B in 2001 – by 2007 IBM had lost 80% of Informix users.
Source: www.SEC.gov
NOTE: The Integrity Index predicted the securities fraud in 1993 (3 years in advance of the occurrence of securities fraud and 8 years in advance of the SEC action).
807.34
897.52
661.21
523.23 547.05
440.49
161.97
734.34
176.43
0.00
100.00
200.00
300.00
400.00
500.00
600.00
700.00
800.00
900.00
1000.00
1990 1991 1992 1993 1994 1995 1996 1997 1999
Inte
gri
ty I
nd
ex
Rati
ng
Year
Informix

MEDAPHIS 1991 850.33
MEDAPHIS 1992 812.09
MEDAPHIS 1993 740.90
MEDAPHIS 1994 600.84
MEDAPHIS 1995 464.68
MEDAPHIS 1996 321.42
MEDAPHIS 1997 659.41
MEDAPHIS 1998 806.49
850.33812.09
740.90
600.84
464.68
321.42
659.41
806.49
0.00
100.00
200.00
300.00
400.00
500.00
600.00
700.00
800.00
900.00
1000.00
1991 1992 1993 1994 1995 1996 1997 1998
Inte
gri
ty I
nd
ex
Rati
ng
Year
Medaphis
MEDAPHIS – 08/11/97: The Medaphis fraud was a case of financial statement fraud. The fraud started when the company materially misrepresented their 1995 fourth quarter results to meet earnings expectations. The 1995 year end results that were released directly matched analyst expectations, as well as having record high operating results. The company continued the fraud by materially overstating their net income in the first two quarters of 1996. They eventually admitted that the results in 1995’s fourth quarter were materially false and misleading due to improper and deceptive accounting practices. This stunned the entire investment community as they were led to believe Medaphis a solid investment.
Source: www.SEC.gov
NOTE: The Integrity Index identified the securities fraud in 1995 (Concurrent with the occurrence of securities fraud and 2 years in advance of the SEC action).

NETWORK ASSOCIATES 1996 665.58
NETWORK ASSOCIATES 1998 298.39
NETWORK ASSOCIATES – 06/16/94: Network Associates filed false and misleading annual and quarterly reports and financial statements, and securities registration statements, with the Commission from the second quarter of 1998 through the first quarter of 2001. On October 31, 2003, Network Associates restated its financial results for the third time in five years. The 2003 restatement affected seven years of reported financial results – beginning in 1997 through the second quarter of 2003. For 1998 alone, the restatement decreased originally reported revenues by approximately $562 million, or 57 percent. As a result of the restatement, the total revenues for the period decreased by $291 million. Source: www.SEC.gov
NOTE: The Integrity Index identified the securities fraud in 1998 (Concurrent with the occurrence of securities fraud and 6 years in advance of the SEC action).
665.58
298.39
0.00
200.00
400.00
600.00
800.00
1000.00
1996 1998
Inte
gri
ty I
nd
ex
Rati
ng
Year
Network Associates

ORACLE 1990 740.09
ORACLE 1991 211.20
ORACLE 1992 545.36
ORACLE 1996 466.88
ORACLE 1997 991.48
ORACLE - 03/14/96: From 1991 until March 1994, Oracle willfully engaged in the business of offering and selling Oracle securities to the general public. During this period, Oracle continuously offered its securities. Oracle willfully used interstate telephonic communication and the mails to facilitate the offer and sale of Oracle securities. No registration statement has been in effect or filed with the Commission with respect to the securities offered and sold by Oracle. As of March 1994, Oracle had offered and sold Oracle securities to at least 41 individuals and entities, raising an amount in excess of $1.2 million. He arranged the offer and sale of the Oracle securities.. In view of the above, Oracle willfully violated Section 17(a) of the Securities Act, Section 10(b) of the Exchange Act, and Rule 10b-5 thereunder. Source: www.SEC.gov A securities fraud class action was also filed for securities of Oracle Corporation between 12/15/01 & 03/01/01, against Oracle and one of its founders, CEO and Chairman J. Ellison, for violations of the federal securities laws arising out of defendants' misleading statements concerning the Company's operations and prospects for Q3 2001 and beyond. Taking advantage of the inflation in Oracle stock, Oracle's Chairman dumped almost $900 million of his own Oracle stock at artificially inflated prices of as much as $32 per share, in what the largest insider trading in the history of the U.S. financial market. Source: http://www.legalcasedocs.com/120/246/246.html#item28
NOTE: The Integrity Index identified the securities fraud in 1991 (Concurrent with the
occurrence of securities fraud and 5 years in advance of the SEC action).
740.09
211.20
545.36466.88
991.48
0.00
200.00
400.00
600.00
800.00
1000.00
1990 1991 1992 1996 1997
Inte
gri
ty I
nd
ex
Rati
ng
Year
Oracle

RITE AID 1991 943.20
RITE AID 1992 882.23
RITE AID 1993 843.69
RITE AID 1994 892.87
RITE AID 1995 759.26
RITE AID 1996 703.99
RITE AID 1997 237.63
RITE AID 1998 697.81
RITE AID 1999 482.14
943.20882.23
843.69892.87
759.26703.99
237.63
697.81
482.14
0.00
100.00
200.00
300.00
400.00
500.00
600.00
700.00
800.00
900.00
1000.00
1991 1992 1993 1994 1995 1996 1997 1998 1999
Inte
gri
ty I
nd
ex
Rati
ng
Year
Rite Aid
RITE AID – 06/21/02: Rite Aid overstated its income in every quarter from May 1997 to May 1999, by massive amounts. When the wrongdoing was ultimately discovered, Rite Aid was forced to restate its pre-tax income by $2.3 billion and net income by $1.6 billion, the largest restatement ever recorded. The complaint also charges that CEO Martin Grass caused Rite Aid to fail to disclose several related-party transactions, in which Grass sought to enrich himself at the expense of Rite Aid's shareholders. Source: www.SEC.gov NOTE: The Integrity Index identified the securities fraud in 1997 (Concurrent with the occurrence of securities fraud and 5 years in advance of the SEC action).

SUNBEAM 1992 920.20
SUNBEAM 1996 590.74
SUNBEAM 1997 453.13
SUNBEAM 1998 773.79
920.20
590.74
453.13
773.79
0.00100.00200.00300.00400.00500.00600.00700.00800.00900.00
1000.00
1992 1996 1997 1998
Inte
gri
ty I
nd
ex
Rati
ng
Year
Sunbeam
SUNBEAM – 09/03/02: The illegal conduct began at year-end 1996 with the creation of inappropriate accounting reserves, which increased Sunbeam's reported loss for 1996. These "cookie-jar" reserves were then used to inflate income in 1997, thus contributing to the false picture of a rapid turnaround in Sunbeam's financial performance. In addition, to further boost income in 1997, the Company recognized revenue for sales, including "bill and hold sales," that did not meet applicable accounting rules. As a result, for fiscal 1997, at least $60 million of Sunbeam's reported $189 million in earnings from continuing operations before income taxes came from accounting fraud. Sunbeam's improper accounting and channel stuffing in 1997 created the prospect of diminished results in 1998.
Source: www.SEC.gov
NOTE: The Integrity Index identified the securities fraud in 1996 (Concurrent with the occurrence of
the securities fraud and 6 years in advance of the SEC action).

WASTE MANAGEMENT 1990 355.63
WASTE MANAGEMENT 1991 414.84
WASTE MANAGEMENT 1992 22.90
WASTE MANAGEMENT 1993 333.05
WASTE MANAGEMENT 1994 691.95
WASTE MANAGEMENT 1995 730.17
WASTE MANAGEMENT 1996 383.01
WASTE MANAGEMENT 1997 284.47
WASTE MANAGEMENT 1998 884.92
WASTE MANAGEMENT 1999 964.77
WASTE MANAGEMENT – 03/26/02: The SEC charged executives with a systematic Scheme to falsify and misrepresent the company’s financial results between 1992 and 1997.
Source: www.SEC.gov
NOTE: The Integrity Index predicted the securities fraud in 1990 (2 years in advance of the occurrence
of securities fraud and 12 years in advance of the SEC action).
355.63414.84
22.90
333.05
691.95730.17
383.01
284.47
884.92964.77
0.00
100.00
200.00
300.00
400.00
500.00
600.00
700.00
800.00
900.00
1000.00
1990 1991 1992 1993 1994 1995 1996 1997 1998 1999
Inte
gri
ty I
nd
ex
Rati
ng
Year
Waste Management

XEROX CORP 1991 999.91
XEROX CORP 1992 988.71
XEROX CORP 1993 921.43
XEROX CORP 1994 977.92
XEROX CORP 1995 776.97
XEROX CORP 1996 759.53
XEROX CORP 1997 1.29
XEROX CORP 1998 18.42
XEROX CORP 1999 495.68
999.91 988.71921.43
977.92
776.97 759.53
1.29 18.42
495.68
0.00
100.00
200.00
300.00
400.00
500.00
600.00
700.00
800.00
900.00
1000.00
1991 1992 1993 1994 1995 1996 1997 1998 1999
Inte
gri
ty I
nd
ex
Rati
ng
Year
Xerox
XEROX – 04/11/02: From at least 1997 through 2000, Xerox Corporation ("Xerox") defrauded investors. In a scheme directed and approved by its senior management, Xerox disguised its true operating performance by using undisclosed accounting maneuvers -- most of which were improper -- that accelerated the recognition of equipment revenue by over $3 billion and increased earnings by approximately $1.5 billion.
Source: www.SEC.gov
NOTE: The Integrity Index indentified the securities fraud in 1997 (Concurrent with the occurrence of
securities fraud and 5 years in advance of the SEC action).

Appendix C

1990 1991 1992 1993 1994 1995 1996 1997 1998 1999
BANK OF AMERICA CORP. 919.73 402.84 828.72 4.45 1.42
BOSTON SCIENTIFIC 639.02 536.16 613.61 543.07 398.10
CENDANT 884.72 396.65 688.60 692.54 999.99 970.203
CISCO SYSTEMS 610.82 518.21 619.83
ENRON 889.28 900.84 535.52 875.17 757.45 543.02 334.30 31.58 75.52
INFORMIX 807.34 897.51 661.21 523.22 547.04 440.49 161.97 734.33 176.43
MEDAPHIS 850.32 812.08 740.90 600.83 464.67 321.41 659.40 806.48
RITE AID 943.20 882.23 843.68 892.87 759.25 703.99 237.63 697.80 482.13
WASTE MANAGEMENT 355.63 414.83 22.90 333.04 691.94 730.17 383.00 284.46 884.92 964.77
XEROX CORP 999.91 988.71 921.42 977.91 776.97 759.52 1.29 18.41 495.67
Using the Selectorate Theory Model as an example of The Integrity Index application represents a significant advancement in corporate performance analysis. Although The Integrity Index model relies and incorporates a variety of social science theory and statistics, when using Selectorate Theory developed by a group of the world’s foremost game theorists to predict sustainable corporate performance, we see from the above chart that represents the analysis of the original data set developed in the attached white paper, we see that the Model predicted 8 out of 10 of the largest cases of securities fraud at least two years in advance. The attached white paper available on the Internet outlines the mathematical equations used in calculating the results using Selectorate Theory. The translation of the results using Selectorate Theory into The Integrity Index and color variation was performed by The Integrity Institute.

The Political Economy of Corporate
Fraud: A Theory and Empirical Tests
By
Bruce Bueno de Mesquita
(Politics Department, New York University and
Hoover Institution, Stanford University)
Alastair Smith
(Politics Department, New York University)
September 2004

1
Abstract
Guided by a theory of governance known as the selectorate theory (Bueno de Mesquita et
al, 2003), we examine how governance structures within publicly traded companies
affects corporate performance, the ease with which corporate executives lose their jobs
for poor performance, and the incentives of executives to misstate corporate performance
to protect their jobs. Firms are classified according to the number of individuals who
have a say in who should lead them (the selectorate) and the size of the group of
supporters a leader needs to gain or maintain control (the winning coalition). Using
publicly available data, we develop measures of these concepts within the corporate
setting and show that these governance structures influence corporate performance and
compensation packages used to reward management and stockholders. We compare
compensation packages and reported performance with those expected given governance
structures. Deviations from expectations provide predictors of fraudulent reporting that
allow for discrimination between firms that subsequently commit fraud (within two
years) and those that do not.

2
The Political Economy of Corporate Fraud: A Theory and Empirical Tests
I Introduction
Cases of fraudulent corporate reporting by managers who then cash out their
holdings are widely thought to corroborate the risk highlighted in principal-agent models
of the firm.1 The risk is that inadequate governance-constraints free managers to
expropriate the investments of financial backers (Coase 1937; Jensen and Meckling 1976;
Fama and Jensen 1983a, b; Baumol 1959; Marris 1964; Williamson 1964; Grossman and
Hart 1988; see Schleifer and Vishny 1997 for review). Yet, to our knowledge the
principal-agent framework has thus far not been shown to account for or adequately
predict accounting fraud. Alexander and Cohen (1996) and Baucus and Near (1991), to
be sure, examine how corporate performance and governance influences the likelihood
that firms engage in economic crime, but they do not focus specifically on accounting
fraud. Hansen, McDonald, Messier and Bell (1996) use a neural network to attempt to
predict accounting fraud but, as is the nature of neural network models, they do not
provide micro-foundations for their predictions.
In developed equity markets with adequate legal protection for investors, we
believe that securities fraud (also referred to as accounting fraud) is typically the result of
management trying to preserve shareholder value in order to protect their jobs in the face
of poor performance rather than as a result of a desire to defraud investors per se.
1 For instance, both President George W. Bush in his weekly radio address (June 29, 2002) and Federal Reserve chairman Allan Greenspan in testimony before Congress (New York Times, July 17 2002, p. A17) called for curbs on greed and in a recent Harris Interactive poll 90% of the public thought the recent collapses of such companies as Enron and Worldcom were the result of unfettered management greed (Roper Center 2002).

3
Building on this assumption, we model the likelihood of fraudulent reporting as a
function of each corporation’s reported performance; ownership oversight; and
institutionally induced incentives to govern truthfully. We then test key propositions and
offer out-of-sample evidence of the potential of the model discussed here – referred to as
the selectorate model (Bueno de Mesquita, Smith, Siverson, and Morrow [hereafter
BdM2S2] 2003)– to predict fraudulent corporate reporting among publicly-traded US
firms.
The paper proceeds as follows. Section II explains the model. Like others, we
focus on the principal-agent relationship between shareholders and firm managers (Berle
and Means 1932, Schleifer and Vishny 1997). However, we diverge from the standard
view that the agency problem arises because unconstrained managers maximize their
compensation at the expense of shareholders (Fama and Jensen 1983a, b; Aggarwal and
Samwick 1999). Rather, we assume that the primary interest of managers is to retain their
jobs and that the agency problem arises because of this motivation. Job retention is
thought to be primary because managers value their long-term income stream over short-
term gains and because they attach value to exercising control (Caplow 1968; Holmstrom
1999). The selectorate model shows how variations in internal governance structures
influence the tradeoff between management’s urge to increase its compensation and its
desire to retain its corporate leadership position.
Others, of course, consider job retention as a potential motivator of actions by
firm managers. Jensen and Ruback (1983) drew attention to the costs for firms associated
with efforts by unsuccessful managers to retain their jobs. Jensen and Meckling (1976)
and Fama (1980) investigated how the contractual risk of termination creates incentives

4
for managers to try to produce good corporate performance. While studies, such as
Weisbach (19880), Yermack (1996) and Denis et al (1997), find evidence that poor
performance increases the risk of CEO turnover, executive dismissal remains relatively
uncommon. These studies highlight the role of management structure and firm ownership
in shaping the threat of dismissal. Dismissals for poor performance are relatively rare.
Weisbach (1988) estimates that if firms are ranked by stock return performance then,
even in the lowest decile of firms, the CEO turnover rate is only 6.1%. As Jensen (1993)
observes, boards of directors are generally captured by management, making it difficult
for boards to dismiss managers. Warner, Watts, and Wruck (1988) demonstrate, however,
that boards are willing to dismiss managers when faced with truly bad performance.
These results are reinforced by Martin and McConnell (1991) in the context of corporate
takeovers. As we emphasize, one reason for committing fraud is to cover up the firm’s
true record to avoid dismissal. If fraud is perpetrated successfully, it goes undetected and
so few dismissals are observed. Only when circumstances preclude a successful cover-up
is fraud likely to be uncovered. Dismissal follows once the truly disastrous circumstances
of the firm come to light. Whether discovered ex post or not, the threat of dismissal can
be the primary ex ante motivation for management’s conduct.
Thus, a feature of the selectorate model is to highlight how and when the threat of
termination following poor corporate performance encourages management to commit
fraud rather than report the true record of the firm. Unlike the model proposed here,
previous studies have not investigated the endogenous relationship between internal
corporate governance structures, job security, and compensation in the face of incentives
to misreport results.
5
Section III describes the data we use based on a random sample of publicly traded
firms in the United States, as well as all publicly traded American firms alleged to have
committed securities fraud over the period from 1989-2001. In Section IV we use the
data to test propositions derived from the model. The evidence supports the proposition
that senior managers who depend on a large coalition to retain their jobs are more likely
to engage in fraudulent reporting than are managers who govern with the support of a
small coalition. We also find that highly diffuse ownership and highly concentrated
ownership both make fraud less likely, while intermediate levels of concentration of
ownership substantially increase the risk of fraud. The results on ownership concentration
reinforce empirical findings by McConnell and Servaes (1990) and theoretical
implications derived by Stulz (1988) regarding corporate performance, albeit in a rather
different context from that of the selectorate model.
The model implies and the evidence supports the expectation that in periods
leading up to the commission of fraud, senior managers are under-compensated relative
to expectations given the firm’s governance structure and reported corporate
performance. This finding undermines the view that there is a straightforward link
between greed and fraud. The empirical analysis highlights a specific pattern of dividend
payments, executive compensation, and growth in market capitalization that is indicative
of firms that are likely to commit fraud.
In Section V we report the out-of-sample predictive capabilities of the model. We
show that it can be a reliable tool for identifying the risk of fraud in specific firms,
providing one to two years of early warning. In fact, the subset of firms in our highest ex
ante risk category were subsequently alleged to have commit fraud over eighty percent of

6
the time while those in the lowest ex ante risk grouping subsequently are alleged to have
committed fraud less than 2.5 percent of the time. Section VI provides conclusions.
Section II The Model
The essential features of any organization’s governance structure can be depicted
within a two-dimensional space where one axis is the size of the organization’s
selectorate (S) and the other dimension is the size of its winning coalition (W), W < S.
The selectorate is the set of people responsible for choosing the leadership – for
convenience referred to here as the CEO of a firm – and with the prospect of themselves
gaining access to special privileges or benefits as a result of their support for the
incumbent or a new management team. The winning coalition is the subset of the
selectorate whose support is essential for the leadership to remain in its position of
authority. In the CEO’s quest to keep his or her job, these two political institutions – W
and S – influence corporate policies and the risk of misreporting financial results.
The focus of the game is political competition for control of the firm. The
incumbent corporate leader, L, attempts to defeat challenger C who seeks to become
CEO.2 Both the challenger and CEO offer an allocation of private (g) and public (x)
goods subject to the budget constraint: gW + px ≤ R. R represents the resources
(revenues) corporate leaders can allocate, g is the provision of private goods that are
benefits only to those “inside” the firm’s governance structure (e.g. senior management,
members of the board of directors), with W being the size of the coalition who receive
these goods, x is the provision of public goods; that is benefits equally received by each
2 For technical convenience, we assume there is an infinite pool of potential challengers so the incumbent faces a different rival in each period.
7
share held by the owners of the firm, and p is the price of providing public goods. The
public goods, x, include such things as dividends and growth in market capitalization.
While the provision of x benefits all shareholders, it does not satisfy the non-rival aspects
of true public goods. However for ease of language we refer to these non-excludible
benefits as public goods. We also abuse notation by referring to W as both the set of
supporters in the winning coalition and the size of this set.
The selectors choose to retain the CEO or to replace her with a rival. Selectors,
who could in principle be elevated to the board or senior management to form a new
winning coalition, receive benefits from both private and public goods. In particular we
assume selectors have additively separable, continuous, concave utility functions V(x, g).
We denote the partial derivatives of V(x,g) with respect to x and g as Vx(x,g) and
Vg(x,g), respectively. Corporate leaders receive a payoff of Ψ>0 if they retain their job.
This is the value they attach to exercising control. Additionally the leader receives
benefits equivalent to the size of any resources she retains for her personal disposal. We
can think of these retained resources as the CEO’s salary and other benefits. Deposed
CEOs or rivals who fail to attain control receive a payoff of zero.
Additional to the material benefits of being CEO, we assume corporate leaders
have different affinities (idiosyncratic likes and dislikes) towards each selector. Affinities
play an important role in shaping the survival of leaders so we pause to discuss our
assumptions and the incentives they create within the game.
We assume that initially a potential leader’s affinities are unknown and that each
possible order of affinities over the pool of selectors is equally likely. In some
specifications of the selectorate theory (BdM2S2 2002) we explicitly include these

8
affinities as part of players’ payoffs. Here we treat them lexicographically and use them
only to break ties if all else is equal. Once a potential leader becomes CEO, affinities are
learned and become common knowledge. In all subsequent rounds the CEO forms her
coalition with those selectors with whom she has the greatest affinity. The revelation of
affinities reflects the risk of defecting to a challenger. An incumbent CEO can credibly
commit to including current members of her coalition in future coalitions; she is after all
already including her most preferred (highest affinity) selectors. In contrast, the
challenger realigns his coalition once his affinities are revealed. Hence while a selector’s
decision to join the challenger’s transitional coalition might be essential in the rival’s
ascendance, the challenger can not guarantee that selector long term membership in his
coalition and the associated private goods paid to members of the coalition. As Weisbach
(1988 p.432) states it “Inside directors’ careers are tied to the CEO’s and hence insiders
generally are unable or unwilling to remove incumbent CEOs.”
a. The Game
The game is infinitely repeated, with all payoffs discounted by a common
discount factor δ. The stage game is as follows:
1) The incumbent CEO (L) and rival (C) simultaneously announce compensation
schemes and coalitions. The CEO’s coalition (WL) is the W selectors with whom she has
the highest affinity. The CEO announces compensation of gL private and xL public goods.
The rival challenger announces a coalition (WC) of size W and compensation of gC
private and xC public goods.

9
2) Selectors choose between the CEO and the rival. The CEO is replaced by the
challenger if and only if fewer than W members of WL support the incumbent and W
members of WC support the rival.
3) The affinities of the leader chosen in step 2 (be that the incumbent or the rival) are
revealed and become common knowledge.
Proposition 1: There exists a Markov Perfect Equilibrium in which the incumbent CEO
always survives spending m* resources to provide g* private and x* public goods
(m*=x*p+g*W) and the challenger offers g private and x public goods (R= x p+ g W) in
each period.3 These policy provisions satisfy the following four equations:
0)0*,()1(*)*,(),(*)*,(11 =−
−1−
−1−−− xV
S
WgxV
S
WgxVgxV
δδ
δδ
δ (1)
0*)*,(*)*,( =− gxpVgxWV gx (2)
0),(),( =− gxpVgxWV gx (3)
0=−− gWxpR (4)
Proof and discussion: We start by characterizing optimal spending. Specifically, for any
given level of spending, M, on a coalition of size W, we define ),(^
WMg and ),(^
WMx
as the level of private and public goods that maximize the payoffs of a coalition member.
Formally, ),(^
WMx , ),(^
WMg = ).(maxarg,
gxVxg ++ ∈∈ RR
subject to the budget constraint M
= W g + px. The first order conditions of this maximization problem imply that
3 Here we do not examine the model in an incomplete information setting in which incumbent CEOs do not always retain their jobs because our interest is less in identifying when a CEO will be deposed than in identifying what CEOs can do to offset threats to their job retention.

10
WVx(x,g) = pVg(x,g). Equations (2) and (3) ensure both the incumbent and rival
maximize the payoff to coalition members for the given level of resource expenditure.
We define the indirect utility function associated with these optimal compensations as
v(M, W) = V (^
x (M,W), ^
g (M,W)) and the value of receiving only the public benefits
associated with this compensation scheme as u(M, W) = V(^
x (M,W), 0).
By the deposition rule in step 2 of the stage game, to come to power the rival
needs to convince at least one member of the incumbent’s coalition to defect. The rival
then makes the best possible offer he can in order to persuade at least one current
coalition member to defect to him. In the immediate period the challenger can do no
better than offer to spend all resources optimally; that is, ^
x (R,W) and ^
g (R,W), providing
v(R,W) rewards to his coalition. Should the rival succeed in displacing the incumbent
CEO then in the next period he will provide g* private goods and x* public goods to the
coalition of W selectors for whom he has the highest affinity. Since the rival’s affinities
are not known and all possible affinity orderings are equally likely, the probability of any
individual selector being included in the rival’s future winning coalition is S
W. With
probability (S
W−1 ) a selector is excluded from the rival’s future coalition. Therefore, the
present value of the rival’s best possible compensation scheme is:
)*,()1()*,(),( WmuS
WWmv
S
WWRv −
−1+
−1+
δδ
δδ
.
The first term represents the best possible immediate compensation the rival can
offer. The second represents the discounted value of being included in the rival’s

11
coalition in every future period. The probability of such inclusion is S
W. The third term is
the discounted value of being excluded from the rival’s coalition in future rounds.
Exclusion occurs with probability (S
W−1 ).
If the CEO is retained, then members of her coalition receive the immediate
benefits of her compensation plus the net present value of receiving payoff of v(m*,W) in
the form of x* public and g* private goods in each future period. Hence selectors in WL
remain loyal to the CEO provided that:
VxL, gL +δ
1−δvm∗, W ≥ vR, W + δ
1−δWS
vm∗, W + δ
1−δ1 −
WSum∗,W
(5). This decision defines optimal voting in undominated strategies by coalition
members.4
The incumbent CEO does best while keeping her job by satisfying equation (5)
with equality through optimal spending, equation (2). The stationarity of MPE implies
that the CEO’s behavior in the current period is identical to behavior in future periods.
Therefore,
11−δ
vm∗, W = vR, W + δ
1−δWS
vm∗, W + δ
1−δ1 −
WSum∗, W
(6).
Equation (6) is simply equations (1)-(4) written in terms of the indirect utility function.
Since the CEO minimizes expenditures while maintaining office, the challenger can not
improve his prospects of attaining the top job and the selectors choose optimally between
candidates for the CEO position, equations (1)-(4) characterize a MPE.5
4 Those selectors outside of WL obviously vote for the challenger since this gives them increased immediate returns and the prospect of inclusion in future winning coalitions. 5 The above model provides the simplest exposition of the selectorate theory. Elsewhere we relax the strict assumptions on the choice of coalition membership used here. We also

12
b. Institutional determinants of compensation and survival
Now we discuss the comparative static results utilized here. The first important
comparative static indicates that the ratio of private to public goods is decreasing in the
size of the winning coalition: 0*
*
<dW
x
gd
. As W increases, corporate leaders direct more
resources towards providing public benefits such as increased share price or dividends to
stockholders. This result follows directly from equation (2).
The second comparative static examines R-m*, the difference between the total
available resources, R, and the amount of resources the CEO must spend to match the
challenger’s best possible offer. It provides a metric of the ease of survival for CEOs.
When R-m* is large, the incumbent CEO can retain plenty of resources for her own
discretionary purposes (Baumol 1959; Marris 1964; Williamson 1964; Grossman and
Hart 1988). Having such discretionary resources cushions the CEO against exogenous
shocks that might otherwise endanger her control of the corporation. In contrast when R-
m* is small, the CEO’s control of the firm is less secure as she has fewer resources
available to compensate for short falls.
The ease with which CEOs can survive in office (R-m*) is increasing in the size
of the selectorate and is decreasing in the size of the winning coalition: 0*)( >−
dS
mRd
extend the theoretical model to consider the endogenous generation of resources and examine the consequences of alternative deposition rules (BdM2S2 1999, 2002, 2003).

13
and 0*)( <−
dW
mRd.6 This indicates that CEOs who depend on a relatively large coalition
of, say, directors, are at greater risk of deposition as a result of poor performance than are
those who depend on a small coalition. As a consequence, the former group of CEO’s has
the greatest incentive to misrepresent performance to preserve their jobs.
Selectorate size also influences the risk to a CEO’s tenure. When ownership is
diffuse (S is large), such that current insiders have little prospect of also being insiders
under new management, CEO’s jobs are relatively safe despite poor performance.
However, as ownership becomes concentrated in fewer hands (S is small), such that
current insiders are more likely to be included within a new management team,
supporters become less loyal and CEO’s have increased incentives to misrepresent
performance to protect their jobs.
Section III Data and Measurement
Our data set consists of 372 randomly selected US publicly traded firms plus 91
firms alleged to have committed fraud. Fraud allegations are based on firms investigated
by the SEC for material misstatements in their financial reports. The compilation of cases
was provided by Arthur Andersen, LLP for 1989-1999 and updated with comparable data
from Stanford’s securities fraud web site maintained by Joseph Grundfest for 2000-2001
6 These comparative static results are most easily seen by rearranging equation (6)
to produce identity I=v(m*,W)-v(R,W)+(δ/(1-δ))(1-W/S)( v(m*,W)- u(m*,W))=0, with partial derivatives Im =vm(m*,W) +(δ/(1-δ))(1-W/S)( vm(m*,W)- um(m*,W)) > 0, IW=vW(m*,W)-vW(R,W)-(δ/(1-δ))(1/S)( v(m*,W)- u(m*,W)) )+ (δ/(1-δ))(1-W/S)(vW(m*,W)- uW(m*,W)) < 0, and IS= (δ/(1-δ))( W/S2)( v(m*,W)- u(m*,W)) >0. By Cramer’s rule, dm*/dW= -IW/IM >0 and dm*/dW= -IW/IM < 0.
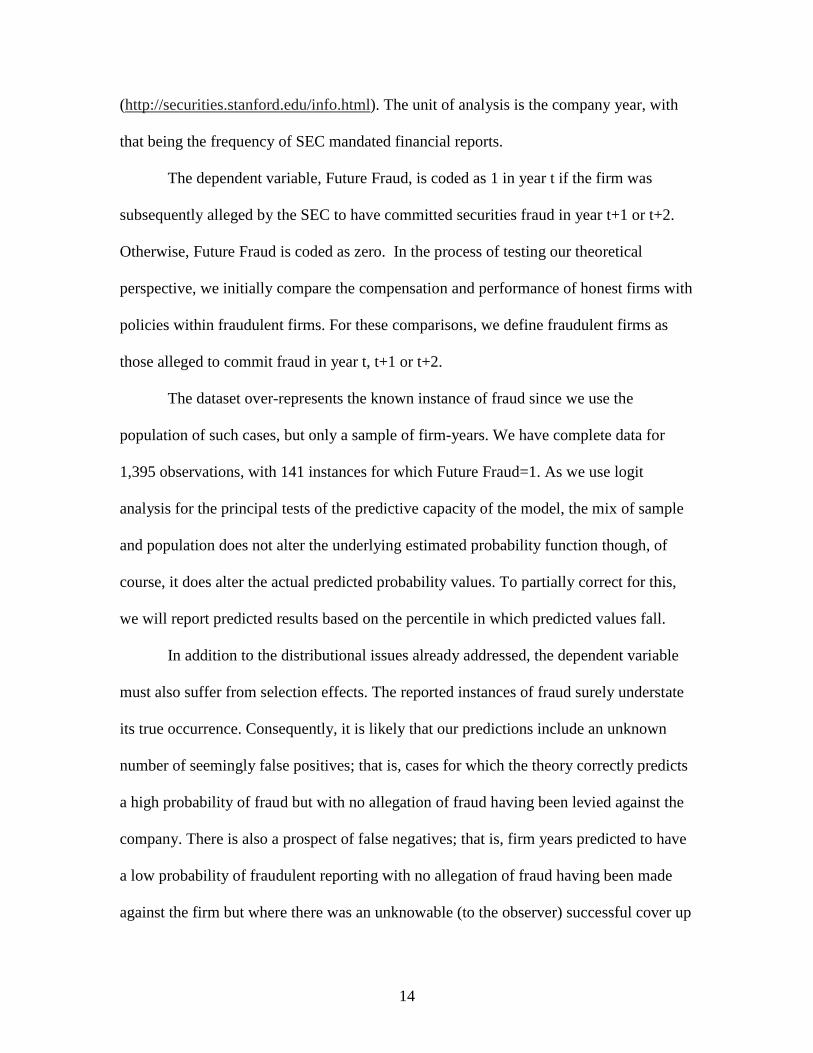
14
(http://securities.stanford.edu/info.html). The unit of analysis is the company year, with
that being the frequency of SEC mandated financial reports.
The dependent variable, Future Fraud, is coded as 1 in year t if the firm was
subsequently alleged by the SEC to have committed securities fraud in year t+1 or t+2.
Otherwise, Future Fraud is coded as zero. In the process of testing our theoretical
perspective, we initially compare the compensation and performance of honest firms with
policies within fraudulent firms. For these comparisons, we define fraudulent firms as
those alleged to commit fraud in year t, t+1 or t+2.
The dataset over-represents the known instance of fraud since we use the
population of such cases, but only a sample of firm-years. We have complete data for
1,395 observations, with 141 instances for which Future Fraud=1. As we use logit
analysis for the principal tests of the predictive capacity of the model, the mix of sample
and population does not alter the underlying estimated probability function though, of
course, it does alter the actual predicted probability values. To partially correct for this,
we will report predicted results based on the percentile in which predicted values fall.
In addition to the distributional issues already addressed, the dependent variable
must also suffer from selection effects. The reported instances of fraud surely understate
its true occurrence. Consequently, it is likely that our predictions include an unknown
number of seemingly false positives; that is, cases for which the theory correctly predicts
a high probability of fraud but with no allegation of fraud having been levied against the
company. There is also a prospect of false negatives; that is, firm years predicted to have
a low probability of fraudulent reporting with no allegation of fraud having been made
against the firm but where there was an unknowable (to the observer) successful cover up
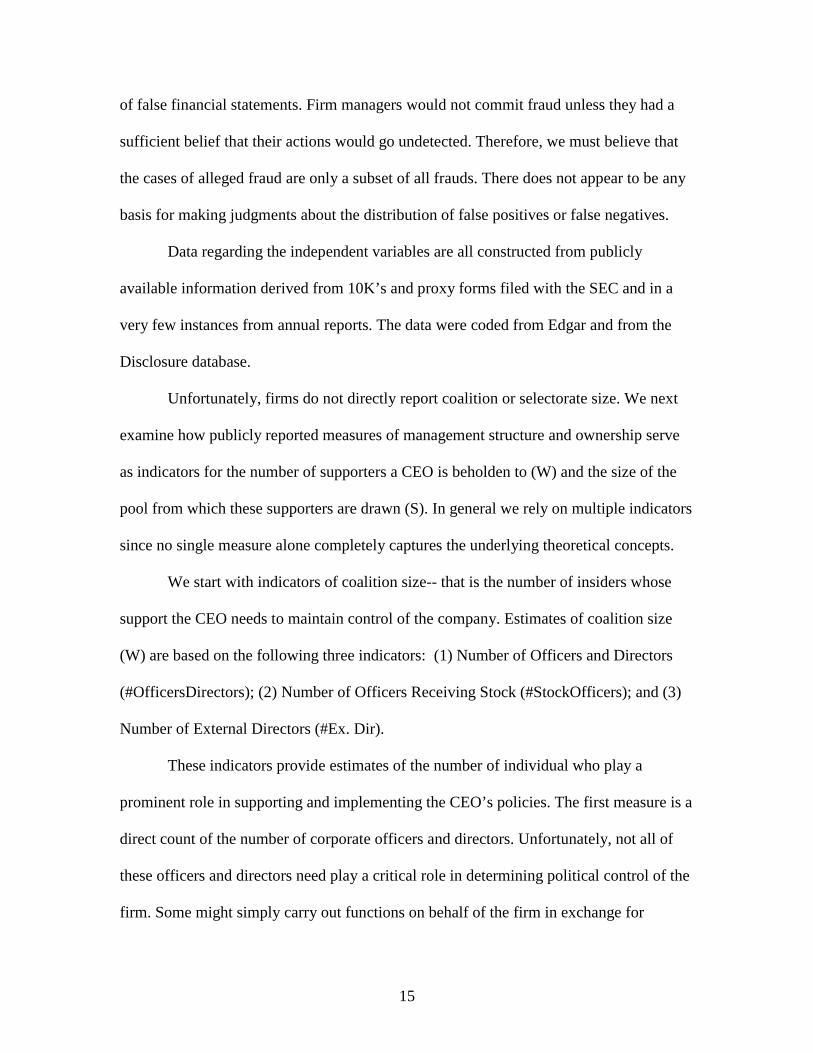
15
of false financial statements. Firm managers would not commit fraud unless they had a
sufficient belief that their actions would go undetected. Therefore, we must believe that
the cases of alleged fraud are only a subset of all frauds. There does not appear to be any
basis for making judgments about the distribution of false positives or false negatives.
Data regarding the independent variables are all constructed from publicly
available information derived from 10K’s and proxy forms filed with the SEC and in a
very few instances from annual reports. The data were coded from Edgar and from the
Disclosure database.
Unfortunately, firms do not directly report coalition or selectorate size. We next
examine how publicly reported measures of management structure and ownership serve
as indicators for the number of supporters a CEO is beholden to (W) and the size of the
pool from which these supporters are drawn (S). In general we rely on multiple indicators
since no single measure alone completely captures the underlying theoretical concepts.
We start with indicators of coalition size-- that is the number of insiders whose
support the CEO needs to maintain control of the company. Estimates of coalition size
(W) are based on the following three indicators: (1) Number of Officers and Directors
(#OfficersDirectors); (2) Number of Officers Receiving Stock (#StockOfficers); and (3)
Number of External Directors (#Ex. Dir).
These indicators provide estimates of the number of individual who play a
prominent role in supporting and implementing the CEO’s policies. The first measure is a
direct count of the number of corporate officers and directors. Unfortunately, not all of
these officers and directors need play a critical role in determining political control of the
firm. Some might simply carry out functions on behalf of the firm in exchange for

16
monetary compensation, in much the same manner that regular employees work for the
firm. The second measure, number of officers receiving stock, attempts to restrict the
measure of coalition size to political insiders by counting only those executives with an
important role within the politics of the firm that they receive stock options.
The third measure of coalition size is the number of external director. These
individuals were part of the first measure. They are less likely to be important insiders
relative to officers or internal directors so that for a given number of officers and
directors, the more external directors, the smaller the winning coalition is likely to be.
To gain further leverage on the role of external directors in our estimates of fraud
we include their compensation and their compensation squared. External directors who
are paid little more than a nominal fee for attending meetings are unlikely to be corporate
insiders. As their compensation increases it becomes likely that they are in the winning
coalition. However, if external directors’ compensation is substantial (indicative of a
private goods focus), then the theory suggests the winning coalition is quite small.
Although studies such as Weisbach (1988), Denis et al (1997) and Yermack (1996) have
highlighted the importance of external directors relative to company insiders in shaping
company performance and CEO retention, they have not considered this non-
monotonicity and contingency based on compensation. Given the additional complexities
that these contingencies imply, in our initial tests of private and public goods we restrict
our attention to the former two measures only.
Because we investigate only publicly traded companies, the data necessarily
reflect truncated variance on W. The largest winning coalitions in businesses are
probably associated with partnerships, a set of companies that do not report the data
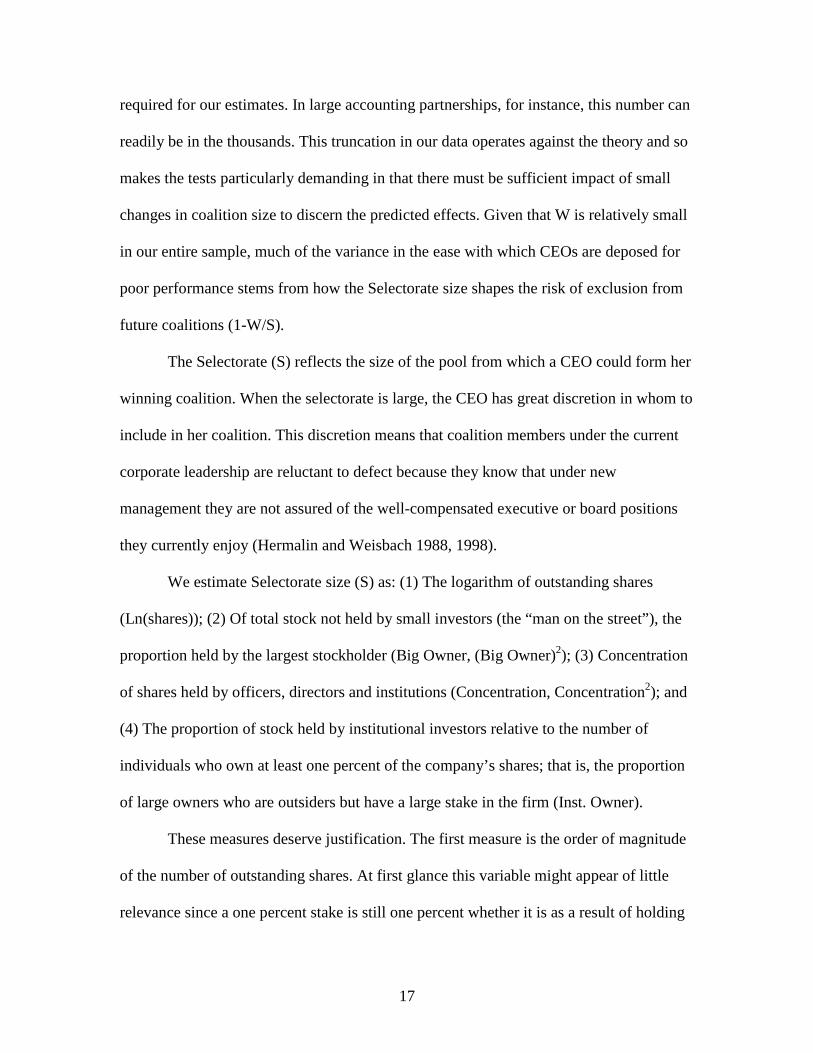
17
required for our estimates. In large accounting partnerships, for instance, this number can
readily be in the thousands. This truncation in our data operates against the theory and so
makes the tests particularly demanding in that there must be sufficient impact of small
changes in coalition size to discern the predicted effects. Given that W is relatively small
in our entire sample, much of the variance in the ease with which CEOs are deposed for
poor performance stems from how the Selectorate size shapes the risk of exclusion from
future coalitions (1-W/S).
The Selectorate (S) reflects the size of the pool from which a CEO could form her
winning coalition. When the selectorate is large, the CEO has great discretion in whom to
include in her coalition. This discretion means that coalition members under the current
corporate leadership are reluctant to defect because they know that under new
management they are not assured of the well-compensated executive or board positions
they currently enjoy (Hermalin and Weisbach 1988, 1998).
We estimate Selectorate size (S) as: (1) The logarithm of outstanding shares
(Ln(shares)); (2) Of total stock not held by small investors (the “man on the street”), the
proportion held by the largest stockholder (Big Owner, (Big Owner)2); (3) Concentration
of shares held by officers, directors and institutions (Concentration, Concentration2); and
(4) The proportion of stock held by institutional investors relative to the number of
individuals who own at least one percent of the company’s shares; that is, the proportion
of large owners who are outsiders but have a large stake in the firm (Inst. Owner).
These measures deserve justification. The first measure is the order of magnitude
of the number of outstanding shares. At first glance this variable might appear of little
relevance since a one percent stake is still one percent whether it is as a result of holding
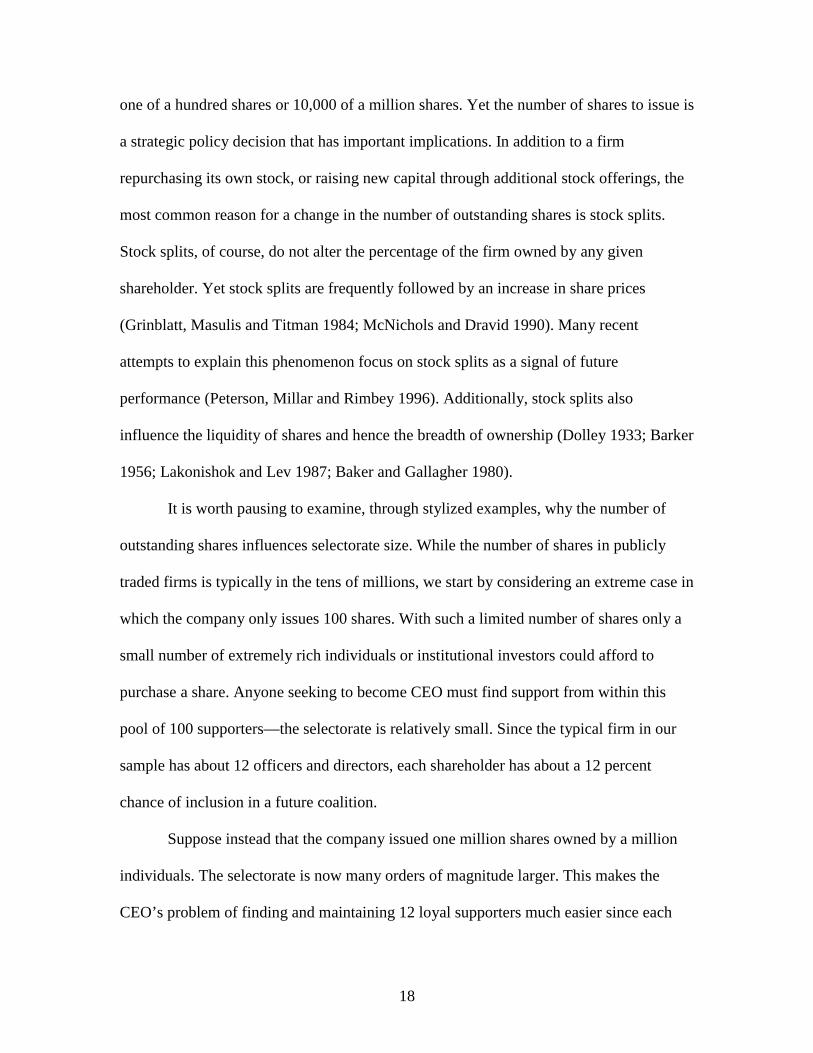
18
one of a hundred shares or 10,000 of a million shares. Yet the number of shares to issue is
a strategic policy decision that has important implications. In addition to a firm
repurchasing its own stock, or raising new capital through additional stock offerings, the
most common reason for a change in the number of outstanding shares is stock splits.
Stock splits, of course, do not alter the percentage of the firm owned by any given
shareholder. Yet stock splits are frequently followed by an increase in share prices
(Grinblatt, Masulis and Titman 1984; McNichols and Dravid 1990). Many recent
attempts to explain this phenomenon focus on stock splits as a signal of future
performance (Peterson, Millar and Rimbey 1996). Additionally, stock splits also
influence the liquidity of shares and hence the breadth of ownership (Dolley 1933; Barker
1956; Lakonishok and Lev 1987; Baker and Gallagher 1980).
It is worth pausing to examine, through stylized examples, why the number of
outstanding shares influences selectorate size. While the number of shares in publicly
traded firms is typically in the tens of millions, we start by considering an extreme case in
which the company only issues 100 shares. With such a limited number of shares only a
small number of extremely rich individuals or institutional investors could afford to
purchase a share. Anyone seeking to become CEO must find support from within this
pool of 100 supporters—the selectorate is relatively small. Since the typical firm in our
sample has about 12 officers and directors, each shareholder has about a 12 percent
chance of inclusion in a future coalition.
Suppose instead that the company issued one million shares owned by a million
individuals. The selectorate is now many orders of magnitude larger. This makes the
CEO’s problem of finding and maintaining 12 loyal supporters much easier since each
19
insider realizes that given the enormous pool of potential supporters he or she has only a
negligible chance of receiving the valuable private compensations associated with board
or executive positions under a new corporate leader. Given this massive selectorate, the
CEO faces little risk of deposition even in the face of appalling performance.
The number of outstanding shares shapes the size of the selectorate. While the
above examples illustrate the point, they are obviously unrealistic. Each share is not held
by a separate individual. Ownership tends to be concentrated among a few individuals
and institutions. In reality only these large owners have a significant prospect of coalition
membership. The “man on the street,” owning only a handful of shares, has almost no
prospect of board membership. In practice this means that the effective size of the
selectorate is much smaller than the number of shares and depends strongly on the extent
to which shares become concentrated. Our measures (2) through (4) are indicators of the
effective number of individual or institutional investors who form the selectorate. As
ownership becomes more concentrated, the selectorate becomes smaller. This contraction
in the pool of potential candidates for board and executive positions makes insiders more
willing to depose CEOs who perform poorly (Shleifer and Vishny 1986). It is this
increased jeopardy that creates incentives to misrepresent performance.
Although increasing ownership concentration reduces selectorate size and hence
increases the risk to under-performing CEOs, at high levels of share concentration the
effects are offset as the CEO becomes the effective owner of the company. Just as a sole
proprietor has no incentive to depose herself or misrepresent her performance, as
ownership becomes extremely concentrated neither does the CEO. Of course this does
not mean that the CEO needs to own 50% of the stock. A controlling share can be much

20
smaller if the remaining shares are distributed diffusely. To account for this non-
monotonicity at high level of concentration, we included quadratic terms for several of
our concentration measures. There is considerable extant evidence regarding this non-
monotonicity in ownership concentration (Stulz 1988; McConnell and Servaes 1990;
Wruck 1989; Morck, Shleifer and Vishny 1988).
The selectorate theory predicts that governance institutions affect corporate policy
and compensation packages. Public goods are goods that are attributable to all share
holders. We have two such measures: dividends (as a percentage of market capitalization)
and market capitalization. Private goods are those benefits received only by winning
coalition members. Again we use multiple indicators for this concept: (1) Perquisites
(non-salary) compensation paid to internal directors, (2) external directors and senior
management (Perqs); (3) Cash payments to external directors (Ex. Dir. Cash, (Ex. Dir.
Cash)2); and (4) The proportion of allocations that go to private goods (Private Ratio).
As previously discussed the second measure-- cash payments to external directors -- has a
contingent influence on the number of external directors. The final variable measures
private goods as a proportion of both private and public rewards, where private goods are
measured as salary and other compensation for internal directors, external directors and
senior management and public goods are measured as market capitalization.
In addition to these variables, we also include in our analyses two stock options
indicators (Stk. Opt. Int. Directors and Stk. Opt. Executives) that measure how many
options are received by internal directors and by the top five senior managers as these

21
variables play a prominent role in current debate over firm governance.7 The details
behind the construction of each variable are reported in the Appendix while Table 1
provides the summary statistics.
Tables 1 About Here
Section IV Empirical Tests of Corporate Performance
Before considering the probability that a company will commit fraud, we examine
key hypotheses derived from the theoretical model. These tests are restricted to firms
whose audits within two years of a given observation have not been alleged to be
fraudulent. We do so to establish baseline expectations as to how firms behave. We will
use these baselines to compare firms alleged to have committed fraud to their apparently
more honest counterparts. Each of these tests includes fixed effects dummy variables for
the year so that we control for general market trends.
a. Private and Public Goods
The selectorate theory indicates that private goods decline as the size of the
winning coalition increases ( 0*
*
<dW
x
gd
). The theory is ambiguous about the net effect of
S on private goods allocations. The ambiguity arises because selectorate size influences
how much the CEO gets in private benefits in a manner opposite to its impact on rewards
to coalition members, a subtlety of the theory not explored here, but borne out in other
investigations (BdM2S2 2003).
7 For instance, Yermack (1997) provides evidence that managers time the release of corporate reports and grants of stocks to increase management’s take.

22
Table 2 shows two different specifications designed to test the effect that coalition
size has on private goods as a proportion of overall rewards. Both tests use two variables
to approximate coalition size: #OfficersDirectors and #StockOfficers. The first variable,
the number of officers and directors, varies between 2 and 31. The number of officers
who receive stock options, the second indicator, varies between 0 and 25. The correlation
between the two indicators is 0.37 (N = 2,136). As we have no basis for preferring one
coalition indicator over the other, we are interested in the hypothesis that they are jointly
negative in their effect on private goods provision. This, in fact, is the case in each of the
tests. For instance, the joint hypothesis test in the first model that both indicators of W are
less than zero yields an F(2, 1545) = 6.62 which is significant at 0.0014.8
Table 2 About Here
How are we to interpret the substantive implication of this result? Imagine a
corporation whose coalition increases by three members (about a one standard deviation).
The average firm allocates about four percent of its total benefits to private rewards to
senior officers and directors. Increasing the size of the winning coalition by three
members reduces these private payments from 4 percent to about 3 percent.9
8 The correlation between our third indicator of W, #Ext. Dir and #Off. Dir. is 0.82 (N = 2136). Specifying any two of the three indicators of W in the regression with Private Ratio as the dependent variable produces two negative coefficients and a highly significant result for the test that they are jointly negative.
9 There is also indirect evidence in the literature that corporate governance structures influence the relative value of private and public goods. Barclay and Holderness (1989, 1992) find that large blocks of shares trade at premium prices relative to smaller stock quantities. Presumably, only large stockholders have a realistic chance of future membership in the winning coalition. This evidence is reinforced by comparisons of shares that grant only dividend rights with those that also grant voting rights. Voting shares offer their owners the chance to enter the winning coalition, thereby gaining access to private goods, and they trade at higher prices (Lease, McConnell and Mikkelson 1983, 1984; DeAngelo and DeAngelo 1985; Zingales 1995). Although these differences
23
In addition to the two variables used to specify W, table 2 offers two models
based on different ways of estimating the impact of selectorate size.10 The first uses the
logarithm of total outstanding shares. In contrast the second model focuses on the lagged
logarithm of outstanding shares and also changes in the number of shares relative to the
previous year. We see later, when we explore additional measures of selectorate size, that
changes in the structure of company ownership can significantly influence corporate
actions. Neither of the selectorate indicators in models 1 and 2, nor alternative measures
reported later, alter the impact of coalition size on private goods allocations.
The second hypothesis draws attention to whether shareholder value is increasing
or decreasing over time. We examine the change in market capitalization as a function of
coalition size. The theory showed that as coalition size increases CEOs place a greater
emphasis on public rather than private goods (d(g*/x*)/dW<0). They also retain fewer
discretionary resources and expend more resources to provide rewards (d(R-m*)/dW<0).
Further, though not modeled here, BdM2S2 (2003) show that endogenously generated
resources increase as coalition size increases (dR/dW>0).11 The theory predicts that
corporate leaders who depend on a large coalition must be more attentive to overall
corporate performance than those who answer to a small coalition.
Probably the best indicator of overall corporate performance is the rate of growth
in market capitalization. To measure this growth we compare the logarithm of market
between voting and non-voting stock are typically small in the US, in the comparative context the difference can be much larger, 82% in Italy for example (Zingales 1994). 10 When we examine fraud we expand the number of ways of estimating selectorate size. For the sake of brevity we do not report all of the alternative indicators of S in table 2 as selectorate size is not the focus of the hypotheses. 11 Ryngaert (1988), Malatesta and Walkling (1988), DeAngelo and Rice (1983) and Jarrell and Poulsen (1988) show that such measures as poison pills to deter takeovers and supermajority rules that make replacing the management team more difficult reduce company value.

24
capitalization in year t with its value in the prior year. The inclusion of year fixed effects
in these regressions is particularly important to control for bull or bear market conditions.
We are interested in the marginal impact on growth associated with variation in coalition
size. Extant studies, Morck, Shleifer and Vishny (1988) for instance, have already
demonstrated a link between profitability and governance structure. However, the
literature is not unanimous in its conclusions. Yermack’s (1996) paper finds that
increasing board size reduces firm value, as measured by Tobin’s Q.12
Models 3 and 4, reported in table 2, show that coalition size is an important
independent determinant of growth in market capitalization. In fact, the substantive
impact of increasing the size of W by three members is to increase growth in market
capitalization by about 10 percent. Again the inclusion of different selectorate measures
does not materially alter the effect of the winning coalition’s size.
Thus far we have discussed growth in market capitalization and the proportionate
allocation of private goods. Firms can also reward shareholders with dividends. Models 5
and 6, shown in table 2, assess the effect of coalition size on dividends as a proportion of
dividends and market capitalization. The theory provides no guidance about how public
rewards are divided between dividends and monies reinvested to spur growth in market
capitalization. Coalition size does not materially influence dividends although, as we saw,
it influences growth. Tests on the combined value of dividends and market capitalization
show that increasing coalition size sharply increases the total value of public rewards.
12 Himmelberg, Hubbard and Palia’s (1999) reanalysis of Demsetz and Lehn’s (1985) study of the impact of management on firm value, as measured by Tobin’s Q, shows that the inclusion of fixed effects for each firm to model unexplained heterogeneity reduces the statistical impact of governance institutions on performance. We observe a similar result if we repeat our analyses with fixed effects. However, this result is unsurprising as our time series are generally short, on average 3.2 years, many companies experience little change in our measures of W.

25
b. Deviations from Expected Performance
When a company fails to perform up to expectation, CEOs have incentives to take
actions to protect their now-at-risk jobs. They can argue that the firm is the victim of
unforeseeable exogenous shocks for which they should not be held accountable. This
may not be adequate to protect them. Instead, they might misrepresent the corporation’s
true performance. This possibility highlights a crucial difference between dividends and
private compensation on the one hand and market capitalization on the other. Dividend
payments can only be made if the funds are available. Writing bad checks is unlikely to
save the CEO. Therefore, it is unlikely that large dividend payments are used to mask
problems. Similarly, the payment of salaries and other private benefits requires sufficient
cash on hand to meet obligations. Failing to meet these obligations reveals the company’s
problems and so fails to protect management. But it is difficult for outsiders to know the
true volume of sales, revenue, costs, and profits. Market capitalization reflects these
factors. Indeed, these are the factors that when falsely reported but subsequently detected,
result in accusations of accounting fraud.
If revenues are exaggerated or costs are understated, then senior executives can
temporarily lead the marketplace to misjudge the true worth of a company, making the
company appear falsely to have met or exceeded expectations. This, we believe, is the
essential motivation behind corporate fraud. We now test implications of these claims.
Figure 1 illustrates one way the theory can be used to predict fraud. The graph
plots the variable Private Ratio – private goods as a proportion of total compensation – on
the horizontal axis and the empirically predicted level of Private Ratio given each firm’s
26
governance structure (as estimated in model 1) on the vertical axis. The right-hand panel,
labeled “Fraudulent,” shows the graph for firms alleged to commit fraud in the current
year or either of the two subsequent years. The left-hand panel shows the same graph, but
for “Honest” firms, those against whom no allegations were made. The differences
between the figures are striking in two ways.
Focusing just on the horizontal axis, with few exceptions fraudulent firms actually
pay few private benefits. According to the theory this is a consequence of two features of
large coalition organizations. Such organizations are expected to produce more public
and fewer private benefits than are small coalition organizations. Additionally, executives
are at greater risk of losing their jobs in large coalition organizations if performance is
below expectations. Therefore, we expect that the firms that are most likely to commit
fraud also are likely to produce few private goods.
The horizontal axis is insufficient to assess whether differences in private goods
allocations can be attributed to the decision to commit fraud. The vertical axis, however,
completes the story. Focusing on the vertical axis, we see that fraudulent firms average
fewer private goods payments than are expected given their governance structure. This is
seen by observing the distribution of points above and below the 45◦ line. In the panel
displaying honest firms, firms fall equally on either side by construction. Recall that the
predicted values are based only on honest firms. The fraudulent firms could have been
distributed in any way relative to the 45◦ line. The theory anticipates that they will be
disproportionately above the line, indicating smaller actual payments (x-axis) than
predicted payments (y-axis). This is what the panel shows for fraudulent firms.
Controlling for coalition size, firms that commit fraud tend to produce fewer private

27
goods than expected. While these findings are consistent with the theoretical arguments,
we now move to more systematic tests of the story related by Figure 1.
Figure 1 About Here
Using models 1, 3, and 5 we calculate the expected level of private goods, growth
in market capitalization, and dividend payments as a proportion of public goods. For each
firm we record the difference between the observed level and the predicted value on each
of these variables. That residual amount tells us whether the specific firm in a given year
is over or underperforming relative to expectations given its governance structure. We
then compare these residual values for the set of firms that were subsequently alleged to
have committed fraud in the current year or either of the next two years to firms not
alleged to be involved in fraud in this period.
Two of the three residual values for each firm reflect quantities whose true value
is difficult to hide: private compensation rewards and dividend payments. Therefore, we
expect in these cases to observe residuals that reflect underperformance in the set of firms
alleged to have committed fraud. When it comes to comparing growth in market
capitalization, if we are correct that fraudulent firms lie in ways that inflate their value,
we should either see no statistical difference between those alleged to have committed
fraud and those who apparently report performance honestly or we should see that
fraudulent firms report especially large growth in market capitalization to compensate for
their under-delivery of private goods or dividends. Table 3 shows the comparisons.
Table 3 About Here
The evidence in table 3 supports the predictions. What is more, the table
emphasizes a result that casts doubt on accounts of venality as the primary cause of

28
fraud.13 Firms that will be accused of fraud for their financial reports in the current year
or the next two years provide fewer private benefits and fewer dividends than is expected
of firms with their governance characteristics. Senior executives are receiving less, not
more, than their counterparts in otherwise equivalent companies. However, in terms of
growth in market capitalization, these firms are indistinguishable from honest companies
with comparable governance arrangements.
Table 3 suggests that it is possible to tell the difference ex ante between firms
likely to commit fraud and those who are not. To test this implication more carefully, we
now turn to a strictly prospective dependent variable: Future Fraud. The data for the
independent variables are all observed in year t and so can be known before fraud has
occurred. Table 4 examines the likelihood of Future Fraud as a function of the degree to
which a firm deviates from expected performance and as a function of the size of the
winning coalition and the selectorate. The theory indicates that payment of dividends and
private goods below expectation and growth in market capitalization equal to or above
expectation heighten the risk of fraud. Furthermore, the marginal effect of large coalition
size beyond its impact on private and public goods allocations is to put failed executives
at risk. Therefore, executives in corporations that depend on a large coalition are more
likely to misstate financial reports.
Table 4 About Here
The results are consistent with expectations. While supportive of the theory, the
specification in table 4 is not optimal as it imposes significant artificial constraints on
13 That is not to say that fraud is never motivated by personal greed among managers. The case of Tyco, for example, is otherwise difficult to explain. However, as the New Yorker (February 17, 2003. “SPEND! SPEND! SPEND!” p. 132) concludes, Tyco’s fraud is qualitatively different from accounting frauds such as Enron’s and Worldcom’s.

29
how we estimate the impact of governance structure on the risk of fraud. We shift now to
a fuller specification of the model and its implications for predicting fraud.
Section V Predicting Fraud: In Sample and Out of Sample Tests
The selectorate model indicates that W, S, g, and x shape the risk of fraud, with g
and x being partially dependent on W. Now we propose a statistical specification that
includes indicators of all four elements in an attempt to provide ex ante estimates of the
risk of fraud one or two years into the future. After demonstrating the general fit between
the model and fraud in all cases, we divide the data into two samples. Specifically, we
estimate the model on all observations between 1989 and 1996 and use these estimates to
predict the likelihood of fraud in each company-year for the period after 1996. For
presentational convenience we place our predictions in five risk categories, ranging from
lowest (0) to highest (4) estimated probability of fraud. The category breakpoints are
determined by assigning 70 percent of in-sample firm years to the lowest risk category;
15 percent to the second lowest risk group; 7.5 percent to the middle group; 5 percent and
2.5 percent to the two highest risk categories.14
We estimate a logit model with Future Fraud as the dependent variable. The
independent variables are DIV/Public, Private Ratio, Perqs, Ex. Dir. Cash,
(Ex.Dir.Cash)2, #Ex. Dir, Inst. Owner, Ln(shares), Big Owner, (Big Owner)2,
Concentration, Concentration2, #OfficersDirectors, #StockOfficers, Stk. Opt. Int.
14 Dividing the predicted values from the logit into quintiles yields comparable results, with observed fraud increasing significantly from quintile to quintile.
30
Directors, and Stk. Opts. Executives. Growth in market capitalization is not included to
preserve observations.15
a. Full Sample Estimates
Model 8, the full sample logit analysis, is consistent with expectations for each
variable as seen in table 5. Its reliability is seen most clearly by looking at table 6 which
shows the ex ante fraud risk and the incidence of fraud in the following two years. The
table shows that the theory successfully discriminates between firms at risk and those that
are not. Of firms predicted to be at greatest risk, 74 percent committed fraud within one
of the following two years. Approximately 40% of all frauds fall within the highest two
categories of risk. Yet only 7.5 percent of firm-years occur in these categories. The model
not only predicts fraud successfully, but also successfully predicts honesty. Of 971 firm-
years with the lowest risk of fraud only 3.4% are subsequently accused of fraud. Such
strong results may be the product of over-fitting the model to the data. To test the
genuine predictive power of the model we repeat the analyses using only information on
firms prior to 1997. These estimates are also reported in table 5, and labeled as “Model 9:
Out-of-Sample” We use these estimates to predict the pattern in subsequent years.
Tables 5 and 6 About Here
b. Out-of-Sample Estimates
Table 7 reports the risk of and the incidence of fraud by company year, paralleling
table 6, but now only for out-of-sample observations. Of out-of-sample cases that fall
15 Including growth in market capitalization leads to results consistent with expectations but greatly reduces the total number of observations because it requires knowledge of data for the previous year in addition to the current year.
31
within the highest risk category, 85 percent subsequently committed fraud. Almost 60
percent of all out-of-sample frauds fall into the two highest risk categories. Likewise, the
model successfully identifies honest firms. Fewer than 2.5 percent of firms in the lowest
risk category subsequently were accused of fraud. The model apparently discriminates
between honest and fraudulent firms. A statistic for summarizing that ability to
discriminate is the Receiver Operator Characteristic (ROC) that estimates the ratio of
signal to noise. A score of 0.50 indicates no discrimination. A score of 1.00 reflects
perfect discrimination. The ROC score for the out-of-sample test is 0.88, supporting
statistically what is evident from looking at table 7.16
c. Illustration of Performance on Specific Firms
The statistical findings encourage the belief that the selectorate theory provides a
reliable tool for anticipating variations in corporate conduct and, in particular, the
likelihood of fraudulent reporting. Table 8 provides a list of the ten largest companies
accused of fraud during the time period for which we have data. This list includes many
of the most notorious instances, including Enron, Waste Management, Rite Aid, and
16 We conducted additional out-of-sample tests in which we randomly assigned
approximately half the firms to be in-sample and the remaining firms to be out-of-sample.
We then estimated the model in table 5 based on the firms that were in-sample and used
these estimates to predict the out-of-sample firms. We repeated this experiment 1,000
times. This is a far more demanding, less realistic, and less practically useful test than
that reported in the text. The average ROC for the out-of-sample prediction was 0.785,
with a standard deviation of 0.039.
32
others. The table shows the year-by-year prediction of the risk of fraud for each of these
companies, with all predictions after 1996 being strictly out-of-sample. The out-of-
sample results are shaded to draw attention to them. Cells for years in which fraud
allegedly occurred contain an F as well as the predicted score. Of course, it is the score in
either of the two years before fraud that are of greatest interest as these are the ex ante
predictions for the period when fraud allegedly occurred. Cells that contain “ND”
indicate that missing data precluded estimating a risk score for that company year.
Companies are listed in alphabetical order.
Table 8 About Here
The companies listed in Table 8 have been accused of 25 instances of securities
frauds during the period covered. Thirteen of these allegedly happened between 1997 and
1999, our out-of-sample period. Three more frauds for these companies, involving Cisco
Systems, Xerox, and Enron, are alleged to have occurred in the year 2000. Thus, the out-
of-sample predicted period includes 16 cases plus any allegations for these companies. Of
these 16 largest, most notorious frauds involving massive numbers of shareholders and
firms with extremely large market capitalization, 13 had a score of 4 at least one year in
advance and all 16 had scores of 3 or 4 at least one year in advance. Eight provided 2
years of advance warning in the highest risk category.
The table also shows that during periods when these firms were not engaged in
fraud, their scores often reflect their good behavior. The estimates for Xerox, for
instance, between 1991 and 1994 suggest a very low risk company. Xerox was not
accused of fraud for any of its reporting prior to 1998. The model shows that Xerox was
slipping in its anticipated behavior, with scores of 2 in 1995 and 1996. Thus the model

33
finds reason for growing, though still moderate concern about Xerox well before the
markets suspected misconduct. A similar pattern of low risk behavior is reflected in the
record for Rite Aid, with its risk jumping from 0 in 1993 to 2, then 3, then 4, the highest
category, in 1996. Several years later, Rite Aid was accused of having committed fraud in
1998 and 1999. These illustrative cases suggest that the prudent use of the selectorate
model could make a significant difference in identifying fraud risks.
Section VI Conclusion
The selectorate theory was used to derive hypotheses about how corporate
governance institutions influence corporate actions. We showed that the theory provides
an explanation for the amount paid in dividends and in salaries to senior management
during years of honest reporting and years immediately preceding fraudulent reporting. In
the latter years, senior management receive less compensation than expected given their
corporate governance structure, but reported performance and, therefore, the firm’s
growth in market capitalization looks as expected given honest reporting. This wedge
between lower than expected dividends and compensation for executives and normal
growth in market capitalization is an early warning indicator of an elevated risk of fraud.
Our model contributes to the literature on strategic accounting (Caplan 1999; Morton
1993; Shibano 1990) by identifying governance structures and reported performance
statements that are consistent with strategic CEOs’ attempts to protect their jobs.
We tested the theory’s potential to predict fraud in advance. Our out-of-sample
tests indicate that the model significantly reduces uncertainty about which firms are likely
to commit fraud and which are likely to report their performance honestly. The signal to
34
noise ratio in the out-of-sample test is 0.88 with more than 80 percent of company-years
in the highest risk category involving subsequent allegations of fraud.
Our results call into question accounts in which greedy executives act to enrich
themselves at the expense of shareholders. Rather, the theory and the evidence support
the idea that fraud is more often committed to protect shareholder value, not out of
altruism, but to protect the jobs of a firm’s senior executives. At the same time, the
results highlight features of corporate governance structure and the appropriate balance
between compensation and that structure that is most likely to reduce the risk of fraud.

35
References
Aggarwal, Rajesh K., Andrew A. Samwick. 1999. The Other Side of the Trade-off: The Impact of Risk on Executive Compensation. Journal of Political Economy 107(1):65-105. Alexander, Cindy R. and Mark A. Cohen. 1996. New Evidence on the Origins of Corporate Crime. Managerial and Decision Economics 17: 421-435. Baker, H. Kent, and Patricia L. Gallagher. 1980. Management’s View of Stock Splits. Financial Management 9: 73-77. Barker, C. Austin. 1956. Effective Stock Splits. Harvard Business Review 34: 101-106. Barclay, Michael, and Clifford Holderness, 1989, Private benefits from control of public corporations, Journal of Financial Economics 25, 371-395. Barclay, Michael, and Clifford Holderness, 1992, The law and large-block trades, The Journal of Law and Economics 35, 265-294. Baucus, Melissa S. and Janet P. Near. 1991. Can Illegal Corporate Behavior Be Predicted? An Event History Analysis. The Academy of Management Journal 34(1): 9-36. Baumol, William, 1959, Business Behavior, Value and Growth (Macmillan, New York). Berle, Adolf, and Gardiner Means, 1932, The Modern Corporation and Private Property (Macmillan, New York). Bueno de Mesquita, Bruce, Alastair Smith, Randolph M. Siverson and James D. Morrow. 2003. The Logic of Political Survival. Cambridge MA: The MIT Press. Bueno de Mesquita, Bruce, James D. Morrow, Randolph M. Siverson and Alastair Smith. 2002. Political Institutions, Policy Choice and the Survival of Leaders.” British Journal of Political Science 32: 559-590. Bueno de Mesquita, Bruce, James D. Morrow, Randolph M. Siverson and Alastair Smith. 1999. “An Institutional Explanation of the Democratic Peace.” American Political Science Review 93: 791-807. Caplan, Dennis. 1999. “Internal Controls and the Detection of Management Fraud.” Journal of Accounting Research 37(1): 101-117. Caplow, Theodore. 1968. Two against one: coalitions in triads. Englewood Cliffs, NJ: Prentice Hall. Coase, Ronald, 1937, The nature of the firm, Economica 4, 386-405.

36
DeAngelo, Harry, and Linda DeAngelo, 1985, Managerial ownership of voting rights, Journal of Financial Economics 14, 33-69. DeAngelo, Harry, and Edward Rice, 1983, Antitakeover amendments and stockholder wealth, Journal of Financial Economics II, 329-360. Demsetz, H., and K. Lehn. 1985. The structure of corporate ownership: causes and consequences. Journal of Political Economy 93, 1155-1177. Denis, David J., Diane K. Denis, & Atulya Sarin. 1997. Ownership Structure and Top Executive Turnover. Journal of Financial Economics, 45, 193-221. Dolley, James C. 1933. Common Stock Split-ups, Motives and Effects. Harvard Business Review 12: 70-81. Grinblatt, M., R. Masulis and S. Titman. 1984. The Valuation Effects Stock Splits and Stock Dividends. Journal of Financial Economics 13: 461-490. Grossman, Sanford, and Oliver Hart, 1988, One share-one vote and the market for corporate control, Journal of Financial Economics 20, 175-202. Hansen, J. V., J. B. McDonald, W. F. Messier, Jr., and T. B. Bell. 1996. A Generalized Qualitative-Response Model and the Analysis of Management Fraud. Management Science 42(7): 1022-1032. Hermalin, Benjamin E. and Michael S. Weisbach. 1988. The determinants of board composition. RAND Journal of Economics 19(4): 589-606. Hermalin, Benjamin E. and Michael S. Weisbach. 1998. Endogenously Chosen Boards of Directors and Their Monitoring of the CEO. The American Economic Review 88(1): 96-118. Himmelberg, Charles P., R. Glenn Hubbard, and Darius Palia. 1999. Understanding the determinants of managerial ownership and the link between ownership and performance. Journal of Financial Economics 53(1999): 353-384. Holmstrom, Bengt. 1999. Managerial Incentive Problems: A Dynamic Perspective. Review of Economic Studies. 66(1): 169-182. Fama, Eugene, 1980, Agency problems and the theory of the firm, Journal of Political Economy 88: 288-307. Fama, Eugene, and Michael Jensen, 1983a, Separation of ownership and control, Journal of Law and Economics 26, 301-325. Fama, Eugene, and Michael Jensen, 1983b, Agency problems and residuals claims, Journal of Law, and Economics 26, 327-349.

37
Jarrell, Gregg, and Annette Poulsen, 1988, Shark repellents and stock prices: The effects of anti takeover amendments since 1980, Journal of Financial Economics 19, 127-168. Jensen, Michael, 1993, The modern industrial revolution, exit, and the failure of internal control systems, Journal of Finance 48, 831-880. Jensen, Michael, and William Meckling, 1976, Theory of the firm: Managerial behavior, agency costs, and ownership structure, Journal of Financial Economics 3, 305-360. Jensen, Michael, and Richard Ruback, 1983, The market for corporate control: The scientific evidence, Journal of Financial Economics 11,5-50. Lakonishok, Josef and Baruch Lev. 1987. Stock Splits and Stock Dividends: Why, Who and When. Journal of Finance 42: 913-932. Lease, Ronald, John McConnell, and Wayne Mikkelson, 1983, The market value of control in publicly traded corporations, Journal of Financial Economics 11, 439-471. Lease, Ronald, John McConnell, and Wayne Mikkelson, 1984, The market value of differential voting rights in closely held corporations, Journal of Business 57, 443-467 Malatesta, Paul, and Ralph Walkling, 1988, Poison Pill Securities: Stockholder Wealth, Profitability, and Ownership Structure, Journal of Financial Economics 20, 347-376. Marris, Robin, 1964, The Economic Theory of Managerial Capitalism (Free Press of Glencoe, Illinois). Martin, Kenneth, and John McConnell, 1991, Corporate performance, corporate takeovers, and management turnover, Journal of Finance 46, 671-688.
McConnell, John, and Henri Servaes, 1990, Additional evidence on equity ownership and corporate value, Journal of Financial Economics 27, 595-612. McNichols, M. and A. Dravid. 1990. Stock Dividends, Stock Splits, and Signaling. Journal of Finance 45: 857-879. Morck, Randall, Andrei Shleifer, and Robert Vishny, 1988, Management ownership and market valuation: An empirical analysis, Journal of Financial Economics 20, 293-315. Morton, Sanford. 1993. Strategic Auditing for Fraud. Accounting Review. 68(4): 825-839. Peterson, Craig A., James A. Millar and James N. Rimbey. 1996. The Economic Consequences of Accounting for Stock Splits and Large Stock Dividends. The Accounting Review 71(2): 241-253. Roper Center. 2002. Harris Interactive poll. USHARRIS.072502, R2A. July 30, 2002. Ryngaert, Michael, 1988, The effect of poison pill securities on shareholder wealth, Journal of Financial Economics 20, 377-417. Shibano, Toshiyuki. 1990. Assessing Audit Risk from Errors and Irregularities. Journal of Accounting Research. 28: 110-140.

38
Shleifer, Andrei, and Robert Vishny, 1986, Large shareholders and corporate control, Journal of Political Economy 94, 461-488. Shleifer, Andrei, and Robert W. Vishny. 1997. A Survey of Corporate Governance. Journal of Finance LII (2): 737-783. Stulz, Rene, 1988, Managerial control of voting rights, Journal of Financial Economics 20, 25-59. Warner, Jerold, Ron Watts, and Karen Wruck, 1988, Stock prices and top management changes, Journal of Financial Economics 20, 461-492. Weisbach, Michael I. 1988. Outside Directors and CEO Turnover. Journal of Financial Economics 20 (1988) 431-460. Williamson, Oliver, 1964, The Economics of Discretionary Behavior: Managerial Objectives in a Theory of the Firm (Prentice Hall, Englewood Cliffs, N.J.). Wruck, Karen, 1989, Equity ownership concentration and firm value, Journal of Financial Economics 23, 3-28. Yermack, David, 1997, Good timing: CEO stock option awards and company news announcements, Journal of Finance 52, 449-476. Yermack, David. 1996. Higher market valuation of companies with a small board of directors. Journal of Financial Economics 40 (1996) 185-211 Zingales, Luigi, 1994, The value of the voting right: A study of the Milan stock exchange experience, The Review of Financial Studies 7, 125-148.

39
Table 1: Summary Statistics (based on the 1,395 observations reported in Model 8) Variable Mean Standard Deviation Minimum Maximum Future Fraud 0.101 0.302 0 1 Perqs 0.758 5.806 0 186.364 DIV/Public 0.0012 0.0042 0 0.115 Private Ratio 0.037 0.068 0 0.761 Ext. Dir. Cash 0.068 0.121 0 1.200 #Ext. Dir 5.9441 3.2169 0 24 Owner 0.077 0.130 0.0008 1.01 Ln(share) 16.262 1.532 9.440 21.281 Big Owner 0.0055 0.0064 0 0.159 Concentration 0.151 0.155 0 0.882 #OfficersDirectors 12.527 4.332 2 31 #Stock Officers 2.579 2.721 0 25 Stk. Opt. Int. Directors 0.169 1.382 0 34 Stk. Opt. Executives 0.2104 1.096 0 28.642

40
Table 2: Governance Structures and the Performance of Firms. Regression analysis with fixed effect year dummies performed only on those firm not alleged to be fraudulent in the current year or two years into the future. Model 1 Model 2 Model 3 Model 4 Model 5 Model 6
Fixed-effect year dummies. Private Ratio Private Ratio Ln(MarketCap.) Ln(MarketCap.) DIV/Public (*1000)
DIV/Public (*1000)
#OfficerDirectors -0.00064 (0.0005)
-0.00074 (0.00066)
0.017* (0.007)
0.013* (0.007)
.086** (0.035)
.061 (.052)
#StockOfficers -0.00222** (0.00077)
-0.0028** (0.0010)
0.018* (0.010)
0.014 (0.010)
-.030 (.055)
-.047 (.083)
Ln(share) -0.015** (0.001)
0.069** (0.024)
-.010 (.100)
Ln(share)t-1 -0.0139** (0.0018)
0.022 (0.025)
.062 (.144)
%age Change in shares -0.042** (0.012)
1.004** (0.124)
.408 (.956)
Ln(MarketCap.)t-1 0.934** (0.020)
0.960** (0.020)
Constant 0.299** (0.021)
0.285** (0.027)
-0.172 (0.269)
0.117 (0.267)
0.464 (1.463)
-.245 (2.110)
Observations 1559 1057 1063 1061 1561 1057
Joint hypothesis test: #OfficerDirectors=0 and #StockOfficers=0
F(2,1545) = 6.62, p=0.0014
F(2,1044)= 5.25, p = 0.0054
F(2,1050)= 5.12, p = 0.0061
F(2,1047) = 3.08, p = 0.0462
F(2,1547) = 2.99, p= 0.0507
F(2,1044) = 0.73, p = 0.4834
** p<.01, * p<.05, one tailed tests. Standard errors in parentheses.

41
Table 3: Differences Between Actual and Expected Provisions of Private Goods, Dividends and Growth in Market Capitalization. Comparison Between Fraudulent Firms (those accused of fraud in the current year or subsequent two years) and Honest Firms.
Private Goods: Private Ratio: Actual-Predicted
Dividends: DIV/Public Actual-Predicted
Growth in Market Capitalization: Ln(Mar. Cap.) Actual-Predicted
Honest Firms Mean = 0 Std.dev.= .071
Mean = 0 Std.dev. = .005
Mean = 0 Std.dev. =.771
Fraudulent Firms Mean = -.0079 Std.dev. = .028
Mean= -.0008 Std.dev. =.0015
Mean = .096 Std.dev. =.810
Hypothesis Test T-test
T = 2.93 p<.004
T=4.86 p < .000
T = 1.37 p < 0.17
Table 4: Logit Analysis of the Future Fraud Based Upon Deviations From Expected Performance and Governance Structure. The residual variables represent difference between actual values and values predicted by models 1, 3 and 5. Dependent Variable: Future Fraud. (Fraud alleged in either subsequent year)
Model 7 Future Fraud
Private Ratio Residuals -28.524** (10.542)
Div/Public Residuals -433.955** (124.536)
Ln(MarketCap.) Residuals 0.402* (0.188)
#OfficerDirectors -0.026 (-0.033)
#StockOfficers 0.155** (0.048)
Ln(shares) 0.815** (0.145)
Constant -16.672** (2.605)
Observations 921 LogLikelihood -262.488
** p<.01, * p<.05, one tailed tests. Standard errors in parentheses.

42
Table 5: Logit Analysis of Future Fraud: Full Sample and Out-of-Sample Estimates Dependent Variable: Future Fraud. (Fraud alleged in either subsequent year)
Model 8 Full Sample: All years
Model 9 Out-of-Sample: Only years prior to 1997
DIV/Public -0.185* (0.089)
-0.176* (0.094)
Private Ratio -24.185** (7.367)
-22.527** (7.874)
Perqs 0.202** (0.048)
0.139** (0.055)
Ex.Dir.Cash -8.637** (2.473)
-8.631** (2.760)
(Ex.Dir.Cash)2 12.735** (4.365)
13.019** (4.908)
#Ex.Dir -0.186** (0.064)
-0.161* (0.069)
Inst.Owner -2.748* (1.335)
-2.246 (1.368)
Ln(shares) 0.686** (0.115)
0.665** (0.125)
Big Owner 89.406 (54.92)
90.663 (60.056)
(Big Owner)2 -1,799.85 (1,354.07)
-1,848.84 (1,562.48)
Concentration 7.314** (2.267)
7.626** (2.629)
Concentration2 -11.008 (4.576)*
-13.465** (5.738)
#OfficerDirectors
0.088* (0.044)
0.062 (0.047)
#StockOfficers 0.075* (0.040)
0.087 (0.041)*
Stk.Opt.Directors
-1.395 (0.359)**
-1.649 (0.820)*
Stk.Opt.Executives 0.555 (0.307)
0.818 (0.526)
Constant -13.975** (2.010)
-13.409 (2.165)**
Observations 1395 1140 Log(likelihood) -342.05 -285.48
** p<.01, * p<.05, one tailed tests. Standard errors in parentheses.

43
Table 6: Fraud Risk Predictions Based Upon Full Sample Logit Estimates (Model 8) Future Fraud measures whether fraud was alleged to have occurred in either of the subsequent years. Figures in parentheses are column percentages. Future Fraud: NO Future Fraud: YES Total Number of
Firm-Years Lowest Risk (0) 938
(96.6%) 33
(3.4%) 971
Low Risk (1) 184 (87.6%)
26 (12.4%)
210
Moderate Risk (2) 80 (74.8%)
27 (25.2%)
107
High Risk (3) 42 (61.8%)
26 (38.4%)
68
Highest Risk (4) 10 (25.6
29 (74.4%)
39
Total Number of Firm-Years
1,254 141 1,395
Chi2(4) = 312.65, Pr = 0.000 Table 7: Out-of-Sample Fraud Risk Predictions Based Upon Pre-1997 Firm-Year Logit Estimates (Model 9) Future Fraud measures whether fraud was alleged to have occurred in either of the subsequent years. Figures in parentheses are column percentages. Future Fraud: NO Future Fraud: YES Total Number of
Firm-Years Lowest Risk (0) 159
(97.6%) 4
(2.4) 163
Low Risk (1) 40 (87.0%)
6 (13.0%)
46
Moderate Risk (2) 14 (87.5%)
2 (12.5%)
16
High Risk (3) 11 (64.7%)
6 (35.3%)
17
Highest Risk (4) 2 (15.4%)
11 (84.6%)
13
Total Number of Firm-Years
226 29 255
Chi2(4) = 91.85, Pr = 0.000 Receiver-Operator-Characteristic = 0.88

44
Table 8: Predictions for Recent, Notorious Cases of Alleged Fraud. (F = Fraud Alleged; 0 = Lowest Fraud Risk; 1 = Low Fraud Risk; 2 = Moderate Fraud Risk; 3 = High Fraud Risk; 4 = Highest Fraud Risk; ND = No Data)
Company 1991 1992 1993 1994 1995 1996 1997 1998 1999
Bank of America ND ND 0 4 1 4 4 0 F 0
Boston Scientific ND ND 3 3 3 3 4 F F ND
Cendant ND 1 4 3 ND 3 F 0 F 0 0
Cisco ND ND ND 3 ND 3 ND 3 F
Enron 1 0 3 1 2 3 4 4 F 4 F
Informix 0 3 3 3 F 4 F 4 F 2 F ND 4
Medaphis 1 1 2 3 F 4 F 4 F 3 F 1 ND
Rite Aid 1 1 0 2 3 4 3 4 F 2 F
Waste Management 4 4 F 4 F 3 F 2 F 4 F 4 F 1 0
Xerox 0 0 0 0 2 2 4 4 F 4 F

45
Figure 1: Private Goods Provision in Honest and Fraudulent Firms.
-.10
.1.2
0 .5 1 0 .5 1
Honest FraudulentP
redi
cte
d P
riva
te R
atio
Ratio of priv ate goods to all compensationGraphs by Fraud in current or next two years

46
Appendix: Description and Construction of Variables Identifying or sorting Variables:
Company name; Ticker; Date of the Report; Net income per share; Shares outstanding
(Shares) =Total company shares actually in the market place. (This does not include
shares that have been issued, but reserved for such things as options or future sale.) Share
price on last day of reported period; Fraudyn = 1 if fraud alleged for the given year, 0 if
fraud was not alleged for the given year.
Variables related to external directors:
Number of external directors (#Ext. Dir) = Number of directors who are not officers or
employees of the company. Being “Secretary” of the board of directors does not
constitute being an employee.
Cash compensation (Ext. Dir. Cash) = Fee per board meeting * number of board meetings
in year t.
Ext. director stock options (Ext. Dir. Stock) =Total number of stock options given, if any,
to the outside directors in the year.
Other compensation (Ext. Dir. Other) = All other compensation (exclusive of SARs), if
any, paid to the outside directors as a group. This may include payment for
committee participation, insurance benefits, onetime cash payment for joining the
board, etc.
Variables related to internal directors:
Number of internal directors (#Int. Dir)
Aggregate salary of internal directors (Int. Dir. Cash)

47
Int. director stock options (Int. Dir. Stock) =Total stock options given in the year to all
internal directors, if any.
Other compensation (Ext. Dir. Other) =All other compensation (exclusive of SARs), if
any, paid to the internal directors as a group.
Variables related to management/executive officers:
Top five salary (Top5Sal)= Aggregate salary of the top five (5) employees (or fewer if
the company does not have five employees).
Top five % of common shares owned (T5%Stock) = Aggregate number of shares owned
by the top five executives divided by the total number of shares outstanding.
Top five stock options (T5Stock) =Aggregate number of stock options given in the year
to the top five executives.
Top five other compensation (T5Other) = Aggregate amount of other compensation
received by the top five executives.
Number of officers listed (#Officers) =Total number of all officers of the company listed
in 10K.
All officers stock options (Off%Stock) =Total number of stock options given, if any, to
all officers in the year.
Number of officers receiving stock options (#Stock Off.) =Total number of identified
officers who received stock options during the year
Variables related to distribution of common stock:

48
Number of individuals or firms listed by name as owning 1 % or more of common stock
(NumInd1)
Percentage of shares owned by all officers and directors (Off. Dir. %)
Percentage of shares listed as owned by institutional investors (Inst. %)
Percentage owned by the largest common stockholder (Big Stock %)
Constructed Variables based on directly collected variables described above:
Future Fraud = Fraudyn(t+1) = 1 or Fraudyn(t+2) = 1, then Future Fraud = 1; If
Fraudyn(t+1) = 0 and Fraudyn(t+2) = 0 then Future Fraud = 0
Perqs= Ext. Dir. Other + Int. Dir. Other+ T5Other
Total Dividends = Dividend per share * Shares
Public = Total Dividends + Market Capitalization
Private = Ext. Dir. Cash + Int. Dir Cash + Top5Sal + Ext. Dir Other + Int. Dir Other +
T5Other
Private Ratio = Private/(Public + Private)
Ln(share)= Ln(Shares outstanding)
Street = 100-(Inst. % + Off. Dir. %)
Big Owner = ((Big Stock %)/(100* Street))/100
Concentration = (((#Stock Off. * Off. Dir % /(1+#Stock Off. * 100))2) + (NumInd1 *
(Inst. %/(100 *NumInd1 + 1))2)))1/2
Inst. Owner = ((Inst % + 1)/100)/(NumInd1 + 1)