the transport sector as a source of air...
TRANSCRIPT
THE TRANSPORT SECTOR AS A SOURCE OF AIR POLLUTION
Millennium Review for submission to Atmospheric Environment R N Colvile, E J Hutchinson, J S Mindell*, R A Warren
T H Huxley School, Imperial College, London SW7 2BP, UK. *Department of Epidemiology and Public Health, Imperial College, London W2 1PG, UK.
Abstract
Transport first became a significant source of air pollution after the problems of sooty smog from coal combustion had largely been solved in western European and North American cities. Since then, emissions from road, air, rail and water transport have been partly responsible for acid deposition, stratospheric ozone depletion and climate change. Most recently, road traffic exhaust emissions have been the cause of much concern about the effects of urban air quality on human health and tropospheric ozone production. This article considers the variety of transport impacts on the atmospheric environment by reviewing three examples: urban road traffic and human health, aircraft emissions and global atmospheric change, and the contribution of sulphur emissions from ships to acid deposition. Each example has associated with it a different level of uncertainty, such that a variety of policy responses to the problems are appropriate, from adaptation through precautionary emissions abatement to cost-benefit analysis and optimised abatement. There is some evidence that the current concern over the transport contribution to urban air quality is justified, but aircraft emissions should also give cause for concern given that air traffic is projected to continue to increase. Emissions from road traffic are being reduced substantially by the introduction of technology especially three-way catalysts and also, most recently, by local traffic reduction measures especially in western European cities. In developing countries and Eastern Europe, however, there remains the possibility of great increase in car ownership and use, and it remains to be seen whether these countries will adopt measures now to prevent transport-related air pollution problems becoming severe later in the 21st century.
Key words: Vehicle emissions, Aerosol urban, Health impact, Ship emissions, Aircraft emissions
1 Introduction
Transport is widely recognised to be a significant and increasing source of air pollution world wide. Several previous reviews have focused on individual modes of transport and/or single environmental impacts of transport. For example, OECD (1988) briefly considers regional and global impacts of transport emissions of air pollution, but is mostly concerned with the impact of emissions on local urban air quality, and considers only road transport. The Third International Symposium on Transport and Air Pollution (Joumard, 1996) also has an emphasis on road traffic and urban air quality, but the Special Edition of Science of the Total Environment presenting highlights of the symposium also includes a few papers covering air and sea transport. Joumard comments on the value of the contributions from developing countries including Africa and Latin America; a review of road transport emissions and their impact on the environment at all scales from local to global was also published a couple of years earlier by Faiz (1993). One of the most comprehensive recent reviews of the environmental impacts of transport is that of the Royal Commission on Environmental Pollution (Houghton, 1994). This report includes a section on air transport, and the treatment of surface transport includes freight as well as passenger, rail as well as road. Shipping is mentioned briefly by reference to other work, especially Donaldson (1994). Urban air quality and global climate change are identified as major issues, but regional air quality, acidification, noise and impacts other than air pollution emissions are also considered. There is an emphasis on assessing possible solutions to environmental problems caused by transport, concluding with an exhaustive list of recommendations; these are for the UK, but the perspective is international. An update three years later (Houghton, 1997) has a narrower scope, restricting itself to inland surface transport, motivated by a concern that there was still too little action to limit the environmental impact of road traffic despite much debate on the subject having been stimulated. Most recently, the Intergovernmental Panel on Climate Change (Penner et al., 1999) has published a major report focusing on air transport and the global environment, in contrast to the emphasis on road transport in much of the earlier literature.
In addition to these reviews, a number of papers attempting to quantify the environmental cost of transport necessarily include a concise review of the subject, but since preparation of a complete impact valuation is a huge interdisciplinary task it is more common to consider road transport alone even if an attempt is made to quantify all its impacts. We will not attempt a survey of this area of economics here, although one example (Eyre et al., 1997), will be cited later as an example where the authors include a greater than usual emphasis on atmospheric science.
In this Millennium Review, we aim to provide a new, distinctive account of transport as a source of air pollution. The emphasis will be on the science of air pollution and recent developments in aspects of the assessment of urban air quality, regional atmospheric chemistry and global atmospheric change that are of relevance to transport. It is impossible to carry out an exhaustive review of the whole of this subject within a single journal article, so individual case studies will be presented, each case considering the contribution of a single mode of transport to one aspect of air pollution. These are selected to illustrate the range of issues that are of concern as we enter the 21st century. We will restrict ourselves to gaseous and particulate emissions, whilst not forgetting that noise is also a major pollutant emitted by transport into the atmosphere. However, some of our conclusions will be relevant to noise as well as chemical pollutants, as some types of emissions abatement measures will deliver additional benefit through noise reduction.
In the late 1990s, as reflected in the selection of previous reviews summarised above, the impact of road transport on urban air quality has had a very high profile in many countries. In the space of a couple of decades around the turn of the millennium, the global introduction of three-way catalytic converters fitted to every new petrol (gasoline)-engined car,
Colvile et al., 2000. The transport sector as a polluter
2
soon to be followed by similar developments in diesel emissions control, is arguably the biggest exercise ever carried out in the application of end-of-pipe technology for the abatement of air pollution emissions from any type of source, certainly if the scale of the exercise is measured in terms of the number of individual people affected world-wide. Nearly every family in the industrialised countries is already involved and increasing numbers of people in developing countries and the former Soviet Bloc are following, as the motor car is one of the great icons of 20th century capitalism. In this review, we will ask the question, is the impact of road traffic emissions on urban air quality really currently the biggest issue concerning transport emissions of air pollution, and is it likely to remain so beyond the first few years of the 21st century? We will see that the extent to which we understand the relevant atmospheric science is different for each single impact of individual modes of transport that we will consider. Since it is very difficult to assess the relative severity of disparate impacts of air pollution emissions, this variability in the completeness of our understanding of the science is also having an impact on how different modes of transport are becoming subject to legislation, economic incentives to control emissions, and voluntary action to protect the environment.
The review starts with a summary of air pollution emissions from transport, by presenting an overview of how emissions inventories are compiled and used (section 2), with particular emphasis on road traffic emissions. This is followed by a brief survey of the impacts of these emissions on the environment and society, presented chronologically to indicate that concern for the environmental impact of transport has evolved over the past three decades (section 3). The three selected examples of impacts of air pollution emissions from individual transport sectors are presented in section 4, from which it is possible to see how some of the lessons learnt in trying to control emissions from road transport might be applied to other modes in future, and vice versa. The review concludes with a discussion of whether the current preoccupation with road transport and urban air quality is likely to be long lasting given the magnitude of the impact and the level of uncertainty in our ability to quantify it, from which recommendations for further work to support future sustainable integrated transport systems are drawn.
2 Overview of transport contribution to emissions
2.1. Air pollutants emitted by transport sources
With a few exceptions, all modes of transport emit air pollution from the combustion of liquid fossil fuel. Most transport sources today therefore emit similar pollutants, although the relative abundance of these varies depending on the exact composition of the fuel and details of the combustion conditions.
The most significant transport emissions to the atmosphere by mass are carbon dioxide (CO2) and water vapour (H2O) from the complete combustion of the fuel. Some transport power sources achieve almost complete combustion by ensuring there is plenty of excess air, as in a diesel engine or a lean-burn petrol engine. A feature that distinguishes other mobile combustion sources from almost all stationary sources, however, is that combustion is incomplete, and a small fraction of the fuel is oxidised only to carbon monoxide (CO) with some volatile hydrocarbons also emitted as vapour in the exhaust and carbonaceous particles from incompletely burnt fuel droplets. The particles from a modern diesel engine, after modification by coagulation and other processes that occur in the first few seconds after emission, have a bimodal size spectrum with a large number of particles below 20 nm in size and another mode between about 30 and 100 nm (Shi, Harrison and Brear, 1999), with approximately equal total mass in each mode.
In addition to the mixture of hydrocarbons, all fuels contain some impurities (with the possible exception of hydrogen obtained from a fuel cell, and the lightest hydrocarbon fuels such as methane which are available with very low levels of impurities). Sulphur is oxidised mostly to sulphur dioxide (SO2) on combustion, and sometimes to sulphate which can assist in the nucleation of particles in the exhaust. Several other impurities such as vanadium in oil do not burn or have combustion products that have a low vapour pressure and so contribute further to particle formation. The organic lead compounds that are still added to high octane petrol only in parts of Africa and Asia, to prevent premature combustion, also form particles in the exhaust. Finally, at the high combustion temperatures of most transport sources of air pollution, atmospheric nitrogen (N2) is oxidised to nitric oxide (NO) and small quantities of nitrogen dioxide (NO2), in addition to smaller quantities from nitrogen-containing impurities in the fuel. Nitrous oxide (N2O) is emitted only in small quantities from the combustion process, but is somewhat more abundant in the exhaust of cars fitted with catalytic converters.
2.2. Life-cycle analysis of emissions from transport
The air pollution emissions generated during use of any form of transport are only a part of the total amount of air pollution generated by transport-related activity. The techniques of Lifecycle Analysis (LCA) (ISO, 1997) can be used to identify which stage in the production, use and disposal of a given transport technology is responsible for the most significant atmospheric emissions. For the majority of examples, most of the emissions occur at the time and place of transport use. For example, 60 to 65% of lifecycle greenhouse gases from a petrol-engined car are CO2 exhaust emissions during use with a further 10% being non-CO2 exhaust emissions during use. The remainder is 10% associated with the car’s manufacture (mostly energy use), and a further 15 to 20% emitted during extraction, refinery and transport of its fuel (OECD, 1993). It should be noted, however, that this calculation excludes significant quantities of CO2 that are emitted in the production of materials to construct transport infrastructure such as roads and bridges, especially concrete. For hydrocarbon emissions, the pre-use part of the fuel life-cycle is even more important (neglecting, for this example, the fact that different hydrocarbons emitted at different locations can have very different impacts), as shown in Fig. 1 (Gover et al., 1996), and other volatile organic compounds are emitted on evaporation of solvents during painting the bodywork as well as evaporation from the fuel tank and parts of some older engines when the vehicle is not in use. For airbags and air conditioning units, the major emission of the gases contained within them is on disposal at the end of their life.
Air pollution from the operation of electric railways and the small but growing number of road vehicles that are powered by electricity is all emitted some distance away from the place of use, which is a major attraction of electric power for

Colvile et al., 2000. The transport sector as a polluter
3
urban transport. Coal-fired generation of electricity tends to produce a larger amount of SO2 per unit mass of fuel than combustion of oil by stationary or mobile sources, because the amount of sulphur in coal is often higher (1 to 6% by mass) than in oil, and there is no refining process where sulphur can be removed; natural gas for electricity generation or used in a mobile source has negligible levels of sulphur, the same as the most recent clean automotive fuels. Nuclear generation of electricity has the potential to emit zero levels of air pollution, although the Chernobyl accident illustrated that this is not always achieved in practice. Hydroelectric power’s only emissions are during construction and demolition of the plant, and wind power is similar with the addition of noise emissions during use.
2.3. Quantification of emissions from transport
Atmospheric emissions can be quantified by adopting so-called “top-down” or “bottom up” methodology to generate an emissions inventory.
The top-down approach starts with data describing total polluting activity throughout the whole geographical area of interest, such as total national petrol sales for calculation of road transport emissions. This is related to the magnitude of the associated air pollution source by means of an emissions factor that can be obtained by laboratory measurement of a representative sample of engines or vehicles under simulated typical operating conditions, for example average NOx emission per litre of petrol consumed. It is important to allow for the fact that engines in use are typically not maintained to the manufacturers’ specified standards for emissions minimisation, and this is now taken into account for determination of road transport emissions though still not for some aircraft emissions. Spatial disaggregation of a top-down emissions inventory is then performed, if required, by assuming local emissions are proportional to some other variable that can reasonably be assumed to have a similar geographical distribution to that of the polluting activity, for example population density or length of road per unit area of land.
The bottom-up approach is different in that it starts with geographically resolved data, for example traffic flow on an individual length of road. For some sources (usually the larger stationary ones) emissions data are determined directly by measurement of each individual source. More usually however, especially for transport emissions where a large number of small individual sources are involved, emissions factors again need to be used, for example average emissions of NOx per vehicle per kilometre driven. Total emissions for a geographical area of interest can then be obtained by summing all the individual contributions.
The top-down and bottom-up methods invariably give different total emissions, as each is subject to different sources of error (for example, Samaras, Kyriakis and Zachariadis, 1995). For road traffic, annual emissions for a typical whole city where activities are rather well characterised can be determined to within a factor of two or better using either method, while emissions from a smaller part of the city or a shorter averaging time, such as a single road during a specific hour, are generally known rather less accurately, with a more than factor of ten overestimation or underestimation being quite common. A “bottom-up” emissions inventory inherently suffers from requiring very large amount of data, such that there is a tendency to make several assumptions and approximations. For example, traffic surveys quantifying the number of vehicles on every road in a town or city are usually taken manually (although video cameras can now determine vehicle type by reading the registration plate), so each road will be sampled no more than a few days per year and average factors applied to relate this to weekends, nights and other seasons. Automatic traffic counts rarely give any information about vehicle type. Computational models of traveller behaviour can be used to fill in data gaps on major roads, but are typically designed to study peak flow not daily or total emissions, and also might consider all vehicles as multiples of the number of passenger cars, still therefore needing factors to be applied to get hour-by-hour flows 365 days per year broken down into vehicle types for the quantification of air pollution emissions.
A convenient and regularly updated review of emissions factors for Western cities and inventory construction methodology is maintained by the London Research Centre (LRC, 1999), including data from the European Community DRIVE programme (Jost et al., 1992) and information from USEPA (1999). Fig. 2 shows data from two examples of emissions inventories: an urban inventory for fine particles (Buckingham et al., 1997), apparently showing a large contribution from diesel-engined road transport which will be discussed further below, and an older national inventory for carbon dioxide (ERR (1990) cited in Whitelegg (1993)) showing a significant contribution from transport, including air transport for which emissions are expected to increase while others decrease (Penner et al., 1999).
Emissions inventories can be valuable in providing a first estimate of the contribution of transport to air pollution emissions compared with other activity, or the relative contribution of alternative modes of transport when designing sustainable integrated transport systems. There are two respects, however, in which doing this can result in erroneous analysis. Firstly, different types of source of a given pollutant might have very different source-receptor relationships. This is unimportant for well-mixed pollutants such as CO2, for which the total global concentration is of interest, but in an urban area emissions from vehicle exhausts are much closer to human receptors than tall chimneys on industrial point sources. For example, the contribution to pedestrian exposure per unit emission from vehicles in a city street is three hundred times that of a 200 m high chimney in average dispersion conditions, even at the point of maximum ground-level concentration from the chimney.
The second factor that is ignored when an emissions inventory is used uncritically to assess transport contribution to local air quality is the possibility that sources outside the area of the inventory could make a significant contribution. The best example of this is fine particles, for which Fig. 2(a) gave the impression that abatement of diesel engine sources could have a large impact on air quality in a large non-industrial city. In fact, atmospheric dispersion modelling (Carruthers et al., 1999) has shown that future large cuts in particle emissions may have almost no impact on PM10 concentrations except immediately adjacent to the busiest roads and in the most severe winter stagnation air pollution episodes, because a significant contribution to annual average PM10 concentrations in the city as a whole is imported, in the case of the UK from as far away as Eastern Europe. This imported contribution is predicted to become a large
Colvile et al., 2000. The transport sector as a polluter
4
fraction of the total in future when local sources are reduced. The importance of long-range transport is greatest for fine particles as a consequence of their long life in the atmosphere (APEG, 1999).
2.4. Summary
The factors that need to be taken into account when quantifying a given impact of
transport emissions of air pollution are therefore as follows:
• Emissions during complete life-cycle of vehicle, fuel and associated infrastructure. • Significance of transport emissions compared with other sources of the same pollutant(s) within a given
geographical area, as shown by emissions inventory data. • Contribution of sources outside the geographical area covered by the emissions inventory. • Source-receptor relationships. • Other pollutants contributing to or exacerbating the impact of interest. • Other impacts of the pollutant(s) of interest.
Frequent changes in public opinion and policy to control emissions from transport can occur when one or more of these factors is not considered, either through error of omission or through lack of the necessary understanding or information. Such changes that have occurred during the last four decades of the 20th century will be outlined in the next section, as part of a general review of all the major impacts of transport emissions of air pollution.
3 Overview of transport air pollution emissions impacts
3.1. “Clean air” in the 1960s and early ‘70s.
At the beginning of the 1970s, widespread availability of electricity and clean fossil fuels coupled with the introduction of clean air legislation had resulted in the severe urban air quality problems of preceding decades being solved in most Western cities. The major emissions abatement measures then were not transport related. They were directed towards the formerly much more significant source of pollution: coal, burnt in inefficient boilers or in a separate grate for each individual room to heat offices and homes. This was replaced by cleaner central heating systems, especially in areas where natural gas became available at about the same time, on grounds of improved comfort and convenience as well as economic incentives and legislation. The major transport emissions abatement measure of this era was the replacement of steam traction with diesel and electric on the railways.
Ellison and Waller (1978) reviewed the evidence on the health effects of urban air pollution (principally sulphur dioxide and suspended particulates), with particular reference to the UK. They concluded that urban air pollution until around 1968 caused increased mortality and morbidity, with exacerbation of pre-existing chronic respiratory disease, but felt these effects were no longer occurring. The sooty smogs of the 1950s had also been highly visible and tangible, so the improvement in air quality could be seen, smelt and even tasted by the general public as well as monitored by scientists, adding to the general impression that the problem had been solved. Plentiful oil permitted the development of ever larger automobiles, especially in the United States. Comfort, status, mobility and vehicle performance were higher priorities for vehicle design than exhaust emissions or fuel economy. Aircraft design, similarly, focussed on speed and size, with the Anglo-French Concorde setting standards for supersonic passenger transport that have not been surpassed since but at the expense of emissions many times higher than those of more modern aircraft. The increase in prosperity in Western Europe and North America after the end of the Second World War also led to a rapid increase in the ability of ordinary people to travel using these more polluting modes of transport.
3.2. The return of smog
The first major automotive emissions control measures were stimulated by the infamous Los Angeles smog at a time when urban air quality had become much less of a problem in other parts of the world. This smog was (and is) of a different type to the sooty fog that had been tackled in cities with cooler, less sunny climates. The photochemical smog was produced by the action of sunlight on oxides of nitrogen and hydrocarbons, the very pollutants that were emitted in large quantities by the rapidly increasing numbers of automobiles in the 1950s and ‘60s. In the 1960s, the first oxidation catalysts were fitted to convert vehicle emissions of carbon monoxide and hydrocarbons to carbon dioxide and water (Heck and Farrauto, 1995). Steadily increasing standards were then introduced at federal level throughout the 1970s, with upwards of 80% of new cars being fitted with a catalytic converter since 1975. The first car to be equipped with three-way catalytic converter in the United States was imported by Volvo in 1977 (OECD, 1988), and the US 1981 emissions standards required every new car to fitted with a three-way catalyst.
3.3. The emergence of acidification
In the 1970s, it was suddenly noticed that trees were apparently dying en masse in the highly polluted “Black Triangle” of East Germany, the Czech Republic and Poland (Ulrich (1990), Kandler and Innes (1995), Bach (1985)) and numbers of dead fish floated to the surface of Swedish rivers and lakes (Borg, 1986) as well as in similar North American environments (Driscoll et al., 1980). Initially, it was largely the use of coal in large combustion plant that was to blame, with unabated emissions of sulphur dioxide converted to sulphuric acid by oxidation in the atmosphere [insert cross reference to Millennium Review on acid deposition]. Following international agreements (Geneva in 1979 and Helsinki in 1985) to cut emissions (McCormick, 1997), the next step to reduce air pollution emissions might have been replacement of fossil fuels with nuclear power. The growth of green politics especially in nuclear cold-war front-line Germany, however, opposed this, and attention turned to private cars as a source of oxides of nitrogen precursors to the increasingly significant atmospheric concentrations of nitric acid. Three-way catalytic converters to tackle emissions of

Colvile et al., 2000. The transport sector as a polluter
5
oxides of nitrogen, hydrocarbons and carbon monoxide have been in use in Germany since 1984, nine years ahead of the European legislation to make such emissions control mandatory (CONCAWE 1997). Sweden and Switzerland also introduced vehicle emissions standards ahead of the rest of Europe, in 1976 and 1982 respectively. Europe thus started to catch up with the United States in control of emissions from road transport, but the environmental impact driving the change was different on the two sides of the Atlantic.
3.4. Climate change and stratospheric ozone depletion
The environmental pressure from acid rain in Europe and photochemical smog in California was combined with the oil price rises of 1973 and 1978, leading to fuel consumption by transport coming under scrutiny, especially larger automobiles. As the acidification issue became old news and efforts to solve the problem got under way (Stanners and Bordeau, 1995), the environmental agenda shifted and the 1980s became the decade of the global atmosphere. Predictions of widespread flooding (Carter, 1987) as thermal expansion of the oceans was predicted to cause sea level rises up to 1 metre (Houghton et al., 1996) focused minds on global warming. Despite a fall in the price of oil (Hampton, 1991), this led to increasing popularity of the diesel engine over petrol especially in parts of Europe, on the grounds that emissions of greenhouse gas carbon dioxide from inherently more fuel efficient diesel engines are lower than those from equivalent three-way catalyst equipped petrol cars. The discovery of an annually occurring ozone hole over Antarctica, which deepened rapidly during the second half of the decade (Farman and Gardiner, (1987), Farman (1987)), as the first observation of a major catastrophic failure in natural regulation of the functioning of the global atmosphere, caused the spotlight to fall on emissions of long-lived, stable but catalytically active molecules such as chlorofluorocarbons, of which transport is far from being the largest source. In due course, however, concern began to grow over aircraft being possible contributors to ozone depletion through emissions of sulphur dioxide, soot and oxides of nitrogen. On the ground, mobile air conditioning units, which had been commonplace in North American cars since the 1970s and would become rapidly less unusual in European cars later in the 1990s (as a result of global warming perhaps, but more likely just a couple of hot summers), came under the regulation of the Montreal Protocol (1987) to phase out the use of the most powerful ozone-depleting chemicals during the 1990s along with other refrigeration technology. Emissions of greenhouse gases came under global control somewhat less rapidly both as a result of genuine scientific uncertainty concerning the magnitude of the problem combined with powerful lobbying by the fossil fuel industry. The Rio Summit of 1992 (Quarrie (1992), Grub et al. (1993)) concluded that climate change is a serious problem such that action cannot wait for scientific uncertainty to be reduced, with developed countries being identified as having a responsibility to take the lead and compensate developing countries for the cost of controlling emissions of greenhouse gases, complete with proposals for far-reaching institutional change to integrate environmental protection with development. This was followed by the Kyoto summit of 1997 (Grubb, 1999), where the first international agreement was reached to make some small reductions in greenhouse gas emissions. These are, however, nowhere near the drastic global cuts that are required to bring about a return to pre-industrial or even current atmospheric levels of greenhouse gases before the end of the next century if ever, but are the first step towards stabilising atmospheric CO2 during the later years of the 21
st century at around double its current concentration.
3.5. Urban air quality revisited
In the final decade of the century, the European and North American air pollution agenda has come back full circle and the issue of urban air quality that had last been at the top of the European agenda in the late 1950s rose again to the fore world wide. Diesel engines rather rapidly ceased to be cited as the environmentally friendly option as epidemiologists (Pope et al. 1992; Dockery et al. 1992), laboratory-based scientists (Diaz-Sanchez, 1997) and expert groups (Quality of Urban Air Group, 1993) found evidence that the particles emitted might be responsible for measurable increases in the manifestations of cardiovascular and respiratory disease even at the comparatively low levels of air pollution in modern Western cities. These had not been seen before because older statistical methods were not powerful enough to detect the very low signal-to-noise ratio of the effect of air pollution against other causes of health inequality and variability, and because computers to handle the large amounts of data required were not widely available. A large number of epidemiological studies followed on the effect of various road traffic emissions on a range of health end-points. Public concern over air quality is enhanced by its effects on children (Brunekreef et al. 1997) and has focussed in lay minds on associations with asthma, the incidence and prevalence of which have increased dramatically during the second half of the 20th century (Holgate et al. 1995), Jarvis and Burney (1998)) in many countries (Miyamoto, 1997), (Ninan and Russell, 1992)). Current evidence suggests that air pollution exacerbates or provokes symptoms in those with pre-existing asthma (Krishna and Chauhan, 1996) but there is no good evidence that asthma is caused by air pollution (Holgate et al. 1995). There are also fears of cancer, as specific hydrocarbon components of vehicle exhaust, especially polycylic aromatic hydrocarbons bound to diesel exhaust particulates, plus benzene and 1,3-butadiene (Perera, 1981), USEPA (1990, 1993)), are known carcinogens. CO is present in the cities of developing countries at levels high enough to exacerbate cardiovascular disease by impairment of the oxygen carrying capacity of the blood, but the introduction of catalytic converters has meant that levels this high are a thing of the past elsewhere (DETR 1998) unless, as has been the case with fine particles, improved statistical techniques allow detection of effects at much lower levels than had previously been found. The same is true of lead (Delves (1998), SMEPB (1994), Olaiz et al (1996), Yang et al. (1996)) which has been shown at levels in previous years to cause neurotoxicological damage and lower Intelligence Quotient scores in children (Smith (1998), WHO (1995), EPAQS (1998)). It has long been known from laboratory studies that SO2 causes coughing on short-term exposure to high concentrations, particularly among people with asthma (Sheppard et al., 1980), although the application of older field measurements of effects on populations need to be applied with some care to modern traffic-dominated cities since the earlier high SO2 levels from coal combustion were accompanied by particulate air pollution concentrations several times higher than today’s.
The most recent traffic-related pollutant to be implicated in causing ill health in the cities of developed countries today is NO2. Its effects are summarised in Table 1. Some studies have suggested that NO2 is acting wholly or partly as a
Colvile et al., 2000. The transport sector as a polluter
6
surrogate for another pollutant that has similar properties and source distribution (Poloniecki et al. (1997), Touloumi et al. (1997), Morgan et al. (1998)). However, others have shown an effect of NO2 after allowing for the effects of other pollutants (Castellsagué et al. (1995), Pantazopoulou et al. (1995), Linn et al. (1996)). Another study revealed increased effects of NO2 when other pollutants were included in the models (Sunyer et al. (1997)). The debate continues, although recent studies have again found effects of NO2 (Atkinson et al. (1999), Hajat et al. (1999), Garcia et al. (2000)).
NO2, along with volatile organic compounds (VOCs), is also a precursor of ground-level ozone (O3) and other photochemical pollutants (Sillman, 1999). Not only has O3 been shown to worsen asthma symptoms (Romieu et al. 1996) and be associated with an increase in emergency hospital respiratory admissions (Schwartz, 1996; Spix et al. 1998) but it also damages crops (Ashmore et al., 1980). A major difference between O3 and primary emissions from transport sources is that the time taken to form O3 is sufficiently long for the highest concentrations to be found typically 100 km from the source so it is a regional pollutant. Except in the most severe urban photochemical smog conditions (Apling et al., 1977) levels of O3 at street-level in city centres tend to be lower than elsewhere or even zero because of the proximity of road-traffic sources of nitric oxide (NO), which scavenges the O3 to form NO2. Some authors are now beginning to describe O3 as a global pollutant as background levels rise across the whole of the North Atlantic area due to North American and Western European road traffic emissions combined (Johnson et al., 1999), heralding a return to increased concern about regional and global atmospheric problems as we enter the 21st century. What remains to be seen is the extent to which transport emissions of air pollution are responsible for this, and which modes of transport cause the most or the least generation of ground-level O3.
The widespread impression that visibly clean air is genuinely clean thus seems to have disappeared in the last two decades of the 20th Century, and unlike in the 1950s, transport is receiving the most attention as a source of air pollution. The fact that modern transport-related air pollution is largely invisible seems to be resulting in it not being ignored but instead in it being more frightening, rather as invisible ionising radiation has always been a subject of much fear and suspicion in most societies. Added to this is the visible congestion, noise, stress and other inconvenience and annoyance that is the result of unrestrained growth of transport systems in nearly all cities (Forsberg, Stjernberg and Wall (1997), Lercher, Schmitzberger and Kofler (1995), Williams and McCrae (1995)), resulting in pressure for change that is probably irresistible. The remainder of this review will look in detail at three examples of environmental impact of air pollution emissions from individual modes of transport, to investigate whether current priorities for change are supported by scientific evidence.
4 Case studies
In this section, three contrasting examples will be examined in depth to illustrate the issues involved in quantifying the impacts of air pollution emissions from transport by land, air and sea. The currently highest profile example of road traffic contribution to the effects of urban air quality on human health is considered first, with an emphasis on particulate matter as the pollutant currently causing at least as much concern over health effects as any other. This is then compared with the impact of aircraft emissions on the global atmosphere. Finally, sulphur pollution from ships in Europe will be used as an example of emissions abatement policy to reduce acidification being applied to the transport sector. The aim is not to identify all the most significant impacts of transport on air quality, as some impacts that are not considered may be more important than those we focus on. Notably, rail transport is omitted almost completely from this review. The reason for this is not that its impacts on air quality are slight (indeed, its net impact is benefit if one takes into account road traffic reduction achievable by increased rail use), but the major issues concerning emissions, source-receptor relationships and multi-pollutant multi-effect analysis are illustrated adequately by the examples that are discussed in depth. Our discussion of urban road transport has been introduced with particular reference to the private car, although light goods, heavy goods and public service vehicles also contribute to air pollution. Our detailed discussion of goods transport will be limited to marine shipping and our discussion of commercial passenger transport limited to air traffic. For each example that we do consider in depth, the main issues that determine the nature and magnitude of the impact are reviewed, and a conclusion is reached concerning the extent to which we are currently capable of quantifying the impact. The aim is that these examples can then stimulate similar future analysis of impacts of other transport sub-sectors on other receptors as and when required.
4.1. Road traffic and effects of urban air quality (especially particulate matter) on human health
Factors determining magnitude of transport impact Road transport is distinguished from other sources of air pollution, as mentioned already above, in that the emissions are released in very close proximity to human receptors, giving reduced opportunity for the atmosphere to dilute the emissions and render them less likely to damage human health. Furthermore, in most city centre atmospheres, concentrations of vehicle exhaust are significantly enhanced by the fact that many roads have buildings alongside. The effect of such buildings is to shelter the road, reducing the wind speed at the source of emissions by as much as an order of magnitude relative to that on an open road. The contribution of emissions from traffic on that road to kerbside pollutant concentrations is increased by approximately the same factor. Such enhancement of transport emissions often has little impact on total daily population exposure to a given pollutant, largely because people spend much larger amounts of time indoors (Jantunen et al., 1998). Nevertheless, much air pollution work has focused on the outdoor environment as individual citizens have less control over the air they breathe outdoors than they do in their own homes, and the high levels of air pollution in city street canyons coincide with noise, smell, dust and traffic congestion that people find unpleasant leading to further enhanced concern about possible health effects. Furthermore, the major impact of road traffic emissions on human health can occur inside the buildings that line city streets, where concentrations of pollutants from road traffic are determined largely by the outdoor concentration adjacent to windows and doors (for example, Kukadia and Palmer, 1998).
Colvile et al., 2000. The transport sector as a polluter
7
Current ability to quantify impact Flow and dispersion patterns in two-dimensional city streets have been studied in the field by Johnson et al. (1973) and Dabberdt et al. (1973), and in the wind tunnel by Yamartino and Wiegand (1986) and others. A semi-empirical model for a long street bounded by equal height buildings on either side has been developed by Berkovicz et al. (1997), and is now being increasingly used in air quality management especially in Europe (McHugh, Carruthers and Edmunds, 1997). Such modelling indicates that time averaged concentrations vary by as much as a factor of two to three over distances as short as a few metres on the road, introducing the potential for different road users (for example, cyclists versus car drivers) to be exposed to rather different levels of air pollution. Instantaneous concentrations exhibit greater variability associated with emissions from individual vehicles coupled with fluctuations in atmospheric turbulence, giving rise to further enhanced exposure of road-users who preferentially occupy the most polluted parts of the road such as a cyclist in the slip-stream of a bus, but these transient phenomena are very difficult to model computationally. Even for time-averaged concentrations, extension of the simple idealised two-dimensional street canyon case to the simplest three-dimensional situation of an intersection of two building-lined streets (Hoydysh and Dabberdt (1994), Scaperdas and Colvile (1999)) or unequal building heights (Hoydysh and Dabberdt, 1988) increases the complexity considerably. CAR-International (den Boeft et al., 1996) is an empirical model that does attempt to take some two-dimensional building shape factors into account when calculating annual average roadside pollutant concentrations. An alternative approach is to model real urban geometry computationally (for example Hunter et al. (1992), Lee and Park (1994)). In theory, such fluid dynamics models are capable of reproducing any urban geometry at any spatial resolution over any area, but in practice finite computational resources limit them to single street canyons or small groups of buildings, with buildings often represented as simple regular cuboids. To cover a larger area of a city, building-resolving computational fluid dynamics models will soon be nested within overlying meteorological boundary layer models.
In view of the complications and uncertainties that remain in high resolution urban air quality modelling, most assessments of human exposure to date have used measurement, not modelling. The simplest approach is to use data from a single city-centre or suburban background air quality monitoring station as a surrogate for the daily level of air pollution to which the whole population of a city is exposed. This will be much more accurate for a pollutant such as PM10 that has major distant sources (as discussed in section 2) but will be less accurate for a pollutant such as CO or NOx that is predominantly emitted by local road transport. For people such as children or the elderly who often spend all day in the urban or suburban back-street environment, using background air quality monitoring data will be a good approximation for exposure even to these traffic-related pollutants, but is less accurate for working populations who can spend as much as three hours a day commuting. A roadside monitoring station gives a first indication of the extent to which such roaduser exposure is higher than the urban average, and will also provide a measure of the exposure of people who live or work alongside busy roads. Each individual roadside location is unique, though, so that it is impossible to obtain any sort of concentration map (as is provided by a dispersion model) without using a very dense network of measurements indeed. This has been attempted in a few studies (for example, Briggs et al., 1997), but several have gone one step further and measured the exposure of road-users themselves, using air pollution monitoring equipment small and lightweight enough to be carried by a person as they go about their daily life or as they travel by car, bicycle or public transport. For example, Sitzmann et al. (1996) found that cyclists in London are exposed to concentrations of particulate air pollution significantly higher than those measured by fixed roadside air pollution monitors; Chan et al. (1991) and BRE (1998) found that commuters in Massachusetts and Hertfordshire respectively were exposed to much higher levels of non-formaldehyde VOCs inside cars than when in subway electric trains, walking or cycling, and similar results may be found in a review for the Institute for European Environmental Policy (DETR, 1997). The Europe-wide EXPOLIS study has recently been completed measurements of total daily exposure of 451 volunteers in six cities, with application of statistical methods to attribute total exposure to the sum of the different microenvironments through which the volunteers move (Jantunen et al., 1998), including transport microenvironments.
The most accurate method of assessing human exposure to air pollution is biological measurement. For example, exposure to 20 ppm of CO (such as might still be encountered in the most confined and heavily trafficked areas of European Cities, such as road tunnels, and which still commonly occurs in many cities in developing countries) will cause blood levels of carboxyhaemoglobin to rise to an equilibrium level of 3.2% in about 8 hours if a person is carrying out light activity, or four hours during more strenuous exercise (Forbes et al. (1945) in EPAQS (1994)). For lead, a blood sample reveals the level of exposure over a longer time period, and a rise from 10 to 20 µg dl-1 has been found to be associated with a loss of up to two Intelligence Quotient points (EPAQS, 1998).
Using biological sampling or personal exposure monitoring, however, it is only possible to measure the exposure of a small number of people. To assess accurately the variability of exposure of entire populations, either a very large number of exposure measurements are required (as in EXPOLIS) followed by a statistical analysis of how exposure relates to daily lifestyle, or high-resolution mapping of the spatial and temporal variability of air pollution concentration must be used. There are now a few examples of high resolution mapping techniques being applied to the assessment of exposure from road traffic, either empirically (Briggs et al, 1997) or more theoretically (Khandelwal (1999), Grossinho et al. (1999)). Similar methodology has been used somewhat more widely at lower spatial resolution for larger sources, for example McGavran, Rood and Till (1999), Ihrig, Shalat and Baynes (1998). The most sophisticated operational urban air quality models are probably now capable of starting to assess the exposure of moving road users as a function of the amount of time they spend in more or less polluted streets.
Quantification of the effect of urban road traffic pollution on human health can be attempted using any measure of individual or population exposure and correlating that with records or observations of the incidence or severity of, or mortality from, disease. A variety of designs of epidemiological study exist, looking at whole populations (ecological study) or closely monitored small groups of subjects (cohort study), and examining the effects of variations in air pollution concentrations in time or space. Time-series analysis can detect only short-term effects of air pollution, while geographical methods can also pick up chronic effects (Elliott et al., 1992). Usually, the statistical power of a large

Colvile et al., 2000. The transport sector as a polluter
8
ecological study is required to detect the very small air pollution signal against the noise of other variability in health and the factors that influence it, such as weather and virus epidemics. Some of the exposure assessment methodologies outlined above for road transport pollution are more suitable for certain designs of epidemiological study than others, for example urban background monitoring for a time-series study, personal monitoring or biological sampling of a cohort, or high-resolution dispersion modelling for an ecological small-area geographical study.
For a pollutant such as CO, where most spatial and temporal variability in outdoor concentrations is due to road transport emissions, an observed relationship between air pollution levels and health can more easily be equated to a relationship between road transport emissions and health. For other pollutants, however, most studies look at the impact of a pollutant that has several sources of which road transport is only one. PM10 is an extreme example of this, where road traffic exhaust can be responsible for a rather small fraction of the total concentration, as discussed in section 2. Similarly, for lead, even though road traffic exhaust particulate matter was formerly the main source in most urban atmospheres, there are many pathways of exposure in addition to inhalation of vehicle exhaust, including ingestion from old lead paint, in drinking water from lead pipes, and from dust deposited in carpets ingested during hand-to-mouth activity (especially for children). Not only other sources of air pollution but also other causes of variations in health need to be taken into account before the impact of road traffic emissions can be isolated. Where there is a high degree of correlation between these and the pollutant of interest, correction for confounding requires sophisticated statistical techniques. A major confounder in time-series studies is the effect on health of temperature changes associated with air pollution episodes. In a geographical study, it is necessary to correct for how low income rather than poor air quality is often a cause or consequence of ill health close to a pollution source such as a major road (Dockery (1993), Schwartz et al. (1996)). To circumvent all the problems of source apportionment and exposure pathway (but still leaving socio-economic confounding to be corrected for), there are a few small-area studies of geographical variations in health that look at road transport emissions in general instead of a single specific pollutant, or even a parameter such as distance of place of residence from a major road, to obtain a more direct measure of the association between road traffic and health (for example, Briggs et al., 1997).
The results of epidemiological studies can be applied to current air quality statistics to estimate the magnitude of the impact of air pollution on health. The World Health Organisation (WHO) produced meta-analyses for the effects on mortality and morbidity of a number of pollutants (WHO, 1997). Their effect estimates have been used by others to calculate aspects of the burden of poor health attributable to pollution. For example, in the UK, COMEAP (the UK Department of Health’s Committee on the Medical Effects of Air Pollutants) calculated that PM10 was associated with 8,100 deaths brought forward and with 10,500 emergency hospital respiratory admissions (brought forward and additional) in urban areas of Great Britain. The corresponding figures for SO2 were 3,500 deaths brought forward and 3,500 early and extra hospital admissions. The effects of ozone were 700 deaths and 500 admissions if there is no health effect below 50ppb, but 12,500 and 9,900 if there is no threshold (Department of Health Committee on the Medical Effects of Air Pollutants, 1998)(Department of Health Committee on the Medical Effects of Air Pollutants, 1998). This risk is higher for residents of rural areas because urban road traffic emissions of NOx scavenging ozone in cities. Various attempts have been made to quantify the economic value of such impacts on individuals, despite the very large uncertainties involved. Maddison and Pearce (1999), Ostro et al (1999), DoH (1999) and ExternE (1999) used exposure response functions derived from epidemiological studies to estimate the proportion of health endpoints, such as hospital admissions, attributable to air pollution, and then used inferred prices based on contingent valuation studies to calculate the value people attach to these health endpoints. Reports prepared for the World Health Organisation Ministerial conference on Environment and Health in London in June 1999 considered the chronic effects of air pollution (Künzli et al., 1999), population exposure to PM10 (Filliger, Puybonnieux-Texier and Schneider, 1999) and an economic evaluation of the health effects (Sommer et al., 1999). These found that Austria, France and Switzerland bear almost €50 billion of air pollution related health costs, of which a little under €30 billion are related to road traffic. In the USA, Ostro and Chestnut (1998) calculated that the annual health benefits of achieving new standards for PM2.5 relative to 1994-1996 ambient concentrations in the USA are likely to be between $14 billion and $55 billion annually, with a mean estimate of $32 billion. A major difficulty in quantifying the health impact of air pollution is that a very large number of people are exposed to relatively low levels over long periods of time, resulting in slight or rare health problems that are difficult to value or difficult to attribute to a given source of pollution, as illustrated in Fig. 3.
The examples cited above are estimates of the cost of health effects of current levels of certain pollutants for all sources, and for SO2 and PM10 road transport is far from being the largest contributor to concentrations in most cities. Eyre et al. (1997) used emissions-based dispersion modelling to estimate the exposure of the population of London specifically to road transport emissions and compared this with other impacts. Their results reproduced in Table 2 suggest that urban diesel particulate emissions have by far the most significant impact of all road transport emissions. Interestingly, the next most significant impact is secondary nitrate particles formed from emissions of NOx. The current European trend towards larger fractions of PM10 being composed of nitrate formed from NOx, much of which is of road transport origin, is a trend towards the health effects of PM10 becoming increasingly an impact of road transport emissions.
Sources of uncertainty and implications for transport Despite the very large uncertainties in all valuations of impacts of air quality, the larger sums estimated in such studies have led to particulate air pollution causing at least as much concern over its effect on human health than any other ambient air pollutant world wide. The choice of PM10 as the measure of particulate air pollution to be controlled is based on a biological plausibility argument given the aerodynamic characteristics of the human respiratory tract. The strength of the evidence for health effects of PM10 in general may be assessed against the criteria proposed by Bradford Hill (1965), which are listed in Box 1. Much less certain is the extent to which primary PM10 from road transport exhaust is responsible for the health effects of PM10. The uncertainty here is so great that current action to control diesel
Colvile et al., 2000. The transport sector as a polluter
9
particulate emissions in Europe (the focus in the US is much more on regional secondary PM10 from large combustion sources) must be described as precautionary.
If an estimate of population exposure used in an epidemiological study is subject to error, this will cause the observed relationship between air quality and health to be an underestimate of the true effect (Elwood, 1988). Critically, concentrations of pollutants from non road traffic sources tend to exhibit much less spatial variability than those from road networks, for example PM10 tends to be fairly constant over wide areas while NO2 can vary by an order of magnitude over a hundred metres or so in a residential area close to a few major roads, such that it is much easier to assess exposure to PM10 accurately. This raises the prospect of PM10 appearing wrongly to be more strongly associated with health effects than NO2, as discussed by Fairley (1990), on account of the effect of the road traffic related pollution being diluted by exposure misclassification in certain designs of epidemiological study (Lipfert and Wyzga, 1995).
The smallest diesel exhaust particles do not enter the human lung very easily because they undergo Brownian diffusion to the nose and throat, but the larger ones are close to the size that can penetrate the deepest into the alveolar regions of the lung where gas exchange with the blood occurs. Particles several micrometres in size from mechanical sources such as resuspension of road dust can dominate total PM10 mass but most of these are likely to be intercepted by impaction in the nose. In recent years, toxicological laboratory studies predominantly carried out on rats has been driving interest towards smaller particles (for example, Peters et al. (1997), Ferin et al. (1991), Li et al. (1999)) and future legislation is currently expected to focus either on smaller particle mass fractions PM2.5, PM1, PM0.1 or on particle number. This potentially has a very great impact on urban road traffic, especially if epidemiological studies can be designed to differentiate between the effects of diesel exhaust particles and the secondary acid sulphate and nitrate particles that are imported to an urban area from distant sources. The laboratory studies already show that particles from vehicle exhaust may not be the most toxic fine particles in the urban atmosphere, for example, quartz present in resuspended road dust appears to be much more toxic than diesel exhaust (Murphy et al., 1998), but if primary particulates from road traffic exhaust continue to be blamed for the observed health effects of PM10, precise details of which particle sizes and composition are most important will determine which combination of fuel type, engine type and end-of-pipe emissions abatement technology is likely to be most effective at reducing impacts on human health. Such detailed information is currently unknown.
Finally, it must be noted that the chronic effect of particulate air pollution is potentially much larger and less socially acceptable than the acute, but is often omitted from attempts to quantify benefits of pollution control because estimates of the chronic effect are the most uncertain of all.
4.2. Impact of aircraft emissions in the upper troposphere and lower stratosphere on global atmospheric change
Factors determining magnitude of transport impact The considerable visible and noise impact of large jet aircraft has resulted in their being considered frequently as potential significant sources of ground-level air pollution in the vicinity of major airports. Several studies (for example, ERL (1993)) have shown, however, that the emissions of the aircraft themselves contribute rather little compared with the great volumes of road traffic that large airports generate, plus other airport-related surface sources of air pollution. Even though an airport itself, typically located outside urban areas, can be the largest source of emissions in the vicinity, those from the aircraft themselves are efficiently dispersed before they reach the ground in the same way as the emissions from tall chimneys that were discussed in section 2. Future reductions in road traffic emissions and growth of the air transport industry may mean the aircraft contribution to ground-level air quality will become more significant relative to other sources, especially as pressure on land for expansion produces a tendency for increased airport development in cleaner air further away from the major cities that airports serve. Meanwhile, however, to find the most significant contribution of aviation to air pollution, we must look to higher altitude, where the lower atmospheric pressure and lack of other nearby anthropogenic sources of trace gases and particles means that a given volume of emissions can have a much greater impact.
Fig. 4 shows that hydrocarbons and carbon monoxide are emitted from jet aircraft engines predominantly on the ground. The major trace gas emission during flight is oxides of nitrogen (NOx). In addition, much larger quantities of carbon dioxide and water vapour are emitted, which illustrate some important issues of temporal evolution of emissions and impact for this rapidly expanding mode of transport. Furthermore, soot particles in the exhaust need to be considered for their roles as ice nuclei and in heterogeneous atmospheric chemistry.
The depends on how high the aircraft is flying. About half the NOx emissions from sub-sonic aircraft occur at the main cruising altitude of 10 to 12 km. Since the top of the free troposphere varies from about 8 km in polar regions to 16 km in the tropics, subsonic flight is in the lower stratosphere at high latitudes and in the troposphere elsewhere. On busy North Atlantic routes, as much as 75% of the total fuel per flight may be used in the stratosphere (RNMI, 1994). Supersonic aircraft cruise higher, always in the stratosphere, but at the time of writing the tragic crash of the Air France Concorde seems to be indicating that civilian supersonic flight is unlikely to return to our skies for several years at least.
In the free troposphere, emissions of NOx lead to the formation of ozone (Clemitshaw et al., 2000). This O3 can be mixed down to ground level and contribute to regionally poor air quality during photochemical air pollution episodes in what is gradually becoming a global air pollution problem, and it is also a greenhouse gas. Formation of O3 by NOx is one or two orders of magnitude more efficient in the free troposphere than at the surface, and about 50% more efficient in the Southern Hemisphere than in the North, because of the cleaner air there. This latitudinal variation compensates in part for the fact that there is more air traffic in the Northern Hemisphere. The result of all these nonlinearities combined is that free troposphere aircraft emissions of about 3% of total NOx emissions probably account for an approximately equal amount of global warming as total surface NOx emissions (Johnson, Henshaw and McInnes, 1992). This effect is

Colvile et al., 2000. The transport sector as a polluter
10
reduced, however, by the way NOx leads to increased levels of photochemical oxidants and hence shorter atmospheric life-time of methane.
In the stratosphere, the chemistry of ozone is totally different. At middle and low latitudes NOx is involved in catalytic cycles that destroy the protective ozone layer in the stratosphere (reference to Millennium Review on the stratosphere) and can allow dangerous ultra violet radiation from the sun to reach the surface of the Earth. Even though emissions of sulphur dioxide and soot particles from aircraft are negligible compared with total global emissions, their potential to damage the atmosphere is even more enhanced in the stratosphere relative to at the surface than is the case for NOx. Sulphur dioxide in the stratosphere becomes oxidised to form droplets of sulphuric acid, and these with soot particles from aircraft exhaust promote heterogeneous chemical reaction cycles that destroy O3. These stratospheric clouds also promote the conversion of NOx to nitric acid (HNO3), thus lessening the potential of the NOx to destroy O3 by gas-phase chemical reactions, but at very low temperatures the HNO3 itself can form droplets with then add to the heterogeneous chemistry that destroys O3. Depletion of stratospheric ozone has a cooling effect on climate, partially offsetting the warming effect of NOx from aircraft in the troposphere.
In comparison to these two indirect impacts of aircraft emissions on global atmospheric chemistry, the direct effect of CO2 from aircraft causing climate warming due to the ability of CO2 to absorb outgoing infra-red radiation is conceptually simple. When comparing different impacts of aircraft upon the global atmosphere with each other, and with the effect of emissions from other transport sectors and non transport related activity, the most challenging aspect of CO2 is perhaps the time scale over which it has an effect. CO2 is chemically sufficiently unreactive for its dominant removal process to be physical. Solution in the water of the upper ocean and exchange of carbon between the atmosphere and terrestrial biomass are relatively rapid, with the combined annual flux amounting to 20% of the atmospheric carbon reservoir mass of 750 GT (Houghton et al., 1996), but these fluxes are bi-directional. The rate determining step for net removal of carbon is mixing from the surface and intermediate ocean to the much larger carbon reservoir of the deep oceans. At the turn of the 21st Century, anthropogenic carbon emissions of 7 to 8 GT per year (including deforestation) are greater than the equilibrium rate of removal at current atmospheric and surface ocean concentrations, such that an amount of carbon equal to around half the emissions each year are removed and the imbalance results in a steady increase in atmospheric carbon dioxide levels. Were emissions to remain constant at today’s rate, the atmospheric concentration would reach an equilibrium level about one third higher than today’s value towards the end of the 21st Century. The global total emissions of CO2 from aviation in 1990 was about 450 million tonnes of carbon (Barrett, 1991), which was less than 20% of global road transport emissions and about 3% of total anthropogenic emissions. Furthermore, historical emissions of CO2 from aviation are almost zero going back just a few decades into the mid 20
th Century, while around half the carbon dioxide from all anthropogenic sources currently in the atmosphere was emitted before 1980, so the overwhelming majority of the total is from non-aviation sources. The small contribution of aviation is, however, increasing, and the small amounts of CO2 being emitted by aircraft now will remain in the air for many decades.
Finally, water vapour from jet engines can also form line-shaped clouds in the free troposphere. The temperature of these clouds is lower than that of Earth’s surface, so their black body radiation is less than what would be emitted from Earth’s surface were the clouds not there, resulting in net warming. This is more significant than the amount of incoming solar radiation reflected, so that overall the contrails have a warming effect on climate at the surface. Usually, contrails evaporate again within minutes or even seconds such that their impact is negligible, but under certain meteorological conditions they can be sufficiently persistent a large part of the sky can become obscured continually along a major flight path until weather conditions change many hours or days later. In the stratosphere, contrails are never persistent because of the low ambient relative humidity there, although the water vapour from aircraft is not removed rapidly by precipitation as it is in the troposphere so has a small warming effect on climate because of its greenhouse gas properties.
Current ability to quantify impact and major sources of uncertainty In theory, the impact of aircraft emissions on upper troposphere and lower stratosphere chemistry can be quantified using global models of circulation and chemistry (such as Johnson et al., 1999). However, despite the fact that the reaction mechanisms are now qualitatively understood, quantifying the impact of aircraft emissions remains elusive. There are two main reasons for this:
Firstly, the chemical reaction cycles are complex, as different gas-phase and heterogeneous pathways become more important at different temperatures. Small errors in the predicted mix of different pollutants can propagate via resulting errors in the relative rates of two or more competing reactions to end up with quite unrealistic simulated O3 concentrations. Not only must the chemical composition of the upper troposphere and stratosphere be simulated accurately, but rates of mixing between layers as well as chemistry determines the composition, the temperature needs to be known to determine where heterogeneous processes occur, and the temperature has a large influence on the mixing. The whole process of stratospheric O3 destruction in particular is a highly non-linear catastrophic process.
Secondly, emissions of aircraft in the upper troposphere and stratosphere occur along highly localised flight paths that vary in time and space. The physical size of these is much less than the resolution of the global-scale models that are required to simulate chemistry in the upper troposphere and stratosphere. This problem of scale is added to the fact that the total emissions from aircraft are at least as difficult to quantify as emissions for road traffic are on the ground. It is exacerbated by the fact that other sources of the same pollutants in the upper troposphere and lower stratosphere, such as lightening and mixing from the lower troposphere, are also very difficult to quantify accurately.
Any one of these difficulties would make calculations of the total atmospheric impact of aircraft emissions liable to error. Combined, they present a very formidable challenge indeed for the science of atmospheric chemistry modelling. The most recent calculations indicate that the effect of aircraft NOx emissions on producing O3 in the upper troposphere / lower stratosphere is greater than the effect of sulphur and soot emissions on destroying O3, except at high latitudes
Colvile et al., 2000. The transport sector as a polluter
11
(Penner et al., 1999). The greatest overall expected change in O3 due to aircraft emissions is thus an increase of about 6% in the region 30 to 60°N at 9 to 13 km altitude. Observational evidence of this is very difficult to find, because O3 variability is high near the tropopause and the expected 20% increase in NOx due to aircraft emissions is substantially smaller than the observed variability. However, in presenting these results, the IPCC Working Groups stress that the models include some notable deficiencies in the physics and the gas-phase and heterogeneous chemistry of the problem. To reduce the uncertainties, a concerted effort is therefore required, combining model development with detailed field observation campaigns that recent instrument development and improvement have made possible.
Quantification of the direct climate change impacts of aircraft through their CO2 emissions is arguably not so fraught with difficulty. The global climate models that are now in an advanced state of development are, nevertheless, extremely complex. A discussion of these and uncertainties therein is beyond the scope of this review. The sub-grid size of contrails however presents some problems similar to those discussed for NOx chemistry, and the sensitivity of contrail persistence to meteorological parameters presents a test of model accuracy in regions where such performance requirements have not been demanded before and where validation data are sparse, on top of the effects of significant remaining uncertainty surrounding ice nucleation processes.
A significant area of debate is concerned not so much with the accuracy of our predictions about the impact of aviation on climate, but with how to respond to the implications. In terms of the size of the perturbation to the radiation balance, the latest calculations are sufficiently accurate to indicate that contrails have at least as large an impact on climate as CO2 emissions from aviation, and that the radiative forcing due to contrails could be several times larger if less conservative estimates of the more uncertain contrails impact are used. If the formation of persistent contrails could be prevented, however, the radiation balance of the atmosphere would respond immediately, in contrast to CO2 from aviation in the 20th Century which will remain in the atmosphere for several decades. Integrated over a long future time horizon, CO2 emissions thus may be considered the most significant impact of aviation on the global atmosphere. Faced with a choice between preventing contrails or reducing overall fuel consumption, the decision must therefore be whether we want to make a small contribution to the solution of a long term problem but possibly severe problem or if a larger, instantaneous benefit is sufficiently desirable to be worth paying for in the latter part of the century.
In contrast to the human health effects of urban air pollution, where economic valuation was attempted at least for the acute effects, assessment of the implications of global atmospheric change are mostly qualitative. A most comprehensive example of this is Watson, Zinyowera and Moss (1996), which catalogues a wide range of impacts of climate change, but does not attempt to judge whether or not these impacts constitute “dangerous anthropogenic interference with the climate system” on the grounds that definition of what is “dangerous” is a political not a scientific judgement. For the impact of stratospheric ozone depletion on human health, which is expected to result in increased incidence of skin cancer over several decades, the magnitude of the effect is very difficult to quantify, for similar reasons to the difficulty in quantifying chronic effects of urban air pollution on human health.
4.3. Controlling acidification: sulphur emissions from ships
Factors determining magnitude of transport impact The acidity of the polluted atmosphere is enhanced relative to the clean atmosphere by the oxidation of oxides of sulphur and nitrogen. As has already been discussed briefly in section 3, catastrophic damage to upland forests attributable to acid deposition led to land-based European emissions of sulphur being reduced by 40% between 1980 and 1993 (Barrett and Seland, 1995). These emissions are principally from large coal-fired combustion plant, and reductions have been achieved by changing to a fuel with a lower sulphur content (including natural gas) or fitting flue-gas desulphurization abatement technology. At the time of writing, the Second Sulphur Protocol (UNECE, 1994) has been ratified by 22 of the 28 parties. Meanwhile emissions of NOx have remained almost constant, as have emissions of ammonia (although the estimates of ammonia emissions are subject to large uncertainties). This means that nitrogen is now more significant than it has been in the past, and the major ground-level transport source of oxides of nitrogen is road traffic. Pressure to reduce acidification further therefore enhances the focus on road traffic as a major source of air pollution that was discussed at length with respect to particulates and health in Section 4.1. Shipping, however, remains a transport source of sulphur that has not been subject to the abatement measures applied to sources on land, albeit a much smaller contribution to atmospheric acidity than oxides of nitrogen from road traffic. The argument that these emissions from marine transport should also be reduced will therefore be based on calculations of the costs and benefits associated with such measures.
There are several reasons why further reductions of acidification are recommended for Europe. It has been noted that wet deposition fails to respond as rapidly to emission reductions than dry deposition (Downing et al., 1995), partly because of falling oxidant concentrations in the atmosphere. This is especially acute in upland areas where wet deposition is enhanced by the presence of orographic cloud, as small, highly acidic droplets in low-level cloud formed by forced uplift of polluted air over hills are washed out by cleaner rain falling from aloft (Weston and Fowler (1991), Inglis et al., (1995), Dore, Sobik and Migala (1999)). Areas of alkaline geology (for example, limestone) are able to withstand anthropogenic acid deposition many times greater than the natural background. Areas of already acid geology however (for example, granite), start to show signs of disruption of plant and animal life with much smaller changes in the rate of input of acidity. The amount of acid deposition that an area can tolerate is described in terms of a critical load, specifically the rate of acid deposition below which significant harmful effects on specified sensitive elements of the environment do not occur according to present knowledge (Posch et al., 1997). Deposition measurements and model calculations indicate that acid deposition will not be reduced to below the critical load everywhere in Europe even if the best available emissions abatement technology is applied to every sulphur source on land. Furthermore, if the necessary reductions in deposition could be made, it would take decades for the ecosystems to recover, particularly where base cations have been leached out (Stoddard et al. 1999).
Colvile et al., 2000. The transport sector as a polluter
12
Attention on shipping as a potential contributor to acidification was increased in the latter years of the 20th Century following the publication of an updated inventory of shipping emissions of sulphur dioxide which demonstrated that these were greater than had previously been thought (Lloyds, 1995).
Current ability to quantify impact Early attempts to reduce atmospheric sulphur emissions were based upon equal abatement of industrial emissions everywhere in Europe. It was soon realised, however, that greater environmental benefit could be achieved at less cost if application of emissions abatement measures was concentrated in parts of Europe that are responsible for causing acidification damage to the most sensitive ecosystems. Initially, it is possible to apply relatively inexpensive abatement measures, but as tighter emissions limits are demanded, application of further technology becomes increasingly expensive and brings less additional benefit. The decision as to where these increasingly costly measures should most effectively be applied is informed by the results of integrated assessment modelling. Two examples of integrated assessment models (IAMs) are RAINS (Alcamo, Shaw and Hordijk (1990), Amman et al. (1999)) and ASAM (ApSimon, Warren and Wilson (1994), ApSimon and Warren (1996), Warren and ApSimon (2000)). These use source-receptor relationships calculated on a 150 km grid by the EMEP model of long-range pollutant transport and simplified atmospheric chemistry (Barrett and Seland, 1995). Modelled acid deposition is then compared with the critical load in each grid cell. Since these critical loads are not attainable even if Best Available Technology were to be applied across Europe as a whole, it is necessary to seek ways of partially closing the gap between deposition and critical load. IAMs find the most cost-effective means of doing this by linking the source-receptor relationships with information concerning the cost of reducing emissions in each country. It is these IAMs that are recommending further reductions in the emissions of sulphur as we enter the 21st Century in order to address most cost-effectively the remaining problem of acidification in Europe.
In 1998 a major study was commissioned by the UK Department of Environment, Transport and the Regions to investigate the cost-effectiveness of control of shipping emissions in the North Sea and other areas (ApSimon et al., 1998). The main control option considered was switching to low sulphur bunker fuel. Within this study the ASAM model was used to derive a cost-effective abatement strategy to reduce the area of ecosystems whose critical loads were exceeded as of 1990 by 50% by the year 2010. This environmental target is commonly referred to as the “50% gap closure”, corresponding to the European Union acidification straegy as proposed in 1997. As a starting point, the model uses a reference scenario that assumes each country emits the maximum allowed while complying with all current legislation. It then selects the cheapest combination of abatement options which achieve 50% gap closure. The optimised cost of achieving this is shown in the first column of Table 3.
Including abatement emissions from ships leads to large savings because the overall costs of precisely meeting an environmental target depend rather strongly on the levels of deposition and sensitivity of certain ‘binding grid cells’ where environmental damage is particularly difficult to avert. A 1 MT emission of SO2 from shipping in the North Sea contributes 202 eq H+ ha-1 yr-1 to a typical binding grid cell located in the Netherlands, whereas 1 MT of SO2 emitted from the land-based sources in the Netherlands, UK, Eire and France contribute 374 eq H+ ha-1 yr-1 to deposition in that cell. The contribution from shipping is thus seen to be highly significant and is almost as great as the 249 eq H+ ha-1 yr-1 contributed by sources in the Netherlands. If a certain fraction abatement of emissions on land costs more than about double a comparable percentage abatement of emissions from ships, it will therefore be more cost effective to abate the emissions from ships first.
The effect of scientific uncertainty While it is recognised that long-range dispersion modelling is an inexact science, uncertainties in critical load values for acidification are generally larger than uncertainties in source-receptor relationships. If uncertainties in critical loads are taken into account, a rather different picture emerges to what was described above. This is shown in the second column of Table 3, where the calculations have been repeated allowing for an uncertainty of ±100 eq H+ ha-1 yr-1 in the critical load for sensitive ecosystems. The third column of Table 3 shows results from the RAINS model that also take account of uncertainty using a ‘compensation mechanism’ to make the optimised results less sensitive to small uncertainties in critical loads and deposition values in binding grid cells. The RAINS calculations also include abatement of emissions of NOx as well as SOx, resulting in reduction of tropospheric ozone concentrations in addition to the 50% gap closure for acidification (Amman et al., 1999).
In addition to uncertainty in deposition and critical load calculations, the results of integrated assessment modelling are sensitive to the spatial resolution of the source-receptor relationships that are used. The 150 km resolution of the EMEP model fails to resolve very localised dispersion and deposition of emissions close to the source, and does not include the orographic enhancement of wet deposition. Both these factors are highly relevant when considering the influence of emissions from shipping in the vicinity of coastal mountains or upland areas. To study the effect of finer spatial resolution, a further study was carried out in which the OPCD model (Lowles and ApSimon, 1996) was used in place of the EMEP model. This shows that shipping alone is not able to cause exceedences of critical loads in the absence of land-based sources, but that there are some sensitive ecosystem areas close to ports where critical loads are exceeded by marine and land-based sources combined, with shipping locally responsible for a highly significant fraction of the total.
In summary, the study showed that control of shipping emissions might play a useful role in the cost-effective achievement of environmental targets for acidification in Europe, whilst control of shipping in port was shown to greatly benefit the immediate local environment. It may be more beneficial to both the environment and for ease of implementation to apply controls to ships in port or to categories of shipping that tend to remain close to the shore, rather than applying a blanket abatement control across the whole of the North Sea. A rapid decline in cost-
Colvile et al., 2000. The transport sector as a polluter
13
effectiveness of placing control on ships was observed with distance from the shore. However, the degree of significance of emissions from shipping is rather clouded by uncertainties in the modelling approach. This is in contrast to control of road transport for which there is no question that its significance in abatement strategies is very great.
5 Discussion
5.1. Implications of scientific uncertainty
In section 4, we examined three specific impacts of transport on the atmospheric environment. In each case, factors exist to magnify the impact of transport emissions relative to other source types, and attempts have been made to quantify the impact to inform policy to control the emissions. This analysis reveals three distinct approaches to uncertainty depending on how well we are able to quantify each impact of the pollution of which transport is the source:
• For acidification, cause and effect is well established and source-receptor relationships are relatively well known, such that detailed cost-benefit studies are already being used to inform policy. In recent years, these have begun to include some quantitative analysis of uncertainty. When the small contribution of marine transport emissions are included in the calculations, it is debatable whether or not abatement of these emissions from marine transport is cost-effective other than in areas adjacent to ports, such that it is important to include analysis of uncertainty to avoid drawing conclusions that are in reality not supported by the data.
• For global atmospheric change due to aircraft emissions, the uncertainties are great and it is difficult to say whether or not a large impact could occur. Action to protect the stratospheric ozone layer has therefore focussed more on terrestrial sources of ozone-depleting chemicals than on aviation. For climate change, some attempts at reducing greenhouse gas emissions have been made, but it is now almost certainly inevitable that climate change will occur as a result of past polluting activity. The emphasis here is therefore on improving predictions of the likelihood and nature of catastrophic change so that we can plan strategies to adapt if this does occur (Watson et al., 1996).
For urban air pollutants from road traffic, and their effects on human health, there remain some uncertainties concerning both the existence and the mechanisms of cause-and-effect, especially for particulate air pollution and NO2, which are currently two of the pollutants causing most concern. However, if we apply a precautionary principle in assuming that the damage is occurring and is attributable to transport emissions, we do have sufficient evidence to attempt a quantification of the magnitude of the effects including the economic cost of the impact of road transport emissions on health.
5.2. The current emphasis on abatement of road traffic emissions
During the 20th Century, the major response of transport to the general level of certainty discussed above, that environmental damage can be attributed to air pollution emissions, has been to reduce the emissions per vehicle from road transport. Table 4 (CONCAWE (1997), EC (1996)) shows how the emissions of CO, hydrocarbons, NOx and particulate matter have been reduced in Europe, reflecting the ability of technology to deliver reductions in emissions. The data show how the largest reductions in emissions have already taken place, with projections that further reductions will be possible by the introduction of on-board diagnostic systems, in-service emissions testing, recall programmes and fuel quality improvements (CONCAWE, 1997). These reductions in petrol and diesel engined vehicle emissions are sufficient to leave little room for improvement by switching to alternative hydrocarbon fuels such as natural gas or vegetable oil. The only cleaner option, as far as local emissions are concerned, is for a zero-emissions vehicle powered by electricity or hydrogen fuel cells. For such vehicles, it is important to consider, however, the total environmental impact of their use, as the air pollution emissions from remote generation of electricity or production of hydrogen fuel could possibly exceed the exhaust emissions that a conventional vehicle would produce. The main advantage of zero-emission vehicles is that the emissions can be relocated to where they are further from human receptors, so benefits to human health can be obtained while other environmental impacts are not reduced (see Fig. 1). The major advantage of non fossil fuel hydrocarbon energy sources is that their contribution to carbon emissions to the atmosphere is offset by the return of carbon from the atmosphere to whichever crop is grown to provide the oil.
CEC (1996) studied seven European cities and investigated whether or not the then proposed improvements in petrol and diesel-engined vehicle and fuel technology would be sufficient to meet health-related air quality standards in Europe. With the exception of Athens, where the geographical situation and climate make air quality an especially difficult problem, the study concluded that technological improvements would eliminate widespread exceedences of current health-related air quality standards by the end of the first decade of the 21st century, but that limited local air quality problems would remain. It is proposed that these should be dealt with by means of local traffic management initiatives (Royal Commission, 1994). For example, altering road design can reduce traffic speed or acceleration, or can reallocate road space taking it away from cars and reserving it for buses and bicycles, hence physically restricting the volume of traffic. Where rapid intervention is required, without the delay associated with planning and financing physical changes in road design, speed limits as low as 30 km h-1 can be used, and physical traffic calming only subsequently introduced where speeds remain too high (such a combination of approaches has been used in Hamburg, for example). Economic disincentives for drivers to enter or remain in polluted areas can be unpopular, but have been applied in several cities, such as area licensing in Singapore and cordon pricing in Bergen and Oslo, although air pollution control is often not the main reason for applying such measures. Reduction of road traffic can in theory be achieved by encouraging lone drivers to share their cars with others who make similar journeys, for example by high vehicle-occupancy lanes that are well-established on motorways in Los Angeles and Washington and were more recently introduced in Amsterdam. In Athens, a more integrated approach to chronic transport-related air pollution problems is being used, where the relocation of the airport is supposed to result in improved air quality. It is noteworthy that this development is also justified on the grounds that it allows for increase in air traffic that would not have been possible with the airport in its former, highly polluted urban location. The trend in many cities is thus away from taxation of vehicle ownership, purchase and fuel which are rather ineffective at controlling emissions, to measures designed to have an impact on traffic more specifically on certain congested roads. The public protests in recent months in many European
Colvile et al., 2000. The transport sector as a polluter
14
Community member states may accelerate the trend away from fuel taxation, but whether widespread use of road pricing and congestion charging will be any more acceptable to our democratic societies remains to be seen.
5.3. Potential for further increased pressure on road transport
As discussed in section 3, the emphasis on urban air quality that we find in many cities at the end of the 20th Century is not new, but this is the first time transport has been primarily blamed for this. In many countries, attempting to reduce road traffic instead of building infrastructure for its growth is a major change in policy. It is the first time traffic reduction has been considered in London since Hackney coaches, the 17th century precursors of the taxi, caused such problems of congestion in the 1650s that Cromwell brought in regulations for their control (Hudson, 1998). The extent to which air pollution control is likely to continue to exert pressure on road transport into the 21st Century will differ from city to city. Three main categories of urban area can be identified:
1. Already highly motorised cities in countries with low population growth (or slow population decline) where existing air quality standards are likely to be met by a combination of reduction in emissions per vehicle and reduction of traffic volumes;
2. Cities where there remains huge potential for growth of private car ownership, often also in countries experiencing rapid population growth and urbanisation;
3. Cities where local topography, meteorology and climate give rise to especially difficult air pollution climatology, usually photochemical smog.
For the first category only, there is a possibility that pressure for further control of road transport will reduce and be balanced or partially reversed by the very great demand for freedom of movement, especially in North America. Alternatively, however, one of two developments could cause the pressure to be maintained, at least for one or two decades.
The most probable is that air quality standards will be progressively tightened as technology and integrated transport system development steadily becomes able to deliver ever lower emissions. Our review of the major issues in section 4.1 included an emphasis on particulate air pollution, which is already providing a good example of this trend. The revelation that large areas of London might require no abatement of road traffic emissions additional to those already projected to occur by wider adoption of the latest existing exhaust clean-up technologies (Carruthers et al., 1999) was widely greeted with disbelief. Speculation was voiced that the European Union’s allowance of 35 days per year exceedence of the 50 µg m-3 standard was too generous (an earlier UK air quality target was more exacting but had been relaxed). Indeed it is appropriate that tighter standards should be applied as long as costs to meet them are not considered to be excessive, as epidemiological studies have not yet shown any evidence of a threshold below which there is no effect of PM10 on health. Indeed, future tighter standards are proposed for particulates that are close to background levels in some parts of Europe. However, these will be increasingly difficult to meet, especially as exhaust emissions are abated to the level where they are hardly a significant contribution to the total particulate mass even at busy roadside locations. Resuspended dust from roads includes sufficient particles below 10 µm in size for it to begin to dominate PM10 emissions from road transport as exhaust emissions are reduced. Unless toxicological and epidemiological evidence can specifically exclude this aerosol fraction from being responsible for adverse effects of particulate air pollution on human health, even zero (exhaust) emissions vehicles will therefore require control from being capable of causing the most stringent proposed PM10 air quality standards to be exceeded. Conversely, if current toxicological studies confirmed by future epidemiological investigation can demonstrate that ultrafine particles are the fraction of PM10 responsible for most of the observed health effects, then increased attention in future is likely to be focused on rather low concentrations of exhaust particulates from petrol as well as diesel engined vehicles.
Even in the absence of tighter air quality standards, there are arguments for environmental improvement by road traffic reduction. This is in recognition that the effects of air pollution emissions from road transport are far from being the largest road transport related impact on population health. In addition to road accident risk, large but very poorly quantified health benefits of road traffic reduction include increased physical exercise associated with most modes of transport other than the private car (British Medical Association, 1998).
In Eastern European, Asian and South American cities, car ownership is still much lower than the western norm, and economic growth brings with it the expectation that more people will drive cars. Air quality is already much worse in cities such as Mexico City (Borja-Aburto et al. 1997) and Beijing (Xu et al. 1995) than would be considered acceptable by Western European or North American populations today. At the time of writing, alarmingly high levels of local urban air pollution in Dacca following rapid conversion of the city’s transport system of bicycle rickshaws to polluting two-stroke engines (Hussain, 2000) is likely soon to become the focus of rapid action to control transport emissions of air pollution. Many such rapidly growing cities are also in climate regions prone to photochemical smog, such that items 2 and 3 in the list at the beginning of this section will coincide where large numbers of the 21st Century global population will live. Not only are the effects of tropospheric ozone on human health becoming clearer; its impact on crops are a source of worry as we try to feed a population that is still growing rapidly, and the scale of increase in levels of ozone is sufficiently for it to become a global problem not a regional one.
There is some advantage to be gained by developing economies adopting new technology more rapidly than was the case in Europe and North America, but this is unlikely to be sufficient to deliver acceptable air quality due to the rapid growth and very high population density over large area. In addition, due to the inconsistencies in fuel quality and less advanced engine designs, very good quality catalysts would have to be fitted to achieve the same level of reduction in emissions as in the West. The longevity of the heavily engineered cars of the 1950s and 1960s in some third world cities where a dry climate prevents rapid corrosion is remarkable.

Colvile et al., 2000. The transport sector as a polluter
15
It remains to be seen how the nations where these cities are found will respond. Developing countries could introduce schemes to prevent the growth of dependence on the private car that has occurred elsewhere, or alternatively will simply follow a number of years behind North America and Western Europe in allowing such a culture to develop in the name of progress before the problems become so severe that action cannot be delayed any further. It is possible, irrespective of the need to limit transport emissions to atmosphere, that 21st Century cities in what today are rapidly industrialising areas of the world will simply be too large for their transport systems to bear any resemblance at all to those in the 20th Century’s so-called modern cities, and that the sheer scale of the demand for mobility will necessarily result in the development of efficient systems that deliver environmental sustainability as a side effect of greatly improved efficiency in moving people and goods relative to existing methods.
5.4. Future dominant transport and air pollution issues beyond urban air quality and roads
The large reductions in emissions of NOx, VOCs and CO resulting from the use of a three-way catalyst, plus the indirect elimination of lead from vehicle exhaust as vehicles equipped with catalysts are required to run on unleaded fuel, are widely believed to outweigh any undesirable side-effects. Disadvantages from use of catalytic converters include increased emissions of CO2, N2O and NH3. It is difficult to assess the extent to which CO2 emissions have increased as a result of fitting catalytic converters, because improvements in fuel economy have been made at the same time as development of the engine management systems that are required to minimise NOx and VOC emissions. While emissions of N2O have been suggested by some authors to increase by as much as a factor of ten (Wade et al. (1994), de Soete and Sharp (1991), Dasch (1992)), N2O is responsible for only a few per cent of the total global warming potential of road transport emissions (Wade et al. (1994), OECD (1993), Gwilliam (1993)), so only a small increase in CO2 emissions would have a greater impact. The contrast is stark between reductions of more than 90% in emissions of pollutants of concern to urban air quality at the same time as pollutants responsible for global warming stay approximately constant or, in cases where larger cars become fashionable, are allowed to increase. Even in a country such as Bangladesh, where changes in sea level and monsoon rainfall due to climate change have a very great impact, it is the local air quality in the capital city that has caused transport emissions of air pollution to come under scrutiny (see above). In global carbon emissions negotiations so far, there has been an emphasis on the industrialised world reducing its fossil fuel consumption first, and the majority global population who currently consume much less energy per capita not being expected to pay for the damage due to the mobility and prosperity that the wealthy minority have enjoyed. If these attitudes continue to prevail, it is likely that urban air quality will continue to enjoy more prominence than climate change in exerting pressure on urban road transport world-wide. There have in the recent past, however, been decades when acidification or global warming have competed with urban air quality for highest prioritisation, and it is likely that this will occur again. As the problem of urban air quality is being solved, others are once again rising to the fore.
If the rapidly-forced climate system suddenly exhibits a marked non-linear or chaotic mode-switching response however, this is likely to return suddenly to being the biggest air pollution problem world-wide, as is already happening anyway rather more slowly. Transport will thus in future be examined more closely than hitherto for the magnitude of its contribution to greenhouse gas emissions, although by then it will probably be too late to bring about reversal of the damage to the atmosphere other than very slowly. Even if future climate change assessments provide more certain predictions of the impact of further emissions, the moral and political issues of who should pay will not go away.
In our analysis of three case studies of impacts of transport emissions of air pollution, the impact of aviation on the global atmosphere was found to be subject to the greatest scientific uncertainty. At the same time, aviation is projected to grow rapidly, for example Archer (1993) quoted global growth of 6.5% per year in the first ten years of the 21st century with as rapid as 12% for international and 20% for domestic air travel in China. In a highly competitive industry, a recent development is the entrance of low-cost airlines who intend to make money by stimulating growth of the demand for air travel. Furthermore, a new fleet of supersonic aircraft, if widely adopted, will be likely to alter radically the impact of aircraft emissions on the atmosphere, on account of the higher altitude at which they fly compared with current aircraft. The only factor preventing the number of aircraft movements from expanding at the same rate as the growth in traffic is the trend towards larger aircraft. This shifts the burden from increasingly congested air space to limited capacity of airports on the ground. Pressure to build more and bigger airport facilities is intense as countries and regions compete to attract air traffic, and protection of the upper troposphere and lower stratosphere is not high on the agenda when airport developments are proposed. Ground-level air quality as well as noise, however, is currently an issue in determining whether or not airport expansion is allowed, for example in the recent enquiry over a fifth terminal at London Heathrow Airport. The consultants’ report submitted by the airport operators to the enquiry (ERM, 1993) specifically states that greenhouse gas emissions and the ozone layer are not considered relevant to the question of whether or not Heathrow should be allowed to expand, and even points out that the impact of airport-related emissions of NOx and VOCs on tropospheric ozone will be felt too far away to be of relevance to the planning application process. Unless the atmospheric pollution agenda changes, we are this faced with the prospect of the major constraint on upper troposphere and lower stratosphere emissions being imposed indirectly by way of restrictions on airport expansion because of concern over ground-level air quality due to primary emissions in the immediate vicinity of the airport, which is a far from coherent approach to the application of atmospheric science to transport development.
Of our three case studies, the most mature branch of atmospheric science considered was acidification. Here, cause and effect is proven at least as far as the link between precursor emissions and deposition to the ground is concerned. Unlike the other two examples, it has therefore been possible to carry out rather detailed attempts to evaluate the emissions abatement strategies economically using integrated assessment modelling. We found, however, that scientific uncertainty still needs to be taken into account, but that it is playing a rather different role in the assessment of the environmental impact of air pollution emissions from marine transport. Instead of leading to debate as to whether or not action needs to be taken, the debate is concerned with how much action is justified, at what price, who should pay
Colvile et al., 2000. The transport sector as a polluter
16
and what is the most efficient way of protecting the environment. Even without the application of technology to reduce emissions, the contribution of transport by sea and inland waterway to air pollution is much less per unit mass carried per unit distance travelled than other modes, especially transport by air. At present, however, the global economy is often willing to pay the environmental price of air travel in return for the benefit of the journey times that can be achieved. It is also difficult to make direct comparisons between short-term, local impacts and much longer-term impacts that may be greatest thousands of kilometres away from the beneficiaries of the transport responsible for the emissions. Integrated assessment modelling has not yet been widely applied to comparison of such markedly different impacts as on urban air quality and upper troposphere chemistry, but its application to future integrated transport systems, especially where there are conflicts between local and global environmental priorities, has the potential to be extremely valuable and would therefore be an intellectually challenging and worthwhile development to pursue.
6 Conclusions and recommendations
Our comparison of the distinct impacts of air pollution emissions from three different modes of transport illustrates how the way in which transport is currently being managed is influence by the extent to which good scientific understanding and ability to make quantitative estimates of the magnitude of impacts are available (see summary in section 5.1). Looking to the future, the global potential for growth of the transport sector is immense, and greatly reduced air pollution emissions per person-km could be a most welcome side-effect of more efficient integrated transport systems that will be required to meet demand for mobility of people and goods over short and long distances. There remains a need to continue research to improve our understanding of the mechanisms leading to impacts of air pollution emissions from transport, to reduce uncertainty in our ability to quantify relationships between all emissions and all impacts.
The scale of the current preoccupation with the effects of local air pollution emissions from road transport on the health of urban human populations does appear to be temporary despite its continuing importance for the coming one to two decades, especially in more recently industrialising countries of the world. As road transport for the first time becomes subject to widespread demand management to meet environmental objectives, unrestrained growth of aviation starts to appear unfashionable. Some of the largest gaps in our understanding of transport impacts of air pollution emissions are also concerned with aviation emissions and their impact on global atmospheric chemistry. Future atmospheric science research should therefore be integrated more effectively with transport research, including urban air quality and human health impacts research directed to the needs of large developing cities, in order to contribute to the stimulation of more imaginative and sustainable development of future integrated local and global transport systems on our increasingly crowded planet. It is hoped that this Millennium Review can provide some stimulus for discussion of what the priorities for such research should be.
Acknowledgements
Emma Hutchinson gratefully acknowledges receipt of a CASE studentship from the UK Economics and Social Research Council and the British Geological Survey. Jennifer Mindell’s research is supported by Kensington & Chelsea and Westminster Health Authority, and Rachel Warren’s by the UK Department of the Environment, Transport and the Regions. Roy Colvile acknowledges receipt of support for research on air pollution and transport from the UK Engineering and Physical Science Research Council through contracts GR/L91085 and GR/M70773, and from the Rees Jeffreys Road Fund, which also form a contribution to the EUROTRAC urban air pollution sub-project SATURN.
References
Alcamo, J., Krol, M. and Posch, M., 1995. An integrated analysis of sulfur emissions, acid deposition and climate change. Water, Air and Soil Pollution 85, 1539-1550. Alcamo, J., Shaw, R., and Hordijk, L. (Eds), 1990. The RAINS Model of Acidification: Science and Strategies in Europe, Kluwer Academic Publishers, Dordrecht, The Netherlands. Amman, M., Bertok, I., Cofala, J., Gyarfas, F., Heyes, C., Klimont, Z., Makowski, M., Schopp, W. and Syri, S., 1999. Seventh Interim Report: Cost-effective Control of Acidification and Ground-level Ozone, International Insititute for Applied Systems Analysis, Laxenburg, Austria. Anderson, H.R., Spix, C., Medina, S., Schouten, J.P., Castellsagué, J., Rossi, G., Zmirou, D., Touloumi, G., Wojtyniak, B., Pönkä, A., Bachárová, L., Schwartz, J. and Katsouyanni, K., 1997. Air pollution and daily admissions for chronic obstructive pulmonary disease in 6 European cities: Results from the APHEA project. European Respiratory Journal 10, 1064-1071. APEG (Atmospheric Particles Expert Group) 1999. Source Apportionment of Airborne Atmospheric Fine Particulate Matter in the United Kingdom. Report to the UK Department of Environment, Transport and the Regions. Apling, A.J., Sullivan, E.J., Williams, M.L., Ball, D.J., Bernard, R.E., Derwent, R.G., 1977. Ozone concentrations in South East England during the summer heatwave of 1976. Nature 269, 569-573. ApSimon, H.M., Warren, R.F., Wilson. J.J.N., 1994. The Abatement Strategies Assessment Model – ASAM: Applications to Reductions of Sulphur Dioxide Emissions Across Europe, Atmospheric Environment 28, 649-663. ApSimon, H.M., Warren, R.F., 1996. Transboundary Air Pollution in Europe, Energy Policy 24, 631-640. ApSimon, H.M. et al., 1998. Costs and Benefits of Controlling Sulphur Dioxide Emissions from Ships in the North Sea and the Seas to the West of Britain, report to UK DETR. Archer, L., 1993. Aircraft emissions and the environment. Oxford Institute for Energy Studies Papers on Energy and the Environment EV17, ISBN 0948061 79 0. Ashmore, M.R., Bell, J.N.B., Dalpra, C., Runeckles, V.C., 1980. Visible injury of crop species by ozone in the United Kingdom. Environmental Pollution 21, 209-215. Atkinson, R.W., Anderson, H.R., Strachan, D.P., Bland, J.M., Bremner, S.A., Ponce de Leon, A., 1999. Short-term associations between outdoor air pollution and visits to accident and emergency departments in London for respiratory complaints. European Respiratory Journal 13(2), 257-65.

Colvile et al., 2000. The transport sector as a polluter
17
Bach, W., 1985. Waldsterben: our dying forests – part III. Forest dieback: extent of damage and control strategies. Experientia 41(9), 1095-1104. Barrett, K., Seland, O., 1995. EMEP/MSC-W Report 1/95, European Transboundary Air Pollution: 10 years calculated fields and budgets to the end of the first Sulphur Protocol, EMEP MSC-W, Norweigan Meteorological Institute, P.O. Box 43-Blindern, N-0313 Oslo 3, Norway. Barrett, M., 1991. Aircraft pollution – environmental impacts and future solutions. World Wide Fund for Nature research paper. BMA (British Medical Association) 1998. Health and environmental impact assessment, Earthscan Publications, London. Biétry M., 1999. Lenteur coupable. Le Figaro 20 April 1999, p2. Borg, H., 1986. Metal speciation in acidified mountain streams in Central Sweden. Water, Air & Soil Pollution 30, 1007-1014. Borja-Aburto, V.H., Loomis, D.P., Bangdiwala, S.I., Shy, C.M., Rascon-Pacheco, R.A., 1997. Ozone, suspended particulates, and daily mortality in Mexico City. American Journal of Epidemiology 145, 258-268. Bowler, C., Brimblecombe, P., 1991. Battersea Power Station and environmental issues. Atmospheric Environment 25(1), 143-151. Bradford Hill, A., 1965. The environment and disease: association or causation? Proceedings of the Royal Society of
Medicine 58, 295-300. Braun-Fahrländer, C., Ackermann-Liebrich, U., Schwartz, J., Gnehm, H.P., Rutishauser, M., Wanner, H.K., 1992. Air pollution and respiratory symptoms in preschool children. American Review of Respiratory Disease 145, 42-47. Briggs, D.J., Collins, S., Elliott, P., Fischer, P., Kingham, S., Lebret, E., Pryl, K., van Reeuwijk, H., Smallbone, K., van der Veen, A., 1997. Mapping urban air pollution using GIS: a regression-based approach. International Journal of
Geographical Information Science 11(7), 699-718. Brimblecombe, P., 1987. The Big Smoke: a history of air pollution in London since medieval times. London: Methuen. Brunekreef, B., Dockery, D.W. and Krzyzanowski, M., 1995. Epidemiologic studies on short-term effects of low levels of major ambient air pollution components. Environmental Health Perspectives 103(S2), 3-13. Brunekreef, B., Janssen, N.A.H., de Hartog, J., Harssema, H., Knape, M., Van, V.P., 1997. Air pollution from truck traffic and lung function in children living near motorways. Epidemiology 8, 298-303. BRE (Buildings Research Establishment), 1998. Personal Exposure to Air Pollutants in Hertfordshire: Final Report. BRE Ltd. Watford, UK. Buckingham, C., Clewley, L., Hutchinson, D., Sadler, L., Shah, S., 1997. London Atmospheric Emissions Inventory. London Research Centre, ISBN 1 85261 267 3. Carruthers et al., 1999. Report of Third Stage Review and Assessment of Air Quality to the Central London Cluster Group of local authorities. Cambridge Environmental Research Consultants, Cambridge UK. Carter, W., 1987. Quoted in The Times. Headline: Huge tides threaten to engulf Britain. Castellsagué, J., Sunyer, J., Saez, M., Antó, J.M., 1995. Short-term association between air pollution and emergency room visits for asthma in Barcelona. Thorax 50, 1051-1056. CEC (Commission of the European Communities) 1996. Communication from the Commission to the European Parliament and the Council on a future strategy for the control of atmospheric emissions from road transport taking into account the results from the Auto/Oil programme. COM(96) 248. Catalogue Number CB-CO-96-310-EN-C, ISSN 0254-1475, ISBN 92-78-05787-8. Office for Official Publications of the European Communities, Luxembourg. Chan, C.C., Spengler, J.D., Özkaynak, H., Lefkopoulou, M., 1991. Commuter exposures to VOCs in Boston, Massachusetts. Journal of the Air and Waste Management Association 41, 1594-1600. Clemitshaw, K. C., 2000. Millennium Review on tropospheric photochemistry. CONCAWE, 1997. Motor Vehicle Emission Regulations and Fuel Specifications. Part 2: Detailed Information and Historic Review (1970-1996). Report no 6/97. CONCAWE Brussels. COMEAP (Department of Health Committee on the Medical Effects of Air Pollutants), 1998. Quantification of the effects of air pollution on health in the United Kingdom. HMSO, London. Cragg C, 1992. Cleaning up Motor Car Pollution. Financial Times, London. Dabberdt et al., 1973. Street canyon measurements. Dasch, J.M., 1992. Nitrous Oxide Emissions from Vehicles. Journal of the Air and Waste Management Association. 42(1), 63-67. De Soete, G., Sharp, 1991. Nitrous Oxide Emissions: Modifications as a Consequence of Current Trends in Industrial Fossil Fuel Combustion and In Land Use. European Commission Report EUR 13473 EN, Luxembourg. Delves, H.T., 1998. Overview of UK and international studies on trends in blood lead and the use of lead isotope ratios to identify environmental sources. In: Gompertz, D. (Ed.), IEH Report on Recent UK Blood Lead Surveys. Institute for Environmental Health, Leicester, UK. Delves, H.T., Campbell, M.J., 1993. Identification and apportionment of sources of lead in human tissue. Environtal
Geochemistry and Health. 15, 75-84. Den Boeft, J., Eerens, H.C., den Tonkelaar, W.A.M., Zandfeld, P.Y.J., 1996. CAR International: A simple model to determine city street air quality. Science of the Total Environment 190, 321-326. DoE (UK Department of the Environment), 1990. UK Blood Lead Monitoring Program 1984-1987. Pollution Report No 28. HMSO, London. DoE (UK Department of the Environment), 1995. Digest of Environmental Statistics. No 17. HMSO, London. DoH (UK Department of Health Ad-Hoc Group on the Economic Appraisal of the Health Effects of Air Pollution), 1999. Economic appraisal of the health effects of air pollution. The Stationery Office, London. DoH (UK Department of Health Advisory Group on the Medical Aspects of Air Pollution Episodes), 1993. Third report: Oxides of nitrogen. The Stationery Office, London.
Colvile et al., 2000. The transport sector as a polluter
18
DETR (UK Department of the Environment, Transport and the Regions), 1997. Environmental Transport Association. Road User Exposure to Air Pollution. A Literature Review. DETR, London. DETR (UK Department of the Environment, Transport and the Regions), 1998. Transport Statistics for Great Britain 1998. The Staionery Office, London. Diaz-Sanchez, D., 1997. The role of diesel exhaust particles and their associated polyaromatic hydrocarbons in the induction of allergic airway disease. Allergy 52, 52-56. Dockery, D.W., 1993. Epidemiologic study design for investigating respiratory health effects of complex air pollution mixtures. Environmental Health Perspectives 101, 187-191. Dockery, D.W., Pope, C.A.I., Xu, X., Spengler, J.D., Ware, J.H., Fay, M.E., Ferris, B.G., Jr., Speizer, F.E., 1993. An association between air pollution and mortality in six U.S. cities. New England Journal of Medicine 329, 1753-1759. Dockery, D.W., Schwartz, J., Spengler, J.D., 1992. Air pollution and daily mortality: associations with particulates and acid aerosols. Environtal Research 62, 362-373. Donaldson, Lord of Lymington. Safer ships, cleaner seas. Inquiry into the prevention of pollution from merchant shipping. Cm 2560. HMSO, London. Dore, A.J., Sobik, M., Migala, K., 1999. Patterns of precipitation and pollutant deposition in the western Sudete mountains, Poland. Atmospheric Environment 33 (20), 3301-3312. Downing, C.E.H., Vincent, K.J., Campbell, G.W., Fowler, D., Smith, R.I., 1995. Trends in wet and dry deposition of sulphur in the United Kingdom. Water Air and Soil Pollution 85 (2), 659-664. Driscoll, C.T.,Jr., Baker, J.P., Bisogni, J.J.,Jr., Schofield, C.L., 1980. Effect of aluminium speciation on fish in dilute acidified waters. Nature 284, 161-164. EC (European Commission), 1996. On a Future Strategy for the Control of Atmospheric Emissions from Road Transport Taking into account the Results from the Auto Oil Programme. COM (96) 248 Final. Commission of the European Communities. Elliott P, Cuzick J, English D, Stern R, (eds.) 1992 Geographical and Environmental Epidemiology: Methods for Small-Area Studies. Oxford University Press, Oxford. Ellison, J.M., Waller, R.E., 1978. A review of sulphur oxides and particulate matter as air pollutants with particular reference to effects on health in the United Kingdom. Environtal Research 16, 302-325. Elwood J.A., 1988. Causal Relationships in Medicine. Oxford University Press, Oxford. EPAQS (Expert Panel on Air Quality Standards), 1994. Benzene. HMSO, London. EPAQS (Expert Panel on Air Quality Standards), 1994. Carbon Monoxide. HMSO, London. EPAQS (Expert Panel on Air Quality Standards), 1998. Lead. London: TSO. ERL (Environmental Resources Limited), 1993. Terminal 5 Heathrow, Environmental Statement. BAA plc, Crawley, West Sussex. ERR (Earth Resources Research), 1990. Atmospheric emissions from the use of transport in the UK, Volume 2, The effect of alternate policies. World Wide Find for Nature, London. Cited in: Whitelegg, J., 1993. Transport for a sustainable future. The case for Europe. Belhaven Press, London. ISBN 1852931469. Eyre, N.J., Ozdemiroglu, E., Pearce, D.W., Steele, P., 1997. Fuel and location effects on the damage costs of transport emissions. Journal of Transport Economics and Policy 31, 5-24. Fairley, D., 1990. The relationship of daily mortality to suspended particulates in Santa Clara County, 1980-1986. Environmental Health Perspectives 89, 159-168. Faiz, A., 1993. Automotive emissions in developing countries – relative implications for global warming, acidification and urban air quality. Transportation Research 27 (3), 167-186. Faiz, A., Weaver, C.S., Walsh, M.P., 1996. Air Pollution from Motor Vehicles: Standards and Technologies for Controlling Emissions. The World Bank, Washington. Farman, J.C., 1987. Recent measurements of total ozone at British Antarctic Survey stations. Philosophical
Transactions of the Royal Society of London, Series A. 323, 629-644. Farman, J.C., Gardiner, B.G., 1987. Ozone depletion over Antarctica. Nature 329, 574. Ferin, J., Oberdörster, G., Soderholm, S.C., Gebein, R., 1991. Pulmonary tissue access of ultrafine particles. Journal of
Aerosol Medicine 4, 57-58. Filliger P., Puybonnieux-Texier V., Schneider J., 1999. Health costs due to road traffic-related air pollution. An impact assessment project of Austria, France and Switzerland. PM10 population exposure. Technical report on air pollution. GVF-Report nr 326 – TEH05. Federal Department for Environment, Transport, Energy and Communications Bureau for Transport Studies, Bern. Forbes, W.H., Sargent, F., Roughton, F.J.W., 1945. The rate of carbon monoxide uptake by normal men. American
Journal of Physiology 143, 594-608. Garcia-Aymerich J, Tobias A, Antó JM, Sunyer J., 2000. Air pollution and mortality in a cohort of patients with chronic obstructive pulmonary disease: a time series analysis. Journal of Epidemiology and Community Health 54(1), 73-4. Gilmour, P.S., Brown, D.M., Lindsay, T.G., Beswick, P.H., MacNee, W., Donaldson, K., 1996. Adverse health effects of PM10 particles: involvement of iron in generation of hydroxyl radical. Occupational and Environmental Medicine 53, 817-822. Gover, M.P., Collings, S.A., Hitchcock, G.S., Moon, D.P., Wilkins, G.T., 1996. Alternative road transport fuels – a preliminary life-cycle study for the UK. Volume 1. HMSO, London. Gried, H., Simon, B., 1990. Pollutant emissions of existing and future engines for commercial aircraft, p.43-83. In: Schumann, U. (Ed.) Air traffic and the environment – background tendencies and potential global atmospheric effects. Proceedings of a DLR International Colloquium 15/16 November 1990. Lecture notes in Engineering, 60. Springer-Verlag, Berlin. Grossinho, A., Gulliver, J., Briggs, D., Machin, F., Tate, J., Ashmore, M., Catena, B., Elliott, P., 1999. Air pollution assessment of Northampton school children using a network model. Epidemiology 10, S104.
Colvile et al., 2000. The transport sector as a polluter
19
Grubb, M., Koch, M., Munson, A., Sullivan, F., Thomson, K., 1993. The Earth Summit Agreement, a guide and assessment. Energy and Environment Programme, Royal Institute of International Affairs. Earthscan Publications, London. ISBN 1853831778. Grubb, M., 1999. The Kyoto Protocol, a guide and assessment. Energy and Environment Programme, Royal Institute of International Affairs. Earthscan Publications, London. ISBN 1853835811. Gwilliam, K.M., 1993. On reducing transport's contribution to global warming. In: Transport Policy and Global Warming. European Conference of Ministers of Transport (ECMT). ECMT, Paris. Hajat, S., Haines, A., Goubet, S.A., Atkinson, R.W., Anderson, H.R., 1999. Association of air pollution with daily GP consultations for asthma and other lower respiratory conditions in London. Thorax 54, 597-605. Hampton, M., 1991. Cycling towards low prices. Petroleum Economist 58 (4). Hasselblad, V., Eddy, D.M., Kotchmar, D.J., 1992. Synthesis of environmental evidence: nitrogen dioxide epidemiology studies. Journal of the Air and Waste Management Association 42, 662-671. Heck, R.M., Farrauto, R.J., 1995. Catalytic Air Pollution Control: Commercial Technology. Van Nostrand Reinhold, International Thomson Publishing, New York. Holgate, S.T., Commins, B.T., Anderson, H.R., 1995. Asthma and outdoor air pollution. Department of Health Committee on the Medical Effects of Air Pollutants. HMSO, London. Houghton, J. (Chairman), 1994. Transport and the environment, Eighteenth Report of the Royal Commission on Environmental Pollution, Cm 2674. The Stationery Office, London. ISBN 0-10-137522-0. Houghton, J. (Chairman), 1997. Transport and the environment – developments since 1994. Twentieth Report of the Royal Commission on Environmental Pollution, Cm 3752. The Stationery Office, London. ISBN 0-10-137522-0. Houghton, J.T., Meira Filho, L.G., Callander, B.A., Harris, N., Kattenberg, A., Maskell, K., (Eds.), 1996. Climate change 1995, the science of climate change. Oxford University Press. Hoydysh W.G. and Dabberdt W.F., 1988. Kinematics and dispersion characteristics of flows in asymmetric street canyons. Atmospheric Environment 22 (12), 2677-2689. Hoydysh and Dabberdt, 1994. Concentration fields and urban intersections: fluid modelling studies. Atmospheric
Environment 28 (11), 1849-1860. Hudson R. (Ed.), 1998. London, Portrait of a City. The Folio Society, London. Hunter L.J., Johnson G.T., Watson I.D., 1992. An investigation of 3-dimensional characteristics of flow regimes within the urban canyon. Atmospheric Environment 26 (4), 425-432. Hussain, M., 2000. Dreadful effect of air pollution on childhealth: worsening situation in Dhaka city. Bangladesh
Environmental Newsletter 11 (1), 1-2. Ihrig, M. M., Shalat, S. L., Baynes, C., 1998. A hospital-based case-control study of still births and environmental exposure to arsenic using an atmospheric dispersion model linked to a geographical information system. Epidemiology 9, 290-294. Inglis, D.W.F., Choularton, T.W., Wicks, A.J., Fowler, D., Leith, I.D., Werkman, B., Binnie, J., 1995. Orographic enhancement of wet deposition in the United Kingdom: Case studies and modelling. Water Air and Soil Pollution 85 (4), 2119-2124. Interdepartmental Group on Costs and Benefits, 1999. An Economic Analysis of the National Air Quality Strategy Objectives. UK Department of the Environment, Transport and the Regions, London. IPCS (International Programme on Chemical safety)., 1991. Platinum. (Environmental Health Criteria: 125). United Nations Environment Programme, International Labour Organisation and WHO, Geneva. ISO (International Standards Organisation) 1997. ISO 14040 Environmental management – life cycle assessment – principles and framework. ISO, Geneva. Jansson, N., 1998. Personal Exposure to Airborne Particulates, Validity of Outdoor Concentrations as a Measure of Exposure in Time Series Studies. PhD thesis, Ontwerp van Vorheen de Toekomst, Wageningen, The Netherlands. Jantunen, M.J., Hänninen, O., Katsouyanni, K., Knöppel, H., Kuenzlii, N., Lebret, E., Maroni, M., Saarela, K., Sram, R., Zmirou, D., 1998. Air pollution exposure in European cities: The ‘EXPOLIS’-study. Journal of Exposure Analysis and
Environmental Epidemiology 8(4), 495-518. Jarvis, D., Burney, P., 1998. The epidemiology of allergic disease. British Medical Journal 316, 607-610. Johnson Matthey, 1998. Personal communication. Johnson Matthey, 1999. Platinum 1999. Johnson Matthey. London, UK. Johnson, C., Henshaw, H., McInnes, G., 1992. Impact of aircraft and surface emissions of nitrogen oxides on tropospheric ozone and global warming. Nature 355, 69-71. Johnson, C.E., Collins, W.J., Stevenson, D.S., Derwent, R.G., 1999. Relative roles of climate and emissions changes on future tropospheric oxidant concentrations. Journal of Geophysical Research 104(D15), 18631-18645. Johnson et al., 1973. Street canyon measurements. Jost, P., Hassel, D., Weber, F.J., Sonnborn, K.-S., 1992. Emission and fuel consumption modelling based on continuous measurements. Deliverable Nr. 7 of the DRIVE PROJECT V 1053: Modelling of emissions and consumption in urban areas – MODEM. TŐV Rheinland Institut főr Umweltschutz und Energietechnik, Stabsabteilung Verkehr und Umwelt, Postfach 10 17 50, D-5000, Kıln 1, Germany. Kandler, O., Innes, J.L., 1995. Air pollution and forest decline in Central Europe. Environmantl Pollution 90(2), 171-180. Khandelwal, P., 1999. An assessment of personal exposure to PM2.5 for bicycle commuters in Central London using personal measurements and applications of dispersion modelling. MSc dissertation, Imperial College Centre for Environmental Technology. Krishna, M.T., Chauhan, A.J., 1996. Air pollution and health. Journal of the Royal College of Physicians, London 30, 448-452. Kukadia, V. and Palmer, J., 1998. The Effect of External Atmospheric Pollution on Indoor Air Quality: A Pilot Study, Energy in Buildings 27, 223.

Colvile et al., 2000. The transport sector as a polluter
20
Künzli, N., Kaiser, R., Medina, S., Studnicka. M., Oberfeld, G., Horak, F., 1999. Health costs due to road traffic-related air pollution. An impact assessment project of Austria, France and Switzerland. Air pollution attributable cases. Technical report on epidemiology. GVF-Report nr 326 – TEH06. Federal Department for Environment, Transport, Energy and Communications Bureau for Transport Studies, Bern. Lebowitz, M.D., Collins, L., Holberg, C.J., 1987. Time series analyses of respiratory responses to indoor and outdoor environmental phenomena. Environmental Research 43, 332-341. Lee, I.Y. and Park H.M., 1994. Parametrisation of pollutant transport and dispersion in urban street canyons. Atmospheric Environment 28 (14), 2343-2349. Lewin, T., 1998. (Editor Automotive Environmental Analyst, FT Newsletter) Personal communication. Li, X.Y., Brown, D., Smith, S., MacNee, W., Donaldson, K., 1999. Short-term inflammatory responses following intratracheal instillation of fine and ultrafine carbon clack in rats. Inhalation Toxicology 11(8), 709-731. Linn, W.S., Shamoo, D.A., Anderson, K.R., Peng, R.-C., Avol, E.L., Hackney, J.D., Gong, H.J., 1996. Short-term air pollution exposures and responses in Los Angeles area schoolchildren. Journal of Exposure Analysis & Environmental
Epidemiology 6, 449-472. Lipfert, F.W., Wyzga, R.E., 1995. Air pollution and mortality: issues and uncertainties. Journal of the Air & Waste
Management Association 45, 949-966. Lipsett, M., Hurley, S., Ostro, B., 1997. Air pollution and emergency room visits for asthma in Santa Clara County, California. Environmental Health Perspectives 105, 216-222. Lloyd’s Register of Shipping, 1995. Marine Exhaust Emissions Research Programme, London, UK. LRC (London Research Centre), 1999. Atmospheric emissions inventories. Web pages at http://www.london-research.gov.uk/et/ETemiss.htm. Lowles, I., ApSimon, H.M., 1996. The Contribution of Sulphur Dioxide Emissions from Ships to Coastal Acidification. International Journal of Environmental Studies 51, 21-34. LPAC (London Planning and Advisory Committee) 1999. Reducing road traffic in London. Proposed strategy. LPAC, London. Maddison, D., Pearce, D., 1999. Costing the health effects of poor air quality. In: Holgate, S.T., Samet, J.M., Koren, J.M., Maynard, R.L. (Eds.), Air Pollution and Health. Academic Press, London. Maddison, D, Pearce, D, Johansson, O, Calthrop, E, Litman, T, Verhoef, E., 1996. The True Costs of Road Transport. Blueprint 5. CSERGE. Earthscan Publications Ltd, London. McCormick, J., 1997. Acid Earth, the politics of acid pollution. Earthscan publications Ltd., London. Third Edition. McGavran, P. D., Rood, A. S., Till, J. E., 1999. Chronic beryllium disease and cancer risk estimates with uncertainty for beryllium released to the air from the rocky flats plant. Env.Health Persp. 107, 731-744. McHugh, C.A., Carruthers, D.J., Edmunds, H.A., 1997. ADMS-Urban: an air quality management system for traffic, domestic and industrial pollution. International Journal of Environmental Pollution 8(3-6), 666-674. Miyamoto, T., 1997. Epidemiology of pollution-induced airway disease in Japan. Allergy 52, 30-34. Montreal Protocol, 1987. Montreal protocol on substances that deplete the ozone layer, Montreal, 16 September 1987. HMSO, London, Treaty Series No. 19(1990). ISBN 0101097727. Morgan, G., Corbett, S., Wlodarcyzk, J., Lewis, P., 1998. Air pollution and daily mortality in Sydney, Australia, 1989 through 1993. American Journal of Public Health 88, 759-764. Murphy, S.A., BeruBe, K.A., Pooley, F.D., Richards, R.J., 1998. Response of lung epithelium to well characterised fine particles. Life Sciences 62 (19), 1789-1799. Ninan, T.K., Russell, G., 1992. Respiratory symptoms and atopy in Aberdeen schoolchildren: evidence from two surveys 25 years apart. British Medical Journal 304, 873-875. Olaiz, G., Fortoul, T.I., Rojas, R., Doyer, M., Palazuelos, E., Tapia, C.R., 1996. Risk factors for high levels of lead in blood of school children in Mexico City. Archives of Environmental Health. 51, 122-25. Ostro, B., Chestnut, L., 1998. Assessing the health benefits of reducing particulate matter air pollution in the United States. Environmental Research 76, 94-106. Ostro, B.D., Chestnut, L.G., Mills, D.M., Watkins, A.M., 1999. Estimating the effects of air pollutants on the population: Human health benefits of sulphate aerosol reductions under Title IV of the 1990 Clean Air Act Amendments. In: Holgate, S.T., Samet, J.M., Koren, J.M., Maynard, R.L. (Eds.), Air Pollution and Health. Academic Press, London. OECD (organisation for Economic Co-operation and Development), 1988. Transport and the environment. OECD, Paris. OECD (Organisation for Economic Co-operation and Development), 1993. Cars and Climate Change. Energy and Environment Series. OECD/IEA, Paris. OECD (Organisation for Economic Co-operation and Development), 1995. Motor Vehicle Pollution: Reduction Strategies beyond 2010. OECD, Paris. Pantazopoulou, A., Katsouyanni, K., Kourea-Kremastinou, J., Trichopoulos, D., 1995. Short-term effects of air pollution on hospital emergency outpatient visits and admissions in the greater Athens, Greece area. Environmenatl Research 69, 31-36. Penner, J.E., Lister, D.H., Griggs, D.J., Dokken, D.J., McFarland, M. (Eds.), 1999. Aviation and the global atmosphere. Special report of IPCC Working Groups I and III in collaboration with the Scientific Assessment Panel to the Montreal Protocol on Substances that Deplete the Ozone Layer. Cambridge University Press, Cambridge. Perera, F., 1981. Carcinogenicity of airborne fine particulate benzo(a)pyrene: an appraisal of the evidence and the need for control. Environmental Health Perspectives 42, 163-185. Peters, A., Wichmann, H.E., Tuch, T., Heinrich, J., Heyder, J., 1997. Respiratory effects are associated with the number of ultrafine particles. American Journal of Respiratory and Critical Care Medicine 155, 1376-1383. Poloniecki, J.D., Atkinson, R.W., Ponce de Leon, A., Anderson, H.R., 1997. Daily time series for cardiovascular hospital admissions and previous day's air pollution in London, UK. Occupational and Environmental Medicine 54, 535-540.
Colvile et al., 2000. The transport sector as a polluter
21
Ponce de Leon, A., Andersen, H.R., Bland, J.M., Strachan, D.P., Bower, J., 1996. Effects of air pollution on daily hospital admissions for respiratory disease in London between 1987-88 and 1991-92. Journal of Epidemiology and
Community Health 50, S63-S70. Pope, C.A.I., Dockery, D.W., Spengler, J.D., Raizenne, M.E., 1991. Respiratory health and PM10 pollution: A daily time series analysis. American Review of Respiratory Disease 144, 668-674. Pope, C.A.I., Schwartz, J., Ransom, M.R., 1992. Daily mortality and PM10 pollution in Utah Valley. Archives of
Environmental Health 47, 211-217. Posch, M., Hettelingh, J.-P., de Smet, P.A.M., Downing, R.J.(Eds), 1997. Calculation and Mapping of Critical Thresholds in Europe: Status Report 1997, Coordinating Centre for Effects, Rijksinstitut Voor Volksgezondheid en Milieu, Netherlands. QUARG (Quality of Urban Air Review Group), 1993. Diesel vehicle emissions and urban air quality: second report of the Quality of Urban Air Review Group. Institute of Public and Environmental Health, University of Birmingham. Quarry, J. (Ed.), 1992. Earth Summit 1992. Regency Press, London. ISBN 09520469-0-3. Rototest AB and Nature Associates, 1998. Ammonia emissions from cars with three-way catalytic converters. Rototest Sweden. RNMI, 1994. Report by Royal Netherlands Meteorolgical Institute to the Ministry of Transport, June 1994, cited in Royal Commission, 1994. Romieu, I., Meneses, F., Ruiz, S., Sienra, J.J., Huerta, J., White, M.C., Etzel, R.A., 1996. Effects of air pollution on the respiratory health of asthmatic children living in Mexico City. American Journal of Respiratory and Critical Care
Medicine 154, 300-307. Samaras, Z., Kyriakis, N., Zachariadis, Th., 1995. Reconciliation of macroscale and microscale motor vehicle emission estimates. The Science of the Total Environment 169, 231-239. Sandall, P., 1999. The rail freight no idling policy – a framework for assessment of the environmental benefits. MSc thesis, Imperial College Centre for Environmental Technology. Scaperdas, A., Colvile, R., 1999. Assessing the representativeness of monitoring data from an urban intersection site in Central London, UK. Atmospheric Environment 33, 661-674. Scarlett, J.F., Abbott, K.J., Peacock, J.L., Strachan, D.P., Anderson, H.R., 1996. Acute effects of summer air pollution on respiratory function in primary school children in southern England. Thorax 51, 1109-1114. Schwartz, J., 1993. Air pollution and daily mortality in Birmingham, Alabama. American Journal of Epidemiology 137, 1136-1147. Schwartz, J., 1994. What are people dying of on high air pollution days? Environmental Research 64, 26-35. Schwartz, J., 1996. Air pollution and hospital admissions for respiratory disease. Epidemiology 7, 20-28. Schwartz, J., Spix, C., Touloumi, G., Bachárová, L., Barumamdzadeh, T., Le, T.A., Piekarksi, T., Ponce de Leon, A., Pönkä, A., Saez, M., Schouten, J.P., Rossi, G., 1996. Methodological issues in studies of air pollution and daily counts of deaths or hospital admissions. Journal of Epidemiology and Community Health 50, S3-S11. Schwartz, J., Spix, C., Wichmann, H.-E., Malin, E., 1991. Air pollution and acute respiratory illness in five German communities. Environmental Research 56, 1-14. SMEPB (Shanghai Municipality Environmental Protection Bureau), 1994. Shanghai Environmental Quality Bulletin. SMEPB, Shanghai. Sheppard D, Wong WS, Uehara CF, Nadel JA, Boushey HA. (1980) Lower threshold and greater bronchomotor responsiveness of asthmatic subjects to sulfur dioxide. American Review of Respiratory Disease 122, 873-878. Shi, J. P., Harrison, R. M., Brear, F., 1999. Particle size distribution emitted from a modern diesel engine. The Science
of the Total Environment 235, 305-317. Sillman, S., 1999. The relation between ozone, NOx and hydrocarbons in urban and polluted rural environment. Atmospheric Environment 33, 1921-1845. Sitzmann, B., Kendall, M., Watt, J., Williams, I., 1996. Personal exposure study of cyclists to airborne particulate matter in London. Journal of Aerosol Science, 27, S499 – S500. Smith, K.R., Aust, A.E., 1997. Mobilization of iron from urban particulates leads to generation of reactive oxygen species in vitro and induction of ferritin synthesis in human lung epithelial cells. Chem.Res.Toxicol. 10, 828-834. Smith, M., 1998. Studies of lead and chldren's IQ with respect to blood lead levels of the populations studied. In: Gompertz, D. (Ed.), Report on Recent UK Blood Lead Surveys. Institute for Environmental Health, Leicester, UK. Sommer, H., Seethaler, R., Chanel, O., Herry, M., Masson, S., Vergnaud, J.-C., 1999. Health costs due to road traffic-related air pollution. An impact assessment project of Austria, France and Switzerland. Economic evaluation. Technical report on economy. GVF-Report nr 326 – TEH07 Federal Department for Environment, Transport, Energy and Communications Bureau for Transport Studies, Bern. Spix, C., Anderson, H.R., Schwartz, J., Vigotti, M.A., LeTerte, A., Vonk, J.M., Touloumi, G., Balducci, F., Piekarski, T., Bachárová, L., Tobias, A., Pönkä, A., Katsouyanni, K., 1998. Short-term effects of air pollution on hospital admissions of respiratory diseases in Europe: A quantitative summary of APHEA study results. Archives of Environmental Health 53, 54-64. Stanners, D., Bordeau, P., 1995. The Dobris Assessment. European Environment Agency. ISBN 92 826 5409 5. Stoddard, J.L., Jeffries, D.S., Lukewille, A., Clair, T.A., Dillon, P.J., Driscoll, C.T., Forsius, M., Johannessen, M., Kahl, J.S., Kellogg, J.H., Kemp, A., Mannio, J., Monteith, D.T., Murdoch, P.S., Patrick, S., Rebsdorf, A., Skjelkvale, B.L., Stainton, M.P., Traeen, T., van Dam, H., Webster, K.E., Wieting, J., Wilander, A., 1999. Regional Trends in Aquatic Recovery from Acidification in North America and Europe, Nature, 401, 575-578. Sunyer, J., Spix, C., Quenel, P., Ponce de Leon, A., Barumandzadeh, T., Touloumi, G., Bachárová, L., Wojtyniak, B., Vonk, J., Bisanti, L., Schwartz, J., Katsouyanni, K., 1997. Urban air pollution and emergency admissions for asthma in four European cities: The APHEA project. Thorax 52, 760-765.
Colvile et al., 2000. The transport sector as a polluter
22
Timonen, K.L., Pekkanen, J., 1997. Air pollution and respiratory health among children with asthmatic or cough symptoms. American Journal of Respiratory and Critical Care Medicine 156, 546-552. Touloumi, G., Katsouyanni, K., Zmirou, D., Schwartz, J., Spix, C., Ponce de Leon, A., Tobias, A., Quennel, P., Rabczenko, D., Bachárová, L., Bisanti, L., Vonk, J.M., Ponka, A., 1997. Short-term effects of ambient oxidant exposure on mortality: a combined analysis within the APHEA project. Air Pollution and Health: a European Approach. American
Journal of Epidemiology 146, 177-185. Ulrich, B., 1990. Waldsterben: forest decline in West Germany. Environmental Science and Technology 24(4), 436-441. UNECE (United Nations Economic Commission for Europe), 1994. Protocol to the 1979 Convention on Long Range Transboundary Air Pollution on Further Reduction of Sulphur Emissions, Oslo. US EPA (United States Environmental Protection Agency), 1990. Cancer Risks from Outdoor Exposure to Air Toxics. Vol 1, Final Report. Washington DC, USA. US EPA (United States Environmental Protection Agency), 1993. Motor Vehicle Related Air Toxic Sstudy. Public Review Draft. Washington DC, USA. US EPA (United States Environmental Protection Agency), 1999. Current EPA Emission Factor and Inventory Guidance and Resource Material. ClearingHouse for Inventories and Emissions Factors, Info CHIEF, Emission Factor and Inventory Group (MD-14), Office of Air Quality Planning and Standards, US EPA, Research Triangle Park, NC 27711. Also available at http://www.epa.gov/ttn/chief/doclist.pdf. Wade, J., Holman, C., Fergusson, M., 1994. Passenger Car Global warming Potential: Current and projected levels in the UK. Energy Policy. 22(6), 509 - 522. Wadge, A., 1999. Lead. In: Holgate, S.T., Samet, J.M., Koren, J.M., Maynard, R.L., Air Pollution and Health. Academic Press, London. Walters, S., Ayres, J., 1996. The health effects of air pollution. Chapter 11 of Harrison, R. (Ed), Pollution causes, effects and control Third edition. Royal Society of Chemistry. Wang, Y., Thornton, I., Farago, M.E., 1997. Changes in lead concentrations in the home environment in Birmingham, England over the period 1984 to 1996. The Science of the Total Environment. 207, 149-156. Warren, R.F., ApSimon, H.M., 2000. Uncertainties in Integrated Assessment Modelling of Abatement Strategies:
Illustrations with the ASAM Model, Journal of Environmental Science & Policy in press. Watson, R.T., Zinyowera, M.C., Moss, R.H. (Eds.), 1996. Climate change 1995 – Impacts, adaptions and mitigation of climate change: scientific-technical analyses – contribution of Working Group II to the Second Assessment Report of the Intergovernmental Panel on Climate Change. Oxford University Press. Weston, K., Fowler, D., 1991. The importance of orography in spatial patterns of rainfall acidity in Scotland. Atmospheric
Environment 25 (8), 1517-1522. Wordley, J., Walters, S., Ayres, J.G., 1997. Short term variations in hospital admissions and mortality and particulate air pollution. Occupational and Environmental Medicine 54, 108-116. Whitelegg, J., 1993. Transport for a sustainable future: the case for Europe. Belhaven Press, London, ISBN 1 85293 146 9. WHO (World Health Organisation, Regional Office for Europe), 1995. Lead and Health. WHO, Copehagen. WHO (World Health Organisation, Regional Office for Europe), 1996. Update and Revision of the Air Quality Guidelines for Europe. Meeting of the Working Group on Volatile Organic Compounds, Brussels, Belgium, 2 - 6 October 1995. WHO, Copenhagen. WRI (World Resources Institute), 1990. Climate Change: A Global Concern. Oxford University Press. New York, USA. WSL (Warren Springs Laboratory), 1992. The global distribution of aircraft air pollution emissions. Warren Springs Laboratory, Stevenage, UK. Yamartino R.J. and Wiegand G., 1986. Development and evaluation of simple models for the flow, turbulence and pollutant concentration fields within an urban street canyon. Atmospheric Environment 20 (11), 2137-2156. Yang, J.S., Kang, S.K., Park, I.J., Rhee, K.Y., Moon, Y.H., Sohn, D.H., 1996. Lead concentration in blood among the general population of Korea. International Archives of Occupational and Environmental Health 68, 199-202. Xu, X., Ding, H., Wang, X., 1995. Acute effects of total suspended particles and sulfur dioxides on preterm delivery: A community-based cohort study. Archives of Environmental Health 50, 407-415. Zmirou, D., Barumamdzadeh, T., Balducci, F., Ritter, P., Laham, G., Ghilhardi, J.-P., 1996. Short term effects of air pollution on mortality in the city of Lyon, France, 1985-90. Journal of Epidemiology and Community Health 50, S30-S35.
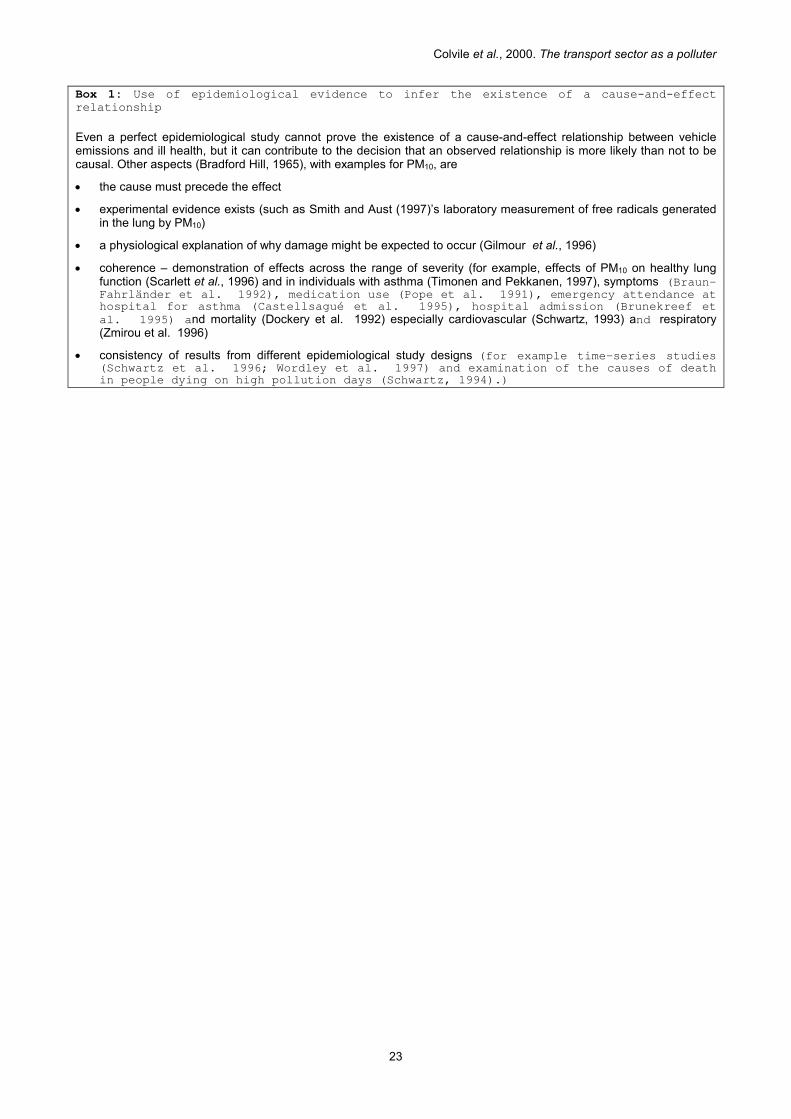
Colvile et al., 2000. The transport sector as a polluter
23
Box 1: Use of epidemiological evidence to infer the existence of a cause-and-effect
relationship
Even a perfect epidemiological study cannot prove the existence of a cause-and-effect relationship between vehicle emissions and ill health, but it can contribute to the decision that an observed relationship is more likely than not to be causal. Other aspects (Bradford Hill, 1965), with examples for PM10, are
• the cause must precede the effect
• experimental evidence exists (such as Smith and Aust (1997)’s laboratory measurement of free radicals generated in the lung by PM10)
• a physiological explanation of why damage might be expected to occur (Gilmour et al., 1996)
• coherence – demonstration of effects across the range of severity (for example, effects of PM10 on healthy lung function (Scarlett et al., 1996) and in individuals with asthma (Timonen and Pekkanen, 1997), symptoms (Braun-Fahrländer et al. 1992), medication use (Pope et al. 1991), emergency attendance at hospital for asthma (Castellsagué et al. 1995), hospital admission (Brunekreef et
al. 1995) and mortality (Dockery et al. 1992) especially cardiovascular (Schwartz, 1993) and respiratory (Zmirou et al. 1996)
• consistency of results from different epidemiological study designs (for example time-series studies (Schwartz et al. 1996; Wordley et al. 1997) and examination of the causes of death in people dying on high pollution days (Schwartz, 1994).)

Colvile et al., 2000. The transport sector as a polluter
24
Table 1. Summary of associations between NO2 and human health
Effect of daily rise in NO2 Reference
Increase in total mortality Touloumi et al. (1997)
Cardiovascular deaths Zmirou et al. (1996)
Asthma emergency hospital admissions Sunyer et al. (1997)
Chronic obstructive pulmonary disease hospital admissions Anderson et al. (1997)
Cardiovascular disease hospital admissions, especially heart attack and angina
Poloniecki et al. (1997)
Hospital visits for asthma Castellsagué et al. (1995)
Croup in pre-school children Schwartz et al. (1991)
All emergency hospital admissions especially for the elderly Ponce de Leon et al. (1996)
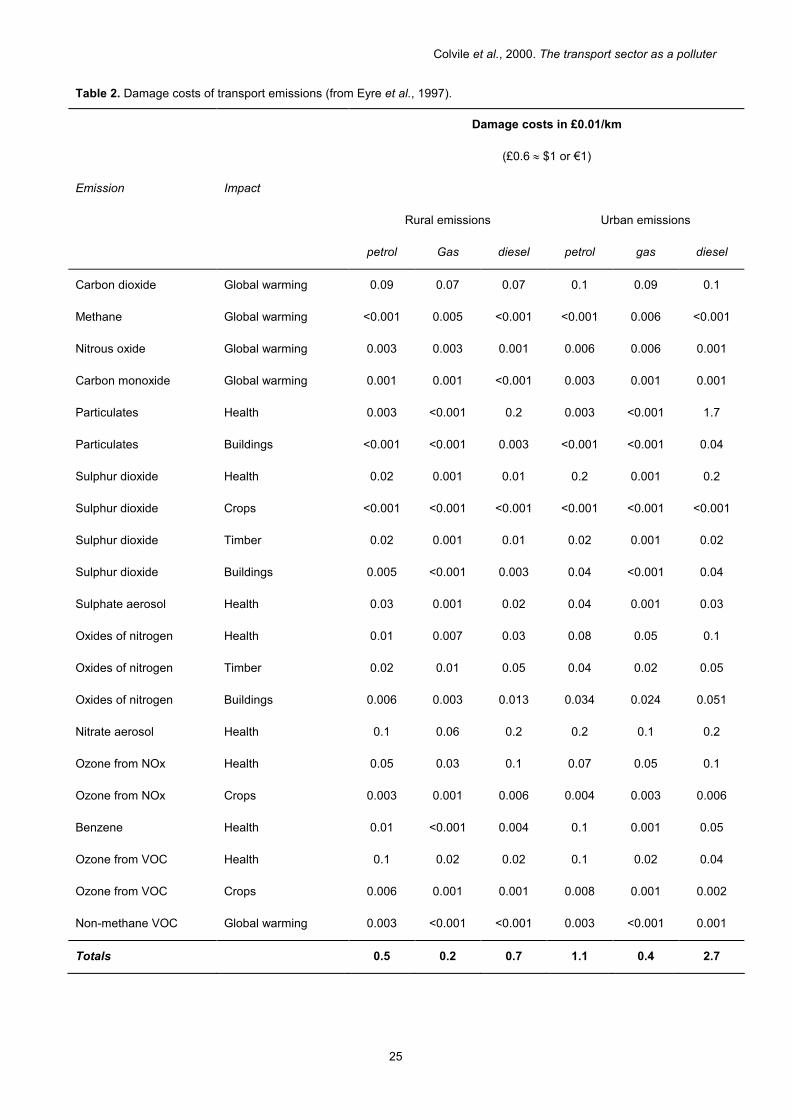
Colvile et al., 2000. The transport sector as a polluter
25
Table 2. Damage costs of transport emissions (from Eyre et al., 1997).
Emission
Impact
Damage costs in £0.01/km
(£0.6 ≈ $1 or €1)
Rural emissions Urban emissions
petrol Gas diesel petrol gas diesel
Carbon dioxide Global warming 0.09 0.07 0.07 0.1 0.09 0.1
Methane Global warming <0.001 0.005 <0.001 <0.001 0.006 <0.001
Nitrous oxide Global warming 0.003 0.003 0.001 0.006 0.006 0.001
Carbon monoxide Global warming 0.001 0.001 <0.001 0.003 0.001 0.001
Particulates Health 0.003 <0.001 0.2 0.003 <0.001 1.7
Particulates Buildings <0.001 <0.001 0.003 <0.001 <0.001 0.04
Sulphur dioxide Health 0.02 0.001 0.01 0.2 0.001 0.2
Sulphur dioxide Crops <0.001 <0.001 <0.001 <0.001 <0.001 <0.001
Sulphur dioxide Timber 0.02 0.001 0.01 0.02 0.001 0.02
Sulphur dioxide Buildings 0.005 <0.001 0.003 0.04 <0.001 0.04
Sulphate aerosol Health 0.03 0.001 0.02 0.04 0.001 0.03
Oxides of nitrogen Health 0.01 0.007 0.03 0.08 0.05 0.1
Oxides of nitrogen Timber 0.02 0.01 0.05 0.04 0.02 0.05
Oxides of nitrogen Buildings 0.006 0.003 0.013 0.034 0.024 0.051
Nitrate aerosol Health 0.1 0.06 0.2 0.2 0.1 0.2
Ozone from NOx Health 0.05 0.03 0.1 0.07 0.05 0.1
Ozone from NOx Crops 0.003 0.001 0.006 0.004 0.003 0.006
Benzene Health 0.01 <0.001 0.004 0.1 0.001 0.05
Ozone from VOC Health 0.1 0.02 0.02 0.1 0.02 0.04
Ozone from VOC Crops 0.006 0.001 0.001 0.008 0.001 0.002
Non-methane VOC Global warming 0.003 <0.001 <0.001 0.003 <0.001 0.001
Totals 0.5 0.2 0.7 1.1 0.4 2.7
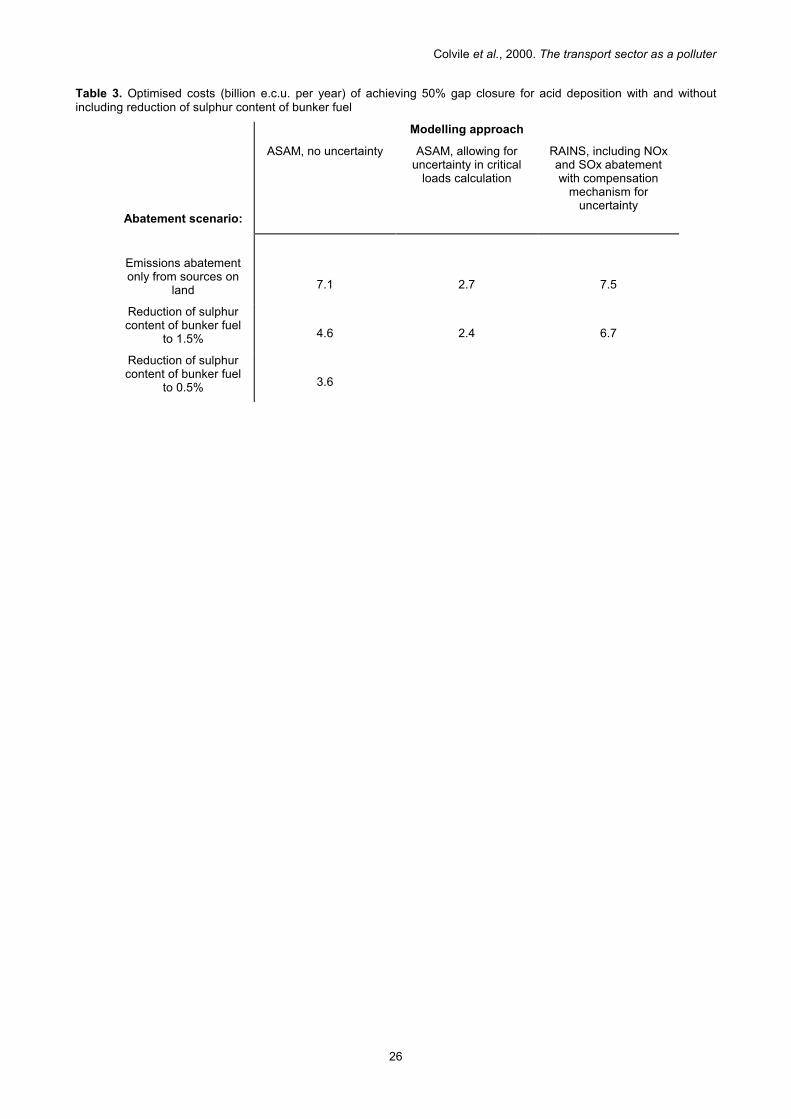
Colvile et al., 2000. The transport sector as a polluter
26
Table 3. Optimised costs (billion e.c.u. per year) of achieving 50% gap closure for acid deposition with and without including reduction of sulphur content of bunker fuel
Modelling approach
Abatement scenario:
ASAM, no uncertainty ASAM, allowing for uncertainty in critical loads calculation
RAINS, including NOx and SOx abatement with compensation mechanism for uncertainty
Emissions abatement only from sources on
land
7.1
2.7
7.5
Reduction of sulphur content of bunker fuel
to 1.5%
4.6
2.4
6.7
Reduction of sulphur content of bunker fuel
to 0.5%
3.6
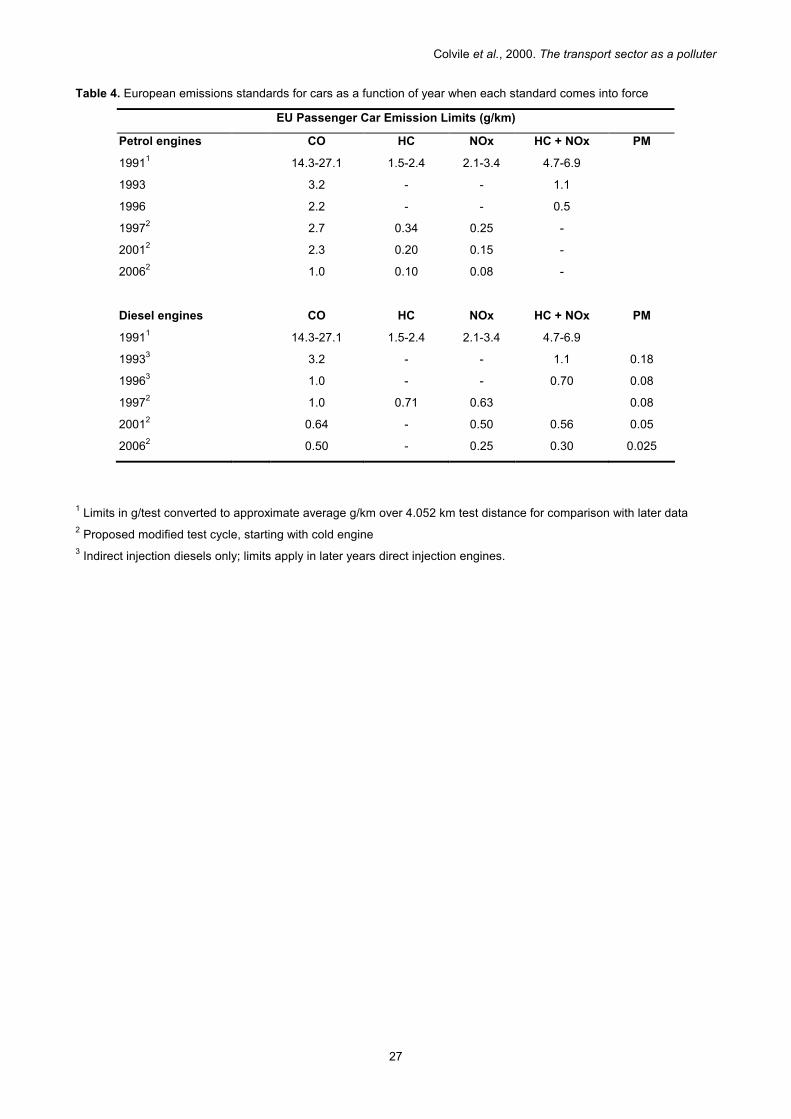
Colvile et al., 2000. The transport sector as a polluter
27
Table 4. European emissions standards for cars as a function of year when each standard comes into force
EU Passenger Car Emission Limits (g/km)
Petrol engines CO HC NOx HC + NOx PM
19911 14.3-27.1 1.5-2.4 2.1-3.4 4.7-6.9
1993 3.2 - - 1.1
1996 2.2 - - 0.5
19972 2.7 0.34 0.25 -
20012 2.3 0.20 0.15 -
20062 1.0 0.10 0.08 -
Diesel engines CO HC NOx HC + NOx PM
19911 14.3-27.1 1.5-2.4 2.1-3.4 4.7-6.9
19933 3.2 - - 1.1 0.18
19963 1.0 - - 0.70 0.08
19972 1.0 0.71 0.63 0.08
20012 0.64 - 0.50 0.56 0.05
20062 0.50 - 0.25 0.30 0.025
1 Limits in g/test converted to approximate average g/km over 4.052 km test distance for comparison with later data 2 Proposed modified test cycle, starting with cold engine 3 Indirect injection diesels only; limits apply in later years direct injection engines.

Colvile et al., 2000. The transport sector as a polluter
28
Figures
1. Life-cycle hydrocarbon emissions including methane for light goods vehicles as a function of fuel type.
2. a) emissions of fine particles smaller than 10 µm aerodynamic diameter in London in 1995/6; b) UK emissions of carbon dioxide in 1988.
3. The range and scale of health impacts associated with ambient air pollution (adapted from Walters and Ayres (1996), bold upright type), compared with range and scale of similar examples of impacts of road transport other than those attributable to exhaust emissions (light italic type).
4. Pollutant emissions from aircraft during phases of flight (after Royal Commission (1993), citing Gried and Simon (1990)) (Estimates were made of emissions of NOx, hydrocarbons and CO during the landing and take-off (LTO) cycle and cruise phase of a General Electric CF6-50C engine with a 30 minute period of cruising at Mach 0.85 and an altitude of 10.7 km. SLTO = ICAO Standard Landing and Take-Off cycle.)