the transmission dynamics of equine herpesvirus type …
TRANSCRIPT

University of Kentucky University of Kentucky
UKnowledge UKnowledge
Theses and Dissertations--Veterinary Science Veterinary Science
2012
THE TRANSMISSION DYNAMICS OF EQUINE HERPESVIRUS TYPE THE TRANSMISSION DYNAMICS OF EQUINE HERPESVIRUS TYPE
1 (EHV-1) INFECTION IN OUTBREAKS CHARACTERIZED 1 (EHV-1) INFECTION IN OUTBREAKS CHARACTERIZED
PREDOMINATELY BY NEUROLOGIC OR RESPIRATORY ILLNESS PREDOMINATELY BY NEUROLOGIC OR RESPIRATORY ILLNESS
Barry Jay Meade University of Kentucky, [email protected]
Right click to open a feedback form in a new tab to let us know how this document benefits you. Right click to open a feedback form in a new tab to let us know how this document benefits you.
Recommended Citation Recommended Citation Meade, Barry Jay, "THE TRANSMISSION DYNAMICS OF EQUINE HERPESVIRUS TYPE 1 (EHV-1) INFECTION IN OUTBREAKS CHARACTERIZED PREDOMINATELY BY NEUROLOGIC OR RESPIRATORY ILLNESS" (2012). Theses and Dissertations--Veterinary Science. 4. https://uknowledge.uky.edu/gluck_etds/4
This Doctoral Dissertation is brought to you for free and open access by the Veterinary Science at UKnowledge. It has been accepted for inclusion in Theses and Dissertations--Veterinary Science by an authorized administrator of UKnowledge. For more information, please contact [email protected].

STUDENT AGREEMENT: STUDENT AGREEMENT:
I represent that my thesis or dissertation and abstract are my original work. Proper attribution
has been given to all outside sources. I understand that I am solely responsible for obtaining
any needed copyright permissions. I have obtained and attached hereto needed written
permission statements(s) from the owner(s) of each third-party copyrighted matter to be
included in my work, allowing electronic distribution (if such use is not permitted by the fair use
doctrine).
I hereby grant to The University of Kentucky and its agents the non-exclusive license to archive
and make accessible my work in whole or in part in all forms of media, now or hereafter known.
I agree that the document mentioned above may be made available immediately for worldwide
access unless a preapproved embargo applies.
I retain all other ownership rights to the copyright of my work. I also retain the right to use in
future works (such as articles or books) all or part of my work. I understand that I am free to
register the copyright to my work.
REVIEW, APPROVAL AND ACCEPTANCE REVIEW, APPROVAL AND ACCEPTANCE
The document mentioned above has been reviewed and accepted by the student’s advisor, on
behalf of the advisory committee, and by the Director of Graduate Studies (DGS), on behalf of
the program; we verify that this is the final, approved version of the student’s dissertation
including all changes required by the advisory committee. The undersigned agree to abide by
the statements above.
Barry Jay Meade, Student
Dr. Peter J. Timoney, Major Professor
Dr. Daniel K. Howe, Director of Graduate Studies

THE TRANSMISSION DYNAMICS OF EQUINE HERPESVIRUS TYPE 1 (EHV-1) INFECTION IN OUTBREAKS CHARACTERIZED PREDOMINATELY BY
NEUROLOGIC OR RESPIRATORY ILLNESS
DISSERTATION
A dissertation submitted in partial fulfillment of the requirements for the degree of Doctor of Philosophy in the
College of Agriculture at the University of Kentucky
By
Barry Jay Meade
Lexington, Kentucky
Director: Dr. Peter J. Timoney, Professor of Veterinary Science
Lexington, Kentucky
2012
Copyright © Barry Jay Meade 2012

ABSTRACT OF DISSERTATION
THE TRANSMISSION DYNAMICS OF EQUINE HERPESVIRUS TYPE 1 (EHV-1) INFECTION IN OUTBREAKS CHARACTERIZED PREDOMINATELY BY
NEUROLOGIC OR RESPIRATORY ILLNESS Formalized epidemiological field investigations were conducted to compare and
contrast the transmission dynamics of EHV-1 neurological disease among horses stabled at Churchill Downs Racetrack, Louisville, Kentucky and of EHV-1 respiratory illness among horses stabled in the student barn at Murray State University. Differences were assessed by means of statistical and mathematical modeling techniques applied to survey and biological data collected over the course of the respective disease events.
Regression methods applied to survey data enabled the construction of a
statistical model to predict a date of onset of illness for horses within each equine cohort. Comparisons of the epidemic curves revealed that the Murray State University outbreak was 4.5 times longer (9 weeks versus 14 days) than the Churchill Downs Racetrack event.
Survival analysis was used to explore the relationship between time to infection
for each equine cohort. Horses stabled in the affected barn at Churchill Downs racetrack had a 3.02 times greater daily risk (p < 0.001) for contracting EHV-1 infection relative to horses stabled in the student barn at Murray State University.
Estimates of the basic R0 number, calculated using mathematical formulae that
incorporated the duration of the infectious period for neuropathogenic and non-neuropathogenic strains of EHV-1, were 10.25 and 2.94 for the Churchill Downs racetrack and Murray State University outbreaks, respectively. The generation time for the Churchill Downs outbreak was 6.1 times shorter (0.39 days versus 2.38 days) than for the Murray State University event. An assessment of the temporal occurrence of symptomatic infection is similar for each event and suggests that the appearance of clinical illness is constant over the course of an outbreak.

A Reed-Frost model was constructed for each EHV-1 event where values of the transmission parameters (q, p and k) were estimated by fitting a model that most closely matched the observed profile of EHV-1 cases. The value of prophylactic vaccination on the spread of EHV-1 was assessed by making adjustments to these fitted models for varying levels of herd immunity. The results indicate that the prevention of EHV-1 neurological illness requires a higher level of herd immunity than EHV-1 respiratory illness.
KEYWORDS: Equine Herpesvirus Type 1, Myeloencephalopathy, Transmission
modeling, Reed-Frost, Herd immunity Barry J. Meade Student’s Signature April 19, 2012 Date

THE TRANSMISSION DYNAMICS OF EQUINE HERPESVIRUS TYPE 1 (EHV-1) INFECTION IN OUTBREAKS CHARACTERIZED PREDOMINATELY BY
NEUROLOGIC OR RESPIRATORY ILLNESS
By
Barry Jay Meade
Dr. Peter J. Timoney Director of Dissertation Dr. Daniel K. Howe Director of Graduate Studies April 19, 2012 Date

iii
ACKNOWLEDGMENTS
I am grateful to the United States Department of Agriculture (USDA), Animal
Plant Health Inspection Services (APHIS), Veterinary Services (VS) for granting me the
opportunity to pursue time away from other official duties and for providing financial
support throughout this graduate program.
I would like to extend my sincere appreciation to the members of my graduate
committee: Drs. Peter Timoney, Udeni Balasuriya, Craig Carter, Steve Browning and
the late George Allen for their interest, direction and patience. I would like to offer a
special thanks to Dr. Adam Branscum for his initial help and assistance with the
statistical methods up to the time he left the University of Kentucky to take up an
appointment at another institution.
Dr. Balasuriya’s technical expertise with regard to the molecular characteristics
of equine infectious agents was invaluable to my graduate program. Through my
participation in his research studies of Equine Viral Arteritis studies, I gained valuable
insights and a greater appreciation for experimental methods and study design.
I am very appreciative of the friendship Dr. Carter extended to me and the
advice he has shared concerning perseverance and the attitude that is required when
confronted with the personal and professional challenges.
Dr. Browning’s willingness to join my graduate committee on short notice is
greatly appreciated. His writing skills and knowledge of epidemiological methods are
enviable.
I am very grateful for having known the late Dr. Allen. His attention to detail
and demand for academic rigor has left an indelible impression on me and served me
well throughout my graduate program.

iv
I would like to thank Dr. Jiayou Zhang for his willingness to serve as my outside
examiner. His patience with this process is appreciated.
I am especially indebted to Dr. Peter Timoney, the director of my graduate
program, for his encouragement and guidance throughout this endeavor. His
knowledge and expertise in equine infectious diseases is recognized worldwide. I am
honored that he was willing to mentor me throughout this educational experience.
I am appreciative for the support of and interactions with the faculty, staff, and
graduate students at the Maxwell H. Gluck Equine Research Center. I would like to
thank my colleagues within USDA-APHIS-VS Kentucky for their sustained support and
understanding of the challenges this training program presented.
Words cannot adequately express my appreciation to my family: Sandy,
Nicholas, Andrew, Allyson and Cameron Meade, for their support, encouragement and
sacrifices. I hope my pursuit of this graduate degree serves as an example to my
children of the importance of life-long learning and the need to challenge oneself.

v
TABLE OF CONTENTS
Acknowledgments ........................................................................................................... iii List of Tables ................................................................................................................. viii List of Figures ....................................................................................................................x Chapter One: Introduction ................................................................................................1
A. The research problem .......................................................................................1 B. Review of the literature .....................................................................................2
1. Introduction ...........................................................................................2 2. Epidemiological aspects of EHV-1 infection ........................................6 3. Investigation of EHV-1 disease events ..................................................8 4. Statistical and mathematical modeling ................................................10
a. Predictive modeling .................................................................10 b. Survival analysis ......................................................................12 c. Mathematical modeling ...........................................................15
i. Transmission parameters ..............................................15 (1). Basic reproductive number ...........................15 (2). Transmission intervals ..................................17 (3). Asymptomatic transmission ..........................20
ii. Deterministic modeling ...............................................21
Chapter Two: Material and Methods ..............................................................................27 A. Materials .........................................................................................................27
1. EHV-1 disease events – animals and premises ...................................27 a. Churchill Downs Racetrack, 2005 – Investigative summary ..27 b. Murray State University, 2008 – Investigative summary ........29
2. Personnel and laboratory support ........................................................30 B. Methods ..........................................................................................................30
1. Regulatory protocol .............................................................................30 a. Churchill Downs Racetrack, 2005 ...........................................30 b. Murray State University, 2008 ................................................32
2. Data collection .....................................................................................33 a. Survey questionnaire ...............................................................33 b. Biological sampling .................................................................34
i. Churchill Downs Racetrack, 2005 ................................34 ii. Murray State University, 2008 ....................................35
c. Laboratory techniques for EHV-1 determination ....................35 d. Analytical procedures ..............................................................36
i. Data management .......................................................36 ii. Multivariate linear regression methods ......................38 iii. Survival analysis ........................................................41 iv. Mathematical modeling ..............................................41

vi
Chapter Three: Results ...................................................................................................44 A. Descriptive comparisons of outbreaks ............................................................44 B. Statistical modeling – determination of the date of illness onset for
subclinical cases ..............................................................................................49 1. Churchill Downs Racetrack, 2005 .......................................................49
a. Exploratory data analysis .........................................................49 b. Multivariate linear regression ..................................................50
2. Murray State University, 2008 ............................................................53 a. Exploratory data analysis .........................................................53 b. Multivariate linear regression ..................................................54
C. Survival analysis .............................................................................................57 1. Churchill Downs Racetrack, 2005 .......................................................57 2. Murray State University, 2008 ............................................................59 3. Comparison of survival between outbreak locations ...........................61
D. Mathematical modeling ..................................................................................63 1. Comparison of transmission parameters .............................................63 2. The effective reproductive number, Re ................................................65
a. Churchill Downs Racetrack, 2005 ...........................................65 b. Murray State University, 2008 ................................................67
3. Deterministic modeling (SIR) .............................................................69 a. Reed-Frost models ...................................................................69
i. Churchill Downs Racetrack, 2005 ................................69 ii. Murray State University, 2008 ....................................71
b. Evaluation of herd immunity (HI) ...........................................73
Chapter Four: Discussion ...............................................................................................77 Appendices
Appendix A: Questionnaire for EHV-1 disease event Churchill Downs Racetrack, 2005 .......................................................................................91
Appendix B: Questionnaire for EHV-1 disease event Murray State University, 2008 ......................................................................................94
Appendix C: Summary of clinical and laboratory data for each horse associated with the EHV-1 disease events at Churchill Downs Racetrack in 2005 and Murray State University in 2008 .....................100
Appendix D: Data elements used for model building with the predicted dates of disease onset for each horse associated with the EHV-1 disease events at Churchill Downs Racetrack in 2005 and Murray State University in 2008 ........................................................................103
Appendix E: Calculation of the initial doubling time of EHV-1 cases for each EHV-1 disease event .....................................................................106
Appendix F: Calculation of the basic reproductive number (R0) for each disease event .........................................................................................108
Appendix G: Calculation of the exponential growth rate – r for each EHV-1 disease event .............................................................................110

vii
Appendix H: Calculation of the generation interval of EHV-1 cases for disease event location ............................................................................112
Appendix I: Calculation of the minimum value for Herd Immunity (HI) needed to eliminate the spread of EHV-1 by each event location .........114
Appendix J: R and SAS code ............................................................................116
References .....................................................................................................................127 Vita ................................................................................................................................139

viii
LIST OF TABLES
Table 1.1, Summary of previously reported outbreaks of EHV-1 myeloencephalopathy ................................................................................9
Table 2.1, Description of variables used for regression analysis whereby date of
illness onset was estimated ......................................................................40 Table 3.1, Comparison of diagnostic testing and clinical presentation for each
separate EHV-1 disease event – Churchill Downs Racetrack, 2005 and Murray State University, 2008 .........................................................45
Table 3.2, Characteristics of case and non-case horses – Churchill Downs
Racetrack, 2005 and Murray State University, 2008 ..............................47 Table 3.3, Measures of disease occurrence – comparisons between EHV-1
outbreaks at Churchill Downs Racetrack, 2005 and Murray State University, 2008 ......................................................................................48
Table 3.4, Summary statistics of three continuous variables for all horses stabled
in barn 38 – Churchill Downs Racetrack, 2005 .....................................50 Table 3.5, Summary statistics for response variable and three potential continuous
predictor covariates for symptomatic horses, fever or CNS – Churchill Downs Racetrack, 2005 ...........................................................50
Table 3.6, Main effects model for date of illness onset – Churchill Downs
Racetrack, 2005 .......................................................................................51 Table 3.7, Summary statistics of two continuous variables for 35 horses at risk
for EHV-1 infection stabled in the student barn – Murray State University, 2008 ......................................................................................54
Table 3.8, Summary statistics for response variable and five potential predictor
covariates for the 18 horses with a documented date for illness onset – Murray State University, 2008 ....................................................54
Table 3.9, Main effects model for date of illness onset – Murray State University,
2008 .........................................................................................................55 Table 3.10, Life table for horses located at Churchill Downs Racetrack, 2005 ..............58 Table 3.11, Life table for horses located at Murray State University, 2008 ...................60 Table 3.12, Comparison of survival by location of disease event ...................................62

ix
Table 3.13, Comparison of transmission parameters between EHV-1 outbreaks ...........63 Table 3.14, Estimates of the effective reproductive number (Re) for Churchill
Downs Racetrack EHV-1 event, 2005 .....................................................66 Table 3.15, Estimates of the effective reproductive number (Re) for Murray State
University EHV-1 event, 2008 ................................................................68 Table 3.16, Reed-Frost model for Churchill Downs Racetrack EHV-1 outbreak ...........70 Table 3.17, Reed-Frost model for Murray State University EHV-1 outbreak ................72 Table 3.18, Comparison of the effects of varying levels of herd immunity on
the burden and transmission of illness for each equine cohort ................76

x
LIST OF FIGURES
Figure 1.1, Diagram of the chain of disease transmission in successive cases ...............18 Figure 1.2, Simple epidemic model (SIR) .......................................................................23 Figure 1.3, SIR model for a closed population with differential equations for the
rates of change for the population densities ............................................23 Figure 3.1, Plot of main effects model and diagnostic plots for final regression
model – Churchill Downs Racetrack, 2005 .............................................52 Figure 3.2, Distribution of the number of cases of EHV-1 by date of illness onset,
Churchill Downs Racetrack, 2005 ...........................................................53 Figure 3.3, Plot of main effects model and diagnostic plots for final regression
model – Murray State University, 2008 ..................................................56 Figure 3.4, Distribution of the number of cases of EHV-1 by week of illness onset,
Murray State University, 2008 ................................................................57 Figure 3.5, Kaplan-Meier plot for time to infection for horses located at Churchill
Downs Racetrack, 2005 ...........................................................................59 Figure 3.6, Kaplan-Meier plot for time to infection for horses located at Murray
State University, 2008 ............................................................................61 Figure 3.7, Kaplan-Meier plots for horses during an EHV-1 event, Churchill
Downs Racetrack versus Murray State University ..................................62 Figure 3.8, Comparison of symptomatic and asymptomatic infection for Churchill
Downs EHV-1 disease event, 2005 .........................................................64 Figure 3.9, Comparison of symptomatic and asymptomatic infection for Murray
State University EHV-1 disease event, 2008 ..........................................65 Figure 3.10, Estimates for the parameter Re (effective reproductive number) for
EHV-1 infection occurring in the population of horses stabled at Churchill Downs Racetrack, 2005 ...........................................................67
Figure 3.11, Estimates for the parameter Re (effective reproductive number) for
EHV-1 infection occurring in the population of horses stabled in the student barn at Murray State University, 2008 ..................................69
Figure 3.12, Optimization of the fit of the observed and expected EHV-1 cases
for horses located at Churchill Downs Racetrack, 2005 .........................70

xi
Figure 3.13, Reed-Frost model of EHV-1 outbreak among horses located at Churchill Downs Racetrack, 2005 ...........................................................71
Figure 3.14, Optimization of the fit of the observed and expected EHV-1 cases
for horses located at Murray State University, 2008 ...............................72 Figure 3.15, Reed-Frost model of the EHV-1 outbreak among horses located at
Murray State University, 2008 ................................................................73 Figure 3.16, Comparisons of increasing levels of herd immunity on the
transmission of EHV-1 among horses located at Churchill Downs Racetrack, 2005 .......................................................................................74
Figure 3.17, Comparisons of increasing levels of herd immunity on the
transmission of EHV-1 among horses located at Murray State University, 2008 ......................................................................................75

1
CHAPTER ONE
INTRODUCTION
A. The research problem
Over the past 10-12 years, the number of reported outbreaks of equine herpesvirus
neurologic disease or myeloencephalopathy has increased both in Western Europe and in
North America and, despite the lack of population-based surveillance data, many believe
that this is due to the increased prevalence of neuropathogenic strains is increasing in the
general horse population (Lunn et al., 2009). While the basis for this increase can only be
speculated, it is very probable that the severity of the clinical signs associated with
outbreaks of herpesvirus neurologic disease increases the likelihood of reporting such
occurrences particularly if an outbreak involves a group of horses congregated at a
racetrack or other type of performance venue. Conversely, respiratory illness caused by
EHV-1 in adult horses if it occurs , often goes unreported, as there is little incentive to
actively monitor for such cases of disease or to devote resources to an event that is
commonplace and frequently perceived as of little consequence. Nonetheless, there is a
need to investigate outbreaks of EHV-1 infection where respiratory illness is the primary
clinical feature if for no other reason than to establish a baseline for comparison with
outbreaks of equine herpesvirus infection with more serious clinical outcomes and, perhaps,
clarify the role that subclinical infection plays in the spread of EHV-1.
A recent consensus statement published by the American College of Veterinary
Internal Medicine (ACVIM) identified the need for more research into the pathogenesis and
epidemiology of EHV-1 (Lunn et al., 2009). Throughout this publication and in other recent
reviews of EHV-1 (Pusterla, et al., 2009a) there is an absence of references to the use of
mathematical modeling to assess the transmission characteristics of EHV-1. This may well
reflect a scarcity of modeling expertise within the research community whose focus is the
study of equine infectious diseases as well as a lack of appreciation of the value of disease
modeling used for predicting the course or outcome of a disease event. Regardless,
mathematical modeling of this specific equine pathogen would likely increase our
understanding of the underlying epidemiology of EHV-1 and assist in developing more

2
effective strategies for management of disease events caused by these pathogens.
Ultimately, mathematical models that encompass the spectrum of clinical syndromes that
can be caused by EHV-1 may assist regulatory officials in forecasting a more precise
estimate of an end-point to an ongoing disease event. Finally, the results obtained from
modeling occurrences of EHV-1 neurologic or respiratory disease in naturally exposed
populations of horses would serve to complement laboratory findings and validate
experimental data which suggest that strains of EHV-1 of a specific genotype have
enhanced pathogenicity with respect to causing neurologic disease.
B. Review of the literature
1. Introduction
Equine herpesvirus type 1 (EHV-1) is an important pathogen of equids that can
cause respiratory disease, abortion, fatal respiratory disease in neonatal foals and, on
occasion, sporadic outbreaks of neurological disease (Allen and Bryans, 1986).
Epidemiological evidence suggests that foals as neonates are exposed to the virus from their
dams and most seroconvert by six months of age, even when raised within highly
vaccinated adult populations (Foote et al., 2006; Slater et al., 2006; Marenzoni et al., 2008).
The clinical presentation of upper respiratory tract disease (URTD) caused by EHV-1 is
highly variable and affected horses develop an acute rhinitis, pharyngitis and, with
extension into the distal airways, tracheobronchitis, bronchiolitis and pneumonitis (Allen,
2002a). Nasal discharge is frequently bilateral a consistent feature with clinical signs most
intense and virus shedding more abundant during the first few days of infection. When
present, fever may be slight or as high as 106°F and, in some horses, is biphasic. In
uncomplicated cases, the nasal discharge may be minimal and will frequently go unnoticed
by attending personnel which could potentiate the spread of the virus within a given
population often goes (Allen, 2002a). Respiratory disease has been reported to occur more
commonly in younger horses and repeated exposure to the virus increases the likelihood that
subsequent infections will be subclinical (Allen et al., 1999; Patel and Heldens, 2005;
Henninger et al., 2007). Virus may be recovered from the nasopharyngeal secretions or
peripheral blood mononuclear cells (PBMC) for up to 12 days (range 4-12 days) after

3
infection (Allen 2002; Allen and Breathnach, 2006). The duration of acquired immunity is
short-lived and animals are at risk of re-infection within 3-6 months (Kydd et al., 2006).
Viral latency which is likely to be life-long, is a hallmark of EHV-1 infection and
periodic reactivation of virus in latently infected horses is considered a major source of
circulating virus (Patel and Heldens, 2005; Hussey et al., 2006). During latency, the virus is
not in a replicative state and does not express genes coding for proteins and is unaffected by
any of the conventional antiviral drugs that rely on viral protein targets (Field et al., 2006).
The consequence of having a quiescent but potential source of infectious virus is that it
may, as the result of some stressful stimulus, be reactivated with the generation of infectious
virus capable of transmission to susceptible hosts (Borchers et al., 2006). However, the
contribution of reactivated latent virus to the spread or maintenance of EHV-1 in equine
populations is not well defined, particularly in the absence of associated clinical illness, as
horses are rarely sampled for EHV-1 unless they are displaying clinical signs. A recent
study of EHV-1 infection in adult horses that did not display clinical evidence of illness
suggested that subclinical shedding of EHV-1 is infrequent and when it does occur,
infective virus is at low level that might not pose a risk to other horses (Brown et al., 2007)
though these observations have not been validated.
The primary sites of EHV-1 replication are the epithelial cells of upper respiratory
tract and local lymph nodes (Patel and Heldens, 2005). The development of EHV-1
neurological disease in horses requires a leukocyte-associated viremia with subsequent
replication of virus in the endothelial cells lining the smaller blood vessels of the central
nervous system (CNS) (Borchers et al., 2006; Patel and Heldens, 2005). Studies of the
pathogenesis of the neurological form of EHV-1 have demonstrated differences in the
severity of illness which are correlated with the ability of the challenge strain of the virus to
disseminate to vascular endothelial sites within the CNS (Edington et al., 1986). Infection
of endothelial cells is associated with the development of vasculitis and thrombosis which
results in restricted blood flow leading to ischemic damage to the CNS (Edington et al.,
1986). The damage to the vessels walls of the CNS can be widespread and hemorrhage is
frequently observed on histopathological examination (Platt et al., 1980). Although the

4
basis for a protective immune response to EHV-1 is not fully understood, evidence suggests
that it includes both mucosal and humoral antibodies and involves the production of EHV-1
specific cytotoxic T-Lymphocytes (CTL) (Breathnach et al., 2001; Breathnach et al., 2006;
Coombs et al., 2006). A more recent report by Allen (2008) found that horses with high
concentrations of precursors of CTL were better able to control development of an EHV-1
induced leukocyte-associated viremia and, as a result, were less likely to develop
neurological disease than those with a low concentration of CTL precursors. These findings
were consistent among inoculated horses regardless of the age of the animal, their pre-
exposure serum neutralization antibodies (SN) titer for EHV-1 or the strain of the virus
which was used as challenge inoculum. These results are in agreement with findings of
Kydd et al., (2003) who showed a decrease in the occurrence of EHV-1 induced abortion
among horses with high levels of CTL that were measured prior to viral challenge. More
recently, a study by Hussey et al., (2011) comparing innate and adaptive immune responses
of ponies challenged with a strain of EHV-1 wild type virus or an open reading frame
(ORF) 1 and 2 deletion mutant found that ORF 1/2 genes play an important role in the
severity of clinical outcomes and modulation of cytokine responses in infected animals.
The occurrence of neurological disease among exposed horses is variable in
frequency and severity of clinical signs exhibited by affected individuals. Clinical signs
frequently include rear limb ataxia, urinary incontinence, and paresis (Kohn et al., 2006;
Allen and Breathnach, 2006). In general, pyrexia and depression are the most consistent
clinical signs observed preceding the development of neurological disease (Allen and
Breathnach, 2006; Slater et al., 2006).
Recent studies have identified a single nucleotide polymorphism (SNP) that encodes
for the viral DNA polymerase which has been associated with an increased frequency of
occurrence of equine herpesvirus myeloencephalopathy (EHM) (Nugent et al., 2006). The
SNP of interest is located at nucleotide 2,254 within a highly conserved region of ORF30.
In the case of neuropathogenic strains, this SNP encodes for G2,254 (amino acid D752)
whereas with respect to non-neuropathogenic strains, the SNP encodes for A2,254 (amino
acid N752) (Nugent et al., 2006). Researchers have shown that foals exposed to a

5
neuropathogenic strain of EHV-1 develop a cell-associated viremia that is earlier in onset,
greater in magnitude and longer in duration than that in foals inoculated with virus strains
lacking this particular point mutation (Allen and Breathnach, 2006). Specifically, EHV-1
DNA can be detected by PCR analysis of PBMC in foals inoculated with neuropathogenic
strains as early as 2 days and as late as 21 days (20-days duration of viremia) whereas for
foals inoculated with a non-neuropathogenic strain of EHV-1, viral DNA was not
detectable before 4 days or after 14 days post inoculation (11-days duration of viremia).
Furthermore, the peak magnitude of the viremia in foals inoculated with a neuropathogenic
strain of EHV-1 isolates was 52-fold greater than in foals inoculated with abortigenic strains
(Allen and Breathnach, 2006). It has also been shown in natural outbreaks of EHM, that
individual horses with neurological signs shed significantly higher levels of viral DNA, as
determined by real-time TaqMan PCR assay, in nasopharyngeal secretions than horses
which are only febrile or are subclinically infected (Pusterla et al., 2008).
Collectively, these findings would suggest that horses stabled in close proximity to
cases of EHV-1 neurological disease are potentially at a greater risk of exposure to the virus
and subsequent development of EHM. It should be pointed out, however, that the ability to
cause neurological disease is not restricted to specific strains of EHV-1 with the afore-
mentioned SNP involving the viral polymerase gene; cases of neurological disease have
been associated with strains of EHV-1 lacking this particular SNP (Nugent et al., 2006). In
fact, studies have shown that upwards of 25% of the EHV-1 isolates obtained from EHM
cases were strains that did not have the neuropathogenic point mutation. Conversely,
approximately 6% of horses determined to be infected with neuropathogenic strains of
EHV-1 do not display signs of CNS disease (Goodman et al., 2007; Perkins et al., 2009).
For some outbreaks of EHM, investigators (vann Maanen et al., 2001; Henninger, et
al., 2007) have chronicled the progression and severity of disease and the prognosis with
respect to horses displaying neurological signs having essentially neglected to consider the
role of subclinical cases of infection in dissemination of the virus or development of disease
within the exposed population. Insofar as subclinically infected horses may serve as a
source of virus, the ability to identify horses that are shedding infective virus regardless of

6
clinical presentation is important for optimizing control strategies and in conducting contact
tracing. Since the introduction of allelic discrimination PCR-based assays that can
distinguish between neuropathogenic strains of EHV-1 with the particular SNP and non-
neuropathogenic strains of the virus lacking that point mutation (Allen 2007), investigations
of outbreaks of EHM have focused on characterizing the genotype of the virus responsible
for an outbreak and also identifying horses that are potentially shedding infective virus.
While the intent of this testing is primarily to limit contact between susceptible or
inadequately protected horses and animals shedding infectious virus, even in the absence of
epidemiologically derived data, it has also been used as a prognostic indicator of the
development of CNS disease. While not an entirely inappropriate use of these testing
modalities, it is certain that development of neurologic disease caused by EHV-1 is related
to more than just the molecular characteristics of the virus strain involved; it should also
include host and environmental specific factors (Allen, 2008; Lunn et al., 2009).
2. Epidemiological aspects of EHV-1 infection
Attempts to estimate the prevalence of EHV-1 in domestic and international equid
populations have relied heavily on serological surveys conducted within defined
populations (Gilkerson et al., 1999; Wood et al., 2005; Brown et al., 2007; Marenzoni et
al., 2008). In general, these surveys confirm that EHV-1 has a worldwide distribution
(Matumoto et al., 1965; Allen et al., 1999) although demonstrating that seroconversion was
common in equine populations, isolation of EHV-1 from exposed horses in the absence of
clinical illness was rarely successful (Stierstorfer et al., 2002). To date, no study has been
undertaken with the aim of determining population-based prevalence estimates for either
neuropathogenic (expresses the ORF30G2,254 genotype) or non-neuropathogenic (expresses
the ORF30A2,254 genotype) subtypes of the virus. This is despite the fact that the United
States Department of Agriculture (USDA), Animal Health Plant Inspection Service
(APHIS), Veterinary Services (VS) tried, for a period of time, to chronicle the occurrence of
EHM (USDA, 2007). From an animal health regulatory perspective, requirements for
veterinary practitioners to report cases of EHV-1 to state animal health authorities vary
among states. Most state animal health agencies encourage reporting under general
regulations (http://www.aphis.usda.gov/vs/regs/states) for reporting of communicable

7
diseases, yet few specifically designate cases of EHM caused by EHV-1 as a reportable
disease. With the exception of required statements of disease free status of horses intended
for export and as a condition for states to participate in the National Animal Health
Reporting System (NAHRS), there is no federally mandated reporting of disease conditions
attributable to equine herpesviruses. Due to these short-comings in national reporting, it is
not possible to establish secular trends for disease occurrence and any opinion as to an
increase or decrease in EHV-1 disease incidence is merely speculative.
There is no evidence to indicate that currently available vaccines prevent the
occurrence of neurological illness caused by EHV-1, as the immunity conferred by these
vaccines does not reliably prevent infection, the development of cell-associated viremia as
determined by quantitative real-time PCR, or the establishment of latency (Goodman et al.,
2006; Pusterla, et al., 2009b). The occurrence of EHV-1 neurologic disease among horses
residing in highly vaccinated populations is common (Henninger et al., 2007). It is thought
that vaccines provide reasonable protection against respiratory disease, as evidenced by the
lack of reports or documentation of large scale outbreaks of EHV-1 respiratory illness in
highly vaccinated populations, though data that definitely support this conclusion is lacking
(Slater et al., 2006; Pusterla et al., 2009a). It is not uncommon for practitioners to
administer antiviral agents such as acyclovir compounds to horses (personal
communications – D. Byars) that have been exposed to or have been commingled with an
EHV-1 neurological case; there are only limited pharmacokinetic data available to suggest
that administration of these anti-viral drugs is of benefit in preventing the onset of clinical
illness (Garre et al., 2007; Garre et al., 2008; Maxwell et al., 2008; Lunn et al., 2009;
Pusterla et al., 2009a). Furthermore, the value of such therapy in preventing the spread of
infective virus to susceptible horses or, ultimately, decreasing the occurrence of secondary
cases has not yet been investigated.
Because neuropathogenic and non-neuropathogenic strains of EHV-1 differ in the
quantity of virus shed in nasal secretions of infected horses and in the characteristics of the
cell-associated viremia produced on experimental challenge, it is expected that disease
spread and the associated transmission parameters will also vary for each EHV-1 strain. The

8
impact of specific intervention strategies on the course of an EHV-1 disease event will
undoubtedly vary according to the viral strain responsible for the event.
The goal of this research study is to analyze data collected in the course of
investigating outbreaks of neurologic and respiratory disease attributed to neuropathogenic
or non-neuropathogenic strains of EHV-1 that occurred among separate cohorts of horses
housed in geographically confined locations. The hypothesis being tested is that outbreaks
of disease caused by either neuropathogenic or non-neuropathogenic subtypes of EHV-1are
similar with respect to their transmission dynamics regardless of the environment in which
transmission occurs, any underlying host specific characteristics or the molecular genotype
of the virus involved.
3. Investigation of EHV-1 disease events
Detailed reports of the occurrence of EHV-1 neurological events are common in the
veterinary literature and, for the most part, are comprised of clinical case reports and the
outcome of investigations of outbreaks among horses in well-defined populations. A listing
of some historical EHV-1 disease events are provided in Table 1.1. While not
comprehensive, this summary illustrates that these types of events occur most commonly
among horses located on breeding farms, at riding stables, racetracks, or at veterinary
hospitals; locations where large numbers of horses are commingled or gathered.
These events demonstrate that the recognition of CNS disease caused by EHV-1 is
often preceded by respiratory illness or fever and suggests that these events have a seasonal
onset with most reports occurring in the fall through spring months when animals are more
likely to be confined in stables or barns; locations where they are maintained in close
physical contact and share common airspace (Thomson et al., 1979; Platt et al., 1980;
Greenwood and Simson, 1979; Friday et al., 2000; Studdert et al., 2003; Kohn et al., 2006;
Henninger et al., 2007; Pusterla et al., 2009b; Burgess et al., 2012).

9
Table 1.1. Summary of previously reported outbreaks of EHV-1 myeloencephalopathy Reference Year
of event
Location Month (season)
of clinical onset
Number of
cases
Clinical episode preceding the
recognition EHV-1
Thomson et al., 1979
1977 Breeding farm December 21 Respiratory illness
Friday et al., 2000 1978 Breeding farm March 46 Fever, ataxia Greenwood and Simson, 1979
1979 Public stud May 117 Abortion
Platt et al., 1980 1979 Breeding farm Spring 9 Paresis vann Maanen et
al., 2001 1995 Riding school April 41 Respiratory illness
McCartan et al., 1995
1995 Breeding farm May 110 Hind limb edema, ataxia
Stierstorfer et al., 2002
1999 Riding school Autumn 5 Respiratory illness
Studdert et al., 2003
2001 Breeding March 170 Ataxia
Henninger et al., 2007
2003 Riding establishment
January 119 Fever, depression, inappetence
Kohn et al., 2006 2003 Veterinary clinic
January 6 Respiratory and neurological
disease Burgess et al.,
2012 2008 Boarding
facility, farm, veterinary
clinic
March - April
20 Colic, fever, mild respiratory,
abortion, limb edema
The active investigation of outbreaks of infectious disease is a systematic process of
collecting and analyzing data with the intent of identifying and eliminating the source of
infection (Reingold, 1998). The process is best described as a series of steps that are
designed to guide the field investigator and which are tailored to specific situations and
conditions relative to a particular infectious agent and the environmental setting where in
the outbreak is occurring (Reingold, 1998; Dwyer and Groves, 2007). An integral part of an
investigation is the development and use of a customized questionnaire to capture relevant
epidemiological information with respect to time, place and person (horse). Central to any
outbreak investigation is the timely implementation of control measures to minimize further
spread and, if applicable, to treat affected animals appropriately. A necessary part of an
investigation is to identify the population at risk and to determine the number and temporal

10
distribution of clinical cases (Reingold, 1998; Thrushfield, 2007). For outbreaks which
occur in animal populations, the ability to identify the sequential pattern of the onset of
clinical illness among exposed animals is limited by the inability to query animals directly
as to their symptomology and the need to use auxiliary diagnostic aids such as antigen
detection or antibody determination to identify cases which are inapparent or silent
(Thrushfield, 2007). Even then, determination of the date that an individual animal has
been exposed to or acquired an infection may be based solely on supposition and would
require the use of a statistical procedure, such as linear regression methodology or survival
analysis, to estimate with any degree of accuracy.
4. Statistical and mathematical modeling
Statistical and mathematical modeling offers the opportunity to assess variations in
disease transmission and can be a useful tool for analyzing the possible consequences of
interventions, such as immunization or anti-viral therapy, on a disease outcome (Keeling
and Rohani, 2008). The more common statistical methods for data analysis such as linear
regression, logistic regression, or proportional hazards, are used to calculate risk estimates
for parameters that relate exposure to disease in individuals. These models assume that
outcomes in different individuals are independent. In contrast, the assessment of disease
transmission based on mathematical models relates individuals to each other using
parameters that express contact rates or transmission probabilities (Koopman, 2004).
a. Predictive modeling
Multiple linear regression models are statistical techniques employed to examine the
association between a continuous outcome variable and a set of explanatory covariates.
These techniques allow for reciprocal and simultaneous adjusting for all other exposure
variables in the statistical model. The explanatory covariates can be continuous, categorical
and may include interaction terms. Regression models are useful in identifying and
describing associations between exposure and outcomes but are also used to estimate the
predicted value of a certain outcome as a function of a given set of values of the
independent exposure variables (Szklo and Nieto, 2007).

11
The multiple regression equation can be expressed as:
Yi = β0 + β1xi,1 + β2 xi,2 + ….. + βk xi,k + εi
where Yi is the value of the dependent variable on the ith trial, xi,k is the value of the
independent covariate x on the ith trial, β0 is the y intercept, βk represent the regression
coefficients for the predictor variables and εi is the random error term. In this model, the
regression coefficients measure the partial contribution of each variable to the prediction of
the response, or more precisely, the amount by which the mean response changes when the
predictor is changed by one unit while all other predictors are unchanged (Montgomery et
al., 2001). The model assumes that the random errors εi, i = 1...n are independent, normally
distributed random variables with a zero mean and constant variance σ2. Violations of
model assumptions are assessed through the use of statistical procedures which evaluate the
deviations of residuals about the mean or check for the presence of multicollinearity among
the covariates (Fernandez, 2003).
Whenever a large number of potential independent variables are being considered
for inclusion into a regression model, it has become customary to use an automated process
to select for a suitable subset of variables to be fitted to a model (Greenland, 1989;
Fernandez, 2003; Sauerbrei et al., 2007). Most statistical software packages offer a variety
of selection methods which compare all possible variable combinations and most generate a
statistic, such as R2 or Akaike’s information criterion (AIC), to be used to compare and
evaluate the model. While these automated processes allow for the inclusion and evaluation
of a large number of potential cofounders, final variable selection resides with the
investigator and should be based on experience and prior knowledge of the variables that
may be important biologically (Greenland, 1989).
For occurrences of EHV-1, univariate analysis or logistic regression are the more
common statistical procedures employed to examine the association of risk factors with
disease outcome (Burrell et al., 1996; vann Maanen et al., 2001; Wood et al., 2005; Cohen
et al., 2005; Henninger et al., 2007). With the exception of studies that estimated the
geographic spread of West Nile virus (Corrigan et al., 2006) and the spread of equine
influenza among racehorses in training yards (de la Rua-Domenech et al., 1999), examples

12
in the veterinary literature of predictive modeling applied to equine infectious diseases are
few in number and, of those which are available, none have been used to predict a date
when an asymptomatic horse acquires an infection.
b. Survival analysis
Survival analysis is a collection of statistical procedures for which the outcome of
interest is time to the occurrence of a specified event. While the prototypical event of
interest is death or failure, any designated experience of interest including disease incidence
can be evaluated by this methodology (Kleinbaum, 1997; Fox, 2002). There are many
examples of the use of survival analysis in the veterinary literature and they include an
examination of the temporal pattern for development of anthelmintic resistance (Suter, et
al., 2005), the time interval for seroconversion after experimental Bovine Leukemia virus
infection (Monti and Frankena, 2005) and estimation of risk of racehorse fatalities (Henley
et al., 2006).
The distribution of survival times is characterized by three mathematical functions;
the probability density function, the survival function, and the hazard function. All three
functions are mathematically equivalent and if one is known then the others can be derived
(Lee and Go, 1997). The formulas for these functions are presented in the sections below
and described by the accompanying equations.
The probability density function, also known as the unconditional failure rate, is
defined as the limit of the probability that an individual fails in the interval t to t + Δt per
unit width Δt and is represented by the mathematical function 1.1.
F (t) = lim Δt 0 Pr ( t < T < t + Δt ) (1.1)
Δt
A graph of the probability density function is called a density curve. It depicts the
distribution of the survival times within a small interval of time and shows the proportion of
individuals that fail at any time interval (Lee and Wang, 2003).

13
A specific aim of survival analysis is to provide estimates of the probability of
surviving to different times with the relationship being expressed as the survival function
(Bull and Spiegelhalter, 1997). The calculation of the survivor function is fundamental to
survival analysis and represents the probability that a horse survives longer than some
specified time (t) where (t) ranges from 0 to infinity. The survivor function, usually denoted
by S (t), gives the probability (Pr) that a horse’s survival time (T), exceeds the specified
time (t) (Kleinbaum, 1997) and is represented by equation 1.2.
S(t) = Pr(T > t) = 1 – Pr(t) (1.2)
A survival curve is the graphic representation of the survival function and is useful
to compare and contrast the survival distributions of two or more groups. The median
survival time, defined as the time at which the cumulative survival function is equal to 0.5,
is commonly used as a summary statistic of the survival function and is generally the
preferred measure of central tendency (Lee and Go, 1997).
The hazard function gives the instantaneous potential per unit time for the event to
occur given that the individual has survived up to time (t) and is an expression of the hazard
as it changes over time (Bull and Spiegelhalter, 1997). It is also known as the conditional
failure rate as the probability that the event will occur between t and t + Δt given that the
survival time (T) is greater than or equal to (t) (Kleinbaum, 1997). It is represented by the
mathematical expression given in equation 1.3.
h(t) = lim Δt 0 Pr [( t < T < t + Δt ) / T > t] (1.3)
Δt
While survival curves express the cumulative effect of the risks faced by an
individual, the hazard function expresses the hazard as it changes over time. A convenient
method for graphically depicting the hazard function is the Weibull distribution. This
distribution takes many forms - increasing, decreasing, static or lognormal - with the shape
of the distribution providing insights into the nature of the hazard (Kleinbaum, 1997).

14
Since survival times must be greater than zero, their distribution is often right-
skewed and not generally assumed to be normally distributed. The Kaplan-Meier (K-M)
procedure is a non-parametric procedure commonly used for estimating a survival function
as it makes no assumptions about the shape of the underlying distribution of survival times
(Bull and Spiegelhalter, 1997). The K-M procedure is a life-table technique that allows for
the construction of a survival curve based on a series of time intervals such that only one
event occurs at each interval with the event of interest occurring at the beginning of the
interval (Lee and Go, 1997). Because the K-M method uses a formula that estimates the
survival function as the product of a series of conditional probabilities (Cox and Oakes,
1984; Lee and Go, 1997), it is referred to as the product limit method. This procedure
estimates the instantaneous risk of failure at any particular time as the ratio of the number
who became infected at time (t) to the number who are still at risk for becoming ill (Bull
and Spiegelhalter, 1997). Estimates of S(t) derived using this procedure provide a
convenient method for comparing and testing whether two or more K-M curves are
equivalent, commonly through the use of the log-rank test (Kleinbaum, 1997).
Comparisons of two or more survival curves can be done by estimating the
distribution of survival times, examining the relationship between survival and one or more
predictors, and comparing two or more groups with respect to the distribution of their
respective survival times.
For observational studies of survival times of infectious diseases, the beginning of
the period of observation coincides with the occurrence of the first case(s) and continues for
a fixed interval (Lee and Go, 1997; Bull and Spiegelhalter, 1997). A common feature of
survival data is that, on occasion, a study animal (person) is removed or censored from
observation before the event of interest occurs or prior to the termination of the study.
Generally, censoring occurs if the horse (person) does not experience the event before the
study ends, they are lost to follow-up, or if they withdraw from the study for a reason
unrelated to the event of interest (Kleinbaum, 1997). In some situations, the time that an
event of interest occurs is not precisely known but only within a particular interval. This is
referred to as interval-censored data and is commonly encountered when periodic

15
evaluations, usually clinical or laboratory testing, are used to assess whether the event of
interest has occurred. The use of estimates derived from interval-censored data is rare in
veterinary medical research as this statistical method is heavily dependent on the structure
of the underlying data (Lindsey and Ryan, 1998; Radke, 2003) and is most often utilized in
formalized clinical trials or longitudinal studies. Calculation of the date of disease onset
using techniques to correct for interval censoring may not be applicable to investigation of
disease outbreaks where diagnostic sampling is conducted only sporadically or where an
investigation is initiated late in the disease event.
c. Mathematical modeling
Mathematical modeling characterizes disease transmission in terms of infection rates
that are related to the frequency of contact between individuals and the likelihood of
successful transmission given a contact between a susceptible and an infective host (Aron,
2007). The population-level dynamics of disease spread is assessed most commonly through
the estimation of a few key transmission parameters: the basic reproductive number, the
transmission interval and the proportion of transmission that is inapparent or occurs during
the prodromal period (Fraser et al., 2004).
i. Transmission parameters
(1) Basic reproductive number
For epidemic modeling, transmissibility is often expressed as the basic reproductive
number, R0, which is defined as the mean number of secondary cases caused by each
primary case in a population composed entirely of susceptible individuals (Anderson and
May, 1991). During the period that a host is infectious, a disease is transmitted to
susceptible individuals at a rate dependent on R0 (Gani and Leach, 2001). Conceptually, the
basic reproductive number assumes that as one infective case is introduced into a large
susceptible population, the initial spread would approximate a branching process (Dietz,
1993) which, for an epidemic to expand, requires that more than one secondary case be
generated by the primary case so that R0 > 1 (Hethcote, 2000). The magnitude of the value
for R0 is a useful indicator of both the risk of an epidemic and the effort needed to control
the infection within an exposed population (Wallinga and Lipsitch, 2007).

16
For infectious disease agents, R0 is the product of the contact rate c, the duration of
infectiousness d, and the probability that transmission will occur per contact with an
infectious animal p, and is represented by equation 1.4 (Aron, 2007).
Number of contacts Transmission Duration of
R0 = per unit time x probability per contact x infectiousness = cpd (1.4)
Furthermore, the average number of contacts made by an infectious animal is the
product of the contact rate and the duration of infectiousness while the number of new
infections produced by one case during the infectious period is the product of the number of
contacts in that time interval and the transmission probability per contact (Halloran, 2001).
It is readily apparent that any attempt to estimate R0 with this equation is only
meaningful for diseases where contacts are clearly defined and can be counted. Therefore,
attempts to determine R0 directly from individual contact parameters are restricted to a few
vector borne diseases where estimates of the number of blood meals per unit time are
known or to sexually transmitted diseases where estimates of the number of new partners
per unit time or the number of contacts per partner have been determined (Dietz, 1993). For
infectious diseases where transmission occurs from airborne exposure or indirect contact,
simulation modeling of disease spread is the most commonly used method to estimate the
value for R0 in outbreaks within large populations (Ferguson et al., 2005; Roberts and
Heesterbeek, 2007; Tildesley and Keeling, 2009; White and Pagano, 2008). For models of
simple immunizing infections where the incidence of disease is high, R0 can be estimated by
equation 1.5 and transmission parameters obtained by fitting predictions of the infection or
disease incidence obtained from a model based on observed data (Keeling and Rohani,
2008; Vynnycky and White, 2010).
R0 = βND (1.5)
where β is the transmission probability or, more precisely, the per capital rate at which two
specific individuals come into effective contact per unit time, N is the total population size
and D is the duration of infectiousness.

17
Alternatively, Anderson and May (1991) derived a method to calculate R0 from data
obtained during the course of an outbreak investigation (Dietz, 1993, Galvani et al., 2003).
This formula is based on the doubling time (i.e., the period required for the number of cases
in an epidemic to double) of initial cases and is provided in equation 1.6 (Dietz, 1993).
R0 = 1 + D ln2 / td (1.6)
where D is the duration of the infectious period and td is the initial doubling time of cases.
The parameter td is further defined (Galvani et al., 2003) by equation 1.7 where N1 and N0
are the number of cases at time t1 and t0, respectively such that:
td = (t1 – t0) log (2) / log [N1 / N0] (1.7)
As the outbreak progresses, a value for the current reproductive number – often
referred to as the effective reproductive number - can be calculated for each time period (ti)
and is denoted as Re. The value of Re is useful for following an outbreak over time such
that, after the introduction of an infectious agent into a population, exposed animals will
develop immunity and the value for the effective reproductive number, Re, will decrease.
The outbreak will cease when the value for Re declines below the threshold value of 1.0.
Herd immunity (HI) i.e., the proportion of immune individuals which must be
exceeded if disease incidence is to decrease, is linked quantitatively to the value of R0 and
can be expressed algebraically as HI = 1 - 1/R0 (Fine, 1993). Herd immunity describes the
collective immunological status of a population and, mathematically, incorporates values of
vaccine effectiveness and coverage into its estimate (Halloran, 2001). It serves as a target
for disease elimination and is useful for evaluating the use of vaccines in exposed
populations (Fine, 1993).
(2) Transmission intervals
While the serial interval is generally considered as the time period between
infection and transmission (Fine, 2003), there is disagreement on the exact definition and
some authors prefer the term generation time to describe this time frame. For most disease
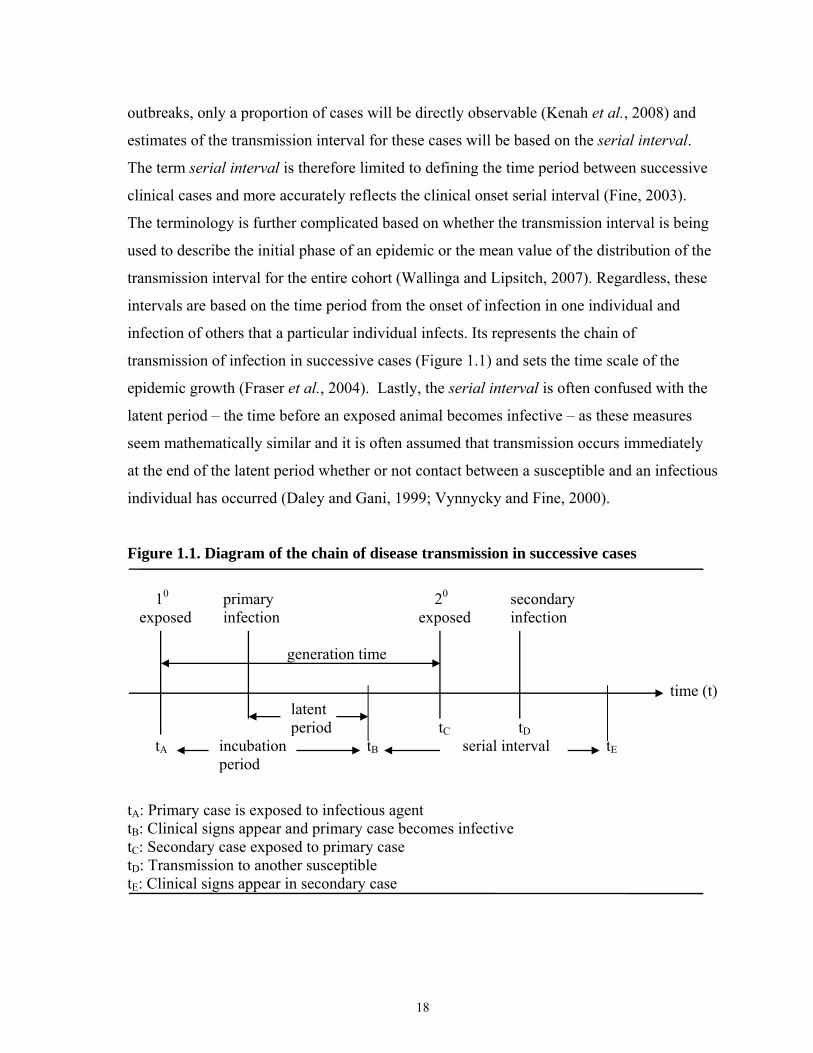
18
outbreaks, only a proportion of cases will be directly observable (Kenah et al., 2008) and
estimates of the transmission interval for these cases will be based on the serial interval.
The term serial interval is therefore limited to defining the time period between successive
clinical cases and more accurately reflects the clinical onset serial interval (Fine, 2003).
The terminology is further complicated based on whether the transmission interval is being
used to describe the initial phase of an epidemic or the mean value of the distribution of the
transmission interval for the entire cohort (Wallinga and Lipsitch, 2007). Regardless, these
intervals are based on the time period from the onset of infection in one individual and
infection of others that a particular individual infects. Its represents the chain of
transmission of infection in successive cases (Figure 1.1) and sets the time scale of the
epidemic growth (Fraser et al., 2004). Lastly, the serial interval is often confused with the
latent period – the time before an exposed animal becomes infective – as these measures
seem mathematically similar and it is often assumed that transmission occurs immediately
at the end of the latent period whether or not contact between a susceptible and an infectious
individual has occurred (Daley and Gani, 1999; Vynnycky and Fine, 2000).
Figure 1.1. Diagram of the chain of disease transmission in successive cases
10 primary 20 secondary exposed infection exposed infection generation time time (t) latent period tC tD tA incubation tB serial interval tE period
tA: Primary case is exposed to infectious agent tB: Clinical signs appear and primary case becomes infective tC: Secondary case exposed to primary case tD: Transmission to another susceptible tE: Clinical signs appear in secondary case

19
The progress of an epidemic depends on the innate features of individuals at risk and
the dynamics of disease transmission between members of a population (Svensson, 2007).
The probability of transmission will differ between groups based on the environmental
conditions under which animals reside, the population density, mixing patterns, past
exposure history or some specific characteristic of the infectious agent. Where possible,
transmission intervals are best studied by directly observing the temporal pattern between
successive cases (Mathews et al., 2007; White et al., 2009) though, to my knowledge, this
has never been documented for infectious diseases in animal populations.
Estimation of the serial interval for influenza A/H1N1 has been calculated in public
health settings by directly monitoring household contacts with index cases for the
occurrence of symptom onset or indirectly by simulation modeling of case reports of
notifiable disease data (Cowling et al., 2009; White et al., 2009). Though uncommon,
attempts have been made to estimate transmission intervals (generation or serial interval) in
animal populations by simulation modeling. As an example, Stegeman et al. (1999),
proposed a generation interval of 10 days for the transmission of classical swine fever
among breeding swine during the 1997-1998 epizootic in the Netherlands.
For epidemic models, the number of infected individuals increases exponentially in
the early stages of an epidemic with the rate of increase equal to the Malthusian parameter r
where a population increases over a fixed interval such that the amount of increase, absence
of constraints, is not affected by the size of the population (Tomba et al., 2010).
Calculations of the exponential growth of a population are based on equation 1.8,
N (t) = N0 ert (1.8)
where N0 = initial population, r = growth rate (Malthusian parameter), and t = time.
The growth rate (r) is based on the initial doubling time and can be calculated with
the equation 1.9 and the value for td derived from equation 1.7.
r = ln (2)/ td (1.9)

20
For simple transmission models, there is an explicit relationship between R0 and the
average observed initial generation time (Tg) (Wallinga and Lipsitch, 2007; Tomba et al.,
2010) such that R0 can be calculated using equation 1.10.
R0 = 1 / 1 – r Tg (1.10)
Based on this mathematical relationship, it is possible to solve for Tg when R0 and r
are known using equation 1.11.
Tg = (R0 – 1) / (r R0) (1.11)
This method of estimating Tg provides a useful measure of the generation time
when applied to data at the beginning of the epidemic period where it is reasonable to
assume that the whole population is susceptible (Roberts and Heesterbeek, 2007).
(3) Asymptomatic transmission
In infectious disease epidemiology, the proportion of transmission that occurs prior
to the onset of symptoms or clinical signs – the prodromal period – or by asymptomatically
infected animals are important factors in the dissemination of infection within a population
(Fraser et al., 2004; Patrozou and Mermel, 2009).
Asymptomatic transmission is commonly expressed as the proportion of infection
that occurs among susceptibles which do not display clinical signs (Nelson, 2007). Because
asymptomatic infection is generally considered to be immunizing, clinical attack-rates
rarely approach 100%, even in isolated immunologically naive populations (Mathews et al.,
2007). Ignoring asymptomatic cases in outbreak settings would underestimate morbidity
and lead to unreliable estimates for transmission parameters.
Within the public health community, there is disagreement concerning the impact
that shedding of influenza virus by subclinically infected individuals have on the spread of
this disease. Observational studies in human populations and experimental studies in mice

21
would suggest that asymptomatic transmission of influenza is limited (Schulman and
Kilbourne, 1963; Patrozou and Mermel, 2009). For influenza A/H3N2 specifically, the
quantity of virus shed in nasal secretions of human cases is 2-3 log10 times lower in
asymptomatic cases of infection than in individuals who develop clinical illness (Carrat et
al., 2008).
For occurrences of EHV-1, researchers have shown that there are no differences in
the viral load expressed as the number of gene copies per million cells in nasopharyngeal
secretions of febrile and subclinical horses infected with the same strain of EHV-1 (Pusterla
et al., 2008). These findings suggest that, at least for EHV-1, subclinically infected horses
pose a similar risk for transmission as febrile horses particularly when they are maintained
in close physical contact, though this risk has yet to be quantified.
For veterinary practitioners, the presence or absence of clinical signs directly affects
their ability to diagnose, treat or isolate infected animals. It is therefore reasonable to
assume that the lack of clinical signs in infected animals will effectively result in increased
spread of EHV-1 within a confined population as medical or regulatory interventions are
delayed. As with human influenza, direct monitoring of contacts through physical
examinations and laboratory testing offers the best opportunity to estimate transmission
parameters and to quantify the burden that subclinically infected horses contribute to the
spread of EHV-1. Moreover, estimates of transmission parameters obtained through direct
observation are inherently more accurate and less uncertain than those derived from
epidemic models (Mathews et al., 2007).
ii. Deterministic modeling
A mathematical model is a mathematical description of the simplified dynamics of
disease transmission and, provided that the assumptions and parameter estimates used for
the model are realistic, serves as a useful approximation of the spread of disease within
complex biological systems (Aron, 2007). Mathematical models are categorized as either
stochastic or deterministic depending on whether the model incorporates elements of
random variation and chance (Hurd and Kaneene, 1993). As an example, Monte Carlo

22
sampling is a stochastic technique used for complex epidemic models with the results
expressed as confidence intervals instead of just point estimates (Martin et al., 1987). There
is a general belief that stochastic models provide a more realistic depiction of biological
systems than deterministic models, though in many instances, the results of a deterministic
model will approximate the mean response of a corresponding stochastic model. Moreover,
deterministic models provide valuable insights into the properties of disease transmission
when based on observational data or when used to make predictions about an event with a
high incidence level (Martin et al., 1987; Hurd and Kaneene, 1993; de Jong, 1995; Halloran,
2001; Keeling and Rhoni, 2008).
Transmission models are based on the Kermack-McKendrick threshold theorem
which requires a minimum density of susceptible animals within a population to allow a
contact-transmitted epidemic to commence (Aron, 2007; Keeling and Rhoni, 2008). The
formulation of epidemic models requires that individuals within a population be sub-divided
into a range of classes or states dependent on their infection history (House and Keeling,
2008). A simple model of the Kermack-McKendrick type is the deterministic
compartmental model where individuals reside in only one compartment or state at any
given time. This model considers a population consisting of three distinct disease states;
susceptible (S), infected (I) and immune or recovered (R). This type of deterministic model,
commonly referred to as an SIR model, is generally effective in describing the dynamics of
a range of infections and, since the outcome is not subject to chance, produces the same
result for any initial set of values and parameters (Hurd and Kaneene, 1993; Thrushfield,
2007; House and Keeling, 2008).
The classic SIR model for closed populations without demographics (no births,
deaths, or migration) and assuming homogeneous mixing – every pair of individuals has an
equal probability of coming into contact with another – can be depicted schematically
(Figure 1.2) by the following transfer diagram (Keeling and Rhoni, 2008).

23
Figure 1.2. Simple epidemic model (SIR)
transmission recovery of pathogen from illness
With respect to these three disease states, the model assumes that the rate of gain in
the infective class is proportional to the loss in susceptibles, the rate of gain in the recovered
class (immune) is proportional to the loss of infectives and the incubation period is
negligible such that as a susceptible individual contracts disease they become infective
immediately (Murray, 1989). This process can be parameterized by a series of differential
equations for the rates of change in the population densities of the disease states S, I and R,
respectively, and is represented by the diagram and equations in Figure 1.3.
Figure 1.3. SIR model for a closed population with differential equations for the rates of change for the population densities βSI γI S I R
dS /dt = - βSI (1.12)
dI /dt = βSI – γI (1.13)
dR /dt = γI (1.14)
For epidemic modeling, the mass-action term (βSI) characterizes the rate of transfer
of individuals from the susceptible class S to the infective class I. The law of mass action
can be applied to population processes and its application to disease transmission is
analogous to the rate of a chemical reaction as a function of the initial concentrations of the
reagents (Fine, 1993; Daley and Gani, 1999) or, for disease transmission, to the proportion
S (susceptible)
I (infected)
R (immune)

24
of animals within each disease class at the beginning of an epidemic (Daley and Gani,
1999). In this context, the parameter β is a rate constant that incorporates the number of
contacts per person per day and a probability that a contact between an infective and
susceptible individual results in transmission of the infectious agent (Aron, 2007). While
the parameter γ is the recovery rate for the infective class to the recovered class, its
reciprocal (1/γ) is the average infectious period; a parameter that provides additional insight
into the dynamics of disease transmission (Aron, 2007). If, for example, a therapeutic agent
is used during an epidemic, then the recovery rate increases and the average infectious
period is shortened, thus reducing spread to others (Aron, 2007; Keeling and Rhoni, 2008).
By examining the rates of transfer from one class to another, the underlying concept of the
Kermack-McKendrick threshold theorem becomes clearer such that as the rate at which the
susceptible class become infective exceeds the rate at which the infective class is removed
(βSI > γI) then the epidemic is permitted to grow (Daley and Gani, 1999; Keeling and
Rhoni, 2008).
Despite its simplicity, an exact analytical expression for the dynamics of the SIR
model is not easily understood and, for most applications, must be solved numerically
(Keeling and Rhoni, 2008). While individual-based transmission models in structured
communities have been used to study the spread of smallpox and influenza in human
populations, few threshold values relating to animal diseases are known (Thrushfield,
2007).
The Reed-Frost model is a simple discrete-time deterministic model constructed
within the SIR framework that is commonly used to evaluate disease spread and herd
immunity (Abbey, 1952, Martin et al., 1987; Wahlström, et al., 1998). The Reed-Frost
model is a chain binominal model where the expected number of cases occurring during an
epidemic can be derived mathematically from the formula shown in equation 1.15 (Abbey,
1952; Hurd and Kaneene, 1993).

25
C t +1 = St (1 - qct) (1.15)
where t = the time period
Ct+1 = the number of infectious cases in time period t + 1
St = the number of susceptible individuals in time period t,
q = 1− p; the probability of avoiding effective contact
p = the probability of effective contact between an infective and susceptible
p is calculated as p = k ⁄ (N-1) (1.16)
where k = the number of effective contacts made during time period t
N = the population size
The Reed-Frost model assumes that the population is closed, every individual is
equally susceptible to disease, random mixing occurs within the populations where every
individual is equally likely to come into contact with any other individual, disease spread is
by direct contact, an infected is a case for only one time period and immunity lasts
indefinitely (Abbey, 1952; Carpenter, 1984; Wahlström et al., 1998).
The model equates the number of cases at any time to the number of susceptibles in
the immediate preceding time period and the probability of contact of each individual with a
case (Martin et al., 1987). By applying a simple binomial probability, the expected number
of cases can be computed for any time period (Halloran, 2001). For discrete time Reed-
Frost models where individuals are infectious for no more than one time period, the
transmission parameter (k) represents the number of secondary cases that arise for one
initial infectious case and has been used as an estimate for R0 (Daley and Gani, 1999;
Keeling and Rhoni, 2008). For the purposes of mathematical modeling, the recovered or
immune class consists of individuals who are no longer acutely infected with a pathogen,
who would not contribute to the infectious process and are incapable of transmitting
infection (Vynnycky and White, 2010).
Mathematically, the Reed-Frost model is deterministic but can be made stochastic
with the use of computer simulation or by incorporating variability into the parameters used

26
to construct the model (Hurd and Kaneene, 1993). As an example, changing the value of
(k) for each time period makes the model stochastic by incorporating variability into the
probability that each contact will be adequate.
Copyright © Barry Jay Meade 2012

27
CHAPTER TWO
MATERIALS AND METHODS
A. Materials
1. EHV-1 disease events – animals and premises
a. Churchill Downs Racetrack, 2005 – Investigative summary
On Tuesday May 17, 2005, animal health regulatory officials in Kentucky were
notified by laboratory personnel at the University of Kentucky Veterinary Diagnostic
Laboratory (UKVDL) of the diagnosis of EHM in a horse which had been submitted to the
laboratory for routine necropsy. The animal, a two-year old Thoroughbred filly was
euthanized on May 12, 2005 and submitted to the Diagnostic center after its clinical
condition worsened despite the institution of aggressive therapeutic measures by clinicians
at a local equine referral hospital. The horse, a recent arrival to Churchill Downs Racetrack
in Louisville, had a clinical onset on May 9, 2005 when she was first noted to be lethargic
and depressed. On the morning of May 10, 2005 the horse had become recumbent and was
unable to rise. At that time, the horse was transported to the equine referral hospital in
Lexington, KY where additional therapy was initiated, including placement of the affected
animal in a sling. EHM was suspected based on the clinical presentation and histological
findings which demonstrated diffuse hemorrhages were noted in the gray and white matter
and the presence of mononuclear infiltrates in the cervical spinal cord. The diagnosis of
EHM was confirmed with the use of a PCR assay specific for EHV-1 that was performed on
neural tissue obtained from the horse at necropsy.
While the laboratory results were pending on this case, an additional animal residing
in a separate training barn at Churchill Downs Racetrack presented with similar clinical
signs as the aforementioned filly; it was reported to the state animal health regulatory
officials. This was a two-year old unraced Thoroughbred colt that developed a fever of
103.5°F (39.7°C) on the morning of May 8, 2005. According to the attending veterinarian,
the colt was treated symptomatically but on May 13, it developed rear limb paralysis and
became recumbent. Due to an unfavorable prognosis for functional recovery, a decision
was made to euthanize the animal and submit it to the UKVDL for necropsy. As with the

28
previous case, histological findings of vasculitis and mononuclear cells in the brain
supported a diagnosis of EHM this was confirmed through by a PCR assay specific for
EHV-1 on lymphoid tissue obtained at necropsy.
In response to identification of two horses with EHM stabled at the racetrack, the
Office of the Kentucky State Veterinarian initiated an epidemiological investigation at
Churchill Downs Racetrack in Louisville, Kentucky. An initial on-site assessment was
conducted on May 17 and used to determine the number and location of potentially exposed
horses. While these two Thoroughbreds in training were both located at Churchill Downs,
they were stabled in different barns, designated as barns six and 39, and had separate
owners and trainers.
During the initial evaluation at Churchill Downs on May 17, a number of horses
stabled in barn number 38, were observed exhibiting clinical signs that were compatible
with EHV-1 illness, including hind limb ataxia and paralysis. The horses in this barn had
been evaluated a few days earlier by a veterinary practitioner who specializes in internal
medicine and who had recommended that all horses housed in barn 38 be placed on a
treatment regimen of the anti-viral agent Acyclovir beginning May 15.
Based on the recognition of two horses in separate barns with laboratory confirmed
EHM and with the report of additional horses with clinical signs compatible with EHV-1,
state regulatory officials and Churchill Downs Racetrack management elected to restrict the
movement of animals into and out of three barns. The Office of the Kentucky State
Veterinarian, in consultation with researchers from the University of Kentucky Maxwell H.
Gluck Equine Research Center, developed a sampling protocol designed to identify the
presence of circulating virus among exposed horses and to provide a basis on which control
measures for EHV-1 could be implemented.
While there were approximately 800-900 horses present on the grounds of Churchill
Downs Racetrack when the first EHV-1 neurologic case was diagnosed, active surveillance
efforts by veterinary practitioners and state regulatory personnel identified only three barns

29
with either a diagnosed case of EHM or laboratory evidence of acute EHV-1 infection. Of
these three barns, only barn 38 was ultimately determined to have more than one EHV-1
infected horse identified throughout the entire 66 day surveillance period. Consequently,
further analysis of the transmission of EHV-1 within a confined population is restricted to
the 37 horses housed in barn 38 at Churchill Downs Racetrack.
b. Murray State University, 2008 – Investigative summary
On April 8, 2008 Kentucky animal health regulatory officials were notified of a
presumptive positive PCR-result specific for EHV-1 from a whole blood specimen and a
nasal swab submitted to the UKVDL. The samples were collected from a 14-year-old
Quarter-horse gelding that was hospitalized at an equine medical referral clinic in
Lexington, Kentucky. The horse was admitted to the clinic after having developed hind limb
ataxia of two days duration.
The gelding was owned by a Murray State University college student and prior to
being admitted to the equine medical center was stabled in the student barn at the University
farm in Murray, Kentucky. While the gelding occasionally participated at horses shows, the
owner utilized it mainly for pleasure riding. The horse had been resident in the student barn
since the beginning of the 2007 fall semester and had occupied the same stall for the entire
period. Because other horses, both university and student owned, were stabled with or co-
located at the University farm with the affected gelding, an epidemiological investigation
was initiated immediately by the Office of the Kentucky State Veterinarian.
A total of 120 horses, stabled in two barns and adjoining pastures at the Murray
State University research farm, were resident on the facility at the time of the investigation.
All horses were evaluated initially by regulatory personnel on April 10, at which time a
survey questionnaire was provided to horse owners and university farm personnel with
instructions to complete and return the following day. Regulatory oversight, including
movement restrictions and sampling of horses that were stabled in the student and rodeo
barns, began on April 8 with the issuance of a state hold-order and continued for a 42-day
period until the horses were released from quarantine on May 20, 2008.

30
Preliminary analysis of data obtained during the investigation suggested that, among
horses in the student barn, respiratory illness preceded the recognition of the initial
neurological case. Because the occurrence of neurological illness and the recognition of
respiratory illness were confined to horses in the one student barn at Murray State
University, analysis of data collected over the course of the investigation focused on the
transmission of EHV-1 among the 37 horses which housed together in this barn.
2. Personnel and laboratory support
The investigation of each EHV-1 event was conducted under the authority of the
Office of the Kentucky State Veterinarian and included the use of state and federal
veterinary medical personnel, animal health technicians and regulatory enforcement staff for
the collection and processing of blood samples. For the EHV-1 event at Churchill Downs
Racetrack, primary laboratory support was provided by the UKVDL and by the late Dr.
George Allen at the Maxwell H. Gluck Equine Research Center at the University of
Kentucky, Lexington, KY. Samples collected over the course of the investigation at the
Murray State University research farm were evaluated diagnostically for evidence of EHV-1
infection at the Breathitt Veterinary Center in Hopkinsville, KY and the UKVDL.
Additional diagnostic testing to rule out other possible infectious causes of
neurological illness of equids was conducted at the National Veterinary Services Laboratory
(NVSL) in Ames, Iowa on samples collected from horses associated with the Churchill
Downs Racetrack outbreak investigation. In the case of the Murray State University
outbreak investigation, Ms. Kathy Shuck and Dr. Udeni Balasuriya at the Maxwell H. Gluck
Equine Research Center at the University of Kentucky, Lexington, KY preformed
diagnostic assays to rule out other infectious causes of equine viral respiratory illness.
B. Methods
1. Regulatory protocol
a. Churchill Downs Racetrack, 2005
Regulatory management of the Churchill Downs Racetrack outbreak involved the
institution of biosecurity measures and movement controls to limit spread, the development

31
of a surveillance and laboratory testing protocol to determine the disease status of horses
stabled at the track and the dissemination of information about the disease event to media
outlets and other interested stakeholders.
During the disease event, veterinary practitioners with clients at Churchill Downs
Racetrack were required to report to Kentucky animal health regulatory authorities any
horse stabled on the premises with a fever in excess of 101.5°F (38.6°C) or exhibiting
clinical signs consistent with EHM. The intent was to provide an active surveillance
component to the investigation and to identify animals that needed further diagnostic
evaluation. In the case of those barns with a diagnosed case of EHM or laboratory evidence
of EHV-1 infection, the entire population of equids housed in the barn was placed under a
state hold-order and prevented access to the track for a 14-day period. Following this
isolation period, all horses within the barn were evaluated diagnostically using a PCR assay
specific for EHV-1 (OIE terrestrial manual, chapter 2.5.7). If the remaining horses within
the affected barns were found to be negative using this assay, they were allowed restricted
access to the track for exercise. As a rule, this meant exercising at designated time periods
under supervision of track personnel and avoiding any commingling with the general track
population. Following an observation period of seven days without additional clinical
cases, horses within affected barns were subjected to a final round of diagnostic testing with
the PCR assay. Those barns without additional positive animals were released from
regulatory oversight and allowed to train or move without further restrictions.
In the case of barn 38 where laboratory testing provided evidence of continued
transmission of EHV-1, animals positive on the PCR assay were observed and held in an
isolation barn and additional specimens obtained from the remaining pool of horses. A
negative result on a PCR assay for EHV-1 was required for all barn cohorts prior to horses
being released from restrictions. All animals determined to be infected with EHV-1 were
required to undergo repeated testing at weekly intervals until they were negative on the PCR
assay.

32
Biosecurity measures employed during the outbreak included limiting access to
affected barns to trainers, grooms and veterinary medical personnel. To reduce the potential
for fomite transmission, footbaths containing Environ One Stroke® were places at entry
points and recharged as necessary. To limit aerosol transmission, horses from non-affected
barns and other track personnel were restricted from coming within a distance of thirty feet
of the affected barns. Compliance was monitored and enforced by Churchill Downs
Racetrack security and state animal health regulatory personnel. Based on recommendations
outlined during an information sharing session on May 19, it was requested that horses
residing on the track grounds have temperature checks regularly and any horse with an
elevated temperature needed to be reported to state racing commission veterinarian. If a
horse was identified with a fever greater than 101.5°F, the practitioner involved was
directed to collect and submit samples to test for the presence of EHV-1 by PCR assay.
While regulatory restrictions were removed from all horses at Churchill Downs on
June 1, 2005, monitoring of horses for clinical evidence of EHM was continued by private
practitioners and by veterinarians employed by the Kentucky Racing Commission. The
observational period for the event lasted 66 days and encompassed the entire racing meet
which ended on July 10, 2005.
b. Murray State University, 2008
All horses located at the University’s agricultural research complex in Murray were
placed under a verbal state hold-order on April 8 to prevent the movement from the
premises until an on-site assessment could be conducted by regulatory personnel. The
movement restrictions were initially applied to all horses stabled in barns and pastures
located on the research farm and to horses stalled within the Agricultural Exposition Center,
including bucking stock and other university-owned horses. Informational meetings were
held on two separate occasions to provide updates of the investigation to horse owners and
to encourage compliance with regulatory restrictions. University employees and faculty
members with duties and responsibilities at the research farm and students with horses
stabled on the premises were advised to limit contact between horses while exercising, to
avoid the use of shared equipment, and to disinfect hands and equipment frequently.

33
Daily health monitoring of horses was conducted by a university veterinarian and
compliance with movement restrictions monitored by farm staff and state agricultural
employees. To determine whether there was any spread of EHV-1 from the farm, all horses
sold or moved from the premises within the three-month period prior to April 8, 2008 were
identified, traced and evaluated for evidence of clinical illness.
Following a 30-day period without additional cases of neurologic illness and a 21-
day interval after identification of the last PCR positive specimen, movement restrictions
placed on horses in the student barn were lifted by state regulatory officials on May 8, 2008,
two days before the end of the spring semester.
2. Data collection
a. Survey questionnaire
Customized questionnaires were developed for each outbreak investigation and used
to obtain information specific to each animal including ownership, management, travel, past
performance and medical history (Appendices A & B). For the Churchill Downs
investigation, the questionnaire was administered to the assistant trainer by regulatory
personnel and completed by reviewing treatment and billing records maintained on the
premises for each horse. The questionnaire utilized for the Murray State University
investigation was designed to be self-administered and intended to be completed by each
horse owner. Both questionnaires were a combination of closed and open-ended questions
and included space for written comments.
The intent of administering the questionnaires, in addition to obtaining basic
demographic information such as breed, age and gender, was to document the date of
disease onset of clinical cases, to identify potential risks factors for EHV-1 infection, and to
collect data from individual animals that would allow for the statistical and mathematical
exploration of diagnostic disease data.

34
b. Biological sampling
i. Churchill Downs Racetrack, 2005
Unclotted blood in EDTA anticoagulant and clotted blood for serum harvest were
obtained via jugular venipuncture from 35 of the 37 horses stabled in barn 38 on May 21,
2005. Two of the 37 horses were not available for sampling on this date as they had been
transported to a referral equine hospital due to the development of CNS disease. Blood
samples which had been collected from these two animals just prior to May 21 by the
attending veterinarian at Churchill Downs Racetrack were retrieved and included with the
35 samples for diagnostic evaluation.
In order to rule out other infectious causes of equine CNS disease, the nine animals
with neurological illness were evaluated for exposure to other infectious agents.
Convalescent serum samples were obtained from these nine animals and submitted to the
National Veterinary Services Laboratory (NVSL) in Ames, IA to test for the presence of
antibodies to West Nile Virus (WNV), Venezuelan Equine Encephalomyelitis virus (VEE),
Eastern Equine Encephalitis virus (EEE) and Western Equine Encephalomyelitis virus
(WEE). With reference to the two affected horses which were euthanized and considered
presumptive cases of EHM, specimens of brain tissue were submitted to the state public
health laboratory for rabies determination.
To document the cessation of viral shedding among affected animals, blood samples
were collected at weekly intervals and evaluated by PCR assay. In order to contain financial
costs of the investigation and to decrease the burden on laboratory personnel of performing
multiple assays, the presence of EHV-1 specific DNA was limited to PCR testing of the
samples of whole blood. Though not a requirement of the regulatory protocol, virus
isolation was also attempted from peripheral blood mononuclear cells (PBMC) obtained
from unclotted venous blood samples collected from horses on May 21, 2005. In addition,
serum neutralization (SN) antibody titers for EHV-1 were determined on blood samples
collected at weekly intervals throughout the disease outbreak as a means of documenting
recent exposure among the cohort of horses.

35
ii. Murray State University, 2008
On April 14, 2008, nasal swabs, unclotted and clotted blood samples were collected
from 36 of the 37 horses stabled in the student barn at Murray State University by state and
federal regulatory personnel; the index horse was located off-site at the veterinary referral
hospital at the time of the initial site visit and was not available for additional sampling. All
of the horses were visually inspected for evidence of clinical illness at the time of specimen
collection. Nasal swab specimens for virus isolation were collected from each horse by
placing a sterile 6” Dacron swab against the mucosal surface of the ventral meatus of one
nostril. Swabs were placed in individual tubes containing Brain Heart Infusion (BHI) broth
for transport to the Breathitt Veterinary Center. Swabs were maintained on wet-ice and
delivered to the laboratory within four hours of specimen collection. BHI broth was used as
transport medium because it was readily available, supplied to all Foreign Animal Disease
Diagnosticians (FADD) as an all-purpose transport medium, and on the recommendation of
NVSL and with the concurrence of Dr. Allen.
Blood specimens were collected from 36 horses located in the student barn on April
22 for EHV-1 SN titer and PCR determination and on May 5 for PCR testing for EHV-1.
c. Laboratory techniques for EHV-1 determination
The presence of equine herpesvirus DNA was looked for in PBMC obtained from
horses associated with each disease event through the use of a commercial kit designed to
extract genomic DNA from blood leukocytes and, for the 37 horses at Churchill Downs
including the index horse at Murray State University, conducted according to methods
described by Allen and Breathnach, (2006) or, for the 36 remaining horses at Murray State
University, through the use a standardized DNA extraction protocol (Breathitt Veterinary
Center Laboratory DNA SOP 0011, 2008). All samples were examined for both EHV-1
and EHV-4 using a multiplex PCR assay designed to target the glycoprotein H (gH) gene of
EHV-1 and the glycoprotein B (gB) gene of EHV-4 (Varrasso et al., 2001). The
determination of the genotype of the EHV-1 strain associated with EHM cases for each
outbreak were based on an allelic discrimination PCR assay which used primers specifically
designed to differentiate between a DNA polymerase gene expressing the G2, 254 genotype at

36
ORF 30 (neuropathogenic strain) versus one that expressing the A2,254 genotype at ORF 30
(non-neuropathogenic strain). The type-specific assay used to identify the strain of EHV-1
circulating among horses at both locations was based on a sequence capture –nested PCR
testing protocol (Allen, 2006).
Virus isolation was attempted from PBMC samples collected from horses at
Churchill Downs on May 21, 2005 and from nasal swabs collected on April 14, 2008 from
horses at Murray State University according to the methods of Allen, 2006 (OIE terrestrial
manual, chapter 2.5.7).
Sera was harvested from all blood specimens collected from horses in each disease
occurrence, either Churchill Downs or Murray State University, and checked for antibodies
to EHV-1 to the Serum Neutralization (SN) test protocol (OIE terrestrial manual, chapter
2.5.7).
d. Analytical procedures
i. Data management
Data were abstracted from questionnaires and laboratory reports and entered into an
Excel® spreadsheet (Microsoft Corporation, Redmond, WA, USA) for storage and
management. Data were analyzed using SAS for Windows, version 9.0 (SAS Institute,
Cary, NC, USA), Epi Info version 5.0 (CDC, Atlanta GA, USA) and R, a language and
environment for statistical computing and graphics (R Development Core Team 2009).
Data obtained during the two outbreak investigations was used primarily to facilitate
regulatory compliance with testing protocols and the observance of isolation periods.
Secondarily, the information was used to estimate through the use of statistical modeling,
the date of disease onset for subclinically infected animals.
A uniform definition for a clinical case of EHV-1 or for a horse subclinically
infected with EHV-1 was utilized for both outbreak investigations. A clinical case of
EHV-1 was defined as any equid residing at Churchill Downs Racetrack, Louisville,

37
Kentucky between May 9 and July 10, 2005 or which resided in the student barn at Murray
State University research farm between January 1 and May 10, 2008 which displayed
clinical signs consistent with EHV-1. Diagnosis of a presenting clinical case of EHV-1 was
confirmed by either a positive PCR test for EHV-1, or a serum neutralization (SN) titer to
EHV-1 of >1:256 on at least one serum sample or a fourfold or greater increase in titer
between paired samples collected during the course of the investigation. The use of a SN
titer > 1:256 in a single sample when coupled with clinical illness is considered indicative
of recent exposure and has been used by others investigators to identify cases of EHV-1
(Friday et al., 2000).
An inapparent or subclinically infected horse is defined as any equid residing at
Churchill Downs Racetrack between May 9 and July 10, 2005 or which resided in the
student barn at Murray State University research farm between January 1 and May 10, 2008
which did not display clinical signs consistent with infection with EHV-1 but which had
either a positive PCR test for EHV-1 or SN titer to EHV-1 of >1:256 on at least one serum
sample or a fourfold or greater increase in titer between paired samples collected during the
course of the investigation. For epidemiological and modeling building purposes, clinical
and subclinical cases were collectively considered infected and designated as a case of
EHV-1.
The designation of a case of EHV-1 with a SN titer > 1:256 in a single sample in a
horse that had not been vaccinated or that been vaccinated > 6 months prior against equine
herpesvirus was based on the studies which have shown that protective immunity conferred
by EHV-1 vaccination is short lived (Kydd et al., 2006). For this study, the determination
of a case of EHV-1 is a population based designation used for epidemiological purposes and
is not intended as a basis for individual animal diagnosis. A broad but uniform case
definition allows for inclusion of an expanded number of cases linked by a common cause
and is consistent with the intent and purpose of case definitions in public health
investigations such that not all cases of disease need to be laboratory confirmed (Sacks,
1985; CDC, 1990; Heymann, 2004). For each disease event, a case was excluded if an

38
alternative laboratory diagnosis was a more likely cause of the signs exhibited by clinically
affected animals.
Horses were considered to be clinically affected with EHV-1 if they had a fever
greater than 101.5°F or other signs characteristic of EHV-1 infection (ataxia, depression,
paralysis, decreased tail tone, urinary incontinence, and respiratory disease). A fever
(elevated temperature) was defined as a rectal temperature equal to or greater than 101.5°F
on at least one occurrence during the disease event. The designation of 101.5°F as a
threshold temperature for a fever is consistent with other investigators (Friday et al., 2000;
Goehring et al., 2006; Marenzoni et al., 2008; Wilsterman et al., 2011) who used 38.5°C
(101.3°F) as the diagnostic criteria for defining an elevated temperature for horses infected
with EHV-1. For horses with CNS disease, a grading system developed by the American
Association of Equine Practitioners was used to assess lameness (AAEP, 2011). The AAEP
lameness scale ranges from 0 to 5, with 0 being no perceptible lameness and horses
classified as a 5 are most severely affected. Specifically, Grade 1, Grade 2 and Grade 3
exhibited, respectively, mild, moderate or severe ataxia, paresis and/or gait deficits which
worsened with manual manipulation. Horses which stumble or fall at normal gaits are Grade
4 and recumbent horses are Grade 5. The date of onset of clinical signs was defined as the
first day when the horse was reported with at least one of the listed signs: fever, cough,
nasal discharge, ataxia, paresis, etc.
Simple descriptive and categorical statistical approaches were used to examine the
characteristics of the two cohorts under investigation and to calculate the frequency, range
and severity of clinical signs by age, gender, and breed. Univariate associations between
categorical variables and illness were determined using chi-square analysis for trend and,
for a comparison of age structure between cohorts, by the use of a t-test, assuming unequal
variance (Welch, 1947; Ruxton, 2006).
ii. Multivariate linear regression methods
Multivariate linear regression methods were applied to data obtained in the course of
each outbreak investigation. The date of clinical onset for horses with overt clinical signs

39
was obtained directly from completed questionnaires and, for those subclinically affected,
the date of onset determined by the use of linear regression methods applied to survey and
laboratory data. For horses with a known onset date, the date was recoded to the
corresponding Julian calendar date and treated as a continuous outcome variable. A
forward step-wise automated variable selection process was used to select, depending on the
specific disease event, from a set of five to ten possible explanatory variables for inclusion
into the regression models. Final model selection was based on identifying a significant
regression model (p < 0.05) with the lowest calculated AIC value of the models being
evaluated (Sauerbrei et al., 2007). For the Churchill Downs event, variables evaluated for
inclusion in the model included age, breed, gender, stall number, assigned groom, state of
origin and results of laboratory testing. Data elements used for model building for the
Murray State University event included variables that described horses with respect to
individual characteristics, time, place and contact between co-located horses. Co-variates
used in the model included stall number, age, breed, gender, laboratory results, vaccination
history, geographic origins, length of time at current location, recent travel and training
associations with other horses residing within the facility. A listing and description of the
variables used for regression analysis whereby the date of onset of EHV-1 illness was
estimated are provided in Table 2.1.
An over-all model fit for each of the regression models built for the separate events
was evaluated using residual analysis which included a visual inspection of diagnostic plots
of residuals. Multicollinearity (overly high correlation among independent variables) was
evaluated by calculating a variance inflation factor (VIF) for pair-wise comparisons of the
variables selected for inclusion into the model. Multicollinearity was not considered to be
significant for VIF values < 4.0 for any pair-wise comparison. Diagnostic evaluation of the
regression models was undertaken for the purpose of determining whether the data met the
assumptions of normal distributed data and whether linear regression methods were an
appropriate statistical procedure for analyzing the data. To assess the sensitivity of the
regression models for observed dates of illness onset, consecutive iterations of the final
models were run after removing a single observation (horse) from the analysis. Models

40
Table 2.1. Description of variables used for regression analysis whereby date of illness onset was estimated.
Variable
Designation
Definition
Churchill Downs Groom Continuous (1-10) Numerical designation of groom responsible for
daily husbandry duties Age Continuous (2-11) Year of age of horse
Gender 1- male (intact/geldings) 2- female
Gender of horse
Stall Continuous (1-37) Stall number where horses is stabled
State Categorical (1-5) State of origin for each horse 1- Arkansas/New York 2- Florida, 3- Louisiana, 4- Texas, 5- Kentucky
Date Julian calendar date Date horses arrived in Kentucky
NS No – 0 Yes – 1 Development of CNS
PCR Negative – 0 Positive – 1
Result of PCR testing on any sample collected during course of investigation
Murray State University
Stall Continuous (1-37) Stall number where horses is stabled
Area Categorical (1-3) Location in barn with respect to occupying an interior, exterior, or outer facing stall
Breed Categorical (1-3) 1-Quarterhorse 2-Thoroughbred 3- Other (Arab, Paint, Appaloosa, Tennessee Walker, Sport horse)
Gender 1- male (intact/geldings) 2- female
Gender of horse
Age Continuous (.17-22) Year of age of horse
PCR Negative – 0 Positive – 1
Result of PCR testing on any sample collected during course of investigation
EverVAC No – 0 Yes – 1 Has horse ever been vaccinated for EHV-1 RecVAC No – 0 Yes – 1 Has horse been vaccinated for EHV-1 recently
(within year but > 6 months ago)
FreqAssist 1- minimal 2- medium 3- frequent
Frequency that owner provided assistance to other horses owners for care and feeding

41
were evaluated for their level of significance based on the absence of a single animal with a
documented date of illness onset. If the removal of an individual horse produced a majority
of non-significant models, then the predicted date of illness onset was used for further
analysis including survival and mathematical modeling instead of the observed date of
illness onset. Both outbreaks were treated similarly with respect to the use of a date of
illness onset such that, if one outbreak utilized the predicted date, then the other outbreak
used the predicted date. Estimates obtained for the predicted date of illness onset through
regression modeling were rounded to the nearest whole day.
iii. Survival analysis
Survival for horses within each cohort was estimated by K-M methods using the
predicted date of illness onset derived through regression methods. Life-tables were
constructed using K-M methods for each disease event based on the predicted date of
disease onset with dates being recoded as a time interval starting with the first case as day
one. The probability of escaping infection was displayed graphically as a survival curve and
the median survival function calculated for each separate disease event.
Survival curves were compared between outbreaks with respect to the duration and
magnitude of the outbreak and their median survival times. The log-rank test was used to
compare the time to infection (survival time) for each equine cohort. The two-sided
probability value was set to 0.05
iv. Mathematical modeling
An estimate for R0 was obtained for each disease event location using the methods
described by Anderson and May (1991). There are relatively few published estimates for
the duration of viral shedding for EHV-1 based on virus isolation(Allen et al., 1999; Allen,
2002b; Allen and Bryans –unpublished data, 1986; Goodman et al., 2006; Allen and
Breathnach, 2006; Pusterla et al., 2010; Goehring et al., 2010; Burgess et al., 2012) as most
researchers have focused on determining the duration and magnitude of viremia caused by
herpesviruses instead of quantifying the amount of infective virus shed in respiratory
secretions of infected animals. This avenue of research is not unexpected since elimination

42
of the viremia induced by EHV-1 is key to preventing clinical cases and essential to the
identification and development of candidate efficacious vaccines. In general, mature horses
have a shorter duration of viremia and shed EHV-1 for shorter periods of time than young
naïve horses, regardless of whether the strain expresses the ORF30G2,254 genotype or the
ORF30 A2,254 genotype (Allen and Bryans –unpublished data, 1986; Goodman et al., 2006;
Allen, 2008). Subsequently, a value of four days was used as the duration of viral shedding
for the Churchill Downs event where neurologic disease predominated and seven days for
the Murray State University event where respiratory illness was the predominant clinical
sign. These values were then used to calculate the R0 and the effective reproductive number
(Re) for the respective outbreaks.
For each disease event, the effective reproductive number (Re) was calculated for
each incident case and graphically displayed as a curve. Estimates for Re, the generation
time, and the proportion and temporal pattern of asymptomatic infection occurring within
each cohort were calculated using methods described earlier (see Appendices E through H).
Because the prodromal period for EHV-1 is relatively short and estimated to be
between 12-24 hours (Ostlund, 1992), analysis of EHV-1 outbreak data obtained for this
study is limited to quantifying asymptomatic spread within the equine cohorts under
investigation. Therefore, further analysis of outbreak data obtained from this study is
limited to quantifying asymptomatic infection only and the evaluation of disease spread that
occurs specifically within the prodromal period will not be undertaken.
A simple deterministic Reed-Frost chain binomial (state transition) model was
constructed for each outbreak using methods described elsewhere (Carpenter, 1984). The
models were created using a spreadsheet matrix in Excel® and consisted of three states:
susceptible (S), infectious (I) and recovered (R) and one probability: probability of effective
contact (p). For the purposes of mathematical modeling, the recovered or immune class
consists of individuals who are no longer acutely infected with a pathogen, who would not
contribute to the infectious process and are incapable of transmitting infection (Vynnycky
and White, 2010). For the final Reed-Frost models, the value for (k) - the number of

43
effective contacts made by an individual during the time period (t) used to calculate (p) -
was used to optimize the fit between the predicted and observed incidence in each disease
event by using the Solver add-in for the Excel® spreadsheet (Wahlström, et al., 1998).
A baseline or initial Herd Immunity (HI) level was calculated for each event
(Appendix I) using the methods described by Fine (1993), with the values interpreted as the
cohort-level immunity threshold needed for disease elimination. To evaluate the effects of
prophylactic vaccination on the duration and the cumulative number of EHV-1 cases that
occurred in each outbreak, different levels of herd immunity were incorporated into the
Reed-Frost model for each disease event by decreasing the probability of an adequate
contact (1-qct) by an amount equal to the corresponding increase in herd immunity.
Consequently, individual models for each outbreak and their corresponding epidemic curves
were constructed by increasing the herd immunity level above the initial baseline by 10%,
25%, 50%, 75% and 90%. Since we are assuming that vaccine is given to every horse, the
results from the models are, in essence, a reflection of vaccine efficacy.
A single graphic plot was used to visually compare and contrast the epidemic curves
for the various levels of herd immunity within each equine cohort.
A summary of the software code used for this study is provided in Appendix J.
Copyright © Barry Jay Meade 2012

44
CHAPTER THREE
RESULTS
A. Descriptive comparisons of outbreaks
A total of 37 horses, considered at risk of acquiring EHV-1 infection, were stabled
in barn 38 at Churchill Downs Racetrack during the EHV-1 event. None of the horses in this
barn had been vaccinated against equine herpesvirus 1 or 4 during the six-month period
preceding the recognition of the first cases of CNS disease in this cohort. Of the 37 horses
located within this barn, 34 (91.9%) met the case definition for being infected with EHV-1
(Appendices C and D).
Of the 37 horses stabled in the student barn at the Murray State University research
farm, 35 were considered at risk for infection. Two of the 37 horses at Murray State
University were not considered at risk as they had been immunized immediately prior to the
beginning of the EHV-1 incident. Their exclusion from the analysis is supported by their
lack of clinical signs and because neither of these two horses was PCR positive on repetitive
sampling or demonstrated a change in antibody titer over the course of the investigation. Of
the 35 horses considered at risk for infection, 30 (85.7%) met the definition of an EHV-1
case (Appendices C and D).
A summary of the diagnostic testing and occurrence of clinical illness for the two
disease outbreaks is presented in Table 3.1 and is inclusive of horses on both premises that
were determined to be at risk of acquiring EHV-1. For horses at Churchill Downs, all PCR
tests were conducted using methods described by Allen and Breathnach (2006), and, for
those which were positive, are reflective of the occurrence an EHV-1 strain that expresses
G2,254 genotype at ORF 30 (neuropathogenic variant). For Murray State University, only the
index horse was tested using these methods with remaining horses at Murray State
University being tested using methods which could distinguish between EHV-1 and EHV-4
only.

45
Table 3.1. Comparison of diagnostic testing and clinical presentation for each separate EHV-1 disease event – Churchill Downs Racetrack, 2005 and Murray State University, 2008 Horses with specific signs and/or laboratory
result by outbreak location Assay/clinical feature (s) Churchill Downs Murray State University Number (%) Number (%) PCR positive 9/37 (24.3) 16/35 (45.7) Serologic positivea 30/37 (81.1) 15/35 (42.8) Fever (>101.5°F) 15/37 (40.5) 0 Respiratory illness 0 18/35 (48.6) Neurological illness 9/37 (24.3) 3/35 (8.6) Fever w/ positive PCR 7/15 (46.7) 0 Fever w/ positive serology 14/15 (93.3) 0 Fever w/ neurological illnessb 7/15 (46.7) 0 Respiratory illness w/ neurological illness 0 1/18 (5.5) Respiratory illness w/ positive PCR 0 11/18 (61.1) Respiratory illness w/ positive serology 0 5/18 (27.8) Fever or PCR positive 17/37 (45.9) 16/35 (45.7) Fever or serologically positive 34/37 (91.9) 15/35 (42.9) Fever or neurological illness 17/37 (45.9) 3/35 (8.6) Respiratory illness or neurological illness 9/37 (24.3) 20/35 (57.1) Respiratory illness or PCR positive 9/37 (24.3) 30/35 (85.7) Respiratory illness or serologic positive 30/37 (81.1) 26/35 (78.8) aSerological positive is defined as an SN titer to EHV-1 of >1:256 on at least one serum sample or a fourfold change (increase or decrease) in titer on paired samples bOdds ratio (Fisher exact) 8.75; 95% CI (1.22, 97.3), p-value = 0.017
Of the 15 horses at Churchill Downs Racetrack that developed fever, only one
animal did not demonstrate a significant change in antibody titer even though this horse was
diagnosed with neurological illness. All nine PCR positive horses were also serologically
positive; seven (78%) had fevers but only four (44%) of the nine PCR positive animals with
fever were diagnosed with neurological illness. The odds for developing EHM were 8.75
times greater for febrile horses compared to afebrile horses. In reference to the nine horses
which presented with neurologic illness, all were negative for WNV, EEE, and WEE based
on testing conducted at NVSL. The rapid onset of illness, presence of clinical disease in
older horses and the occurrence of multiple cases on a given premise suggest that protozoal
myeloencephalitis or non-infectious causes of neurologic disease such cervical stenotic
myelopathy, cervical instability, or trauma were not responsible for these outbreaks. Rabies

46
had been ruled out based on negative results on brain specimens collected from the two
index cases at Churchill Downs and recovery of the affected horses. Of these nine
neurological horses, seven were judged to have mild ataxia (grade I), one exhibited a
moderate ataxia (grade III) and one had a severe gait deficit (grade IV). Overall, 34 animals
had at least two of the clinical or diagnostic consistent with cases of EHV-1 cases.
Of the 18 horses stabled at Murray State University with owner-reported signs of
respiratory illness, eleven (61.1%) were PCR positive and 5 (27.8%) demonstrated either a
fourfold or greater increase in SN titer or had a SN titer >1:256 between paired sera on at
least one blood specimen collected over the course of the investigation. Of the eleven PCR
positive horses with respiratory illness, only two (18.2%) were also serologically positive.
Of the three animals with neurological signs, only one was reported to have had respiratory
illness and two were PCR positive. For the 18 horses with respiratory illness, a date for
onset of clinical signs was provided by the owner for 16 (89.9%) horses. Clinically, horses
were described most commonly by their owners as having a mild to moderate serous nasal
discharge of greater than two-day duration. Five of the horses developed a cough but none
were reported to have a decrease in appetite. Seventy-eight percent (14/18) of the horses
with respiratory illness were also positive on PCR or were classified as positive for EHV-1
in the SN test. To rule out EAV as a possible cause of respiratory illness for horses within
this equine cohort, serum samples were tested for the presence of antibodies to EAV in the
SN test. Of the blood specimens collected during the course of the investigation, serum
samples collected at the beginning of the investigation were available for testing from 16 of
the 18 horses with respiratory illness; all were negative to EAV. To rule out Equine
Influenza (EI) as a cause of the respiratory illness, these same 16 samples were also tested
using a recently developed PCR assay; all were negative to EI. Four animals with
respiratory illness did not have an SN titer to EHV-1 of >1:256 on at least one serum
sample or have a fourfold or greater increase in titer between paired samples and were not
PCR positive. However, they were included as cases of EHV-1 based on the demonstration
of respiratory illness which occurred within the time interval of interest, were stabled in
association with other EHV-1 positive cases, lacked a history of recent immunization
against EHV-1 (no vaccine > 6 months) and were negative for EAV antibodies and EI

47
nucleic acid. Overall, 30 animals met the definition for a case of EHV-1. A comparison of
case-animals by breed, age and gender by outbreak location is presented in Table 3.2. In
general, the horses at Churchill Downs Racetrack and Murray State University student barn
were similar with respect to breed and gender but the horses located in the student barn at
Murray State University were significantly older (p < 0.001), double the ages of the horses
at Churchill Downs Racetrack. Gender was not associated with an increased risk of EHV-1
infection for Churchill Downs Racetrack (odds ratio, 1.78; 95% CI 0.8, 11.34) or the
Murray State University facility (odds ratio, 1.76; 95% CI 0.04, 5.25) or for both events
combined (odds ratio 1.21; 95% CI 0.2, 7.07).
Table 3.2. Characteristics of case and non-case horses – Churchill Downs Racetrack, 2005 and Murray State University, 2008
Outbreak location Characteristics Churchill Downsb Murray State Universityc
Cases Non-cases Total Cases Non-cases Total Breed Thoroughbred 33 3 36 22 1 23 Quarter-horse 1 0 1 3 3 6 Other 0 0 0 5 1 6 Total 34 3 37 30 5 35 Mean age (years)a 3.8 2.7 3.7 7.7 9.6 7.5 Genderd Male (colt/gelding) 18 2 20 17 2 19 Female (mare/filly) 16 1 17 13 3 16 Total 34 3 37 30 5 35 a Welch two-tailed t-test for groups with unequal sample size and unequal variance. t = 4.15 with 43 df; 95% CI (1.935, 5.585), p-value < 0.001 b Odds ratio (Fisher exact) 1.78; 95% CI (0.8, 111.34), p-value = 1.0 c Odds ratio (Fisher exact) 1.96; 95% CI (0.19, 26.23), p-value = .642 d Odds ratio (Fisher exact) 1.21; 95% CI (0.2, 7.07), p-value = 1.0
A summary of a few standard epidemiological measures of disease occurrence for
the two outbreaks are presented in Table 3.3. An overall attack rate of 91.9% and 85.7% for
the occurrence of EHV-1 infection was calculated for the Churchill Downs and Murray
State University outbreaks, respectively. Though the attack rate among horses at Churchill

48
Table 3.3. Measures of disease occurrence – comparisons between EHV-1 outbreaks at Churchill Downs Racetrack, 2005 and Murray State University, 2008 Outbreak location Epidemiologic measure of interest Churchill Downs Murray State
University aAttack rate
(%) Number of EHV-1
case horses Number horses on premises
34/37 (91.9)
30/35 (85.7)
b Clinical attack rate
(%)
Number horses with EHV-1 compatible illness
Number of case horses
17/34 (50.0)
20/30 (66.7)
Case-fatality rate (%) 0c 0 dAge and clinical sign-specific morbidity (fever, CNS or respiratory illness)
e Odds ratio (relative to baseline)
f Odds ratio (relative to baseline)
< 2 yrs of age 1.0 1.0 3 yrs of age 0.34 0.11 4-5 yrs of age 0.19 0.44 > 6 yrs of age 0.0 0.22 a Odds ratio 1.73; 95% CI (0.57, 5.33), p-value = 0.28 b Odds ratio 2.19; 95% CI (0.71, 6.79), p-value = 0.12c The index cases at Churchill Downs which were euthanized due to complications of EHM did not reside in barn 38 and were not included in totals for data analysis. d Morbidity based on the occurrence of fever in horses at Churchill Downs and respiratory illness in horses at Murray State University e Chi-square for linear trend 4.94; p-value = 0.026 f Chi-square for linear trend 0.724, p-value = 0.395
Downs was greater than for those at Murray State University, these indices did not differ
statistically (p-value = 0.84). Of the 35 horses stabled in the student barn at Murray State
University which were at risk of acquiring EHV-1 infection, a larger proportion were
symptomatic (57.4% versus 44.1%) compared with the horses stabled at Churchill Downs
Racetrack. None of the horses within the defined cohorts, stabled in barn 38 at Churchill
Downs Racetrack or the student barn at Murray State University, died during their
respective disease events and no horses at Churchill Downs Racetrack developed respiratory
illness. The two horses at Churchill Downs that were the first to be diagnosed with EHM
and, subsequently euthanized, were not housed in barn 38 and therefore were excluded as

49
members of the cohort of animals used for statistical or mathematical modeling. The
significance of these two horses to the study is that they served as sentinels for the events to
follow; although they were seronegative for EHV-1 at the time of clinical onset, they were
positive to EHV-1 by PCR.
For horses at Churchill Downs Racetrack, there was an age related trend (Chi-square
for linear trend 4.94; p-value = 0.026) for the occurrence of fever in so far as older horses
were found to be less likely to develop fever following exposure to the particular strain of
EHV-1 circulating within the population than were younger horses.
Conversely, there was no age related difference in the occurrence of respiratory
illness among horses at Murray State University (Chi-square for linear trend 0.724, p-value
= 0.395). Of the three horses at Murray State University with neurological signs, one was a
14-year-old gelding with a severe gait deficit (grade III), one was a 14-year-old gelding with
stiff rear limb gait (grade I) and the other animal was a 3-year-old filly with mild ataxia
(grade I). The neurological status for these three horses was determined by a veterinarian
and only the 14-year-old gelding with the grade I lameness was noted to have an underlying
medical condition – a sole abscess – at the time that CNS signs were observed; this animal
also exhibited respiratory signs.
B. Statistical modeling – determination of the date of illness onset for subclinical cases
1. Churchill Downs Racetrack, 2005
a. Exploratory data analysis
Summary statistics for three continuous covariates, abstracted from completed
survey questionnaires used to obtain information on individual horses stabled at Churchill
Downs Racetrack, are presented in Table 3.4. Overall, 10 grooms provided care for 37
horses whose age distribution is skewed toward younger animals.
With respect to the 17 horses at Churchill Downs with a documented date of onset of
clinical signs, either fever or neurological, a summary listing for the continuous covariates
is presented in Table 3.5. For these horses, the distribution of stall numbers is similar to the

50
values in Table 3.4 but the numerical values for groom designation and the age of horses
have a smaller range. An examination of the data for the presence of outliers did not reveal
any data values 1.5 times the interquartile range above the 3rd or below the 1st quartile.
Table 3.4. Summary statistics of three continuous variables for all horses stabled in barn 38 – Churchill Downs Racetrack, 2005
Measure Stall Number Groom Age Minimum 1 1 2.0 1st Quartile 10 2 2.0 Median 19 8 3.0 Mean 19 4.7 3.7 3rd Quartile 28 7 4.0 Maximum 37 10 11.0
In the case of the 17 horses that developed fever and/or neurological signs, the first
clinical case was recognized on May 5 and the last on May 13, an interval of eight days.
Table 3.5. Summary statistics for response variable and three potential continuous predictor covariates for symptomatic horses, fever or CNS – Churchill Downs Racetrack, 2005
Measure Julian calendar date of the onset of clinical cases
(actual date)
Stall Number
Groom Age
Minimum 125.0 (5/5/05) 1.0 1.0 2.0 1st Quartile 127.0 (5/7/05) 9.5 2.5 2.0 Median 128.0 (5/8/05) 15.0 4.0 3.0 Mean 128.6 (5/8/05) 16.7 3.1 3.1 3rd Quartile 130.5 (5/10/05) 24.5 4.0 3.5 Maximum 133.0 (5/13/05) 36.0 4.0 6.0
b. Multivariate linear regression
With respect to the Churchill Downs outbreak, the step-wise model selection process
identified a multiple linear regression model with the lowest AIC value that included only
groom and age as variables in the final model. The automated model selection process
originally included the variable stall in a model with the lowest AIC value. However, the
VIF value for the pairwise comparison for the variables stall and groom exceeded 2.5,
suggesting that multicollinearity – the occurrence of highly correlated variables – would be
an issue should both stall and groom be included in the final model. This was remedied by

51
dropping the variable stall from the final model. Table 3.6 depicts the covariates in the final
regression model with corresponding estimates and significance levels of their partial
contributions to the model. Overall, this model was considered statistically significant with
a p-value of 0.0262.
Table 3.6. Main effects model for date of illness onset – Churchill Downs Racetrack, 2005
Covariates Model parameter
Beta estimate
Std. dev.
95% Confidence intervals
Intercept Β0 124.733 1.9889 (120.467, 128.999) Groom Β1 0.03553 0.2392 (-0.478, 0.549) Age Β2 1.3354** 0.4319 (0.409, 2.262) Significance levels >0.001***, >0.01**, > 0.05* Residual standard error: 2.481 on 14 degrees of freedom Multiple R-Squared: 0.4057, Adjusted R-squared: 0.321 F-statistic: 4.779 on 2 and 14 df, p-value: 0.02617
Graphic plots of the diagnostic plots for the final regression model are displayed in
Figure 3.1. For the plot of the model residuals, the points appear to be randomly
distributed, supporting the assumptions of a zero mean and constant variance. The normal
probability plot of the quantiles has a reasonable linear pattern with a slight departure from
the fitted line at the tails of the plotted line which indicates more variance than would be
expected in a completely normal distribution. The histogram of the residuals is slightly
skewed to the right. Visually, the pattern of the plotted points in the plot of the model
residuals appear randomly distributed and would support an assumption of normal data.
The VIF estimate for the pair-wise comparison between the variables groom and age was
1.104. Any departure from normality identified by the diagnostic plots is likely due to
sparse data and would not prohibit the use of the final model for predictive modeling.

52
Figure 3.1. Plot of main effects model and diagnostic plots for final regression model – Churchill Downs Racetrack, 2005
.
An epidemic curve based on the predicted date of illness onset for all 34 cases of
EHV-1 is presented in Figure 3.2. With respect to the Churchill Downs Racetrack outbreak,
the first EHV-1 case occurred on May 5 and the last on May 18: a period of 14 days. The
outbreak peaked at ten cases on May 6, eleven days before initiation of the regulatory
response on May 17, 2005.
126 128 130 132 134
120
125
130
135
140
Fitted Model
Dat
e of
Illn
ess
Ons
et
128 129 130 131 132 133
-4-2
02
4
Fitted Values
Res
idua
ls
-2 -1 0 1 2
-4-2
02
4
Theoretical Quantiles
Sam
ple
Qua
ntile
s
Residuals
Fre
quen
cy
-4 -2 0 2 4 6
01
23
45
6Normal probability (Q-Q) plot Histogram of residuals
Plot of residuals Main effects model (actual versus fitted)

53
Figure 3.2. Distribution of the number of cases of EHV-1 by date of illness onset, Churchill Downs Racetrack, 2005
The dates of disease onset for the EHV-1 cases which occurred on May 14 and May
18 were determined by regression methods as these horses were subclinically infected.
Although these horses did not have neurological signs, they met the case definition based on
a positive PCR result on samples of PBMC. Of note, the attending veterinarian initiated a
14-day course of treatment with Acyclovir® beginning May 15 for all 37 horses stabled in
barn 38 at Churchill Downs Racetrack. Based on the estimated dates for disease onset, this
therapy would have begun when only five horses in the cohort had not yet been exposed to
EHV-1, of which two would eventually become EHV-1 cases.
2. Murray State University, 2008
a. Exploratory data analysis
Summary statistics for the continuous covariates abstracted from the survey
questionnaires for the 35 horses considered at risk of acquiring EHV-1 are presented in
Table 3.7. Overall, the horses stabled in the student barn at Murray State University ranged
0
2
4
6
8
10
12N
um
ber
of
EH
V-1
cas
es
Week of EHV-1 onset

54
in age from 2 months to 22 years with an average age of 7.9 years. With respect to the 18
horses in the student barn at Murray State University with a documented date for the onset
of respiratory signs or neurological illness, a summary of three continuous and four
categorical covariates used in model building are presented in Table 3.8. With the
exception of a 22 year-old asymptomatic gelding, the horses at Murray State University
with a defined date of illness onset are similar in age to the entire cohort. An examination
of the data for the presence of outliers did not reveal any data values 1.5 times the
interquartile range above the 3rd or below the 1st quartile.
Table 3.7. Summary statistics of two continuous variables for 35 horses at risk for EHV-1 infection stabled in the student barn – Murray State University, 2008
Measure Stall number Age Minimum 2 .17 (2 months) 1st Quartile 9.5 3.5 Median 18 7.0 Mean 18 7.9 3rd Quartile 26.5 12.5 Maximum 60 22.0
Table 3.8. Summary statistics for response variable and five potential predictor covariates for the 18 horses with a documented date for illness onset – Murray State University, 2008
Measure Julian calendar date of onset
of clinical cases (actual date)
Stall Area Age Breed FreqAssit Gender
Minimum 41.0 (3/2/05) 2 1.0 1.0 1.0 1.0 1.0 1st Quartile 75.5 (3/24/05) 33.8 1.0 3.0 1.0 1.0 1.0 Median 90.5 (4/5/05) 45 2.0 4.5 1.0 2.0 1.5 Mean 89.6 (4/4/05) 39.7 1.8 6.9 1.6 2.1 1.5 3rd Quartile 105.0 (4/15/05) 53.5 2.0 12.0 2.0 3.0 2.0 Maximum 128.0 (5/8/05) 60 3.0 15.0 3.0 3.0 2.0
b. Multivariate linear regression
Similarly to the model selection process used for the Churchill Downs data, the
initial model for the Murray State University outbreak started as a simple linear model with
the variable stall included as the only covariate. Through the course of adding and

55
subtracting variables, the step-wise model selection process for multiple linear regression
modeling identified several statistical models with low or comparable AIC values for
consideration. Diagnostic plots and VIF values were compared for these candidate models
and a final model selected based on the overall data fit and on a visual examination of
diagnostic plots. The covariates for the final regression model with corresponding estimates
and significance levels of their partial contributions to the model are shown in Table 3.9.
Overall, this model had a p-value < 0.01.
Table 3.9. Main effects model for date of illness onset – Murray State University, 2008
Covariates Model parameter
Beta estimate
Std. dev. 95% Confidence intervals
Intercept Β0 180.3171*** 22.0990 (95.822, 210.491) Stall Β1 -0.5006 0.2618 (-1.359, 0.0669) Area Β2 -16.5779* 6.6816 (-31.418, 0.526) Breed Β3 -10.5956* 4.1244 (-18.214, 2.678) FreqAssist Β4 -11.8510* 4.0510 (-39.970, 0.332) Significance levels: >0.001***, >0.01**, > 0.05* Residual standard error: 14.17 on 13 degrees of freedom Multiple R-Squared: 0.6652, Adjusted R-squared: 0.5621 F-statistic:6.456 on 4 and 13 df, p-value: 0.004341
Graphic plots of the main effects model and the accompanying diagnostic plots are
displayed in Figure 3.3. On examination, the plotted residuals appear to be randomly
distributed and support the assumptions of a zero means and constant variance. Visually, the
normal probability plot of the quantiles (Q-Q plot) and the histogram of the residuals
suggest that the data approximate a normal distribution, though the tail of the Q-Q plot and
the histogram of the residuals suggest that the data is skewed to the left. The VIF estimates
for all pair-wise comparisons of variables in the final model ranged between 1.0315 and
2.1709 indicating a lack of multicollinearity among the variables. As with the Churchill
Downs model, deviations from normalcy are likely due to sparse data and would not
preclude the use of this model for predictive modeling.

56
Figure 3.3. Plot of main effects model and diagnostic plots for final regression model – Murray State University, 2008
The epidemic curve for the 30 EHV-1 infected horses stabled at Murray State
University is depicted in Figure 3.4. It shows that the outbreak began the week of March 1,
2008 and lasted 9 weeks with the last cases occurring the week of April 26, 2008. The
curve demonstrates a biphasic peak in the number of cases with the beginning of the second
peak occurring the week of April 5, 2008; a time period that corresponds to the initiation of
the official regulatory response.
60 70 80 90 110
6080
100
120
Fitted model
Dat
e of
illn
ess
onse
t
60 70 80 90 110
-20
010
Fitted Values
Res
idua
ls
-2 -1 0 1 2
-20
010
Theoretical Quantiles
Sam
ple
Qua
ntile
s
Residuals
Fre
quen
cy
-20 -10 0 10 20
01
23
4
Main effects model (actual versus fitted) Plot of residuals
Normal probability (Q-Q) plot Histogram of residuals

57
Figure 3.4. Distribution of the number of cases of EHV-1 by week of illness onset, Murray State University, 2008
C. Survival analysis
1. Churchill Downs Racetrack, 2005
A life table was constructed and used to estimate the survival distribution of horses
stabled at Churchill Downs (Table 3.10). The S (ti) column gives the estimated survival
function for the listed time intervals; these values are plotted in Figure 3.5. None of the 37
horses located in barn 38 at Churchill Downs Racetrack were lost to follow-up or censored
prior to the end of the observational period. From the K-M survival curve shown in Figure
3.5, the estimated median time for horses to become an EHV-1 case was 3.1 days. In total,
three horses (8.1%) within this cohort escaped infection.
0
1
2
3
4
5
6
7N
um
ber
of
EH
V-1
cas
es
Week of EHV-1 onset

58
Table 3.10. Life table for horses located at Churchill Downs Racetrack, 2005a Survival parameters Interval
(ti) (n´i) (di) wi + li S(ti)
1.0 37 1 0 0.9730 1.3 36 1 0 0.9459 1.4 35 1 0 0.9189 1.7 34 1 0 0.8919 1.8 33 2 0 0.8378 2.0 31 1 0 0.8108 2.1 30 3 0 0.7297 2.2 27 2 0 0.6757 2.3 25 1 0 0.6486 2.5 24 2 0 0.5946 2.9 22 3 0 0.5135 3.1 19 1 0 0.4865 3.4 18 1 0 0.4595 3.6 17 2 0 0.4054 3.9 15 2 0 0.3514 4.0 13 1 0 0.3243 5.1 12 1 0 0.2973 5.2 11 1 0 0.2703 5.3 10 1 0 0.2432 5.5 9 1 0 0.2162 6.5 8 2 0 0.1622 6.9 6 1 0 0.1351 10.8 5 1 0 0.1081 13.4 4 1 0 0.0811 14.0 3 3 0 0
a Symbols: n´i, number of horses not infected at beginning of interval; di, number of horses infected during interval; wi + li ,number horses lost to follow-up during event; S(ti), cumulative proportion that avoided infection to end of interval

59
Figure 3.5. Kaplan-Meier plot for time to infection for horses located at Churchill Downs Racetrack, 2005
Time to Infection (days)
2. Murray State University, 2008
A life table was constructed and used to estimate the survival distribution of horses
stabled at Murray State University (Table 3.11). The S (ti) column gives the estimated
survival function for the listed time intervals; these values are plotted in Figure 3.6.
With respect to the Murray State University outbreak, none of the 35 horses located
in the student barn and considered at risk of EHV-1 infection were lost to follow-up or
censored prior to the end of the observational period. The K-M survival curve shown in
Figure 3.6 provides an estimate of 29.8 days for the median survival time for EHV-1
0 2 4 6 8 10 12 14
0.0
0.2
0.4
0.6
0.8
1.0
Infe
ctio
n P
rob
abil
ity
S (0.5)
Median time to infection = 3.1 days

60
infected horses. Ultimately, a total of five horses (14.3%) did not get exposed to EHV-1 and
become infected over the course of the outbreak.
Table 3.11. Life table for horses located at Murray State University, 2008a Survival parameters Interval
(ti) (n´i) (di) wi + li S(ti)
1.0 35 1 0 0.971 3.4 34 1 0 0.943 12.6 33 1 0 0.914 13.1 32 1 0 0.886 14.2 31 1 0 0.857 14.7 30 1 0 0.829 15.2 28 2 0 0.800 16.2 28 1 0 0.771 23.1 27 1 0 0.743 23.6 26 1 0 0.714 23.7 25 1 0 0.686 23.9 24 1 0 0.657 24.7 23 1 0 0.629 26.7 22 1 0 0.600 28.8 21 1 0 0.571 29.0 20 1 0 0.543 29.8 19 1 0 0.514 33.5 18 1 0 0.486 35.3 17 1 0 0.457 35.8 16 1 0 0.429 36.3 15 1 0 0.400 37.1 14 1 0 0.371 37.4 13 1 0 0.343 41.8 12 1 0 0.314 41.9 11 1 0 0.286 43.9 10 1 0 0.257 52.1 9 1 0 0.229 53.1 8 1 0 0.200 55.9 7 1 0 0.171 62.0 6 1 0 0.143 63.0 5 0 0 0
a Symbols: n´i, number of horses alive at beginning of interval; di, number of horses infected during interval; wi + li ,number horses lost to follow-up during event; S(ti), cumulative proportion surviving to end of interval

61
Median survival = 51 days
Figure 3.6. Kaplan-Meier plot for time to infection for horses located at Murray State University, 2008
Time to Infection (days)
3. Comparison of survival between outbreak locations
The K-M survival curves estimated from the Churchill Downs and Murray State
University data are displayed in Figure 3.7. This graph, which incorporates both outbreak
investigations, illustrates a survivor function for the Churchill Downs horses that
consistently lies below the survivor function for the Murray State University horses.
The log-rank statistic for the comparison of survival between equine cohorts is 20.6
(p-value < 0.001) indicating that these groups have significantly different K-M survival
patterns. Horses stabled in the affected barn at Churchill Downs are at a 3.02 times greater
risk for EHV-1 infection (p < 0.001) per day relative to horses stabled in the student barn at
Murray State University (Table 3.12).
Infe
ctio
n P
rob
abil
ity
S (0.5)
Median time to infection = 29.8 days

62
Figure 3.7. Kaplan-Meier plots for horses during an EHV-1 event, Churchill Downs Racetrack versus Murray State University
Time to Infection (Days)
Table 3.12. Comparison of survival by location of disease event
Location
Number of events
(Observed)
Number of events
(Expected)
(O – E)2 /Ea
Median time to infection
in days (95% CI)
Churchill Downs 37 20.6 13.11 3.13 (2.3, 4.0)
Murray State
University 35 51.4 5.25 29.8 (23.6, 36.3)
aLog-rank test = 20.6 with 1 df, p-value <0.001; CI = Confidence interval. Hazard ratio (Infection ratio) = 3.02 with 71 df; 95% CI (1.84, 4.95), p-value < 0.001
Infe
ctio
n P
rob
abil
ity
Churchill Downs Murray State University
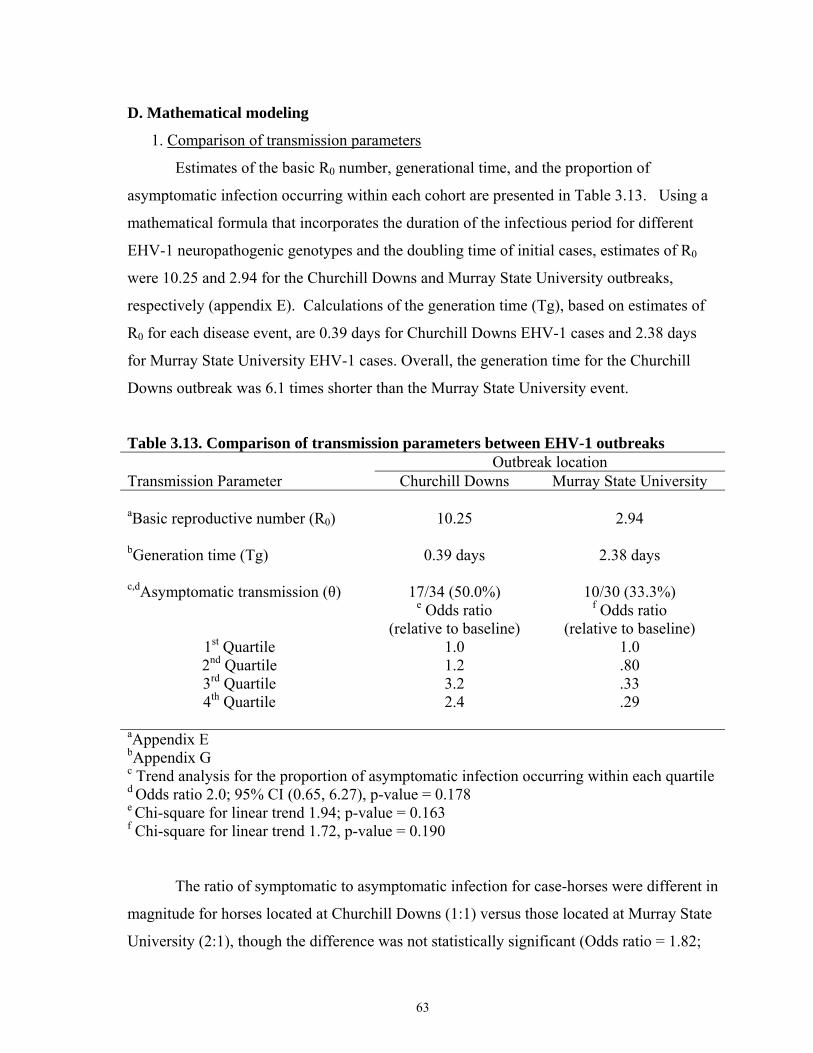
63
D. Mathematical modeling
1. Comparison of transmission parameters
Estimates of the basic R0 number, generational time, and the proportion of
asymptomatic infection occurring within each cohort are presented in Table 3.13. Using a
mathematical formula that incorporates the duration of the infectious period for different
EHV-1 neuropathogenic genotypes and the doubling time of initial cases, estimates of R0
were 10.25 and 2.94 for the Churchill Downs and Murray State University outbreaks,
respectively (appendix E). Calculations of the generation time (Tg), based on estimates of
R0 for each disease event, are 0.39 days for Churchill Downs EHV-1 cases and 2.38 days
for Murray State University EHV-1 cases. Overall, the generation time for the Churchill
Downs outbreak was 6.1 times shorter than the Murray State University event.
Table 3.13. Comparison of transmission parameters between EHV-1 outbreaks Outbreak location Transmission Parameter Churchill Downs Murray State University aBasic reproductive number (R0) 10.25 2.94 bGeneration time (Tg) 0.39 days 2.38 days c,dAsymptomatic transmission (θ) 17/34 (50.0%) 10/30 (33.3%) e Odds ratio
(relative to baseline)
f Odds ratio (relative to baseline)
1st Quartile 1.0 1.0 2nd Quartile 1.2 .80 3rd Quartile 3.2 .33 4th Quartile 2.4 .29
aAppendix E bAppendix G
c Trend analysis for the proportion of asymptomatic infection occurring within each quartiled Odds ratio 2.0; 95% CI (0.65, 6.27), p-value = 0.178e Chi-square for linear trend 1.94; p-value = 0.163 f Chi-square for linear trend 1.72, p-value = 0.190
The ratio of symptomatic to asymptomatic infection for case-horses were different in
magnitude for horses located at Churchill Downs (1:1) versus those located at Murray State
University (2:1), though the difference was not statistically significant (Odds ratio = 1.82;

64
95% CI 0.73, 5.51). A combined ratio of symptomatic to asymptomatic EHV-1 infection of
(1.4:1) was calculated for both events without an observable trend for the occurrence of
clinical cases.
Figure 3.8 depicts the proportion of symptomatic to asymptomatic EHV-1 cases
over the course of the outbreak for horses stabled at Churchill Downs Racetrack and,
visually, appears that more asymptomatic cases occur later in the outbreak. Based on a
comparison of the quantiles of the occurrence of EHV-1 cases, the proportion of
symptomatic to asymptomatically infected horses did not demonstrate a temporal
association with the appearance of clinical signs (Chi-square for linear trend 1.94; p-value =
0.163); suggesting that the occurrence of symptomatic infection within this population is
constant over the course of the outbreak.
Figure 3.8. Comparison of symptomatic and asymptomatic infection for Churchill Downs EHV-1 disease event, 2005
With respect to horses stabled at Murray State University (Figure 3.9), there does
not appear to be a trend in the occurrence of asymptomatic illness, such that, as the outbreak
progressed the proportion of horses which did not exhibit respiratory signs illness did not
0
2
4
6
8
10
12
1 2 3 4 5 6 7 8 9 10 11 12 13 14 15
Nu
mb
er o
f E
HV
-1 c
ases
Day of EHV-1 onset
Asymptomatic infection
Symptomatic infection

65
demonstrate a temporal trend (Chi-square for linear trend 1.72, p-value = 0.190). These
results are similar to the Churchill Downs event and suggest that the occurrence of EHV-1
disease in the form of respiratory illness is constant over the course of an outbreak.
Figure 3.9. Comparison of symptomatic and asymptomatic infection for Murray State University EHV-1 disease event, 2008
Overall, these transmission indices suggest that the EHV-1 outbreak at the Churchill
Downs Racetrack produced a 3.6 (10.25 versus 2.94) times greater number of secondary
cases per initial primary case, had a much shorter average generation interval between
successive cases, with a larger proportion of asymptomatic infections than the Murray State
University event.
2. The effective reproductive number, Re
a. Churchill Downs Racetrack, 2005
Estimates of the effective reproductive number for the Churchill Downs Racetrack
event and a graph of this value as it changes over the course of the outbreak are presented in
Table 3.14 and Figure 3.10. The effective reproductive number decreases rapidly between
the first and third day of the outbreak, then declines gradually over the remainder of the
0
1
2
3
4
5
6
7
1 2 3 4 5 6 7 8 9 10
Nu
mb
er o
f E
HV
-1 c
ases
Week of EHV-1 onset
Asymptomatic infection
Symptomatic infection

66
observation period. Graphically, the effective reproductive number is shown to fall below
the threshold value of one until after the 14th day of observation.
Table 3.14. Estimates of the effective reproductive number (Re) for Churchill Downs Racetrack EHV-1 event, 2005
Time
Number of susceptible
horses
Number of
cases
Cumulative cases
Doubling time
(days)
Growth rate
Effective reproductive number (Re)
1 37 1 1 0 0 0 1.3 36 1 2 0.29 2.324 10.25 1.4 35 1 3 0.63 1.105 5.39 1.7 34 1 4 1.01 0.685 3.72 1.8 33 2 6 1.21 0.571 3.27 2.0 31 1 7 0.99 0.699 3.78 2.1 30 3 10 1.58 0.441 2.76 2.2 27 2 12 1.12 0.362 3.46 2.3 25 1 13 1.56 0.319 2.78 2.5 24 2 15 1.92 0.346 2.44 2.9 22 3 18 2.18 0.3 2.27 3.1 19 1 19 2.01 0.346 2.38 3.4 18 1 20 2.73 0.254 2.01 3.6 17 2 22 2.83 0.245 1.98 3.9 15 2 24 2.90 0.239 1.95 4.0 13 1 25 2.99 0.233 1.93 5.1 12 1 26 4.28 0.163 1.65 5.2 11 1 27 4.21 0.165 1.66 5.3 10 1 28 4.25 0.164 1.65 5.5 9 1 29 4.49 0.155 1.62 6.5 8 2 31 5.40 0.129 1.51 6.9 6 1 32 5.35 0.130 1.52 10.8 5 1 33 9.44 0.074 1.29 13.4 4 1 34 11.30 0.061 1.24 14.0 3 3 37 11.36 0.061 1.24 15.0 3 0 37 0 0 0

67
Figure 3.10. Estimates for the parameter Re (effective reproductive number) for EHV-1 infection occurring in the population of horses stabled at Churchill Downs Racetrack, 2005
b. Murray State University, 2008
Estimates of the effective reproductive number for the disease event in the Murray
State University student barn as it changes over the course of the outbreak are presented in
Table 3.15. The effective reproductive number for the Murray State University outbreak
shows a sharp decline over the first two weeks of the disease event and then gradually
approaches a steady or endemic state for the remainder of the observational period. The
outbreak terminates after day 62 when the effective reproductive number fell below 1.0.
The temporal pattern for the effective reproductive number (Re) is displayed in
Figure 3.11 and is calculated as each incident case occurs. Graphically, the Re is shown to
decrease sharply for the first 16 days before beginning a gradual reduction that remains only
marginally above the threshold level of 1.0 for the last 28 days of the outbreak.
0
1
2
3
4
5
6
7
8
9
10
11
1.0 1.5 1.9 2.2 3.0 3.5 3.9 5.1 5.4 6.5 10.8 14.0
Eff
ecti
ve r
epro
du
ctiv
e n
um
ber
(R
e)
Time (day of case onset)

68
Table 3.15. Estimates of the effective reproductive number (Re) for Murray State University EHV-1 event, 2008 Time Number of
susceptible horses
Number of
cases
Cumulative cases
Doubling time
(days)
Growth rate
Effective reproductive number
(Re) 1.0 35 1 1 0 0 0 3.5 34 1 2 2.49 0.278 2.94 12.6 33 1 3 10.39 0.067 1.47 13.1 32 1 4 6.79 0.103 1.71 14.2 31 1 5 8.56 0.081 1.57 14.7 30 1 6 9.20 0.076 1.53 15.2 28 2 7 9.96 0.069 1.49 16.2 27 1 8 11.13 0.062 1.44 23.1 26 1 9 18.03 0.039 1.27 23.6 25 1 10 16.67 0.042 1.29 23.7 24 1 11 16.87 0.041 1.29 23.9 23 1 12 17.32 0.040 1.28 24.7 22 1 13 18.21 0.038 1.27 26.7 21 1 14 20.19 0.034 1.24 28.8 20 1 15 21.93 0.032 1.22 29.0 19 1 16 21.83 0.031 1.22 29.8 18 1 17 26.35 0.026 1.21 33.5 17 1 18 27.37 0.025 1.18 35.3 16 1 19 27.61 0.025 1.18 35.8 15 1 20 28.13 0.025 1.18 36.3 14 1 21 28.92 0.024 1.17 37.3 13 1 22 29.19 0.021 1.17 41.8 12 1 23 33.64 0.021 1.14 41.9 11 1 24 32.90 0.019 1.15 43.9 10 1 25 34.99 0.016 1.14 52.1 9 1 26 43.31 0.016 1.11 53.1 8 1 27 42.29 0.015 1.11 55.9 7 1 28 45.03 0.014 1.11 61.9 6 1 29 50.57 0.014 1.09 62.0 5 0 30 0 0 0

69
Figure 3.11. Estimates for the parameter Re (effective reproductive number) for EHV-1 infection occurring in the population of horses stabled in the student barn at Murray State University, 2008
3. Deterministic modeling (SIR)
a. Reed-Frost models
i. Churchill Downs Racetrack, 2005
Using methods described previously (Carpenter, 1984; Wahlström et al., 1998) a
simple Reed-Frost model was constructed for the Churchill Downs Racetrack event. The
estimated distribution of the three disease states S, I and R and the transmission probabilities
are presented in Table 3.16. For this model, the number of effective contacts made during a
time period (k) was determined by optimizing the number of observed cases with the
expected number of cases by minimizing the value of the chi-square (Figure 3.12). The
probability of transmission (1 – qct) and the probability of avoiding effective contact (qct)
are 0.936 and 0.06, respectively.
0
1
2
3
4
1.0 14.2 23.1 24.7 29.8 36.3 43.9 61.9
Eff
ecti
ve r
epro
du
ctiv
e n
um
ber
(R
e)
Time (day of case onset)

70
Table 3.16. Reed-Frost model for Churchill Downs Racetrack EHV-1 outbreak
Time interval
(t)
Number of cases (Ct)
Number of susceptibles
(St)
Number of immunes
(It)
Total population
N
k
qct
(1 – qct) 0 0 37 0 37 2.3 0.063 0.936
1 1 36 0 37 2.3 0.063 0.936
2 2 34 1 37 2.3 0.063 0.936
3 5 29 3 37 2.3 0.063 0.936
4 8 21 8 37 2.3 0.063 0.936
5 9 13 18 37 2.3 0.063 0.936
6 5 7 27 37 2.3 0.063 0.936
7 2 5 30 37 2.3 0.063 0.936
8 1 4 32 37 2.3 0.063 0.936
9 0 4 33 37 2.3 0.063 0.936
Figure 3.12. Optimization of the fit of the observed and expected EHV-1 cases for horses located at Churchill Downs Racetrack, 2005
0
5
10
15
20
25
30
35
40
0 1 2 3 4 5 6 7 8 9 10 11 12 13 14 15
Nu
mb
er o
f ca
ses
Week of EHV-1 onset
Observed
Expected
chi-square: 16.359degrees of freedom: 14p value: 0.357

71
Estimates of the daily number of susceptible, infected (cases), and immune horses as
they occurred over the course of the outbreak are shown in Figure 3.13. The proportion of
the horses that are infectious (cases) at any one time period approaches 25% of the total
population on day five.
Figure 3.13. Reed-Frost model of EHV-1 outbreak among horses located at Churchill Downs Racetrack, 2005
ii. Murray State University, 2008
The estimated distribution of the three disease states S, I and R and the transmission
probabilities for the Murray State University event are shown in Table 3.17. This model
was treated similarly to the Churchill Downs model where the number of effective contacts
made during a time period (k) was determined by optimizing the number of observed cases
with the expected number by minimizing the chi-square value (Figure 3.14). The
probability of transmission (1 – qct) and the probability of avoiding effective contact (qct)
are 0.953 and 0.057, respectively.
0
5
10
15
20
25
30
35
40
0 1 2 3 4 5 6 7 8 9 10
Nu
mb
er o
f h
orse
s
Number of days
Cases
Immune
Susceptible

72
Table 3.17. Reed-Frost model for Murray State University EHV-1 outbreak Time
interval (t)
Number of cases (Ct)
Number of susceptibles
(St)
Number of immunes
(It)
Total population
N
k
qct
(1 – qct) 0 0 35 0 35 2.04 0.059 0.941
1 1 34 0 35 2.04 0.059 0.941
2 2 32 1 35 2.04 0.059 0.941
3 2 30 3 35 2.04 0.059 0.941
4 3 27 5 35 2.04 0.059 0.941
5 4 23 8 35 2.04 0.059 0.941
6 4 19 12 35 2.04 0.059 0.941
7 3 16 16 35 2.04 0.059 0.941
8 2 13 20 35 2.04 0.059 0.941
9 1 12 22 35 2.04 0.059 0.941
10 1 11 23 35 2.04 0.059 0.941
11 1 11 24 35 2.04 0.059 0.941
12 0 11 24 35 2.04 0.059 0.941
13 0 10 25 35 2.04 0.059 0.941
Figure 3.14. Optimization of the fit of the observed and expected EHV-1 cases for horses located at Murray State University, 2008
0
5
10
15
20
25
30
35
40
0 1 2 3 4 5 6 7 8 9
Nu
mb
er o
f ca
ses
Week of EHV-1 onset
Observed
Expected
chi-square: 1.081degrees of freedom: 8p value: 0.998

73
Estimates of the daily number of susceptible, infected (cases), and immune horses
which occurred over the course of the outbreak are shown in Figure 3.15. The proportion of
the horses that are infectious (cases) at any one time period never exceeds 14% of the total
population.
Figure 3.15. Reed-Frost model of the EHV-1 outbreak among horses located at Murray State University, 2008
b. Evaluation of herd immunity (HI)
The minimum proportion of an equine population that needs to be effectively
immunized in order to reduce the magnitude and duration of transmission of EHV-1 was
estimated for the horses at Churchill Downs Racetrack and Murray State University student
barn. Based on the estimates of R0 calculated at the beginning of the two outbreaks (see
Appendix F) and the duration of the infectious period for specific genotype of EHV-1
(neuropathogenic versus non-neuropathogenic), values for herd immunity were calculated
for each disease event. For the Churchill Downs event, a threshold level of herd immunity
of 90.2% is needed to stop the transmission of an EHM disease event attributable to a
particular EHV-1 strain circulating within this population. By comparison, only 66.0 % of
0
5
10
15
20
25
30
35
40
0 1 2 3 4 5 6 7 8 9 10 11 12
Nu
mb
er o
f h
orse
s
Number of weeks
Cases
Immune
Susceptible

74
the horses at Murray State University need to be immunized with a fully protective vaccine
to achieve a level of herd immunity that will reduce the transmission of the respiratory form
of EHV-1 associated with this disease event.
While these results are useful to compare the value of progression of disease among
cohorts of horses affected with different genotypes of EHV-1, the calculations also illustrate
a basic tenet of disease eradication and vaccine coverage, namely that, larger values of R0
require a larger fraction of the population be immunized to eliminate transmission.
Comparisons of various levels of prophylactic vaccination and, by extension, herd
immunity, on the duration and magnitude of the Churchill Downs and the Murray State
University outbreaks are presented in Figures 3.16 and 3.17.
Figure 3.16. Comparisons of increasing levels of herd immunity on the transmission of EHV-1 among horses located at Churchill Downs Racetrack, 2005
Time (days)
0
1
2
3
4
5
6
7
8
9
0 2 4 6 8 10 12 14 16 18 20 22
Initial Herd Immunity (No Vaccine)
Herd Immunity level of 10%
Herd Immunity level of 25%
Herd Immunity level of 50%
Herd Immunity level of 75%
Herd Immunity level of 90%
Nu
mb
erof
infe
cted
hor
ses

75
Figure 3.17. Comparisons of increasing levels of herd immunity on the transmission of EHV-1 among horses located at Murray State University, 2008
Time (weeks)
For horses stabled at Churchill Downs, an increase in herd immunity above baseline
(no vaccine) to 25% produced only a modest reduction in the total number of infected
horses and the R0 value for this event from 9.45 to 7.07 (Table 3.18). For outbreaks of
EMH, the herd immunity level has to be above 90% in order to reduce R0 below 1.0 and
effectively prevent transmission. By comparison, a herd immunity level below 50% would
only marginally decrease R0 and the number of susceptible horses but not to a level that
would prevent the occurrence or spread of EHV-1 within an EHM event.
For horses stabled at Murray State University, an increase in the herd immunity
level to 75% drastically reduced the total number of susceptible horses in this population
and the transmission parameter R0 below the threshold value of one. A herd immunity level
of 90% is needed to prevent the transmission of EHV-1 within the Churchill Downs cohort.
0
1
2
3
4
5
6
7
8
0 1 2 3 4 5 6 7 8 9 10 11 12 13 14 15 16 17 18 19 20 21 22 23
Initial Herd Immunity (No Vaccine)
Herd Immunity level of 10%
Herd Immunity level of 25%
Herd Immunity level of 50%
Herd Immunity level of 75%
Herd Immunity level of 90%
Nu
mb
er o
f in
fect
ed h
orse
s

76
Table 3.18. Comparison of the effects of varying levels of herd immunity on the burden and transmission of illness for each equine cohort
Herd immunity
level
Outbreak location
Probability of adequate
contact per day (1-qct)
Attack rate (%)
Cases averted
(%)
aR0
Initial (No vaccine)
Churchill Downs 0.0639 33/37 (89.2) 0 9.45
Murray State 0.0086 30/35 (85.7) 0 2.09
10%
Churchill Downs 0.0575 31/37 (83.8) 2 (6.1) 8.51
Murray State 0.0077 28/35 (80.0) 2 (6.7) 1.89
25%
Churchill Downs 0.0478 28/37 (75.6) 5 (15.2) 7.07
Murray State 0.0064 23/35 (65.7) 7 (23.3) 1.57
50%
Churchill Downs 0.0319 15/37 (40.5) 18 (54.5) 4.72
Murray State 0.0042 9/35 (25.7) 21 (70.0) 1.03
75%
Churchill Downs 0.0159 2/37 (5.4) 31 (93.9) 2.35
Murray State 0.0021 2/35 (5.7) 33 (93.3) 0.51
90%
Churchill Downs 0.0064 1/37 (2.7) 32 (96.9) 0.95
Murray State 0.0009 1/35 (2.9) 34 (96.7) 0.22
a Calculation of R0 is based on fitted data and the formula R0 = βND where β is the probability of adequate contact, D is the duration of infectiousness and N is the total population size. Values of 4 days and 7 days were used as the duration of infectiousness for Churchill Downs and Murray State University, respectively.
Copyright © Barry Jay Meade 2012

77
CHAPTER FOUR
DISCUSSION
The time and place of the onset of clinical illness as well as the type, frequency and
timing of contact between cases and those still at risk are among the key observations upon
which infectious disease research and control decisions depend (Fine, 2003). Accordingly,
the important features of this observational study are the use of statistical and mathematical
modeling to estimate a date of illness onset for horses which are subclinically infected with
EHV-1, estimation of the daily risk of acquiring EHV-1 infection for each disease event, the
calculation and comparison of transmission parameters between equine cohorts, and
examination of the impact of immunization on the theoretical spread of EHV-1 within
cohorts exposed to herpesviruses with dramatically different transmission kinetics.
The use of regression methods applied to survey data allowed for the construction of
a statistical model to predict a date of illness onset for horses within each of the separate
equine cohorts. To my knowledge, this is the first study to use statistical modeling to
estimate a date that inapparently or subclinically infected horses would have acquired a
communicable/contagious disease. The estimates of illness onset derived from this analysis
allow for construction of an epidemic curve and an examination of the temporal pattern of
occurrence of EHV-1 cases. Visually, the epidemic curves for the outbreaks appear
markedly different in the duration of infectious disease events. The curve for the Churchill
Downs outbreak depicts an outbreak of very short duration which, for the most part, was
over before any regulatory action was taken. By comparison, the Murray State University
epidemic curve shows that EHV-1 cases occurred over an extended interval with this
outbreak lasting 4.5 times longer (9 weeks versus 14 days) than the Churchill Downs event.
Confining animals increases the population density and effectively facilitates the
spread of disease (Wahlström et al., 1998). The secondary peak in EHV-1 cases among
horses at Murray State University during the week of April 5th is likely the result of the stop
movement order issued by the Office of the Kentucky State Veterinarian. This regulatory
action increased the contact between susceptible and infectious horses and facilitated the

78
spread of disease within this cohort. For EHV-1 respiratory disease events of this type,
simply preventing horses from freely moving off an affected premise is an effective
intervention strategy which allows virus to cycle throughout the entire population until all
horses are no longer communicable nor represent a risk to the general horse population. It is
likely that this regulatory action imposed by the Office of the Kentucky State Veterinarian
shortened the epidemic period of the outbreak by hastening the spread of virus within the
cohort.
The reason for the prolonged nature of the Murray State University event is
speculative; it may be due in part to the quantity of virus shed in respiratory secretions by
infectious horses such that smaller doses of virus require multiple interactions between an
infected horse and a susceptible horse before an effective contact occurs. Since these
investigations were conducted primarily for regulatory purposes and with a need to limit
costs, sampling was not conducted in a manner that allowed us to measure the magnitude or
duration of nasal shedding of EHV-1 for horses within each equine cohort. However,
researchers (Allen, 2002b; Kydd et al., 2006; Coombs et al., 2006) have shown that
immunologically conditioned horses, exposed through natural infection or immunization,
shed smaller amounts of virus in nasal secretions than younger horses which, theoretically,
have had fewer past exposures to EHV-1. Since horses at Murray State University were
significantly older than the horses at Churchill Downs Racetrack, it seems likely that based
on age alone, horses at Murray State University would be shedding smaller amounts of
infectious virus. Ultimately, the lower volume of circulating virus would decrease the
probability of an effective contact and lengthen the interval between cases.
In this study, survival analysis was used to explore the relationship of time to
infection for each equine cohort and to estimate the relative hazard (risk) of becoming an
EHV-1 case. The results highlight the dramatic differences in the survival function for
horses located at the different venues and imply that, for an event characterized principally
by the occurrence of neurological disease, there is a three times greater hazard (risk) per day
for EHV-1 infection and a 9.5 times shorter median survival time compared to an event
characterized principally by EHV-1 respiratory illness. In as much as these events were

79
investigated independently, it is not possible to construct a Cox proportional hazard model
to examine or compare common risk factors across outbreaks. While other researchers have
examined animal-level risk factors for the development of neurologic disease (Allen, 2008;
Burgess et al., 2012), studies designed to quantify the contribution of environmental and
management factors to the occurrence of EHV-1 have yet to be undertaken.
While the PCR assay has been used previously to identify the neuropathogenic
subtype of EHV-1 circulating among horses in confined populations (Henninger et al.,
2007; Pusterla et al., 2009b), this study is the first to use this laboratory technique to
characterize an equine disease event by the viral subtype circulating among comingled
horses with the intent of developing mathematical models to quantify the transmission of
EHV-1 in an outbreak setting. For this study, the designation of an outbreak by its
neuropathogenic subtype is based on the results of a type-specific EHV-1 PCR assay and is
restricted solely to the calculation of the values for R0 and Re for each cohort. All other
mathematical or statistical analyses were conducted independent of this laboratory
distinction. While a positive PCR result is not predictive for EHM and generally
overestimates the duration of viral shedding (Goodman et al., 2006; Goehring et al., 2010),
this laboratory technique offers a rapid method to detect potentially infectious horses and
can identify an end-point for the period of communicability. In the absence of newer
diagnostic methods, it is likely that the volume of PCR testing for EHV-1 will increase as it
gains wider clinical acceptance among veterinary practitioners. Therefore, it is incumbent
upon us to compare and contrast outbreaks, not purely for purely theoretical reasons but
rather to gain an appreciation of the transmission dynamics of different EHV-1 subtypes.
The basic reproductive number - R0 is one of the most useful concepts in
mathematical modeling of infectious diseases. Its threshold property provides criteria for
developing policies to eliminate an infection from a population and it can forecast the
magnitude of the effort required to achieve eradication. A variety of mathematical equations
have been used to calculate R0 (Dietz, 1993), with the mathematical approach used by
researchers based on the type, quantity and quality of data available for analysis. For this
observational study, estimates of R0 were obtained using two independent methods: from an

80
equation based on the initial rate of growth of the epidemic and with the aid of transmission
parameters obtained by fitting a Reed-Frost model to the observed profile of EHV-1 cases.
Based on the initial rate of growth, R0 was estimated to be 10.25 and 2.94, for Churchill
Downs and Murray State, respectively. By comparison, transmission parameters obtained
from a Reed-Frost model estimated an R0 of 9.45 for Churchill Downs and 2.09 for Murray
State University. Overall, the estimates are comparable in magnitude and direction across
outbreaks regardless of the method employed. These findings illustrate the highly
transmissible nature of the virus responsible for the Churchill Downs outbreak versus the
Murray State University outbreak where, by comparison, the virus was moderately
transmissible. For reference, in human populations, published estimates of R0 for Smallpox
and Influenza range from 3.5-6 and 3-4 respectively, while the range for Chickenpox is 10-
12 and Measles is 16-18 (Keeling and Rohani, 2008). For equine populations, R0 for equine
influenza has been estimated to be 10-18 (Glass et al., 2002) based on data obtained from an
outbreak in New York in 1963 and 2-5 for horses located at a racetrack in Japan (Satou and
Nishiura, 2006).
There is a paucity of published studies defining the duration of viral shedding for
EHV-1, particularly for neuropathogenic variants, for horses older than 2-years of age and
for viral shedding which occurring in natural settings. At first glance, it appears that the
estimates of 4 days for Churchill Downs and 7 days for Murray State University for the
duration of viral shedding used to calculate R0 run counter to what would be expected
intuitively based on studies which use PCR to measure the duration of viremia or quantify
the number of viral DNA copies shed in nasal secretions of clinically affected horses.
However, viremia is not the same immunologically as viral shedding and PCR is not a
substitute for virus isolation as the presence of viral DNA estimated by PCR does not equate
to infectious virus; estimates derived from the use of PCR methods generally overestimate
the duration compared to those obtained by viral isolation. Furthermore, prior to the
outbreak of EHM in Finley, Ohio (Henninger et al., 2007) and subsequent spread to the
Ohio State University School of Veterinary Medicine (Kohn et al., 2006), conventional
wisdom suggested that EHV-1 infected horses displaying neurologic signs were not
communicable. Due to the compact nature of the epidemic curve, the short survival function

81
and the lack of respiratory illness among horses at Churchill Downs, we are certain that, on
average, the duration of viral shedding was truncated for this population compared to horses
at Murray State. Moreover, the values for the duration of viral shedding used in this study
are based on an outbreak investigation and an EHV-1 challenge study with an age
appropriate cohort (Goodman et al., 2006; Burgess et al., 2012) or knowledge of EHV-1
shedding patterns gained through years of research with EHV-1 (personal communications
– G. Allen).
By measuring the Re (effective reproductive rate), it is possible to assess over time
the effectiveness of the management strategies used to control an outbreak as well as
quantify the transmission potential of Re at a specific point in time. Since the institution of a
stop movement order (quarantine) occurred toward the end of the Churchill Downs
outbreak, we were essentially able to observe the changes to Re at the cohort-level over the
natural course of infection. For this disease event, Re was initially 10.25 which fell to 1.24
by the second week of the outbreak. Because regulatory interventions were not initiated
until late in the event, it appears that the outbreak was brought under control independent of
movement restrictions or other bio-security measures placed on the premises by regulatory
personnel. By the fourth day of the event, there had been an 81% reduction in Re, although
Re did not fall below the threshold value of 1.0 until the very end of the outbreak and only
when three horses were still susceptible. Since Re remained above 1.24 for over ten days,
there was the potential for exposing additional horses at the racetrack to infected members
of this cohort, mainly through interactions with subclinical cases, as the horses which were
not clinically ill were freely moving around the grounds of the racetrack for training and
racing. The occurrence of asymptomatic spread is supported by the recognition of two
horses that had only recently arrived at Churchill Downs and were not affiliated with barn
38, but contracted EHV-1 and developed neurologic illness while the disease event was
unfolding. It is likely that these horses were exposed upon arrival at the track and not in-
transit as they did not share a common conveyance. If this is the case, then the subclinical
horses from barn 38 were communicable during the time they were mixing with other
horses on the grounds of the racetrack.

82
With respect to Murray State University, Re decreased from 2.94 to 1.44 within the
first 16 days of the outbreak but remained above the threshold value of one for the last 46
days. Furthermore, transmission of EHV-1 continued to occur throughout the outbreak as
positive PCR results were documented late in the EHV-1 event. Though one must use
caution when using mathematical models to explain complicated biological processes, it
appears that the transmission of the respiratory form of EHV-1 among horses at Murray
State University reached an endemic state where there was a lack of sustained transmission
and the occurrence of cases was at a low predictable rate. For the last 28 days of the
outbreak, the value of Re was just marginally above the threshold value of one. While the
transmission potential was low, if more susceptible horses were added periodically to the
existing population at Murray State or if infectious horses traveled to other venues where
susceptible horses were located, additional cases of EHV-1 respiratory illness could have
occurred and the cycle of EHV-1 infection continued indefinitely, albeit at a very low level.
The generation time is the mean time between the infection of a horse and the
subsequent infection that this horse causes. The estimates derived from this study do not
represent the time to the first occurrence of a secondary case but the average time to
infection for all horses within a cohort. Conceptually, the generation time incorporates the
incubation period and the period of infectiousness into its calculation. For the horses located
at Murray State University, the generation time between successive cases was estimated to
be 2.38 days, a period that was 6.1 times longer than the estimate of 0.39 days for Churchill
Downs cases. If one assumes that contact between horses occurs randomly and the
frequency of contact is constant over the course of the outbreak, then the short generation
interval for Churchill Downs implies that the average incubation period is also less than
0.39 days (9.4 hours). For those agents which have been studied, the length of an
incubation period is inversely correlated with the infective dose, the severity of disease
(Field and Hill, 1975; Aaby, 1992; Glynn and Bradley, 1992) and mode of transmission
(Fine, 2003). For EHV-1, an abbreviated incubation period suggests that horses at Churchill
Downs were exposed through direct contact to a large amount of circulating virus;
conditions that would increase the probability that a contact between an infected and
susceptible animal would be effective in transmitting virus.

83
Conversely, if horses at Murray State were exposed to smaller amounts of virus then
the efficiency of transmission (1- qct) is reduced and the interval between cases is
prolonged. This reduction in efficiency may reflect that transmission is not occurring
through direct spread but by the indirect sharing of equipment or carried from stall to stall
by individuals who exchange tasks or perform common chores. Alternatively, if the
incubation period for horses at Murray State was prolonged, assuming the infectious period
is constant throughout the event, then the time interval between successive cases would also
increase and the generation time would be longer. In general, the results demonstrate that
the generation interval and its component indices can vary based on the clinical phenotype
of an outbreak caused by the same etiologic agent; an observation that has been
demonstrated for outbreaks of Ebola (Chowell et al., 2004). While this index provides a
quantitative measurement that can be used for comparison of different EHV-1 outbreaks,
the generation interval is not a constant of nature but is dependent upon the interactions of
the host, agent and environment where transmission is occurring.
Although veterinary practitioners and researchers who study equine infectious
diseases have long recognized variability in the clinical signs observed in horses infected
with EHV-1, the identification of strains of EHV-1 that are associated with the development
of neurological illness is a relatively recent finding (Nugent et al., 2006). Furthermore, the
relationship of animal-level risk factors on the development of EHM caused by a particular
neuropathogenic strain of EHV-1 has only recently been examined (Allen, 2008). While the
molecular and immunological characteristics of neuropathogenic strains provide a plausible
explanation for the occurrence of CNS disease, the relationship of this genetic marker to the
development of neurological disease is far from clear-cut as it cannot account for all
occurrences of EHM. For cases of EHM that are attributed to strains that are designated as
non-neuropathogenic (expresses A2,254 genotype at ORF 30), it seems logical that the
occurrence of neurological disease would be precipitated by some underlying medical
condition. While the first recognized case at Murray State was a 14-year old gelding with a
sole abscess, it is unlikely that a medical condition this commonplace would pre-dispose a
horse to EHM, especially since other researchers (Carr et al., 2011) have failed to find an
association with hospitalized colic cases and the development of EHM. Regardless, since it

84
has been estimated that 25% of EHM cases are caused by non-neuropathogenic strains, it is
equally important to investigate these occurrences and characterize the clinical and
immunological profile of such cases in order to identify risk factors for illness among
affected animals.
Field studies of the respiratory form of EHV-1 are difficult to conduct due to the
ubiquitous nature of EHV-1 respiratory illness in the general equine population. If the 14-
year old gelding which displayed gait deficits and other CNS signs at Murray State
University had not been transferred to an equine referral hospital for treatment, it is unlikely
that a respiratory event attributed to EHV-1 would have come to the attention of (or that an
investigation would have been initiated by) state animal health regulatory officials. In
general, serological surveys of equine populations for the presence of antibodies to EHV-1,
even in the presence of clinical illness, provide only limited epidemiological information as
these surveys cannot identify the temporal pattern of disease occurrence or quantify the risk
for becoming infected. In order to accurately describe the sequence of events associated
with an EHV-1 outbreak, it is necessary to conduct a formalized investigation and use a
structured questionnaire to obtain animal specific information. For example, the studies by
Bell et al., (2006) or Brown et al., (2007) were able to identify the occurrence of various
equine herpesviruses among mares and their foals but not an association with clinical
illness, the sequential pattern of illness onset or an estimation of the risk for acquiring
infection. The Murray State University event is the first of its kind to be formally
investigated as an outbreak of EHV-1 respiratory illness and not merely to estimate the
prevalence of herpesviruses among a narrowly defined cohort of horses.
Although virus was not successfully isolated from horses associated with either
disease event, the laboratory and clinical findings collectively provide strong evidence in
support of the outbreaks being caused by EHV-1. These findings include: 1) the
demonstration of SN titers to EHV-1 that were >1:256 on at least one serum sample or
showed a fourfold increase in antibody titer between paired samples collected from horses
during the investigation; 2) the identification of multiple horses within each cohort with
PCR positive results to EHV-1; 3) the recognition of EHV-1 compatible clinical illness in

85
greater than 50% of case-horses; 4) the confirmation that horses considered at-risk for
infection had not been immunized against EHV-1 for a minimum of 6 months preceding the
event; 5) the negative laboratory findings for other potential causes of illness which appear
clinically similar to illness caused by EHV-1; and 6) the lack of compatibility with non-
infectious causes of neurologic disease.
The failure to isolate virus or demonstrate a four-fold or greater increase in titer for
every EHV-1 infected horse is not unexpected and has been reported by other investigators
(Greenwood and Simson 1979; Friday et al., 2000; Pusterla, et al., 2008). Peak viral
shedding occurs during the first few days after onset of nasal discharge and coincides with
the febrile phase (Allen, 2002b). Consequently, isolation of EHV-1 is most successful when
attempted during the febrile stage of illness (Allen and Bryans, 1986). For these
investigations, the inability to isolate virus or show a two-fold change in titer for every
horse is likely due to the fact that viral shedding had ceased or antibody titers had already
peaked in infected horses prior to sample collection. Regardless, in an outbreak setting not
all cases of disease can or need to be laboratory confirmed (Sacks, 1985). As an example, in
a recent outbreak of E. coli O157:H7 in North Carolina, only 44% of case-patients were
laboratory confirmed (CDC, 2011) with the majority being included as cases based solely
on clinical presentation. Similarly, in an outbreak of Equine Influenza among racehorses in
Japan (Yamanka et al., 2008) only 19.4% (188/969) of infected horses had a corresponding
positive laboratory test result; the other horses were considered infected based on the
demonstration of fever alone.
The reliability of owner or trainer-reported illness occurring in animals has been
assessed for a variety of veterinary medical conditions (Catley et al., 2001; Hamlin and
Hopkins, 2003) and, in human health, for self-reported illness (Steele, 1982; Finger et al.,
1994). In general, the criteria used by lay-persons and their ability to recognize signs or
symptoms of disease in animal or human populations are similar to those of veterinarians
and physicians. Overall, a self or third-party report for a case of clinical illness correlates
well with supporting laboratory evidence though recall is affected by time since disease

86
onset. For chickenpox in children, an accurate recall by caregivers has been demonstrated
for periods of up to 4-5 years (Finger et al., 1994).
For the Murray State event, the occurrence of illness was queried for only a 6 month
period prior to the investigation with students being asked only to identify the occurrence of
clinical signs and not potential etiologic agents. Considering the frequency of contact with
and the personal attachment of Murray State University students to their horses, it is
reasonable to expect that these owners would recognize respiratory signs in their horses,
though there are limits to the length of time that a person can accurately remember details of
a specific event. The results would be subject to a form of recall bias; that is, owners are
more likely to remember events that occurred recently than those which occurred weeks or
months ago. A bias of this nature likely underestimates the number of clinically affected
horses and suggests that potentially more horses at Murray State University actually
developed respiratory illness than were documented from the survey questionnaire.
The recognition of respiratory illness among older horses at Murray State University
is in contrast to the Churchill Downs event and other investigations of EHM where
respiratory signs are rarely observed (Thomson et al., 1979; Friday et al., 2000; vann
Maanen et al., 2001) or, when present, are restricted to foals or horses less than 2 years of
age (Greenwood and Simson, 1979; McCartan et al., 1995; Studdert et al., 2003; Henninger
et al., 2007). In accordance with these investigations, the absence of respiratory signs in
neurologically affected horses at Churchill Downs may be related to the exposure dose or
genetic makeup of the virus associated with the event where, following exposure to a large
viral dose or a neuropathogenic EHV-1 strain with the requisite SNP, replication of the
virus and rapid dissemination to the CNS modifies or precludes the expression of
respiratory signs in adult horses exposed in natural settings. It follows that since EHV-1 is
transmitted mainly through exposure to respiratory secretions, discounting for the moment
spread through abortion, the lack of a respiratory component in neurologically affected
horses has to markedly impact (i.e. shorten) the duration of viral shedding in these types of
disease scenarios.

87
Similar to other EHM outbreak investigations (Goehring et al., 2006; Henninger et
al., 2007), pyrexia was the most common clinical feature observed among affected horses at
Churchill Downs and, while 78% (7/9) of the neurologic cases presented with a fever, only
46.7 % (7/15) of the horses with an elevated temperature displayed neurologic signs. The
results suggest that the risk for developing EHM was 8.75 times greater for febrile horses
compared to afebrile horses. While the presence of fever in horses infected with EHV-1 has
been described previously, this study demonstrates a clear age-related trend for the
development of fever. For horses stabled at Churchill Downs which were 4-5 years of age,
the risk of developing fever was 5.3 times less than for 2-year-old horses.
In contrast to previous reports of EHM events (Goehring et al., 2006; Barbic et al.,
2012) which found an increased risk to mares for the development of neurologic disease,
more intact males and geldings at Churchill Downs developed neurologic disease than
females; though this difference was not statistically significant. In comparison to some
outbreaks investigations (Goehring et al., 2006; Henninger et al., 2007) which found an
association with age and the development of EHM, the present study did not find an
association and is more similar in this respect to the investigation by Burgess et al. (2012).
However, the lack of an association may be a reflection of the narrow range in ages for
horses at Churchill Downs (Interquartile Range = 2 years of age) such that, if there is truly
an age associated risk for the development of EHM, our sample size was not sufficiently
large enough to detect a statistical difference.
The recognition of EHV-1 respiratory disease at Murray State University beginning
in February 2008 is in agreement with the observations of Matsumura et al., 1992 who
found that in Japan the occurrence of EHV-1 respiratory disease in racehorses occurred
almost exclusively during December through February. These researchers suggest that the
occurrence of respiratory EHV-1 is seasonal, age-related and facilitated by the year round
operation of racetracks in Japan. Regardless, seasonality leads to the maintenance of
recurrent epidemics of infectious diseases. If there is a seasonal component to the
occurrence of EHV-1 in the US, then strategies exist which can exploit this epidemiologic
feature. For example, EHV-1 immunizations can be targeted toward young racehorses in

88
training during the winter and late spring, much in the same way boosters for EHV-1 are
recommended for brood mares at 5, 7 and 9 months of gestation to prevent abortion.
Currently, immunizations for equine herpesviruses in adult horses are only recommended
annually with a 6-month revaccination for performance horses without regard to the timing
of boosters (AAEP, 2012).
Using a Reed-Frost model that most closely matched the observed profile of cases
for each disease event, we explored the impact of altering herd immunity levels on the
theoretical transmission and final outbreak size within each cohort. While mathematical
models can simultaneously incorporate various levels of vaccine efficacy and coverage for
analysis, for simplicity, we set vaccine coverage at 100% such that every horse was
expected to be given a vaccine. The results suggest that with each incremental increase in
herd immunity, there was a corresponding decrease in the number of EHV-1 cases and the
value for R0 at each location. For increases in herd immunity levels above 75% and 95%,
the model predicts that there would be a substantial reduction in the incidence and
transmission of respiratory and neurological illness, respectively. Based on these models, a
herd immunity level of 95% would provide protection against both the respiratory and
neurologic form of EHV-1; this level could potentially serve as a useful target for vaccine
development.
Given the high degree of transmissibility and the severity of clinical illness
associated with the occurrence of EHV-1 neurologic illness, even a moderate increase in
herd immunity would reduce morbidity and decrease spread. Because herd immunity
confers protection to animals that are not immunized and can decrease morbidity even with
the use of an imperfect vaccine, animal health regulators may want to consider some
targeted prevention strategy such as requiring racehorses be immunized prior to admission
to a performance venue. As an example, a 50% increase in the herd immunity level would
reduce the number of cases by 54% and 70% among horses at Churchill Downs and Murray
State, respectively. Since we are assuming that every horse is immunized, this theoretical
reduction in morbidity is based solely on a vaccine that is 50% efficacious (only 50 percent
of vaccinated horses would develop protective immunity).

89
The equine populations at Churchill Downs Racetrack and Murray State University
student barn differed in their age structure, intended use and principal clinical features; yet
the clinical attack rates and the proportion of the respective populations which developed
either an elevated SN titer and/or were PCR positive were similar between cohorts and are
in agreement with others (Allen, 2002b; Kydd et al., 2006; Coombs et al., 2006) who
suggest that re-exposure to EHV-1 and immunological boosting is a common occurrence in
most horse populations. Notwithstanding the differences in composition between the two
equine cohorts, horses located at Churchill Downs are typical of a stable of thoroughbreds
in training; likewise, the horses at Murray State University are representative of horses kept
primarily for recreational purposes. Accordingly and despite the uncertainties inherent to
observational studies, the findings of this study can be generalized to other equine
populations in similar settings that are managed under comparable husbandry conditions.
For racehorses in training, the findings would be generalized to a population of horses that
have multiple or absentee owners, are maintained under a uniform medical
monitoring/treatment protocol, trained similarly, and consume identical feed rations. For
horses kept for recreational purposes, the findings would be applicable to a stable of horse
with individual owners where horses are older, consume different feed rations and are used
for a variety of purposes (shows, trail riding, rodeo competition, pleasure, etc.).
Due to limitations of the study, it was not possible to conclusively identify a specific
strain of EHV-1 as the cause of each clinical case or rule out the possibility of co-infection
with multiple strains of EHV-1 for each disease event, though clinical and laboratory
evidence suggests that different and distinct viral strains were circulating among comingled
horses at each venue. Likewise, it was not possible to identify the index case or the source
of EHV-1, whether introduced by direct spread or resulted from latently reactivated virus, in
one or both events. Therefore, the sequential pattern for the occurrence of EHV-1 cases and
the results derived from the statistical analysis lend themselves best to comparisons of
outbreaks which differ by the principal clinical features of the event and not by viral
subtype.

90
From an epidemiological perspective, an accurate determination of the duration of
viral shedding of infectious virus is of greater importance to animal health regulators than
determining whether a horse is viremic or simply positive in the PCR test. Unnecessarily
restricting the movement of horses in commercial settings after they are no longer infectious
exacts an economic cost to producers in lost opportunity. To address issues of
communicability, future EHV-1 research should focus on quantifying and comparing the
magnitude and duration of nasal shedding of infective virus for various genetic variants of
EHV-1, for a range of ages for infected horses and for both symptomatic and asymptomatic
affected horses exposed in natural settings.
Despite the increased use of PCR-based allelic discrimination testing for EHV-1,
there appears to be a lack of uniformity or standardization of these methods between
laboratories. Since these tests are not marketed commercially as a complete assay, there is
no federal oversight for the production and distribution of the individual components or an
attestation of their reliability. The USDA-APHIS-NVSL should consider production of a
check panel to validate test results and international organizations, such as the World
Organization of Animal Health (OIE), should promote the use of a standard laboratory
protocol by incorporating this testing in the OIE Manual of Diagnostic Tests and Vaccines
for Terrestrial Animals.
The modeling results for this study need to be validated by other researchers under a
range of conditions and settings. Stochastic modeling techniques, such as Monte Carlo
methods, should be considered for future transmission models to calculate more realistic
parameters estimates. Network analysis should be used to examine the underlying
relationships and the patterns of association between horse owners, whether social or
economic, that contributes to the spread of EHV-1.
Copyright © Barry Jay Meade 2012

91
APPENDIX A: Questionnaire for EHV-1 disease event Churchill Downs Racetrack, 2005

92
Owner/Animal Information
Date of interview: ________________ Animal Name: _______________________ Age: ______ (Year of Birth) _________ Sex:_____ Animal Location Trainer: _________________ Barn: _____ Stall: _____ How long has animal resided at this location? ____________
Travel/Training History
Is a Health Certificate available for review? Circle (Y or N) Recently purchased/claimed? Circle (Y or N)? If yes, how long ago and from whom: Prior to arriving at Churchill, where has this horse resided? (Last 2 months). Training history (last three weeks) - Was the animal working normal, off, etc.? Describe most recent training history

93
Clinical/Medical History
Has this animal had a fever of greater than 101.5o since December 1, 2005? Circle (Y or N). If yes, explain: Other signs/symptoms (type/date/duration): Any coughing, off-feed, lameness, weak in rear, stumbling, dropping feed. Has this horse been vaccinated against Herpes (Rhino) - within last six months? Circle (Y or N) If Yes, date (if known) __________________ Give approximate if exact date unknown. ________________ Has this animal been administered any medications or vaccinations in the past 4 weeks (other than race day medications)? Circle (Y or N) If yes, describe: Has this animal been examined by a veterinarian for any reason in the past 4 weeks (Scoped, X-rays, lameness exam)? Circle (Y or N). If yes, describe: Are you aware of other animals with a diagnosis of EHV-1 that this horse could have been exposed other than at Churchill? Circle (Y or N). If yes, where and when.

94
APPENDIX B: Questionnaire for EHV-1 disease event Murray State University, 2008

95
Owner/Animal Information
Owner: ________________________________ Today’s Date _______ Barn/Stable Identification (Number or Name): ________________________________ Name (Identification of Animal): ____________________________________________ Age: ________ (Year of Birth) _______ Sex: _____ Stall Number (or location): _____________ Breed ___________________________ How long has this animal resided at this location? _____________________________ Prior to arrival at the Equine Center at Murray, where had this horse resided? (Last 6 months) ______________________________________________________________________ ______________________________________________________________________ ______________________________________________________________________ Was this horse purchased within the past year? : Circle (Yes or No); If Yes, how long ago and from whom ______________________________________________________________________ ______________________________________________________________________ What do you consider to be the primary use of this animal? Circle one. 1–Pleasure 2–Lessons/school 3–Showing/competition (not betting) 4–Breeding 5–Racing 6–Farm or ranch work 7–Other (specify: ________________)

96
Clinical/Medical History
Has this animal had any of the following signs/symptoms since March 1, 2008? (Approximately 45 days ago) Since March 1, 2008 If YES, Date when signs first appeared (Onset) Fever (>101.5o F) �Yes �No Changes in eating habits �Yes �No (Off feed, dropping feed) Lameness �Yes �No (including stumbling, weakness in rear limbs) Reduced/ Loss of Tail Tone �Yes �No Dribbling Urine �Yes �No Colic �Yes �No Abortion �Yes �No Respiratory illness (Including coughing, running/snotty/crusty noses) �Yes �No Has this animal been examined by a veterinarian for any reason in the past 6 weeks (Scoped, X-rays, lameness exam)? Circle (Yes or No); If Yes, describe: Has this ever horse been vaccinated against Herpes (Rhino); Circle (Yes or No)

97
Has this horse been vaccinated against Herpes (Rhino) - within last six months? Circle (Yes or No);
If Yes, Date (if known) __________________ Give approximate if exact date unknown. [use chart if needed] Has this animal been administered any medications or treatments in the past 6 weeks? Circle (Yes or No); If Yes, describe: [use charts if needed]
Husbandry Practices
Describe husbandry practices that are routinely done for this animal [i.e., maintained in barn/ put on pasture/ housed at night/fed hay grain, clean stalls daily]
Vaccines types Yes/No Date Vaccinated
Fluvacc Innovator
Pnuemabort K
Equivac
Prestige
Prodigy
Calvenza
Rhinomune
Medication type Yes/No
Date of treatment
Antivirals
NSAIDS (Bute)
Corticosteroids
Antibiotics
Other (specify)

98
Have you helped or assisted other horse owners at this or other facilities with the care and feeding of their horses? Circle (Yes or No). If Yes, describe: [i.e., feeding, exercising, and approximate frequency (daily, weekly, occasionally)]. Please identify by stall number, those stalls which you have had access to within the past month (30 days). Do you share grooming tools or other items with other horse owners? Circle (Yes or No); If Yes, describe:
Travel/Training History
Has this animal been moved from this location for any reason in the past 3 months? Circle (Yes or No); If Yes, describe: [i.e., shows, trail rides, competition, pleasure, hospital/vet clinic and approximate dates] Has your horse(s) shared a trailer ride with another horse from this facility? Circle (Yes or No); If Yes, describe: If used for competition, has this animal performed to your expectations? Circle (Yes or No); If No, Describe issue with performance

99
Describe the locations [i.e., outside corral near barn which houses rodeo horses, indoor arena, etc.,] and activities [exercising, training, shows] which you and your horse(s) have participated in while on the Murray State University equine center property. Additional comments: Use the area below for any additional information that was not covered in the questions above and which you feel is important to this disease event.

100
APPENDIX C: Summary of clinical and laboratory data for each horse associated with the EHV-1
disease events at Churchill Downs Racetrack in 2005 and Murray State University in 2008

101
Churchill Downs, 2005
a Grading system for CNS disease based on AAEP lameness scale; b Samples collected 5/13/05; c Samples collected 5/21/05; d Samples collected 6/1/05; e Samples collected 6/7/05; f Samples collected 6/13/05; NT = Not tested; g Transferred to equine referral hospital in Lexington, KY; hNS = Not specified; i Number of horses which demonstrate an initial titer > 1:256.
Animal Stall Presence of neurologic
signs
Assessment of presenting
neurologic signsa
Fever EHV-1b serology
test results
EHV-1c serology
test results
EHV-1d
serology test results
EHV-1e
serology test results
EHV-1f
serology test results
Date of illness Onset
PCR test results (date positive
sample collected) Pimm’sO’Clock 1 No Yes NT Pos 1:512 Pos 1:1024 Pos 1:2048 Pos 1:512 5/6/2005 Positive (6/1/05) GottaSecret 2 No Yes NT Pos 1:1024 Pos 1:1024 Pos 1:1024 Pos 1:256 5/7/2005 Positive (6/1/05) DiaAlegre 3 No No NT Pos 1:128 Pos 1:256 Pos 1:256 NT Negative KingofCapers 4 Yes Grade 1 Yes Pos 1:256 Pos 1:512 Pos 1:512 Pos 1:2048 NT 5/6/2005 Negative Majestically 5 No No NT Pos 1:256 Pos 1:128 Pos 1:1024 NT Negative PrinessPegasus 6 No No NT Pos 1:256 Pos 1:1024 Pos 1:1024 NT Negative Dances 7 No Yes NT Pos 1:128 Pos 1:1024 Pos 1:256 Pos 1:512 5/10/2005 Positive (6/1/05) ClassFive 8 No No NT Pos 1:64 Pos 1:64 Pos 1:128 NT Negative RedPiano 9 No No NT Pos 1:1024 Pos 1:256 Pos 1:512 NT Negative Dynarein 10 No No NT Pos 1:128 Pos 1:256 Pos 1:512 NT Negative MoAppeal 11 No No NT Pos 1:32 Pos 1:64 Pos 1:64 NT Negative LunarGal 12 Yes Grade 1 Yes NT Pos 1:512 Pos 1:256 Pos 1:512 NT 5/7/2005 Positive (6/1/05) CastingPearls 13 No Yes NT Pos 1:512 Pos 1:2048 Pos 1:1024 NT 5/5/2005 Negative WhiteHotCat 14 No Yes NT Pos 1:512 Pos 1:1024 Pos 1:512 NT 5/8/2005 Negative DancingLeibling 15 No Yes NT Pos 1:512 Pos 1:1024 Pos 1:1024 NT 5/13/2005 Negative DukeofDestiny 16 Yes Grade 1 Yes Pos 1:256 Pos 1:128 Pos 1:4096 Pos 1:256 NT 5/8/2005 Positive (5/14/05) SisterSwank 17 No No NT Pos 1:128 Pos 1:512 Pos 1:512 NT Negative GrandSteal 18 No No NT Pos 1:512 Pos 1:512 Pos 1:512 NT Negative BwanaCharlie 19 No No NT NT Pos 1:256 Pos 1:1024 NT Negative Warleighg 20 Yes Grade 4 Yes Pos 1:256 NT NT NT NT 5/12/2005 Negative SongDancer 21 Yes Grade 1 No Pos 1:128 Pos 1:64 Pos 1:64 Pos 1:256 NT 5/12/2005 Negative LadyTak 22 Yes Grade 2 Yes Pos 1:256 Pos 1:512 Pos 1:512 Pos 1:1024 NT 5/8/2005 Positive (6/1/05) Summerly 23 Yes Grade 1 No Pos 1:512 Pos 1:512 Pos 1:512 Pos 1:512 NT 5/14/2005 Positive (6/1/05) SeductivelySmooth 24 No No NT Pos 1:512 Pos 1:512 Pos 1:512 NT Negative Megascape 25 No No NT Pos 1:256 Pos 1:128 Pos 1:256 NT Negative YaddoCat 26 No Yes NT Pos 1:512 Pos 1:512 Pos 1:1024 NT NSh Positive (6/1/05) LunarPalg 27 Yes Grade 1 Yes NT Pos 1:256 NT Pos 1:1024 NT 5/11/2005 Negative EndsofStorm 28 No Yes NT Pos 1:128 Pos 1:256 Pos 1:1024 NT 5/10/2005 Positive (6/1/05) Effectual 29 No No NT Pos 1:256 Pos 1:512 Pos 1:64 NT Negative Souris 30 No No NT Pos 1:256 Pos 1:128 Pos 1:512 NT Negative SantanaSprings 31 No No NT Pos 164 Pos 1:64 Pos 1:64 NT Negative Razor 32 No No NT Pos 1:512 Pos 1:512 Pos 1:1024 NT Negative MtnGeneral 33 No No NT Pos 1:256 Pos 1:512 Pos 1:256 NT Negative Hotense 34 No Yes NT Pos 1:128 Pos 1:2048 Pos 1:1024 NT 5/12/2005 Negative MyExtolledhonor 35 No No NT Pos 1:512 Pos 1:256 Pos 1:256 NT Negative DocO’Dynamite 36 Yes Grade 1 Yes NT Pos 1:512 Pos 1:512 Pos 1:256 NT 5/7/2005 Negative Poncho 37 No No NT Pos 1:256 Pos 1:256 Pos 1:512 NT Negative
Number positive findings 9 16 5i 22i 6i 1i 17 9

102
Murray State University, 2008 Animal Stall Presence
of neurologic
signs
Description of presenting neurologic signs
Presence of
respiratory signs
Description of presenting respiratory signs and
accompanying comments
EHV-1a serology
test results
EHV-1b
serology test results
Date of illness Onset
PCR test results (date positive
sample collected)
Claire 2 No Yes Runny/crusty nose NTc NT 3/23/08 Positive (4/9/08) Tinker 3 No No >1:256 NT Positive (4/22/08) Martini 4 No No NT Neg 1:4 Negative Rocket 5 Yes Rear limb ataxia Yes Coughing, runny/crusty nose NT NT 4/15/08 Positive (4/9/08) Sheeza 6 No Yes Runny/crusty nose Pos 1:32 NT 4/10/08 Positive (4/9/08) Cool 7 No No Pos 1:64 Pos 1:64 Negative Eddied 8 No No Pos 1:64 Pos 1:128 Negative Dina 32 No Yes Runny/crusty nose >1:256 NT 3/15/08 Positive (4/9/08) Fergie 33 No Yes Sinus infection, guttural pouches
flushed Pos 1:128 Pos 1:128 4/18/08 Negative
Chip 34 No No Pos 1:128 >1:256 Negative Buckye 35 No No Pos 1:128 Pos 1:128 Negative Bailey 36 No Yes Runny/crusty nose Pos 1:128 NT 3/8/08 Positive (4/9/08) Dancer 37 No Yes Runny/crusty nose Pos 1:64 NT 4/24/08 Positive (4/9/08) Rusty 38 No Yes Coughing, runny/crusty nose Pos 1:64 NT 2/10/08 Positive (4/9/08) Henry 39 Yes Dribbling urine, ataxiaf. No NT NT 5/7/08 Positive (4/9/08) Myrtle 40 No No >1:256 Pos 1:128 Negative Never 41 No No Pos 1:128 >1:256 Negative Mystic 42 No No Pos 1:64 NT Positive (4/22/08) Dixie 43 No No Pos 1:128 >1:256 Negative Zip 44 No Yes Runny nose. Tx w/antibiotics Pos 1:32 Pos 1:128 NSg Negative Sparten 45 No No >1:256 NT Positive (4/9/08) Calli 46 No Yes Coughing, runny/crusty nose > 1:256 >1:256 3/17/08 Negative Hershey 47 No Yes Runny/crusty nose. Tx w/antibiotics Pos 1:128 Pos 1:64 3/13/08 Negative Stella 48 No No > 1:256 Pos 1:128 Negative Booger 49 No No Pos 1:64 Pos 1:32 Negative Major 50 No No >1:256 NT Positive (4/9/08) Indy 51 No Yes Runny/crusty nose >1:256 NT 4/14/08 Positive (4/9/08) Sugar 52 No Yes Runny/crusty nose Pos 1:64 NT 3/26/08 Negative Omaha 53 No Yes Runny nose/ lacrimation Pos1:128 NT 3/31/08 Positive (4/9/08) Squirt 54 No Yes Coughing, runny/crusty nose Pos 1:32 NT 4/14/08 Negative Tucker 55 No Yes Coughing, runny nose Pos 1:64 NT NSg Positive (4/9/08) Lightening 56 No No >1:256 Pos 1:128 Negative Kiddo 57 No Yes Runny/crusty nose >1:256 Pos 1:128 3/1/08 Negative Zoey 58 Yes Painful, stiff rear limb gait No >1:256 >1:256 3/30/08 Negative Crimson 59a No No Pos 1:128 Pos 1:128 Negative Cupid 59b No No Neg 1:4 Neg 1:4 Negative Sobe 60 No Yes Runny/crusty nose Pos 1:64 NT 4/7/08 Positive (4/9/08)
Positive findings 3 18 11h 6I 18 17 a Samples collected 4/9/08; b Samples collected 4/22/08; c NT = Not tested; d Vaccinated 1/16/08, not considered at risk for infection; e Vaccinated 2/3/08, not considered at risk for infection;
f Transferred to equine referral hospital in Lexington, KY; g Not specified; h Number of horses with a titer > 1:256; I Total includes one horse with a four-fold change in titer “Zip”

103
APPENDIX D: Data elements used for model building with the predicted dates of disease onset for
each horse associated with the EHV-1 disease events at Churchill Downs Racetrack in 2005 and Murray State University in 2008

104
Churchill Downs, 2005 Animal Groom Age Gender Datea Stall State NSb PCRc Serological
positived Fevere Case Actual
onset datef Predicted
onset dateg Pimm’sO’Clock 1 2 1 108 1 2 0 1 1 1 1 126 127.84 GottaSecret 1 2 1 108 2 1 0 1 1 1 1 127 127.84 DiaAlegre 1 4 1 123 3 4 0 0 1 0 1 ------ 129.11 KingofCapers 1 2 1 96 4 4 1 0 1 1 1 126 126.65 Majestically 1 3 2 125 5 4 0 0 1 0 1 ------ 127.87 PrinessPegasus 1 3 2 87 6 4 0 0 1 0 1 ------ 127.87 Dances 2 3 1 74 7 3 0 1 1 1 1 130 128.03 ClassFive 2 3 1 101 8 2 0 0 0 0 0 ----- ------- RedPiano 2 4 2 87 9 3 0 0 1 0 1 ----- 129.26 Dynarein 2 4 1 87 10 2 0 0 1 0 1 ----- 129.26 MoAppeal 3 2 2 87 11 2 0 0 0 0 0 ------ ------ LunarGal 3 2 2 87 12 3 1 1 1 1 1 127 126.95 CastingPearls 3 3 2 87 13 4 0 0 1 1 1 125 128.18 WhiteHotCat 3 3 2 87 14 4 0 0 1 1 1 128 128.18 DancingLeibling 4 4 2 104 15 4 0 0 1 1 1 133 129.56 DukeofDestiny 4 2 1 97 16 3 1 1 1 1 1 128 127.09 SisterSwank 4 4 2 87 17 5 0 0 1 0 1 ------ 129.56 GrandSteal 4 5 1 128 18 2 0 0 1 0 1 ------ 130.79 BwanaCharlie 5 4 1 88 19 3 0 0 1 0 1 129.71 Warleigh 5 6 1 104 20 3 1 1 1 1 1 132 132.18 SongDancer 5 6 1 131 21 3 1 0 0 0 1 132 132.17 LadyTak 5 5 2 88 22 3 1 0 1 1 1 128 130.94 Summerly 6 3 2 87 23 4 1 0 1 0 1 134 128.63 SeductivelySmooth 6 3 2 87 24 3 0 0 1 0 1 ----- 128.63 Megascape 6 3 2 1 25 5 0 0 1 0 1 ----- 128.63 YaddoCat 6 2 2 87 26 3 0 1 1 1 1 ----- 127.39 LunarPal 7 3 1 87 27 5 1 1 0 1 1 131 128.78 EndsofStorm 7 2 1 91 28 3 0 0 1 1 1 130 127.54 Effectual 7 2 2 87 29 3 0 0 1 0 1 ----- 127.54 Souris 7 5 2 87 30 1 0 1 1 0 1 ----- 131.24 SantanaSprings 8 3 1 108 31 3 0 0 0 0 0 ----- ----- Razor 8 2 1 87 32 3 0 1 1 0 1 ----- 127.69 MtnGeneral 8 6 1 91 33 2 0 0 1 0 1 ----- 132.63 Hotense 8 5 2 104 34 3 0 0 1 1 1 132 131.00 MyExtolledhonor 9 9 1 101 35 5 0 0 1 0 1 ------ 136.47 DocO’Dynamite 9 2 1 104 36 3 1 0 1 1 1 127 127.84 Poncho 10 11 1 87 37 3 0 0 1 0 1 ----- 139.08 aDate of arrival in Kentucky ; bDeveloped Neurological illness; cPCR positive; d Either single EHV-1 titer > 256 or four-fold change in titer; eTemp > 101.5°; f,gJulian calendar date for onset of clinical illness. Binominal responses coded as No = 0, Yes = 1.

105
Murray State University, 2008 Animal Stall Area Breed Gender Age Ever
VACb Rec
VACc Freq
Assistd PCRa NS Serological
positive Respiratory
illness Case Actual
onset datee Predicted onset date
Claire 2 3 1 2 3 0 0 3 1 0 0 1 1 83 83.43 Tinker 3 3 1 2 10 1 0 3 1 0 1 0 1 ----- 82.93 Martini 4 3 1 2 6 1 1 1 0 0 0 0 0 ----- ----- Rocket 5 3 2 1 14 0 0 1 1 1 0 1 1 106 95.04 Sheza 6 3 1 2 7 0 0 2 1 0 0 1 1 101 93.28 Cool 7 3 1 1 22 0 0 3 0 0 0 0 0 ----- ----- Eddie 8 3 3 1 11 1 1 2 0 0 0 0 0 ----- ----- Dina 32 2 1 2 4 1 0 2 1 0 1 1 1 75 96.84 Fergie 33 1 1 2 1 1 1 2 0 0 0 1 1 109 112.92 Chip 34 2 1 1 3 1 1 3 0 0 1 0 1 ----- 111.91 Bucky 35 1 1 2 18 1 1 2 0 0 0 0 0 ----- ----- Bailey 36 2 2 1 15 1 1 3 1 0 0 1 1 68 72.39 Dancer 37 1 3 2 2 1 1 1 1 0 0 1 1 115 101.58 Rusty 38 2 3 1 4 0 0 3 1 0 0 1 1 41 60.79 Henry 39 1 1 1 14 0 0 1 1 1 0 0 1 128 121.77 Myrtle 40 2 3 2 19 1 0 1 0 0 1 0 1 ----- 83.49 Never 41 1 2 1 15 1 0 3 0 0 1 0 1 ----- 86.47 Mystic 42 2 1 2 3 1 0 1 1 0 0 0 1 ----- 103.69 Dixie 43 1 1 2 5 1 0 3 0 0 1 0 1 ----- 96.06 Zip 44 1 1 1 13 1 0 3 0 0 1 1 1 ----- 95.56 Sparten 45 1 2 1 5 1 0 3 1 0 1 0 1 ----- 84.47 Calli 46 2 1 2 7 0 0 1 0 0 1 1 1 77 101.69 Hershey 47 1 3 1 12 0 0 3 1 0 0 1 1 73 72.87 Stella 48 2 2 2 5 1 0 1 0 0 1 0 1 ----- 83.72 Booger 49 1 3 1 10 1 0 2 0 0 0 0 0 ----- ----- Major 50 2 1 1 13 1 0 3 1 0 1 0 1 ----- 75.98 Indy 51 1 1 2 4 1 1 1 1 0 1 1 1 105 115.76 Sugar 52 2 1 1 5 1 1 3 0 0 0 1 1 86 74.98 Omaha 53 2 1 1 13 1 1 3 1 0 0 1 1 91 74.48 Squirt 54 2 1 2 1 1 1 1 0 0 0 1 1 105 73.98 Tucker 55 2 1 1 8 1 0 1 1 0 0 1 1 ----- 97.18 Lightening 56 1 1 1 7 1 0 3 0 0 1 0 1 ----- 89.55 Kiddo 57 2 3 1 3 1 1 2 0 0 1 1 1 61 63.14 Zoey 58 1 1 2 3 0 0 3 0 1 1 0 1 90 88.55 Crimson 59a 2 1 2 10 1 1 2 0 0 0 0 0 ----- ----- Cupid 59b 2 2 2 .17 0 0 2 0 0 0 0 0 ----- ----- Sobe 60 1 2 1 12 1 1 2 1 0 0 1 1 98 88.81 aPolymerase Chain Reaction; bEver been vaccinated against EHV-1; cRecently vaccinated against EHV-1;dFrequncey that owner provided assistance to other horses owners for care and feeding; eJulian calendar date for onset of clinical illness; Binominal responses coded as No = 0, Yes = 1.

106
APPENDIX E: Calculation of the initial doubling time of EHV-1 cases for each EHV-1 disease event

107
A. Churchill Downs Racetrack
td = (t1 – t0) log (2) / log [N1 / N0] (see equation 1.6) where t0 = 1 day t1 = 1.3 days N0 = 1 N1 = 2 td = (1.3 – 1.0) log (2) / log [2 / 1] td = (0.3) 0.30103 / 0.30103 td = 0.09031 / 0.301 td = 0.2999
B. Murray State University Student Barn
td = (t1 – t0) log (2) / log [N1 / N0] (see equation 1.6) where t0 = 1 day t1 = 3.5 days N0 = 1 N1 = 2 td = (3.5 – 1.0) log (2) / log [2 / 1] td = (2.5) 0.30103 / 0.30103 td = 0.7225/ 0.30103 td = 2.4999

108
APPENDIX F: Calculation of the basic reproductive number (R0) for each EHV-1 disease event

109
A. Churchill Downs
R0 = 1 + D ln2 / td (equation 1.5) where td = 0.2999 (see Appendix E) D = 4 days Goodman et al., 2006 R0 = 1 + (4.0) (0.69315) / 0.2999 R0 = 1 + 2.7726 / 0.2999 R0 = 1 + 9.245 R0 = 10.25 B. Murray State University
R0 = 1 + D ln2 / td (equation 1.5) where td = 2.4999 (see Appendix E) D = 7 days Allen, 2002a
personal communications – G. Allen R0 = 1 + (7.0) (0.69315) / 2.4999 R0 = 1 + 4.8528 / 2.4999
R0 = 1 + 1.9409 R0 = 2.94

110
APPENDIX G: Calculation of the exponential growth rate – r for each EHV-1 disease event

111
A. Churchill Downs Racetrack
r = ln (2)/ td (equation 1.8)
where td = 0.2999 (see Appendix E)
r = (0.69315) / 0.2999 r = 2.311
B. Murray State University Student Barn r = ln (2)/ td (equation 1.8) where td = 2.4999 (see Appendix E) r = (0.69315) / 2.4999
r = 0.2773

112
APPENDIX H: Calculation of the generation interval of EHV-1 cases for disease event location

113
A. Churchill Downs Racetrack
Tg = (R0 – 1) / (r R0) (equation 1.10)
where r = 2.317 (see Appendix E) R0 = 10.25 (see Appendix F)
Tg = (10.25 -1) / [(2.311) (10.25)] Tg = 9.25 / 23.749 Tg = 0.390 days
B. Murray State University Student Barn Tg = (R0 – 1) / (r R0) (equation 1.10) where r = 0.2773 (see Appendix E) R0 = 2.9419 (see Appendix F)
Tg = (R0 – 1) / (r R0) Tg = (2.9419 -1) / [(0.2773) (2.9419)] Tg = 1.9419 / 0.81579 Tg = 2.38 days

114
APPENDIX I: Calculation of the minimum value for Herd Immunity (HI) needed to eliminate the
spread of EHV-1 by each event location

115
A. Churchill Downs Racetrack
Herd Immunity (HI) = 1 – 1/R0
where R0 = 10.25 (see Appendix D)
HI = 1 – 1/10.25 HI = 1 – 0.0976 HI = 90.24%
B. Murray State University Student Barn
Herd Immunity (HI) = 1 – 1/R0
where R0 = 2.9419 (see Appendix D)
HI = 1 – 1/2.9419 HI = 1 – 0.3399 HI = 66.0%

116
APPENDIX J: R and SAS Code

117
I. R code
_____________________ Date of Onset Data – Churchill Downs___________________ Obs <-c(4,13,1,2,12,36,14,16,22,7,28,27,20,34,15,21,23) Stall <-c(4,13,1,2,12,36,14,16,22,7,28,27,20,34,15,21,23) Gender <-c(2,1,2,2,1,2,1,2,1,2,2,2,2,1,1,2,1) Age <-c(2,3,2,2,2,2,3,2,5,3,2,3,6,5,4,6,3) Groom <-c(1,3,9,9,3,9,3,4,5,2,7,7,5,8,4,5,3) State <-c(2,1,4,4,4,4,4,2,3,2,2,3,4,4,4,5,3) Date <-c(96,87,77,108,87,104,77,97,88,74,91,87,104,104,104,131,87) NS <-c(1,0,0,0,1,1,0,1,1,0,0,1,1,0,0,1,1) Time <-c(125,125,126,127,127,127,128,128,128,130,130,131,132,132,133,134,134) PCR <-c(0,0,1,1,1,0,0,1,1,1,1,0,0,0,0,0,1) Side <-c(1,1,1,1,1,2,1,1,2,1,2,2,2,2,1,2,2) Quarter <-c(1,2,1,1,2,4,2,2,3,1,4,3,3,4,2,3,3) ___________________________ EDA – Churchill Downs _________________________
summary (Obs) summary (Stall) summary (Gender) summary (Age) summary (Groom) summary (State) summary (Date) summary (NS summary (Time) summary (PCR) summary (Side) summary (Quarter) _______________________________Call in Library ______________________________ library (MASS) library (survival)
_____________________________ Model Building ______________________________
library (MASS) MLRfit.9 <-lm(Time~Groom) summary (MLRfit.9) Stepwise.fit <- stepAIC(MLRfit.7, scope = list(upper= ~Groom + Age + Gender + Stall + State + Date + NS + PCR + Groom:Age + Stall:Age + Groom:Stall, lower = MLRfit.9), direction = "both")

118
___________________________ Final Model - CD_______________________________
MLRfit.7 <- lm(Time ~ Groom + Age) summary (MLRfit.7) plot(fitted(MLRfit.7),Time,xlim=c(125,135), ylim=c(120,140), xlab ="Fitted Model", ylab ="Date of Fever Onset",main ="Outbreak of Neurologic Equine Herpes (EHV-1)\n Churchill Downs - 2005") abline(0,1) predict.lm (MLRfit.7, interval = "confidence") predict.lm (MLRfit.7, interval = "prediction") ______________________ Diagnostics for Final Model - CD _______________________ par(mfrow = c(2,2)) plot(fitted(MLRfit.7),Time,xlim=c(125,135), ylim=c(120,140), xlab ="Fitted Model", ylab ="Date of Illness Onset",main ="") abline(0,1) plot (fitted(MLRfit.7),resid(MLRfit.7),xlab = "Fitted Values", ylab ="Residuals",main="") lines(lowess(fitted(MLRfit.7),resid(MLRfit.7))) qqnorm(resid(MLRfit.7),main="") qqline(resid(MLRfit.7)) hist(resid(MLRfit.7),xlab ="Residuals",main="") plot(fitted(MLRfit.7),Time,xlim=c(125,135), ylim=c(120,140), xlab ="Fitted Model", ylab ="Date of Fever Onset",main ="Churchill Downs - 2005") abline(0,1) ___________________ Point Estimates - Final Churchill Model _____________________ newdata3 = list (Groom =c(1), Age=c(4)) predict.lm(MLRfit.7, newdata3, interval ="confidence") newdata5 = list (Groom =c(1), Age=c(3)) predict.lm(MLRfit.7, newdata5, interval ="confidence") newdata6 = list (Groom = c(1), Age=c(3)) predict.lm(MLRfit.7, newdata6, interval ="confidence")

119
newdata8 = list (Groom = c(2), Age=c(3)) predict.lm(MLRfit.7, newdata8, interval ="confidence") newdata9 = list (Groom = c(2), Age=c(4)) predict.lm(MLRfit.7, newdata9, interval ="confidence") newdata10 = list (Groom = c(2), Age=c(4)) predict.lm(MLRfit.7, newdata10, interval ="confidence") newdata11 = list (Groom = c(3), Age=c(2)) predict.lm(MLRfit.7, newdata11, interval ="confidence") newdata17 = list (Groom = c(4), Age=c(4)) predict.lm(MLRfit.7, newdata17, interval ="confidence") newdata18 = list (Groom = c(4), Age=c(5)) predict.lm(MLRfit.7, newdata18, interval ="confidence") newdata19 = list (Groom = c(5), Age=c(4)) predict.lm(MLRfit.7, newdata19, interval ="confidence") newdata24 = list (Groom = c(6), Age=c(3)) predict.lm(MLRfit.7, newdata24, interval ="confidence") newdata25 = list (Groom = c(6), Age=c(3)) predict.lm(MLRfit.7, newdata25, interval ="confidence") newdata26 = list (Groom = c(6), Age=c(2)) predict.lm(MLRfit.7, newdata26, interval ="confidence") newdata29 = list (Groom = c(7), Age=c(2)) predict.lm(MLRfit.7, newdata29, interval ="confidence") newdata30 = list (Groom = c(7), Age=c(5)) predict.lm(MLRfit.7, newdata30, interval ="confidence") newdata31 = list (Groom = c(8), Age=c(3)) predict.lm(MLRfit.7, newdata31, interval ="confidence") newdata32 = list (Groom = c(8), Age=c(2)) predict.lm(MLRfit.7, newdata32, interval ="confidence") newdata33 = list (Groom = c(8), Age=c(6)) predict.lm(MLRfit.7, newdata33, interval ="confidence") newdata35 = list (Groom = c(9), Age=c(9))

120
predict.lm(MLRfit.7, newdata35, interval ="confidence") newdata37 = list (Groom = c(10), Age=c(11)) predict.lm(MLRfit.7, newdata37, interval ="confidence")
_________________ Date of Onset Data – Murray State University _________________ Obs <-c(1,2,3,4,5,6,7,8,9,10,11,12,13,14,15,16,17,18) Stall <-c(02,05,06,32,33,36,37,39,44,46,47,51,52,54,55,57,58,60) Area <-c(3,3,3,2,1,2,1,2,1,2,1,1,2,2,2,2,1,1) Breed <-c(1,2,1,1,1,2,3,3,1,1,3,1,1,1,1,3,1,2) Gender <-c(2,1,2,2,2,1,2,1,1,2,1,2,1,1,2,1,2,1) Age <-c(3,14,7,4,1,15,2,4,14,7,12,4,5,13,1,3,3,12) PCR <-c(1,1,1,1,0,1,1,1,1,0,1,1,0,1,0,0,0,1) EverVac <-c(0,0,0,1,1,1,1,0,0,0,0,1,1,1,1,1,0,1) RecVac <-c(0,0,0,0,1,1,1,0,0,0,0,1,1,1,1,1,0,1) FreqAssist <-c(3,1,2,2,2,3,1,3,1,1,3,1,3,3,1,2,3,2) Time <-c(83,106,101,75,109,68,115,41,128,77,73,105,86,91,105,61,90,98) ________________________ EDA – Murray State University ______________________ summary (Obs) summary (Stall) summary (Location) summary (Section) summary (Area) summary (Breed) summary (Gender) summary (Age) summary (PCR) summary (EverVac) summary (RecVac) summary (FreqAssist) summary (Time) _______________________________Call in Library ______________________________ library (MASS) _______________________ Model Building – Murray State University _______________ library (MASS) MLRfit.4 <-lm(Time~Stall) summary (MLRfit.4)

121
StepwiseForward.fit <- stepAIC(MLRfit.4, scope = list(upper= ~Stall + Location + +Section + Area + Breed + Gender + Age + PCR + + EverVac + RecVac + FreqAssist, lower = MLRfit.4), direction = "both") ___________________ Final Model - Murray State University ______________________ MLRfit.5 <- lm(Time ~ Stall + Area + Breed + FreqAssit) summary (MLRfit.5) plot(fitted(MLRfit.5),Time,xlim=c(40,140), ylim=c(40,140), xlab ="Fitted Model", ylab ="Date of Disease Onset",main ="Outbreak of Equine Herpes (EHV-1)\n Murray State University - 2008") abline(0,1) predict.lm (MLRfit.5, interval = "confidence") predict.lm (MLRfit.5, interval = "prediction")
_______________Diagnostics for Final Model - Murray State University_______________ par(mfrow = c(2,2)) plot(fitted(MLRfit.5), Time,xlim=c(60,120),ylim=c(60,120), xlab ="Fitted model", ylab ="Date of illness onset", main="") abline(0,1) plot(fitted(MLRfit.5),Time,xlim=c(40,140), ylim=c(40,140), xlab ="Fitted Model", ylab ="Date of Disease Onset",main ="") abline(0,1) plot (fitted(MLRfit.5),resid(MLRfit.5),xlab = "Fitted Values", ylab ="Residuals",main="") lines(lowess(fitted(MLRfit.5),resid(MLRfit.5))) qqnorm(resid(MLRfit.5),main="") qqline(resid(MLRfit.5)) hist(resid(MLRfit.5),xlab ="Residuals",main="") ____________ Point Estimates - Final Murray State University Model _________________ newdata1 = list (Stall =c(2), Area =c(3), Breed =c(1), FreqAssit = c(3)) predict.lm(MLRfit.5, newdata1, interval ="confidence")

122
newdata2 = list (Stall =c(3), Area =c(3), Breed =c(1), FreqAssit = c(3)) predict.lm(MLRfit.5, newdata2, interval ="confidence") newdata3 = list (Stall =c(5), Area =c(3), Breed =c(2), FreqAssit = c(1)) predict.lm(MLRfit.5, newdata3, interval ="confidence") newdata4 = list (Stall =c(6), Area =c(3), Breed =c(1), FreqAssit =c(2)) predict.lm(MLRfit.5, newdata4, interval ="confidence") newdata5 = list (Stall =c(32), Area =c(2), Breed =c(1), FreqAssit= c(2)) predict.lm(MLRfit.5, newdata5, interval ="confidence") newdata6 = list (Stall =c(33), Area =c(1), Breed =c(1), FreqAssit = c(2)) predict.lm(MLRfit.5, newdata6, interval ="confidence") newdata7 = list (Stall =c(34), Area =c(2), Breed =c(1), FreqAssit= c(3)) predict.lm(MLRfit.5, newdata7, interval ="confidence") newdata8 = list (Stall =c(36), Area =c(2), Breed =c(2), FreqAssit= c(3)) predict.lm(MLRfit.5, newdata8, interval ="confidence") newdata9 = list (Stall =c(37), Area =c(1), Breed =c(3), FreqAssit = c(1)) predict.lm(MLRfit.5, newdata9, interval ="confidence") newdata10 = list (Stall =c(38), Area =c(2), Breed =c(3), FreqAssit = c(3)) predict.lm(MLRfit.5, newdata10, interval ="confidence") newdata11 = list (Stall =c(39), Area =c(1), Breed =c(1), FreqAssit = c(1)) predict.lm(MLRfit.5, newdata11, interval ="confidence") newdata13 = list (Stall =c(40), Area =c(2), Breed =c(3), FreqAssit= c(1)) predict.lm(MLRfit.5, newdata1, interval ="confidence") newdata14 = list (Stall =c(41), Area =c(1), Breed =c(2), FreqAssit = c(3)) predict.lm(MLRfit.5, newdata14, interval ="confidence") newdata15 = list (Stall =c(42), Area =c(2), Breed =c(1), FreqAssit =c(1)) predict.lm(MLRfit.5, newdata15, interval ="confidence") newdata16 = list (Stall =c(43), Area =c(1), Breed =c(1), FreqAssit = c(3)) predict.lm(MLRfit.5, newdata16, interval ="confidence") newdata17 = list (Stall =c(44), Area =c(1), Breed =c(1), FreqAssit = c(3)) predict.lm(MLRfit.5, newdata17, interval ="confidence") newdata19 = list (Stall =c(45), Area =c(1), Breed =c(2), FreqAssit = c(3))

123
predict.lm(MLRfit.5, newdata19, interval ="confidence") newdata20 = list (Stall =c(46), Area =c(2), Breed =c(1), FreqAssit = c(1)) predict.lm(MLRfit.5, newdata20, interval ="confidence") newdata21 = list (Stall =c(47), Area =c(1), Breed =c(3), FreqAssit = c(3)) predict.lm(MLRfit.5, newdata21, interval ="confidence") newdata22 = list (Stall =c(48), Area =c(2), Breed =c(2), FreqAssit = c(1)) predict.lm(MLRfit.5, newdata22, interval ="confidence") newdata23 = list (Stall =c(50), Area =c(2), Breed =c(1), FreqAssit = c(3)) predict.lm(MLRfit.5, newdata23, interval ="confidence") newdata24 = list (Stall =c(51), Area =c(1), Breed =c(1), FreqAssit = c(1)) predict.lm(MLRfit.5, newdata24, interval ="confidence") newdata25 = list (Stall =c(52), Area =c(2), Breed =c(1), FreqAssit = c(3)) predict.lm(MLRfit.5, newdata25, interval ="confidence") newdata26 = list (Stall =c(53), Area =c(2), Breed =c(1), FreqAssit =c(3)) predict.lm(MLRfit.5, newdata26, interval ="confidence") newdata27 = list (Stall =c(54), Area =c(2), Breed =c(1), FreqAssit =c(1)) predict.lm(MLRfit.5, newdata27, interval ="confidence") newdata28 = list (Stall =c(55), Area =c(2), Breed =c(1), FreqAssit =c(1)) predict.lm(MLRfit.5, newdata28, interval ="confidence") newdata29 = list (Stall =c(56), Area =c(2), Breed =c(1), FreqAssit =c(1)) predict.lm(MLRfit.5, newdata29, interval ="confidence") newdata30 = list (Stall =c(57), Area =c(2), Breed =c(3), FreqAssit =c(2)) predict.lm(MLRfit.5, newdata30, interval ="confidence") newdata31 = list (Stall =c(58), Area =c(1), Breed =c(1), FreqAssit =c(3)) predict.lm(MLRfit.5, newdata31, interval ="confidence") newdata32 = list (Stall =c(60), Area =c(1), Breed =c(2), FreqAssit =c(2)) predict.lm(MLRfit.5, newdata32, interval ="confidence") __________________________ Survival Analysis ________________________________ library (MASS) library (survival)

124
___________Kaplan Meier-Empirical Survival Function (Churchill Downs) ____________ Church <-c(1.0,1.3,1.4,1.7,1.8,1.8,2.0,2.1,2.1,2.1,2.2,2.2,2.3,2.5,2.5,2.9,2.9,2.9,3.1,3.4, 3.6,3.6,3.9,3.9,4.0,5.1,5.2,5.3,5.5,6.5,6.5,6.9,10.8,13.4,14.0,14.0,14.0) plot(stepfun(c(1.0,1.3,1.4,1.7,1.8,2.0,2.1,2.2,2.3,2.5,2.9,3.1,3.4,3.6,3.9,4.0,5.1,5.2,5.3,5.5,6.5,6.9,10.8,13.4,14.0), c(1,36/37,35/37,34/37,33/37,31/37,30/37,27/37,25/37,24/37,22/37,19/37,18/37,17/37,15/37,13/37,12/37,11/37,10/37,9/37,8/37,6/37,5/37,4/37,3/37,0)), main = "", xlab="Time to Infection (Days)",ylab= "Survival Probability")
Event <-c(1,1,1,1,1,1,1,1,1,1,1,1,1,1,1,1,1,1,1,1,1,1,1,1,1,1,1,1,1,1,1,1,1,1,1,1,1,0,0,0, 0,0,0,0,0,0,0,0,0,0,0,0,0,0,0,0,0,0,0,0,0,0,0,0,0,0,0,0,0,0,0,0) Time <-c(1.0,1.3,1.4,1.7,1.8,1.8,2.0,2.1,2.1,2.1,2.2,2.2,2.3,2.5,2.5,2.9,2.9,2.9,3.1,3.4, 3.6,3.6,3.9,3.9,4.0,5.1,5.2,5.3,5.5,6.5,6.5,6.9,10.8,13.4,14.0,14.0,14.0,1.0,3.5,12.6,13.1,14.2,14.7,15.2,16.2,23.1,23.6,23.7,23.9,24.7,26.7,28.8,29.0,29.8,33.5,35.3,35.8,36.3,37.1,37.4, 41.8,41.9,43.9,52.1,53.1,55.9,62.0,63.0,63.0,63.0,63.0,63.0) Status <-c(1,1,1,1,1,1,1,1,1,1,1,1,1,1,1,1,1,1,1,1,1,1,1,1,1,1,1,1,1,1,1,1,1,1,0,0,0,1,1,1, 1,1,1,1,1,1,1,1,1,1,1,1,1,1,1,1,1,1,1,1,1,1,1,1,1,1,1,0,0,0,0,0) summary (Church) KMfit.C <-survfit(Surv(Time,Status)~Event, subset=Event== 1) plot(KMfit.C, conf.int = F, xlab = "Time to Infection (Days)", ylab = "Survival Probability", main = "") ________ Kaplan Meier-Empirical Survival Function (Murray State University) _________ Murray <-c(1,3.5,12.6,13.1,14.2,14.7,15.2,16.2,23.1,23,6,23.7,23.9,24.7,26.7,28.8,29.0, 29.8,33.5,35.3,35.8,36.3,37.1,37.4,41.8,41.9,43.9,52.1,53.1,55.9,62.0,63.0) plot(stepfun(c(1.0,3.5,12.6,13.1,14.2,14.7,15.2,16.2,23.1,23.6,23.7,23.9,24.7,26.7,28.8,29.0,29.8,33.5,35.3,35.8,36.3,37.1,37.4,41.8,41.9,43.9,52.1,53.1,55.9,62.0,63.0), c(1,34/35, 33/35,32/35,31/35,30/35,29/35,28/35,27/35,26/35,25/35,24/35,23/35,22/35,21/35,20/35, 19/35,18/35,17/35,16/35,15/35,14/35,13/35,12/35,11/35,10/35,9/35,8/35,7/35,6/35,5/35,0)), main ="",xlab ="Time to Infection (Days)",ylab ="Survival Probability") summary (Murray) -- Kaplan-Meier Estimates of the Survival Functions for Churchill Versus Murray State ----- Horse <-c(1,2,3,4,5,6,7,8,9,10,11,12,13,14,15,16,17,18,19,20,21,22,23,24,25,26,27,28,29,

125
30,31,32,33,34,35,36,37,38,39,40,41,42,43,44,45,46,47,48,49,50,51,52,53,54,55,56,57,58,59,60,61,62,63,64,65,66,67,68,69,70,71,72) Event <-c(1,1,1,1,1,1,1,1,1,1,1,1,1,1,1,1,1,1,1,1,1,1,1,1,1,1,1,1,1,1,1,1,1,1,1,1,1,0,0,0,0, 0,0,0,0,0,0,0,0,0,0,0,0,0,0,0,0,0,0,0,0,0,0,0,0,0,0,0,0,0,0,0) Churchill <c(125,125,126,127,167,127,128,128,128,130,130,131,132,132,133,126,129,126, 125,127,167,127,127,129,129,131,132,130,129,128,128,131,167,129,133,139,144) Murray <-c(24,23,63,35,35,63,37,53,52,13,42,1,62,24,27,44,36,36,25,42,63,13,24,16,56, 15,14,37,30,3,29,63,63,29) Time <-c(1.0,1.3,1.4,1.7,1.8,1.8,2.0,2.1,2.1,2.1,2.2,2.2,2.3,2.5,2.5,2.9,2.9,2.9,3.1,3.4,3.6, 3.6,3.9,3.9,4.0,5.1,5.2,5.3,5.5,6.5,6.5,6.9,10.8,13.4,63.0,63.0,63.0,1.0,3.5,12.6,13.1,14.2,14.7,15.2,16.2,23.1,23.6,23.7,23.9,24.7,26.7,28.8,29.0,29.8,33.5,35.3,35.8,36.3,37.1,37.4,41.8,41.9,43.9,52.1,53.1,55.9,62.0,63.0,63.0,63.0,63.0,63.0) Status <-c(1,1,1,1,1,1,1,1,1,1,1,1,1,1,1,1,1,1,1,1,1,1,1,1,1,1,1,1,1,1,1,1,1,1,0,0,0,1,1,1,1, 1,1,1,1,1,1,1,1,1,1,1,1,1,1,1,1,1,1,1,1,1,1,1,1,1,1,0,0,0,0,0) library (MASS) library (survival) ________________________ Survival Analysis- Combined _________________________ KMfit.1 <-survfit(Surv(Time,Status)~Event, subset=Event== 1) plot(KMfit.1, conf.int = F, xlab = "Time to Infection (Days)", ylab = "Survival Probability", main = "") summary (KMfit.1) KMfit.2 <-survfit(Surv(Time,Status)~Event, subset=Event==0) plot(KMfit.2, conf.int = F, xlab = "Time to Infection (Days)", ylab = "Survival Probability", main = "") summary (KMfit.2) KMfit.3 <-survfit(Surv(Time,Status)~Event) plot(KMfit.3, conf.int = F, lty =c(1,2), xlab = "Time to Infection (Days)", ylab = "Survival Probability", main = "") summary (KMfit.3) survdiff(Surv(Time)~Event, rho=0)

126
II. SAS Code
Churchill Downs DATA HERPESCASES; INPUT OBS HORSE $ 4-22 Stall 23-25 Gender Age GROOM Fever; CARDS; Proc Freq; run; Proc REG; Model Fever = Stall Groom Age / TOL VIF; Run;
Murray State University
DATA HERPESCASES;_ INPUT OBS HORSE $ 4-22 Stall 23-25 Gender Age Area Breed FreqAssit Onset; CARDS; Proc Freq; run; Proc REG; Model Onset = Stall Area Breed FreqAssit / TOL VIF; Run;

127
REFERENCES
1. Aaby, P. Patterns of exposure and severity of measles infection Copenhagen 1915-1925. Ann. Epidemol. 1992;2:257-262.
2. Abbey, H. An examination of the Reed-Frost theory of epidemics. Hum. Biol. 1952;
243: 201-233. 3. Allen GP and Bryans JT. Molecular epizootiology, pathogenesis and prophylaxis of
equine herervirus-1 infections. In: Pandey, R (Ed.), Prog. Vet. Microbiol. Immunol. S. Karger, Basel, 1986; 78-144.
4. Allen GP, Kydd JH, Slater JD, and Smith KC. Advances in understanding of the
pathogenesis, epidemiology, and immunological control of equid herpesvirus abortion. In: Werney, U, Wade JF, Mumford, JA, Kaaden, OR (Eds), Equine infectious diseases. VIII. Proceedings of the Eighth International Conference, Dubai, 23-26 March 1998, R&W Publications, Newmarket, 1999; 129-146.
5. Allen GP. Epidemic disease caused by equine herpesvirus-1: recommendations for
prevention and control. Equine Vet. Educ. 2002a; 177-184. 6. Allen GP. Respiratory infections by equine herpesvirus types 1 and 4. In: Lekeux P
(Ed.) Equine respiratory diseases. International Veterinary Information Service, Ithaca, NY, 2002b.
7. Allen GP and Breathnach CC. Quantification by real-time PCR of the magnitude and
duration of leucocyte-associated viremia in horses infected with neuropathogenic vs non-pathogenic strains of EHV-1. Equine Vet. J. 2006a; 38:252-257.
8. Allen GP. Antemortem detection of horses latently infected with neuropathogenic
strains of equine herpesvirus-1. Am. J. Res.2006; 67:1401-1405. 9. Allen GP. Development of a real-time polymerase reaction assay for rapid diagnosis
of neuropathogenic strains of equine herpesvirus-1. J. Vet. Diagn. Invest. 2007; 19:69-72.
10. Allen GP. Risk factors for development of neurologic disease after experimental
exposure to equine herpesvirus-1 in horses. Am. J. Vet. Res. 2008; 69:1595-1600. 11. American Association of Equine Practitioners (AAEP). Lameness exams: evaluating
the lame horse [cited 2011 Aug 26]. Available from http://www.aaep.org/health_articles_view.php?id=280
12. American Association of Equine Practitioners (AAEP). Vaccination guidelines [cited
2012 Mar 4]. Available from http://www.aaep.org/images/files/AdultVaccinationChartFinal022412.pdf.

128
13. Anderson RM and May RM. Infectious Diseases of Humans: Dynamics and Control. Oxford Univ. Press, Oxford 1991.
14. Aron JL. Mathematical Modeling: The Dynamics of Infection. In: Infectious Disease
Epidemiology: theory and practice, 2nd edition. Eds Nelson KE and Williams CFM, pp. 181-212: Jones and Bartlett, Sudbury, MA 2007.
15. Barbić L, Lojkić I, Stevanović V, Bedeković T, Starešina, V, Lemo N, Lojkić M and
Madić J. Tow outbreaks of neuropathogenic equine herpesvirus type 1 with breed-dependent clinical signs. Vet. Rec. 2012; 170:227-230.
16. Bell SA, Balasuriya BR, Gardner IA, Barry PA, Wilson WD, Ferraro GL and
MacLachlan NJ. Temporal detection of equine herpesvirus infections of a cohort of mares and their foals. Vet. Microbiol. 2006; 5:472-475.
17. Borchers K, Thein P and Stein-Kock A. Review Article – Pathogenesis of equine
herpesvirus-associated neurological disease: a revised explanation. Equine Vet. J. 2006; 38:283-287.
18. Breathitt Veterinary Center Laboratory DNA SOP 0011 DNA Blood Extraction
document. 2008. 19. Breathitt Veterinary Center Laboratory DNA SOP 0050 Equine Herpesvirus 1 and 4
PCR document. 2008. 20. Breathnach CC, Yeargan, MR, Sheoran AS and Allen GP. The mucosal humoral
immune response of the horse to infective challenge and vaccination with equine herpesvirus-1 antigens. Equine Vet. J. 2001; 33:651-657.
21. Breathnach CC, Yeargan MR and Allen GP. Detection of equine herpesvirus-specific
effector and memory cytotoxic immunity in the equine upper respiratory tract. Vet. Immunol. Immunopathol. 2006; 111:117-125.
22. Brown JA, Mapes S, Ball BA, Hodder ADJ, Liu IK, and Pusterla N. Prevalence of
equine herpesvirus-1 infection among Thoroughbreds residing on a farm on which the virus was endemic. JAVMA 2007; 231:577-580.
23. Bull K and Spiegelhalter DJ. Tutorial in biostatics. Survival analysis in observational
studies. Stat. Med. 1997; 16:1041-1074. 24. Burgess BA, Tokateloff N, Manning S, Lohmann K, Lunn DP, Hussey SB, and
Morley PS. Nasal shedding of equine herpesvirus-1 from horses in an outbreak of equine herpes myeloencephalopathy in western Canada. J. Vet. Intern. Med. 2012; 26:384-392.

129
25. Burrell MH, Wood, JLN, Whitwell KE, Chanter N, Mackintosh ME, and Mumford JA. Respiratory disease in thoroughbred horses in training: the relationships between disease and viruses, bacteria and environment. Vet. Rec. 1996; 139:308-313.
26. Carpenter TE. Epidemiologic programs for computers and calculators: epidemiologic
modeling using a microcomputer spreadsheet package. Am. J. Epidemiol. 1984; 120:943-951.
27. Carr E, Schott H, and Pusterla N. Absence of equid herpervirus-1 reactivation and
viremia in hospitalized critically ill horses. J. Vet. Intern. Med. 2011; 25:1190-1193. 28. Carrat F, Vergus E, Ferguson NM, Lemaitre M, Cauchemez S, Leach S, and Valleron
A-J. Time lines of infection and disease in human influenza: A review of volunteer challenge studies. Am. J. Epidemiol. 2008; 167:775-785.
29. Catley A, Okoth S, Osman J, Fison T, Njiru Z, Mwangi, Jones BA and Leyland TJ.
Participatory diagnosis of a chronic wasting disease in cattle in southern Sudan. Prev. Vet. Med. 2001; 51:161-181.
30. Center for Disease Control and prevention. Case definitions for public health
surveillance. MMWR 1990 (RR-13); 39:1-43. 31. Center for Disease Control. Notes from the field: Escherichia coli 0157:H7
gastroenteritis associated with a state fair – North Carolina, 2011.MMWR 2011;60(51);1745-1746.
32. Chowell G, Hengartner NW, Castillo-Chavez C, Fenimore PW, and Hyman JM. The
basic reproductive number of Ebola and the effect of public health measures: the cases of Congo and Uganda. J. Theo. Biol. 2004; 229:119-126.
33. Cohen ND, O’Conner MS, Chaffin MK, and Martens RJ. Farm characteristics and
management practices associated with development of rhodococcus equi pneumonia in foals. JAVMA 2005; 226:404-407.
34. Coombs DK, Patton T, Kohler AK, Soboll G, Breathnach C, Townsend HGG and
Lunn DP. Cytokine responses to EHV-1 infection in immune and non-immune ponies. Vet. Immunol. Immunopathol. 2006; 111:109-116.
35. Corrigan, RLA, Waldner C, Epp T, Wright J, Whitehead, SM, Bangura H, Young E
and Townsend HGG. Predication of human cases of West Nile virus by equine cases, Saskatchewan, Canada, 2003. Prev. Vet. Med. 2006; 76:263-272.
36. Cowling BJ, Fang VJ, Riley S, Peiris and Leung GM. Estimation of the serial interval
of influenza. Epidemiology. 2009; 20:344-347. 37. Cox DR and Oakes D. Analysis of Survival Data. Chapman and Hall, London 1984.

130
38. Daley DJ and Gani J. Epidemic modeling: An introduction. Cambridge University Press, Cambridge, United Kingdom 1999.
39. de Jong MCM. Mathematical modeling in veterinary epidemiology: why model
building is important. Prev. Vet. Med. 1995; 25:183-193. 40. de la Rua-Domenech R, Reid SWJ, Gonzalez-Zariquiey AE, Wood JLN and Gettinby
G. Modelling the spread of a viral infection in equine populations managed in Thoroughbred racehorse training yards. Prev. Vet. Med. 1999; 47:61-77.
41. Dietz K. The estimation of the basic reproduction number for infectious diseases. Stat.
Method Med. Research 1993; 2:23-41. 42. Dwyer, DM and Groves C. Outbreak Epidemiology. In: Infectious Disease
Epidemiology: theory and practice, 2nd edition. Eds Nelson KE and Williams CFM, pp. 147-179: Jones and Bartlett, Sudbury, MA 2007.
43. Edington N, Bridges CG, and Patel JR. Endothelial cell infection and thrombosis in
paralysis caused by equid herpesvirus-1:equine stroke. Arch. Viro. 1986; 90:111-124. 44. Ferguson NM, Cumming DAT, Cauchemez S, Fraser C, Riley S, Meeyai A,
Lamsirithaworn S, and Burke DS. Strategies for containing an emerging influenza pandemic in Southeast Asia. Nature 2005; 437:448-452.
45. Fernandez, G. Data mining using SAS applications. Chapman and Hall/CRC, Boca
Raton, FL 2003. 46. Field HJ and Hill TJ. The pathogenesis of pseudorabies in mice: virus replication at
the inoculation site and axonal uptake. J. Gen. Virol. 1975; 26:145-148. 47. Field HJ, Biswas S, and Mohammad. Herpesvirus latency and therapy – From a
veterinary perspective. Antiviral Research 2006; 71:127-133. 48. Fine PEM. Herd immunity: history, theory, practice. Epidemiol. Rev. 1993; 15: 265-
302. 49. Fine PEM. The interval between successive cases of an infectious disease. Am. J.
Epidemiol. 2003; 158:1039-1047. 50. Finger R, Hughes JP, Meade BJ, Pelletier AR, and Palmer CT. Age-specific incidence
of chickenpox. Public Health Reports. 1994; 109:750-755. 51. Foote CE, Love DN, Gilkerson JR, Wellington JE, and Whalley JM. EHV-1 and
EHV-4 infection in vaccinated mares and their foals. Vet. Immunol. Immunopathol. 2006; 111:41-46.

131
52. Fox J. An R companion to applied regression. Appendix: Cox proportional-hazards regression for survival data. Sage, Thousand Oaks, CA, First edition 2002.
53. Fraser C, Riley S, Anderson RM, and Ferguson NM. Factors that make an infectious
disease outbreak controllable. Proc. Natl. Acad. Sci. USA 2004; 101:6146-6151. 54. Friday PA, Scarratt WK, Elvinger F, Timoney PJ and Bonda A. Ataxia and paresis
with equine herpesvirus type 1 infection in a herd of riding school horses. J. Vet. Intern. Med. 2000; 14:197-201.
55. Galvani AP, Lei X and Jewell NP. Severe acute respiratory syndrome: temporal
stability and geographic variation in case-fatality rates and doubling times. Emerg. Infect. Dis. 2003; 9:991-994.
56. Gani R and Leach S. Transmission potential of smallpox in contemporary populations.
Nature 2001; 414:748-751. 57. Garre B, Shebany K, Gryspeerdt, Baert K, van der Meulen K, Nauwynck H, Deprez P,
De Backer P and Croubels S. Pharmacokinetics of acyclovir after intravenous infusion of acyclovir and after oral administration of acyclovir and its prodrug valacyclovir in healthy adult horses. Antimicrob. Agents Chemother. 2007; 51:4308-4314.
58. Garre B, Baert K, Nauwynck H, Deprez P, De Backer P and Croubels S. Multiple oral
dosing of valacyclovir in horses and ponies. J. Vet. Pharmacol. Therap. 2008; 32:207-212.
59. Gilkerson JR, Whalley JM, Drummer HE, Studdert MJ, and Love DN.
Epidemiological studies of equine herpesvirus 1 (EHV-1) in thoroughbred foals: a review of studies conducted in the Hunter Valley of New South Wales between 1995 and 1997. Vet. Micro. 1999; 68:15-25.
60. Glass K, Wood JL, Mumford JA, Jesset D, and Grenfell BT. Modelling of equine
influenza 1: a stochastic model of within-yard epidemics. Epidemiol. Infect 2002; 128:491-502.
61. Glynn JR and Bradley DJ. The relationship between infecting dose and severity of
disease in reported outbreaks of salmonella infections. Epidemiol. Infect. 1992; 109:371-388.
62. Goehring LS, van Winden SC, van Maanen C and van Oldruitenborgh-Oosterbaan
MMS. Equine herpesvirus type1- associated myeloencephalopathy in the Netherlands: a four-year retrospective study (1999-2003). J. Vet. Intern. Med.2006; 20:601-607.
63. Goehring LS, Wagner B, Bigbie R, Hussey SB, Rao S, Morley PS, and Lunn DP.
Control of EHV-1 viremia and nasal shedding by commercial vaccines. Vaccine 2010; 28:5203-5211.

132
64. Goodman LB, Wagner B, Flaminio MJBF, Sussman KH, Metzger SM, Holland R and Osterrieder N. Comparison of the efficacy of inactivated combination and modified-live virus vaccines against challenge infection with neuropathogenic equine herpesvirus type 1 (EHV-1). Vaccine 2006; 24:3636-3645.
65. Goodman LB, Loregian A, Perkins GA, Nugent J, Buckles EL, Mercorelli B, Kydd
JA, Paul G, Smith KC, Osterrieder N, and Davis-Poynter N. A point mutation in a herpesvirus polymerase determines neuropathogenicity. PloS Pathog. 2007; 3:e160.
66. Greenland S. Modeling and variable selection in epidemiologic analysis. Am. J. Public
Health. 1989; 79:340-348. 67. Greenwood RES and Simson ARB. Clinical report of a paralytic syndrome affecting
stallions, mares and foals on a thoroughbred studfarm. Equine Vet. J. 1979; 12:113-117.
68. Halloran ME. Concepts of transmission dynamics In: Thomas, JC, Weber DJ (Eds),
Epidemiologic Methods for the Study of Infectious Diseases. New York, NY, Oxford University Press 2001; 56-85.
69. Hamlin MJ and Hopkins WG. Retrospective trainer-reported incidence and predictors
of health and training-related problems in standardbred racehorses. J Equine Vet. Sci. 2003; 23:443-452.
70. Hethcote HW. The mathematics of infectious diseases. SIAM Review: Society for
Industrial and Applied Mathematics 2000; 42:599-653. 71. Henley WE, Rogers K, Harkins L and Wood JLN. A comparison of survival models
for assessing risk of racehorse fatality. Prev. Vet. Med. 2006; 74:3-20. 72. Henninger RW, Reed SM, Saville WJ, Allen GP, Hass GF, Kohn CW and Sofaly C.
Outbreak of Neurologic Disease Caused by Equine Herpesvirus-1 at a University Equestrian Center. J. Vet. Intern. Med. 2007; 21:157-165.
73. Heymann DL (Ed), In: Control of Communicable Diseases Manual pp. xxix United
Book Press, Inc, Baltimore, MD. 18th edition, 2004. 74. House T and Keeling MJ. Deterministic epidemic models with explicit household
structure. Math. Biosci. 2008; 213:29-39. 75. Hurd HS and Kaneene JB. The application of simulation models and systems analysis
in epidemiology: a review. Prev. Vet. Med. 1993; 15:81-99. 76. Hussey SB, Clark R, Lunn KF, Breathnach C, Soboll G, Whalley JM and Lunn DP.
Detection and quantification of equine herpesvirus-1 viremia and nasal shedding by real-time polymerase chain reaction. J. Vet. Diagn. Invest. 2006; 18:335-342.

133
77. Hussey GS, Hussey SB, Wagner B, Horohov DW, GR Van de Walle, Osterrieder N, Goehring LS, Sangeeta R, and Lunn DP. Evaluation of immune responses following infection of ponies with a EHV-1 ORF 1/2 deletion mutant. Vet. Research. 2011, 42:23.
78. Keeling MJ and Rohani P. Modeling infectious diseases in human and animals.
Princeton NJ, Princeton University Press 2008. 79. Kenah E, Lipsitch M and Robins JM. Generation interval contraction and epidemic
data analysis. Math. Biosci. 2008; 213:71-79. 80. Kermack WO and McKendrick AG. A contribution to the mathematical theory of
epidemics. Proc. R. Soc. London B Biol. Sci. 1927; 115:700-721. 81. Kleinbaum DG. Survival analysis: A self-learning text, Springer-Verlag, New York,
1997. 82. Kohn CW, Reed SM, Sofaly CD, Henninger RW, Saville WJ, Allen GP and
Premanadan CP. Transmission of EHV-1 by horses with EHV-1 myeloencephalopathy: implications for biosecurity and review. Clinical Techniques in Equine Practice 2006; 5:60-66.
83. Koopman J. Modeling infection transmission. Annu. Rev. Public Health 2004;
25:303-326. 84. Kydd JH, Wattrang E, and Hannant D. Pre-infection frequencies of equine
herpesvirus-1 specific, cytotoxic T lymphocytes correlate with protection against abortion following experimental infection of pregnant mares. Vet. Immunol. Immunopathol. 2003; 96:207-217.
85. Kydd JH, Townsend HGG, and Hannant D. The equine immune response to equine
herpesvirus-1: The virus and its vaccines. Vet. Immunol. Immunopathol. 2006; 111:3-13.
86. Lee ET and Go OT. Survival analysis in public health research. Annu. Rev. Public
Health 1997; 18:105-134. 87. Lee ET and Wang JW. Statistical methods for survival analysis. 3rd ed., Wiley & Sons.
New York, NY, 2003. 88. Lindsey JC and Ryan LM. Tutorial in biostatistics methods for interval-censored data.
Statist. Med. 1998; 17:219-238. 89. Lunn DP, Davis-Poynter N, Flaminio MJBF, Horohov DW, Osterrieder K, Pusterla N
and Townsend HGG. Equine herpvirus-1 consensus statement. J. Vet. Intern. Med. 2009; 23:450-461.

134
90. Manual of diagnostic tests and vaccines for terrestrial animals, 2005, World Organization of Animal Health (OIE). Chapter 2.5.7. – Equine rhinopneumonitis
91. Marenzoni ML, Passamonti F, Cappelli K, Veronesi F, Capomaccio S, Verini Supplizi
A, Valente C, Autorino G and Coletti M. Clinical, serological and molecular investigations of EHV-1 and EHV-4 in 15 unweaned thoroughbred foals. Vet. Rec. 2008; 162:337-341.
92. Martin SW, Meek AH, and Willeberg P. Veterinary epidemiology. Iowa State
University Press, Ames, IA, 1987 93. Mathews JD, McCaw CT, McVernon J, McBryde ES and McCaw JM. A biological
model for influenza transmission: pandemic planning implications of asymptomatic infection and immunity. PloS ONE. 2007 Nov 28; 2(11):e1220.
94. Matumoto M, Ishizaki R, and Shimizu T. Serological survey of equine
rhinopneumonitis virus infection among horses in various countries. Arch. Ges. Virusforsch 1965; 50:609-623.
95. Maxwell LK, Bentz BG, Bourne DW. Pharmacokinetics of acyclovir in the adult
horse. J. Vet. Pharmacol. Ther. 2008; 31:312-320. 96. McCartan CG, Russell MM, Wood JLN and Mumford JA. Clinical, serological and
virological characteristics of an outbreak of paresis and neonatal foal disease due to equine herpesvirus-1 on a stud farm. Vet. Rec. 1995; 136:7-12.
97. Montgomery DC, Peck EA, Vining GG. Introduction to linear regression analysis, 3rd
ed., Wiley & Sons. New York, NY, 2001. 98. Monti GE and Frankena K. Survival analysis on aggregate data to assess time to sero-
conversion after experimental infection with bovine leukemia virus. Prev. Vet. Med. 2005; 68:241-262.
99. Murray JD. Epidemic models and the dynamics of infectious diseases. In:
Mathematical biology. pp. 610-650: Springer-Verlag, New York, Berlin, Heidelberg 1989.
100. Nelson KE. Epidemiology of infectious disease: general principles. In: Infectious
Disease Epidemiology: theory and practice, 2nd edition. Eds Nelson KE and Williams CFM, pp. 25-62: Jones and Bartlett, Sudbury, MA 2007.
101. Nugent J, Birch-Machin I, Smith KC, Mumford JA, Swann Z, Newton JR, Bowden
RJ, Allen GP, and Davis-Poynter N. Analysis of equid herpesvirus 1 strain variation reveals a point mutation of the DNA polymerase strongly associated with neuropathogenic versus nonneuropathogenic diseases outbreaks. J. Virol. 2006; 80:4047-4060.

135
102. Ostlund, EN. Dissertation. Antibody responses of horses to five major glycoproteins
of equine herpesvirus 1 and specificity of responses to antigenic domains of glycoproteins B and C. 1992.
103. Platt H, Singh H and Whitwell KE. Pathological observations on an outbreak of
paralysis in broodmares. Equine Vet. J. 1980; 12:118-126. 104. Patel JR and Heldens J. Equine herpesviruses 1 (EHV-1) and 4 (EHV-4) –
epidemiology, disease and immunoprophylaxis: A brief review. Vet. J. 2005; 170:14-23.
105. Patrozou E and Mermel, LA. Does influenza transmission occur from asymptomatic
infection or prior to symptom onset? Public Health Reports 2009; 124:193-196. 106. Perkins GA, Goodman LB, Tsujimura K, Van de Walle, G Kim SG, Dubovi EJ and
Osterrieder N. Investigation of the prevalence of neurologic equine herpes virus type 1 (EHV-1) in a 23 year retrospective analysis (1984-2007). Vet. Micro. 2009; 139:375-378.
107. Pusterla N, Mapes S, and Wilson WD. Use of viral loads in blood and nasopharyngeal
secretions for the diagnosis of EHV-1 infection in field cases. Vet. Rec. 2008; 162:728-729.
108. Pusterla N, Wilson WD, Madigan JE, and Ferraro GL. Equine herpesvirus-1
myeloencephalopathy: A review of recent developments. Vet. J. 2009a; 180:279-289. 109. Pusterla N, Wilson WD, Mapes S, Finno C, Isbell D, Arthur RM and Ferraro GL.
Characterization of viral loads, strain and state of equine herpesvirus-1 using real-time PCR in horses following natural exposure at a racetrack in California. Vet. J. 2009b; 179:230-239.
110. Pusterla N, Hussey SB, Mapes S, Johnson C, Collier JR, Hill J, Lunn DP, and Wilson
WD. Molecular Investigation of the viral kinetics of equine herpesvirus-1 in blood and nasal secretions of horses after corticosteroid-induced recrudescence of latent infection. J. Vet. Intern. Med. 2010;1-5.
111. Radke BR. A demonstration of interval-censored survival analysis. Pre. Vet. Med.
2003; 59:241-256. 112. Reingold AL. Outbreak investigations – a perspective. Emerg. Infect. Dis. 1998; 4:21-
27. 113. Roberts MG and Heesterbeek JAP. Model-consistent estimation of the basic
reproduction number from the incidence of an emerging infection. J. Math. Biol. 2007; 55:803-816.

136
114. Ruxton GD. The unequal variance t-test is an underused alternative to Student’s t-test and the Mann-Whitney U test. Behav. Ecol. 2006; 17:688-690.
115. Sacks JJ. Utilization of case definitions and laboratory reporting in the surveillance of
notifiable communicable diseases in the United States. Am. J. Public Health 1985; 75:1420-1422.
116. Satou K and Nishiura H. Basic reproduction number for equine-2 influenza virus A
(H3N8) epidemic in racehorse facilities in Japan, 1971. J Equine Vet. Sci. 2006; 26:310-316.
117. Sauerbrei W, Royston P, and Binder H. Selection of important variables and
determination of functional form for continuous predictors in multivariate model building. Statist. Med. 2007; 26:5512-5528.
118. Schulman JL and Kilbourne ED. Experimental transmission of influenza virus
infection in mice. I. Period of transmissibility. J. Exp. Med. 1963; 118:257-266. 119. Slater JD, Lunn DP, Horohov DW, Antczak DF, Babiuk L, Breathnach C, Chang Y-
W, Davis-Poynter N, Edington N, Ellis S, Foote C, Goehring L, Kohn CW, Kydd J, Matsumura T, Minke J, Morley P, Mumford J, Neubauer T, O’Callaghan DO, Osterrieder K., Reed S, Smith K, Townsend H, van der Meulen K, Whalley M and Wilson WD. Report of the equine herpesvirus-1 Havermeyer Workshop, San Gimignano, Tuscany, June 2004. Vet. Immunol. Immunopathol. 2006; 111:3-13.
120. Steele, RW. Varicella zoster in hospital personnel: skin test reactivity to monitor
susceptibility. Pediatrics 1982;70:604-608. 121. Stegeman A, Elbers ARW, Bouma A, de Smit, H, and De Jong MCM. Transmission
of classical swine fever virus within herds during the 1997-1998 epidemic in the Netherlands. Pre. Vet. Med. 1999; 42:201-218.
122. Stierstorfer B, Eichhorn W, Schmanhl W, Brandmuller C, Kaaden OR and Neubauer
A. Equine herpesvirus type 1 (EHV-1) myeloencephalopathy: a case report. J. Vet. Med. B Dis. Vet. Public Health 2002; 49:37-41.
123. Studdert MJ, Hartley CA, Dynon K, Sandy JR, Slocombe RF, Charles JA, Milne, ME,
Clarke AF and El-Hage C. Outbreak of equine herpesvirus type 1 myeloencephalitis: new insights from virus identification by PCR and the application of an EHV-1-specifc antibody detection ELISA. Vet. Rec. 2003; 153:417-423.
124. Suter RJ, McKinnon, Perkins NR and Besier RB. The effective life of invermectin on
western Australian sheep farms – A survival analysis. Prev. Vet. Med. 2005; 72:311-322.
125. Svensson Å. A note on the generation times in epidemic models. Math. Biosci. 2007;
208:300-311

137
126. Szklo M and Nieto FJ. Epidemiology: Beyond the basics. 2nd ed. 2007, Jones and
Barlett, Sudbury, MA. 127. Tildesley MJ and Keeling MJ. Is R0 a good predicator of final epidemic size: foot-and-
mouth disease in the UK. J. Theor. Biol. 2009; 258:623-629. 128. Thomson GW, McCready R, Sanford E and Gagnon A. An outbreak of herpesvirus
myeloencephalitis in vaccinated horses. Can. Vet. J. 1979; 20:22-25. 129. Thrushfield M. Veterinary Epidemiology, 3rd ed. 2007, Blackwell Science Ltd,
Oxford, UK. 130. Tomba, GS, Svensson Å, Asikainen T, Giesecke J. Some model based considerations
on observing generation times. Math. Biosci. 2010;223:24-31. 131. USDA. Equine herpes virus myeloencephalopathy: a potential emerging disease.
APHIS Info sheet. Washington DC: USDA, APHIS, Veterinary Services, Centers for Epidemiology and Animal Health, 2007.
132. vann Maanen C, Sloet van Oldruitenborgh-Oosetbaan MM, Damen EA and Derksen
AGP. Neurological disease associated with EHV-1 infection in a riding school: clinical and virological characteristics. Equine Vet. J. 2001; 33:191-196.
133. Varrasso A, Dynon K, Ficorilli N, Hartley CA, Studdert MJ, Drummer HE.
Identification of equine herpesvirus 1 and 4 by polymerase chain reaction. Aust. Vet. J. 2001; 79:563-569.
134. Vynnycky E and Fine PEM. Lifetime risks, incubation period, and serial interval of
tuberculosis. Am. J. Epidemiol. 2000; 152:247-263. 135. Vynnycky E and White RG. An introduction to infectious disease modeling, 2010,
Oxford University Press Inc., New York. 136. Wahlström H, Englund L, Carpenter T, Emanuelson U, Engvall, and Vågsholm I. A
Reed-Frost model of the spread of tuberculosis within seven Swedish extensive farmed fallow deer herds. Prev. Vet. Med. 1998; 35:181-193.
137. Wallinga J and Lipsitch M. How generation intervals shape the relationship between
growth rates and reproductive numbers. Proc. R. Soc. B. 2007; 274:599-604. 138. Welch BL. The generalization of students problem when several different populations
variances are unequal. Biometrika 1947;34:28-35. 139. White LF and Pagano M. A likelihood-based method for real-time estimation of the
serial interval and reproductive number of an epidemic. Statist. Med. 2008; 27:2999-3016.

138
140. White LF, Wallinga J, Finelli L, Reed C, Riley S, Lipsitch M, and Pagano M.
Estimation of the reproductive number and serial interval in early phase of the 2009 influenza A/H1N1 pandemic in the USA. Influenza and Other respi Viruses. 2009; 3:267-276.
141. Wood JLN, Newton JR, Chanter N and Mumford JA. Association between respiratory
disease and bacterial and viral infections in British racehorses. J. Clin. Micro. 2005; 43:120-126.
142. Yamanka T, Niwa H, Tsujomura K, Kondo T, and Matsunura T. Epidemic of Equine
Influenza among vaccinated racehorses in Japan in 2007. J. Vet. Med. Sci. 2008; 70:623-625.

139
VITA
Barry Jay Meade
The author was born in Paintsville, Kentucky on January 2, 1956. He completed his
undergraduate studies in Biology and Chemistry at Eastern Kentucky University in 1978.
Upon completion of his B.S. degree and prior to beginning graduate studies, he worked as a
research associate with the beef cattle production unit at the University of Kentucky
Coldstream Research Farm in Lexington, Kentucky. In 1983, he completed a Master of
Science in Population Genetics at Louisiana State University (LSU) with the Doctor of
Veterinary Medicine degree being conferred by the LSU School of Veterinary Medicine in
1986. From 1989 to 1992, Dr. Meade worked as a regulatory veterinarian for the United
States Department of Agriculture (USDA) in Arkansas conducting on-farm surveillance and
epidemiological investigations of selected animal diseases. In 1992, he was selected as the
USDA participant in the Centers for Disease Control and Prevention (CDC) Epidemic
Intelligence Service (EIS) training program. After completion of EIS training, he was
assigned as a Regional USDA Epidemiologist Tampa, Florida. From 1996 through 2010,
he was assigned to the USDA, Veterinary Services Area Office in Frankfort, Kentucky
where he had primary responsibility for providing technical oversight of investigations and
surveillance of communicable diseases of animals involved in production agriculture.
During 2010, Dr. Meade was a staff veterinarian in Riverdale, Maryland for the USDA,
National Import and Export (NCIE) and National Animal Health Programs (NAHPP) with
responsibilities related to equine disease issues. Currently, Dr. Meade is the Area
Veterinarian In Charge (AVIC) in North Carolina. In the fall 2005, he enrolled in the
graduate program of the Department of Veterinary Science, University of Kentucky to
pursue the degree of Doctor of Philosophy. The author is a member of the Kentucky
Veterinary Medical Association, the Kentucky Association of Equine Practitioners and the
Gamma Sigma Delta Agricultural Honor Society.

140
Professional Publications
Zhang J, Timoney PJ, Shuck KM, Powell DG, Seoul G, Young Go Y, Lu Z, Meade BJ and Balasuriya, UBR. Molecular Epidemiology and Genetic Characterization of Equine Arteritis Virus Isolates Associated with the 2006/2007 Multi-State Disease Occurrence in the USA. Published online 5/6/2010. Meade BJ, Timoney PJ, Donahue JM, Branscum AJ, Ford R, and Rowe R. Initial occurrence of Taylorella asinigenitalis and its detection in nurse mares, a stallion and donkeys in Kentucky. Prev. Vet. Med. 2010;292-296. Meade BJ and Timoney PJ. The monitoring and surveillance of equine infectious diseases. Eq. Disease Quarterly Newsletter, January 2010 Meade BJ. Observations on the practice of epidemiology in equine populations. Eq. Disease Quarterly Newsletter, January 2009 Zhang Z, Young Go Y, MacLachlan NJ, Meade BJ, Timoney PJ, Balasuriya UBR. Amino Acid substitutions in the structural or nonstructural proteins of a vaccine strain of equine arteritis virus are associated with its attenuation. Virology 2008; 378:355-362. Meade BJ. Investigating foreign animal diseases. Eq. Disease Quarterly Newsletter, January 2008 Timoney PJ, Creekmore L, Meade B, Fly D, Rogers E, and King B. 2006 Multi-state occurrence of EVA. In: Proceedings of the United States Animal Health Association. 2007; 354-362. Meade BJ. Decreasing risk – utilizing industry based standards of care. Eq. Disease Quarterly Newsletter, April 2006. Dwyer RM, Garber LP, Traub-Dargatz JL, Meade BJ, Powell DG, Pavlick MP, and Kane AJ. A case-control study of factors associated with excessive proportions of early fetal loss associated with mare reproductive loss syndrome in central Kentucky during 2001. JAVMA 2003; 222(5):613-619. Dwyer RM, Garber L, Traub-Dargatz JL, Meade BJ, Powell D, Pavlick, MP and Kane AJ. An epidemiological investigation of mare reproductive loss syndrome: breaking ground on a new disease. In: Society for Veterinary Epidemiology and Preventive Medicine, Veterinary Proceedings, Cambridge, 3-5 April 2002. Eds Menzies, F.D. and Reed S.W.J., pp. 44-47. Trock SC, Meade BJ, Glaser AL, Ostlund EN, Laniciotti RS, Cropp BC, Kulasekera V, Kramer LD, and Komar N. West Nile Virus Outbreak Among Horses in New York State, 1999 and 2000. Emerg. Infect. Dis. 2001; 7:745-747.

141
Odenweller RJ and Meade BJ. An Occurrence of a Contagious Equine Metritis - “Like” Organism in Kentucky - Investigation of a Disease Outbreak Among Nurse Mares. In: Proceedings of the United States Animal Health Association. 1998; 287-289. Meade, Barry. Residential Fires in Kentucky. Kentucky Epidemiology Notes and Reports. Vol 30, No 2, February 1995. Meade BJ, Finger RF, Sosin DM. Incidence of Haemophilus influenzae Type b Disease in Kentucky. Relationship to Immunization, 1998 Through 1993. Journal of The Kentucky Medical Association 1994, Volume 92, Number 12, 490-495. Finger RF, Hughes JP, Meade BJ, Pelletier AR, Palmer CT. Age-Specific Incidence of Chickenpox. Public Health Reports 1994, 109; 6:750-755. Meade BJ, Auslander M, Spurlock C, Finger R, and Sosin D. Farm Injuries Attributable to Animals, Kentucky. In: Proceedings EIS Annual Conference, 1994 An Outbreak of Hepatitis A Associated with Consumption of Catered Food Public Health Service -CDC-Atlanta. Epidemiology Report 93-05, November 1, 1993 Meade, Barry J. 1983. Comparative Aspects of Blood Groups for Brangus and Angus Cattle. M.S. Thesis. Louisiana State University, Baton Rouge, Louisiana. 75 pages