the trade impact of european union agricultural preferences
TRANSCRIPT
The trade impact of European Union agricultural preferences Maria Cipollina (University of Molise) and Luca Salvatici (University of Molise)
Working Paper 10/3
is a Research Project on “European Union policies, economic and trade integration processes and WTO negotiations” financed by the Italian Ministry of Education, University and Research (Scientific Research Programs of National Relevance, 2007).
Information about the project, the partners involved and its outputs can be found at
http://www.ecostat.unical.it/anania/PUE&PIEC.htm.
The trade impact of European Union agricultural preferences1
MARIA CIPOLLINA
and
LUCA SALVATICI
University of Molise, Department of Economics, Management and Social Sciences, via De Sanctis,
86100 Campobasso, Italy
E-mail:[email protected]
Abstract
We assess the impact on agricultural trade of European Union (EU) trade policies, using a gravity
model based on disaggregated trade flows from 161 developing countries (DCs) to 15 EU member
countries. We use a sample selection framework to account for potential selection bias of positive
trade flows and provide an explicit measure for relative preference margins. From a policy
perspective, our results debunk some of the most widespread criticisms of preferential policies: EU
preferences matter and have a positive impact on DCs agricultural exports at both the extensive and
intensive margins, although with significant differences across sectors.
Keywords: Preferential Trade Policy; Agricultural Trade; Gravity Model; European Trade Policy.
JEL classification: F13, Q17, F14
* We acknowledge financial support from the ‘Agricultural Trade Agreements (TRADEAG)’ (Specific Targeted Research Project, Contract no. 513666) and ‘New Issues in Agricultural, Food and Bio-energy Trade (AGFOODTRADE)’ (Small and Medium-scale Focused Research Project, Grant Agreement no. 212036) research projects funded by the European Commission. The views expressed in this paper and do not necessarily reflect those of the European Commission. We thank the anonymous referee, the discussant Davide Castellani, and participants in the International Workshop on Firm and Product Heterogeneity in International Trade, organized by the Research Network on Globalization and the International Network for Economic Research.
1
1. Introduction
This work analyses the impact on trade of European Union (EU) tariff preferences in the
agricultural sector. The EU’s preferential treatment includes reduction or, in many cases,
elimination of tariff barriers on imports from developing countries (DCs). The role of the
agricultural sector is crucial in most DCS economies. According to the World Development Report
2008 (World Bank 2008), in most sub-Saharan African countries this sector employs 65% of the
labour force and generates 32% of gross domestic product (GDP) growth. In transforming
countries, such as China, India, and Morocco, agriculture contributes on average only 7% to GDP
growth, but lagging rural incomes are a major source of political tensions. In urbanized countries,
mainly in Latin America and the Caribbean and Eastern Europe and Central Asia, agriculture
contributes just 5% of GDP growth on average; however, rural areas are still home to 45% of the
poor, and agribusiness and food services account for as much as one third of GDP. The EU,
notwithstanding its high market protection, is the world’s biggest importer accounting for roughly
20% of world imports. It has implemented several preferential regimes in order to promote the
economic development and integration of DCs in the world economy, and exports from DCs
represent around 60% of total EU agricultural imports.
The Generalized System of Preferences (GSP) and other non-reciprocal preferential regimes, rely
on the concept of “Trade as Aid”. Since the 1970s, Trade as Aid has been thought to be an effective
way to promote development. Some critics claim that non-reciprocal preferences have perverse
effects (Borchert, 2009); while others criticize preferential trade policies as being ineffective. It has
been suggested that preferences are not effective due to their limited scope and because they
2
exclude goods that are important for DCs economies; that many unilateral agreements are
temporary and introduce an element of uncertainty which is unfavourable to investment and the
creation of long-term trade flows; that the administrative costs of proving eligibility for preference
negate some of the margins, while rules of origin limit the benefits (Panagariya, 2002). These
claims are supported by the fact that preferential tariffs have not generated significant trade flows
(Brenton and Ikezuki, 2005). However, econometric results are ambiguous, and there is some
evidence that preferences do have significant positive effects on growth (Romalis, 2003): in Section
2.3, we provide a brief review of the studies dealing with EU policies.
In the rest of the paper, we assess the impact of EU agricultural preferences in terms of trade flows,
including traditional non-reciprocal agreements as well as the preferential access also granted to
developing countries under bilateral reciprocal arrangements (Section 2). Following Anderson and
van Wincoop (2004), we derive a theoretically grounded gravity equation in which the trade cost
factor depends on bilateral distances, tariffs and preferential margins (Section 3.1). Most empirical
analyses use gravity models with aggregated data, but using aggregate trade flows to analyse the
effects of trade preferences applied at product level seems misleading. This paper contributes to the
research that attempts to assess the various determinants of bilateral trade at sectoral level, based on
highly disaggregated data (Baldwin et al., 2005; de Frahan and Vancauteren, 2006; Cardamone,
2008; Chevassus-Lozza et al., 2008; Disdier et al., 2008; Olper and Raimondi, 2008; Emlinger et
al., 2008).
From a policy perspective, we aim to provide an assessment of the effectiveness of EU preferential
trade policies in generating trade from DCs. That is, the aim is not to investigate whether
preferences are damaging to recipient countries, to other (excluded) developing countries, or to the
multilateral trading system itself, but to verify the claims that preferences have no impact because
they have not helped the recipients to either gain market share or diversify their exports. Moreover,
based on product level results, we highlight in which sectors more generous preferences may boost
trade, and where preference erosion may have the largest impact .
3
Methodologically, the paper makes three main contributions. The first is a more refined measure for
trade preferences compared to the binary variables commonly used in the literature. In particular,
we measure preference margins in relative rather than absolute terms and our definitions focus on
actual preferences with respect to possible competitors, rather than measuring theoretical margins
with respect to “bound” Most Favoured Nation (MFN) tariffs (i.e., the ceiling set by the World
Trade Organization (WTO) commitments). Thus, we avoid possible overestimation of the
competitive advantages enjoyed by exporting countries, although the impact of prohibitive tariffs is
underestimated since we consider only actual not potential exporters.
The second contribution of the paper is to provide a micro-level assessment of the impact of trade
preferences on the intensive and the extensive margins of trade. We estimate this impact by
modelling bilateral EU imports at the Harmonized System 6-digit level (HS6), allowing for
heterogeneous trade costs and substitution elasticities across industries. The use of disaggregated
data raises two problems: (i) the impossibility, for some variables, to obtain information at the level
of detail at which tariff lines are specified; (ii) the large percentage of ‘zero trade flows’, which
introduces obvious problems in the log-linear form of the gravity equation. In terms of (i), in order
to control for unobservable country and product heterogeneity, we introduce exporter, importer, and
product-specific fixed effects. We address the issue of zero flows by adopting the Heckman (1979)
sample selection model (Section 3.2). This approach allows us to assess the impact of preferences
on both numbers of bilateral trade flows (extensive margin) and quantities traded (intensive
margin).
The third contribution of the paper is to assess the impact of the preference margins taking into
account what is the share of preferential flows on total imports. Although we do not know the
utilization rates of different schemes, the use of the available information on actual preferential
trade flows allows us to provide improved estimates of the impact of trade preferences on EU
agricultural imports from DCs (Section 3.3).
4
Our findings point to a significant, but heterogeneous impact of EU trade policy on DCs
agricultural exports. The preferential regimes have positive impacts on both the extensive and
intensive margins, although increased probability of trade is modest and increases in the intensity of
trade vary widely across sectors (Section 4). These differences confirm the importance of studying
their impact based on detailed and explicit measures for the preference margins. Section 5 discusses
the implications of our results and draws some conclusions.
2. EU Preferential Trade Policies
2.1. EU agricultural imports
DCs agricultural exports include a wide range of goods (87% of the possible total number, i.e. 689)
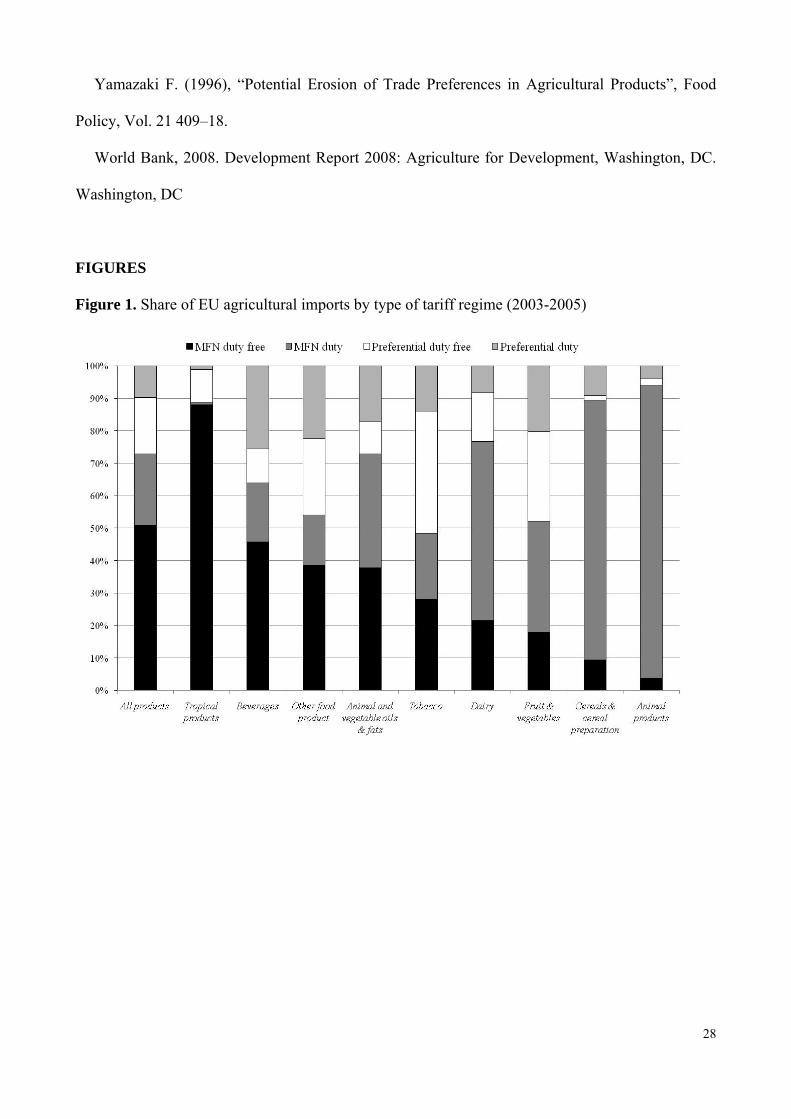
and a share of around 60% of total EU agricultural imports. Figure 1 shows shares of EU
agricultural imports from DCs according to tariff regime typologies. Almost half of agricultural
products enter duty-free under MFN arrangements, but the share of animal products, cereals and
vegetables in MFN duty-free imports is much lower; of the imports that incur MFN duty, around
30% benefit from positive preference margins.
Figure 1 also shows the size of the differences across commodity groups: the share of preferential
imports ranges from 6% for animal products, to almost 52% (mostly duty-free) in the case of
tobacco. Fruit and vegetables (48%) and other food products (46%) make up a large share of
preferential imports, while only slightly more than 10% of total flows of cereals and tropical
products are preferential. However, in the case of tropical products, most (88%) imports are duty
free, while cereals and animal product imports generally incur positive MFN duties.
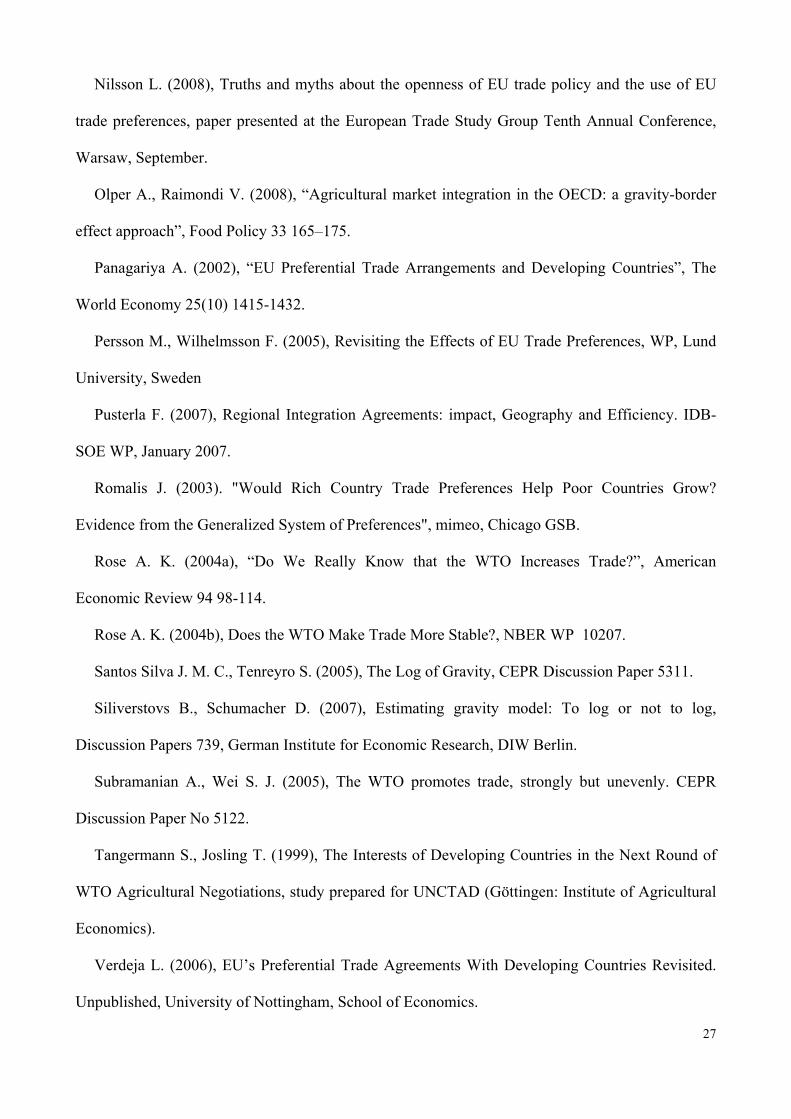
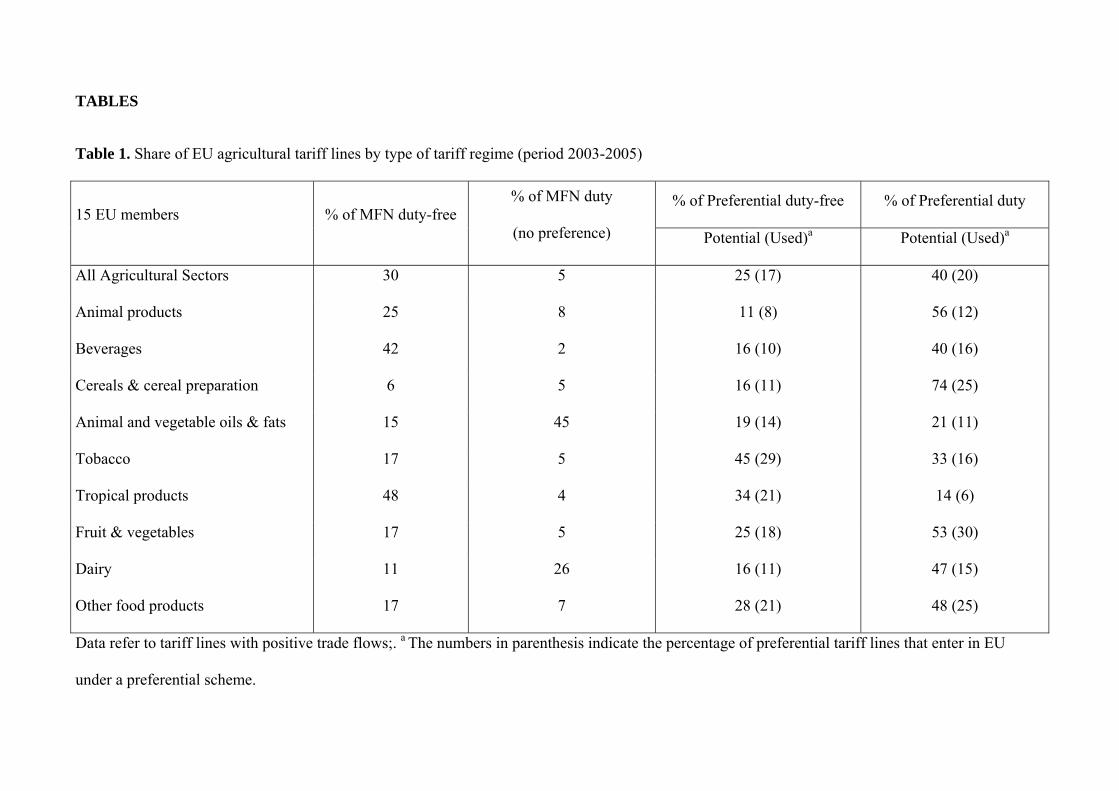
Table 1 presents the percentage of tariff lines associated with positive trade, subject to MFN or
preferential duties: in both cases, we distinguish between duty free (columns 1 and 3) and positive
tariffs (columns 2 and 4). To give an idea of utilization rates, we compute the percentage of tariff
lines where some preferential imports are registered (in parenthesis in columns 3 and 4).
Considering the total number of preferential tariff lines (duty-free and with positive duty), more
5
than 60% of tariff lines could (potentially) benefit from preferential treatment, but preferences are
applied in only half of these cases.
The share of preferential tariff lines is especially low in the case of animal products, dairy and
beverages. If we compare the percentages in Table 1 with those in Figure 1, we can see that the
share of preferential trade is significantly lower than the share of preferential tariff lines, and this
holds even if we limit the comparison to the preferences actually used.
2.2. Major EU preferential schemes
The EU is part of a web of preferential trade relations with other countries and regional groupings,
ranging from the traditional GSP to the Everything But Arms (EBA) initiative for the Least
Developed Countries (LDCs), the Lomé/Cotonou agreements with the Africa-Caribbean-Pacific
(ACP) countries, and the Bilateral Euro-Mediterranean Association Agreements (Bureau et al.,
2004; Gallezot, 2005).
In this brief review, we focus on EU preferential schemes granted in the period 2003-2005. The EU
GSP scheme includes three main categories of benefits: the General Scheme introduced in 1971,
which offers imports from DCs, access to EU markets at low or zero tariffs; the EBA initiative,
which grants to the LDCs duty-free access for all products except arms and munitions; and the
‘GSP-plus’, which provides tariff reductions and exemptions to DCs that implement international
conventions on human and labour rights, environmental protection, drug abuse and good
governance. In 2004, the percentage of agro-food tariff lines covered by the GSP, EBA and GSP-
plus were 45%, 68% and 99%, respectively (De Maria et al., 2008).
The regular GSP covers around 7,000 tariff lines. Products are classified into two groups according
to the depth of the tariff cuts: non-sensitive products (3,300), which receive duty-free market
access, and sensitive products (3,700) (including most agricultural products), which benefit from a
flat rate reduction of 3.5 percentage points. The EBA considerably improved the extent of
preferential market access granted to LDCs and, in 2002, duty-free access with no restrictions on
6
quantity was extended to all products except bananas, which have only been allowed since 2006,
and rice and sugar where tariffs have been reduced gradually, to zero in 2009.
The Cotonou Agreement between the EU and 79 ACP countries came into force in April 2003 and
replaced the previous Lomé Conventions, the first of which dated back to 1975. Under the Cotonou
Agreement’s trade pillar, ACP countries benefit from non-reciprocal trade preferences, which apply
to 99% of industrial goods and most agricultural products (special protocols were introduced for
bananas, beef and sugar): tropical products which do not compete with European products enter the
EU market duty free; temperate products are subject to an exemption or reduction in customs duty,
but are subject to strict quotas, with fruit and vegetables subject to seasonal restrictions; other
agricultural products are subject to quantity restrictions or are excluded from preferential treatment
(Nilsson, 2008). In 2008, the unilateral preferences under the Cotonou Agreement were replaced by
WTO-compatible, reciprocal full or interim EU Partnership Agreements, which progressively
removed the barriers to trade and enhanced cooperation in all areas related to trade.
The EU has privileged relationships with its neighbouring countries, including 10 Mediterranean
countries. The central element in European Neighbourhood Policy is the bilateral arrangements with
each partner. The Euro-Mediterranean partnership was launched at the 1995 Barcelona Conference
and foresaw a free trade area by 2010. The Bilateral Euro-Mediterranean Association Agreements
are a first step in this direction. The EU has signed Association Agreements with Algeria, Egypt,
Israel, Jordan, Lebanon, Morocco and Tunisia, while an interim Association Agreement governs
relations between the EU and the Occupied Palestinian territory. These agreements allow for non-
reciprocal, free access for non-sensitive products into the EU market, and progressive liberalization
for other products.
In Table 2, the preference factor ( ijkpref1 ) is computed in relative terms, as the ratio of the
maximum duty factor (1 + maxjk ) actually applied by the importer j (i.e., EU member) to all
possible exporters of product k, and the duty (1+ ijk ) incurred by a specific exporter i:
7
)1(
)1()1(
ijk
maxjk
ijkpref
(1).
Accordingly, the preference factor can increase, either because the exporter i benefits from a lower
tariff (i), or because a higher duty is imposed on other exporters (max
). It should be emphasized
that in the case of overlapping preference schemes, the applied preferential rate considered is the
lowest available to each exporter: this may lead to an overestimation of the preferential margins,
since Bureau et al. (2007) show that some preferential regimes are systematically preferred to
others.
Looking at the relative preferential factors (Table 2), the overall simple average is 1.14 with large
differences across sectors. In addition to animal products, which stand out, with a relative
preferential factor equal to 1.73, the next most preferred sectors appear to be food products, dairy
and cereals. If we compare columns 2 and 3, it appears that, notwithstanding the preferences, these
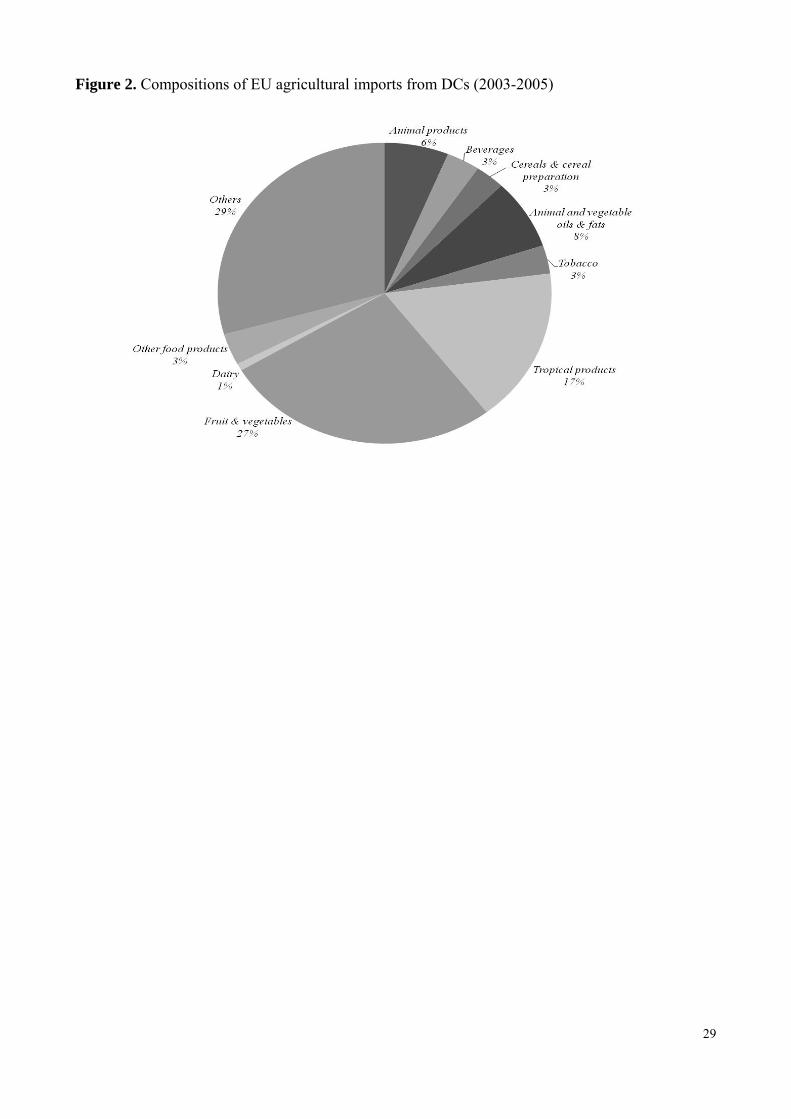
are the most protected EU agricultural sectors. However, it should be noted that fruit and
vegetables, and tropical products account for the largest shares of imports (respectively 27% and
17%: see Figure 2) although their respective relative preferential factors are among the lowest,
together with beverages, oils and fats. Moreover, it is worth recalling that simple averages imply the
same weight for each tariff line regardless of the importance of the product to which the preference
and the protection is granted.
Table 2 presents evidence on preference values, based on Candau and Jean (2005). Under
simplifying assumptions, such as constant world prices, the value of the preference rent for any
sector s can be computed as follows:
k i
ikijkjks ImpprefV )( max (2).
where prefImpik refers to EU preferential imports of product k from partner i. Note that the value of
the tariff preference is composed of: (i) the rent earned on the volume of exports prior to the
preference; (ii) the rent earned on the additional exports as a result of the preferences. In the
8
following, our estimates of the impact of the preferences on trade shed some light on the relevance
of these two components.
The calculation of Equation (2) is likely to provide an upper bound estimate, since the assumption is
that none of the rent is included in the export price. The value of EU agricultural preferences is
equal to €1,350 million. This is a crude approximation. First, the assumption that there are no
supply constraints is rather simplistic, since a change in the EU trade policy regime is likely to exert
upward pressure on world prices, which would tend to counterbalance, to some extent, the decrease
in prices due to preference margins. Moreover, the extent of rent extraction by an exporter is likely
to depend on the exporter’s bargaining power vis-à-vis the importer. Nevertheless, this
approximately allows the magnitude of the preferences to be compared across sectors. The rent for
the fruit and vegetables sector alone amounts to almost half of the overall value, which is not
surprising given the importance of this sector, but the connection between rent value and trade flow
intensity generally is irregular.
2.3. Literature review
It is not easy to summarize the results from the large literature on the impact of trade preferences.
Estimates vary due to the fact that different analyses and estimations use different data sets, sample
sizes and independent variables. However, the expectation of a positive impact of preferences on
trade is largely confirmed. With regard to the estimated coefficients of the impact of preferences,
Nielsen (2003) and Cardamone (2007) provide comprehensive surveys of the estimated impact of
preferential trade agreements, and many studies focus specifically on EU policies (Nilsson, 2002;
Persson and Wilhelmsson, 2005; Verdeja, 2006).
The impact of the EU GSP scheme is difficult to define since estimates of the dummy coefficient
range between 4% and 136% (Nilsson, 2002; Rose, 2004a; Persson and Wilhelmsson, 2005;
Verdeja, 2006), and some studies even find highly significant negative coefficients (Nilsson, 2002;
Rose, 2004b; Subramanian and Wei, 2005). In terms of the results for different sectors,
Subramanian and Wei (2005) report positive estimates only for the clothing industry, and negative
9
estimates for the footwear and food sectors. Several studies (Nilsson, 2005; Persson and
Wilhelmsson, 2005; Agostino et al., 2007) find that the EBA initiative provides a significant boost
to LDCs exports and positive results have been obtained for the ACP countries (Nilsson, 2005;
Persson and Wilhelmsson, 2005; Verdeja, 2006), and the Euro-Mediterranean agreements
(Amurgo-Pacheco, 2006; García-Alvarez-Coque and Martì-Selva, 2006; Pusterla, 2007). Some
authors focus on specific products and/or exporters, using highly disaggregated data: here we
highlight some recent studies focusing on EU imports of fruit and vegetables, carried out by
Cardamone (2008) and Emlinger et al. (2008).
There is a large group of studies that try to quantify the benefits that receiving countries draw from
trade preferences (Alexandraki and Lankes, 2004; Bouët et al., 2005; Dean and Wainio, 2006).
Yamazaki (1996) finds that, at world level, the value of preference margins represents 12% of the
total value of preferential exports, 73% of which is accounted for by EU preferential schemes.
Tangermann and Josling (1999) find that, in terms of the percentage of exports (to the EU), the
value of preferences is highest for beef and sugar and lowest for cereals and fresh fruit. Candau and
Jean (2005) claim that EU tariff preferences are important to a number of DCs, especially those in
sub-Saharan Africa: for all country groups except the GSP-only countries, they represent a
significant proportion of the value of dutiable exports to the EU (up to 10% for the sub-Saharan
African and LDCs).
Although EU preferences might be considered rather generous, they are accompanied by complex
rules relating to origin, which are seen as a major obstacle for exporters of processed goods. Thus,
their rate of utilization has attracted substantial research (Gallezot and Bureau, 2004; Anson et al.,
2005; Estevadeordal and Suominen, 2005). It is largely acknowledged that in sectors characterized
by restrictive non-tariff barriers (quotas, administrative burdens, sanitary and phytosanitary
regulations) generous preferences do not seem to be important in increasing trade (Bureau et al.,
2004; Desta, 2008; Iimi, 2007). If we examine each agreement separately, we can see that the rates
of utilization are quite low. However, it has also been pointed out that DCs exports are often
10
eligible for more than one preference scheme, and not all can be exploited at the same time (Bureau
et al., 2004, 2007). We should mention here the study by Manchin (2005), which has several
methodological features in common with the present work (highly detailed trade data, explicit
preference margins, and the Heckman two-step procedure), but a different focus, namely the
determinants of ACP preference utilization, and a different definition of preference margin.
3. Econometric model
3.1. Specification
We start from a standard constant elasticity of substitution (CES), monopolistic competition model
following Lai and Trefler (2002) and Lai and Zhu (2004). A trade separable model, in which
allocation of the value of production and expenditure in country j for product class k, is separable
from the bilateral allocation of trade across countries (Armington assumption), allows us to
determine bilateral trade in a conditional general equilibrium, where the product markets for each
good produced in each country, are conditional on the observed output structure and expenditure
allocations.
Following Anderson and van Wincoop (2004) we derive our gravity equation including many
commodity classes of goods (denoted by k where k=1,2….K) flowing between each country i and j:
k
jkik
ijk
wk
jkikijk
PP
T
Y
EYm
1
(3)
where mijk is the nominal demand for commodity k of country i by country j; Yik is the production of
commodity k for country i; Ejk is the country j’s expenditure for product k; Ywk is world production
of product k; Tijk is the trade cost; Pik and Pjk are multilateral price indexes, and σk > 1 is the
elasticity of substitution among all varieties, from different exporters.
There are three main approaches to multilateral price terms: (1) use of published data on price
indexes (Bergstrand, 1985, 1989; Baier and Bergstrand, 2001); (2) direct estimation à la Anderson
and van Wincoop (2003); (3) use of country fixed effects (Eaton and Kortum, 2002; Feenstra,
2002). The main weakness of the first method is that existing price indexes may not reflect true
11
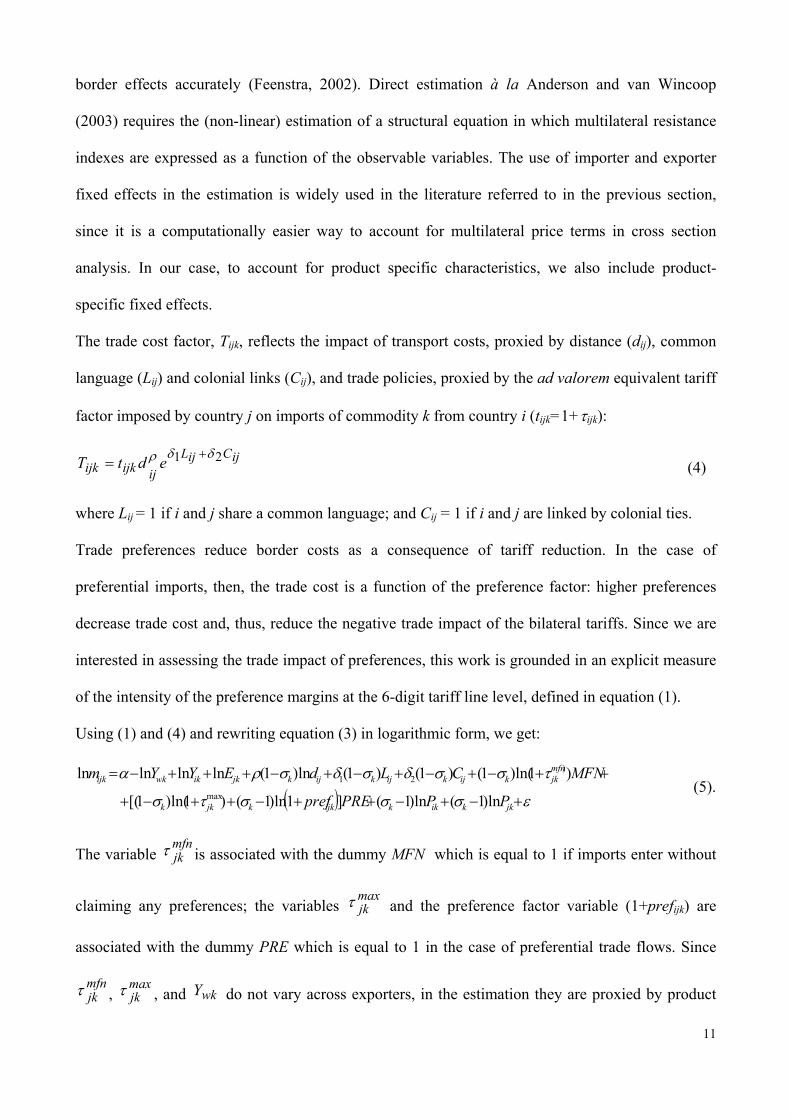
border effects accurately (Feenstra, 2002). Direct estimation à la Anderson and van Wincoop
(2003) requires the (non-linear) estimation of a structural equation in which multilateral resistance
indexes are expressed as a function of the observable variables. The use of importer and exporter
fixed effects in the estimation is widely used in the literature referred to in the previous section,
since it is a computationally easier way to account for multilateral price terms in cross section
analysis. In our case, to account for product specific characteristics, we also include product-
specific fixed effects.
The trade cost factor, Tijk, reflects the impact of transport costs, proxied by distance (dij), common
language (Lij) and colonial links (Cij), and trade policies, proxied by the ad valorem equivalent tariff
factor imposed by country j on imports of commodity k from country i (tijk=1+ijk):
ijCijL
ijijkijk edtT 21 (4)
where Lij = 1 if i and j share a common language; and Cij = 1 if i and j are linked by colonial ties.
Trade preferences reduce border costs as a consequence of tariff reduction. In the case of
preferential imports, then, the trade cost is a function of the preference factor: higher preferences
decrease trade cost and, thus, reduce the negative trade impact of the bilateral tariffs. Since we are
interested in assessing the trade impact of preferences, this work is grounded in an explicit measure
of the intensity of the preference margins at the 6-digit tariff line level, defined in equation (1).
Using (1) and (4) and rewriting equation (3) in logarithmic form, we get:
jkkikkijkkjkk
mfnjkkijkijkijkjkikwkijk
PPPREpref
MFNCLdEYYm
ln)1(ln)1(]1ln)1()1ln()1[(
)1ln()1()1()1(ln)1(lnlnlnlnmax
)21
(5).
The variable mfnjk is associated with the dummy MFN which is equal to 1 if imports enter without
claiming any preferences; the variables maxjk and the preference factor variable (1+prefijk) are
associated with the dummy PRE which is equal to 1 in the case of preferential trade flows. Since
mfnjk ,
maxjk , and wkY do not vary across exporters, in the estimation they are proxied by product
12
fixed effects. Similarly, the estimated dummies for exporter and importer replace Yik and Ejk in
equation (5).
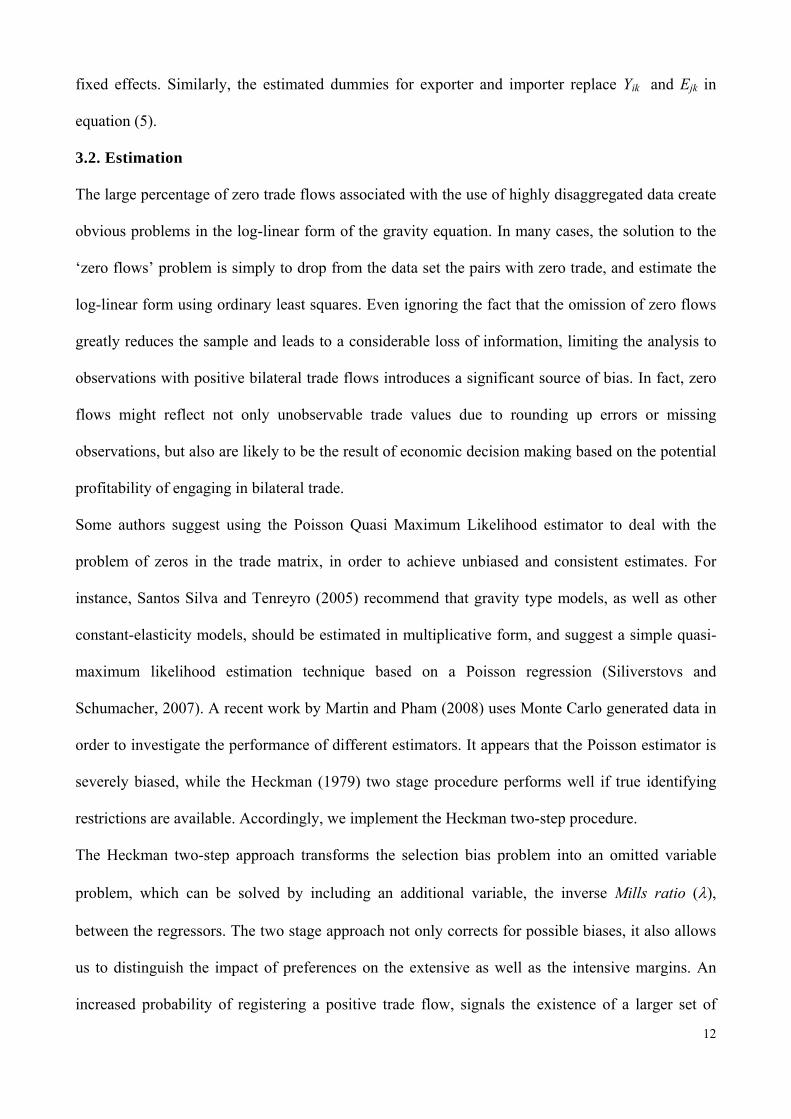
3.2. Estimation
The large percentage of zero trade flows associated with the use of highly disaggregated data create
obvious problems in the log-linear form of the gravity equation. In many cases, the solution to the
‘zero flows’ problem is simply to drop from the data set the pairs with zero trade, and estimate the
log-linear form using ordinary least squares. Even ignoring the fact that the omission of zero flows
greatly reduces the sample and leads to a considerable loss of information, limiting the analysis to
observations with positive bilateral trade flows introduces a significant source of bias. In fact, zero
flows might reflect not only unobservable trade values due to rounding up errors or missing
observations, but also are likely to be the result of economic decision making based on the potential
profitability of engaging in bilateral trade.
Some authors suggest using the Poisson Quasi Maximum Likelihood estimator to deal with the
problem of zeros in the trade matrix, in order to achieve unbiased and consistent estimates. For
instance, Santos Silva and Tenreyro (2005) recommend that gravity type models, as well as other
constant-elasticity models, should be estimated in multiplicative form, and suggest a simple quasi-
maximum likelihood estimation technique based on a Poisson regression (Siliverstovs and
Schumacher, 2007). A recent work by Martin and Pham (2008) uses Monte Carlo generated data in
order to investigate the performance of different estimators. It appears that the Poisson estimator is
severely biased, while the Heckman (1979) two stage procedure performs well if true identifying
restrictions are available. Accordingly, we implement the Heckman two-step procedure.
The Heckman two-step approach transforms the selection bias problem into an omitted variable
problem, which can be solved by including an additional variable, the inverse Mills ratio (),
between the regressors. The two stage approach not only corrects for possible biases, it also allows
us to distinguish the impact of preferences on the extensive as well as the intensive margins. An
increased probability of registering a positive trade flow, signals the existence of a larger set of
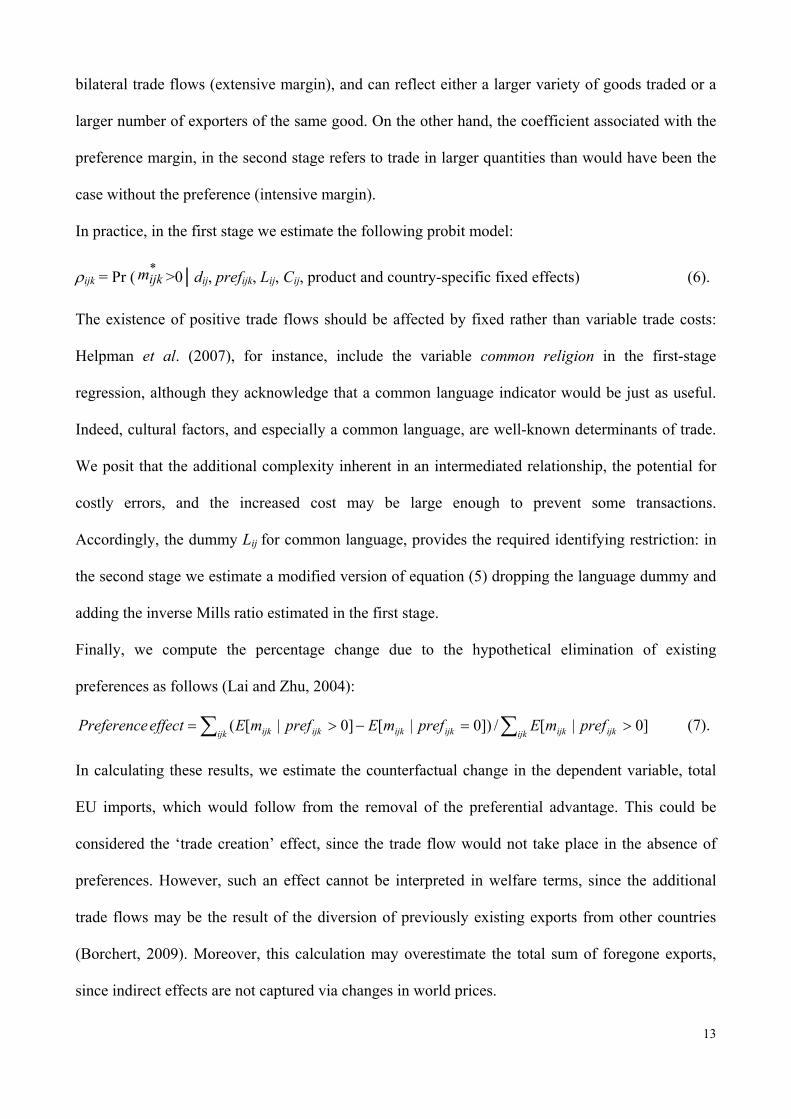
13
bilateral trade flows (extensive margin), and can reflect either a larger variety of goods traded or a
larger number of exporters of the same good. On the other hand, the coefficient associated with the
preference margin, in the second stage refers to trade in larger quantities than would have been the
case without the preference (intensive margin).
In practice, in the first stage we estimate the following probit model:
ijk = Pr (*ijkm >0│dij, prefijk, Lij, Cij, product and country-specific fixed effects) (6).
The existence of positive trade flows should be affected by fixed rather than variable trade costs:
Helpman et al. (2007), for instance, include the variable common religion in the first-stage
regression, although they acknowledge that a common language indicator would be just as useful.
Indeed, cultural factors, and especially a common language, are well-known determinants of trade.
We posit that the additional complexity inherent in an intermediated relationship, the potential for
costly errors, and the increased cost may be large enough to prevent some transactions.
Accordingly, the dummy Lij for common language, provides the required identifying restriction: in
the second stage we estimate a modified version of equation (5) dropping the language dummy and
adding the inverse Mills ratio estimated in the first stage.
Finally, we compute the percentage change due to the hypothetical elimination of existing
preferences as follows (Lai and Zhu, 2004):
ijk ijkijkijkijkijk ijkijk prefmEprefmEprefmEeffect Preference ]0|[/])0|[]0|[( (7).
In calculating these results, we estimate the counterfactual change in the dependent variable, total
EU imports, which would follow from the removal of the preferential advantage. This could be
considered the ‘trade creation’ effect, since the trade flow would not take place in the absence of
preferences. However, such an effect cannot be interpreted in welfare terms, since the additional
trade flows may be the result of the diversion of previously existing exports from other countries
(Borchert, 2009). Moreover, this calculation may overestimate the total sum of foregone exports,
since indirect effects are not captured via changes in world prices.
14
3.3 Data
We estimate cross-sectional models, covering imports of 689 agricultural commodities based on the
WTO definition, from 161 DCs, to 15 ‘old’ EU member countries. The number of observations is
476,105 rather than 1,663,935 (15 importers*161 exporters*689 products) since products that are
never exported, either to the EU15 or to any other country, are dropped from the sample. Data on
trade at the HS6 level of detail are taken from the Eurostat Comext database
(http://fd.comext.eurostat.cec.eu.int/xtweb/); data on tariffs are from the MAcMapHS6-V2 database
(http://www.cepii.fr/). MAcMap provides a consistent worldwide assessment of protection,
including ad valorem equivalent rates of specific duties and tariff rate quotas (including those
introduced at the end of the Uruguay Round), for 2004, at the HS6 level (Boumelassa et al., 2009).
The Comext database does not provide information on the utilization of each preference scheme.
However, it distinguishes preferential and non-preferential (MFN) trade. Using the information on
preferential trade flows, the level of duty (ijk) used for the computation of the preference margins is
equal to the MFN (applied) tariff if the preference is not used, and to the preferential (bilateral)
tariff otherwise. Accordingly, our estimation will take account of the volume of trade benefiting
from the preferences, and avoid overestimation of the preference impact that can arise from the
association between a positive preference and a trade flow that does not exploit it.
In order to reduce the impact of bilateral trade flow volatility, we take average trade values for the
period 2003-2005. This choice would be questionable if preferential and MFN trade were hit by
idiosyncratic shocks, but given that changes in total and preferential trade values are strictly
correlated in our database, we assume that any year-specific exogenous shocks will have similar
impacts on both sets of values.
Comext trade values are cif (cost, insurance and freight) values, which raises some problems in
terms of their consistency, since they will be correlated with the error term (Cardamone, 2007;
Pusterla, 2007). We convert trade values to fob (free on board) values using a similar approach to
that implemented by the International Monetary Fund (IMF) (see Direction of Trade Statistics
15
database: http://www.imfstatistics.org/DOT/). Since the MAcMap database includes both cif and
fob trade flows, we compute cif/fob ratios (at the HS6 level) and obtain fob values by dividing the
Comext trade figures by these ratios.
The MAcMap dataset displays 3,425 tariff rate quotas (TRQ) trade flows corresponding to around
12% of total EU agricultural imports from DCs. Depending on the fill rate level, there are three
possible market regimes: if the fill rate is less than 90%, the quota is not binding and the marginal
tariff used is the in-quota tariff; in the range 90%-98%, the quota is binding and the marginal tariff
is the simple average of the in-quota and out-of-quota tariffs; if fill rate is higher than 98%, the
marginal tariff is equal to the out-of-quota tariff (Boumelassa et al., 2009). In the last case, we split
the tariff line into two observations in order to account for the different margins.
Data for the remaining explanatory variables are from the Cepii dataset, which includes distances
between countries and two sets of dummies for –a common language, and former colonial links. We
run separate regressions for nine commodity groups defined according to the WTO Multilateral
Trade Negotiations categories: these groups cover more than two-thirds of EU agricultural imports
from DCs. The choice to run separate regressions is quite common in studies estimating gravity
equations at sectoral level (Baldwin et al., 2005; Lai and Trefler, 2002), and seems appropriate,
since we find evidence of significant differences in substitution elasticities across industries (Lai
and Trefler, 2002).
Several categories – such as, chemicals, flowers, skins, animal feedstuffs, and miscellaneous
products – do not benefit from preferences: these products account for almost 26% of EU
agricultural imports from DCs. Also, we do not present the results for sugar: preferences in this
sector differ markedly from regular preferences since they give to certain countries (mostly ACP)
the possibility to benefit from domestic support prices, up to agreed quantities, and it is difficult to
estimate the impact on trade flows given the existence of import quotas. Note, also, that although
quotas were in place for banana and beef preferences, unlike the case of sugar, in neither of these
cases were the quotas binding in 2004.
16
4. Results
Table 3 presents the results for total EU agricultural imports and the impact of preferences on trade;
Tables 4-6 present the results by commodity groups. These partial regressions provide interesting
insights, and can be considered to be robustness checks based on the sample split. It should be
recalled that all regressions are based on detailed data at the HS-6 product level.
Regarding the estimates based on preferences: in the first stage, this is the impact on the probability
of registering a positive trade flow; in the second stage, it can be interpreted as a measure of the
responsiveness of trade flows to the intensity of the relative preferential margins (defined as the
ratio of the maximum applied duty factor by importer j across all exporters on product k, and the
duty incurred by a specific exporter i). The first stage allows us to estimate the impact of
preferential policies on the extensive margin, i.e., the share of positive agricultural trade flows
originating from DCs, over the total number of possible bilateral trade flows. The second stage
quantifies the extent to which trade preferences have increased the volume of DCs exports.
The results in Table 3 confirm that preferential access leads to a significant expansion in trade
between the EU and DCs, in terms of both the extensive and the intensive margins. In the first
stage, all control variable estimates show the expected signs. The negative impact of distance, our
proxy for transport costs, on the probability of exporting a larger set of products is more than
compensated for by the existence of a common language and the presence of colonial links.
The estimated coefficient of 0.06 implies that a 10% increase in the relative preference factor –
roughly corresponding to an average reduction of 10 percentage points in the bilateral applied tariffs
at the estimation point – increases the probability of registering a positive trade flow (i.e., the
extensive margin) by 6%. This change may not be dramatic, but the positive (and highly significant)
sign contradicts the received wisdom that due to preferential policies, exporting countries specialize
in a small number of products which may not coincide with their true comparative advantages and
which are characterized by low value added. Although we cannot draw any conclusions about
eventual welfare impacts related to comparative advantages and value added, our results show that
17
the number of products exported by a given number of countries, or the number of countries
exporting a given number of products, is likely to increase as a consequence of EU preferential
policies.
In the second stage, the positive and significant coefficient of the Mills ratio confirms that
correcting for sample selection bias is justified. The estimates for distance and colonial links have
the expected signs, although the coefficients are larger than the values reported in most previous
studies. It should be remembered, that few gravity models using industry or product level data tend
to provide higher distance effects values than estimations using aggregated data (Disdier and Head,
2008). The reason for this strong response is that the reduced form coefficients in equation (5)
subsume the impact of the substitution elasticity . We next focus on the main variable of interest in
this study - with an estimated coefficient of around 3, preferential imports respond more than
proportionally to variations in preferential tariff rates. The estimated preference effect (computed
according to equation (7)) is over 2%, which means that the absence of preference would reduce
bilateral trade volumes between DCs and the 15 EU member countries by €1,358 million. This is
not a trivial figure, and is larger than the value of the preference rent itself (see Table 2). On the
other hand, it is only a small share (around 8%) of the value of preferential exports to the EU. This
means that hypothetically, the removal of the preferences would not affect the vast majority of
current flows.
The estimated coefficient implies a substitution elasticity across all commodities, 1ˆˆ kk ,
equal to 3.75. This value is within the ranges in the literature: notwithstanding different
methodologies, estimation techniques and levels of aggregation, we can say that based on previous
studies there is a ‘consensus range’ which includes values of of between 3 and 11 (Baier and
Bergstrand, 2001; Eaton and Kortum, 2002; Lai and Trefler, 2004; Olper and Raimondi, 2008).
In terms of the results for different commodity groups, Table 4 provides some insights into the
consequences of preferential policies for the extensive margin.
18
In almost all cases, preferences significantly increase the probability of exporting to EU markets,
with the exception of dairy, where the coefficient is significant only at the 10% level. The increase
in the probability of registering a positive trade flow as a consequence of preference treatment,
varies between 3% for fruit and vegetables and 18% for tobacco. These differences are obviously
related to the structure of the applied tariffs as well as the preference margins. A low impact of the
probability of registering a positive trade flow is obviously related to the small preference margins
granted to tropical products, oils and fats, and fruit and vegetables. However, the extensive margin
also shows a low impact for animal products, which are characterized by high applied tariffs
notwithstanding the large preference margins. Finally, it should be remembered that the number of
products in each sector is very uneven: as a consequence, there are 48,622 trade flows on 78,188
bilateral imports in the case of the fruit and vegetables and only 4,560 tobacco trade flows on 7,333
possible imports.
The coefficients of bilateral distance, language and colonial links are consistent with those in Table
3, and in both steps of the estimations (Tables 4 and 5). There are large differences across sectors
for all the estimated coefficients, which could be explained by large differences across sectors in
terms of the perishability of the exported products, or transport constraints. These results support
our decision to run separate rather than a pooled regression, since the latter would have implied
unwarranted restrictions on the trade cost coefficients.
The estimates for the elasticity of substitutions are statistically significant for six out of nine classes
of goods (Table 5). Almost all the significant estimates are within the ranges in previous studies,
with the exception of tropical products, which reaches a value of 16. Such high substitutability
among country varieties at this highly disaggregated level is not inconceivable, and could be
interpreted as the consequence of less product heterogeneity in certain sectors. From this
perspective, the most differentiated sectors seem to be those where results are not significant: oils
and fats, animal products, and dairy. These would also be the sectors where DCs have less to gain
from a possible extension of the preference margins (notwithstanding the high duties applied to
19
dairy and animal products, see Table 2). On the other hand, it should be noted that the largest
estimated elasticities are for those sectors, as tropical products, beverages and tobacco, that incur
rather low duties (even without the benefits of large preference margins), with the possible
exception of beverages where there might be room for further liberalization on a preferential basis.
Table 6 presents computations of the percentage change in total imports due to the hypothetical
elimination of existing preferences according to equation (7); it shows the results only for those
sectors with a statistically significant estimated preference impact. The sectors excluded –, oils and
fats, animal products, and dairy – are those where existing preferential schemes seem to affect only
the extensive margin. Indeed, notwithstanding the rather large relative margins, most imports incur
positive MFN duties (Figure 1). In the case of animal products and dairy, non-tariff barriers, such as
quotas, administrative burdens, and restrictive sanitary and phytosanitary regulations, are likely to
play a much larger role than tariffs, so tariff preferences alone are not sufficient to access EU
markets. On the other hand, it could be argued that if these sectors do not benefit from the
preferences in place, they also might not suffer from their erosion. However, it is possible that these
sectors might have vested interests in multilateral liberalization not being introduced: for instance,
share of animal products in total preference rent (Table 2) is quite significant (10%).
As a general comment, the sum of the values reported in Table 6 largely exceeds the overall impact
estimated in Table 3, since trade flows due to preferences add up to €2,305 million, which means
that around 14% of EU preferential trade (i.e., 3.7% of total agricultural imports from DCs) would
not take place without preferences. This is a consequence of the highly differentiated impact
estimated in Table 5, since each sector is characterized by a very different substitution elasticity.
The impact of EU preferences is around 2% in the case of beverages, cereals, and tobacco; around
6% in the case of tropical and other food products; and over 9% for fruit and vegetables. For the
first group, preferences increase export flows only marginally in absolute terms. However, in the
case of beverages and tobacco, preference margins are significant and lead to significant rents,
while for cereals, preferential exports are much smaller, but up to a quarter is dependent on actual
20
margins. Moreover, since a large share of DCs cereals exports incur high MFN duties (Figure 1),
DCs exports might benefit from more generous preferential policies.
Tropical products and other food products show similar trade effects, but these are due to low
margins and high elasticity in case of the former, and the reverse in the case of the latter. However,
given the differences in trade flows (Figure 2), the trade volume generated by preferences is much
larger in the case of tropical products and represents more than 50% of preferential trade: however,
it should be recalled that preferential trade represents only 11% of EU imports, while 88% already
enjoy MFN duty free access. In terms of other food products, there is some room to increase or
extend the preferences for the 38% of imports still subject to positive duties (Figure 1). However,
DCs may be fearful about loss of rents, which represent 12% of the import value.
Fruit and vegetables represent a very large share (27%) of DCs exports to the EU, and is the sector
most affected by EU agricultural preferences: it accounts for 64% of ‘preference-generated’ trade
flows and around half of total rents. These figures are impressive, although it should be
remembered that the use of annual data ignores seasonality, which is one of the main characteristics
of this sector and plays an important role in the EU protection system (Cardamone, 2008; Emlinger
et al., 2008).
5. Conclusions
Over time, the EU has instituted a number of preferential schemes for DCs exports, in order to
integrate these countries into world trade and to promote their economic growth. In this paper we
focus on the agricultural sector since DCs exports represent a significant share of EU agricultural
imports. Our objective was to assess the impact of preferential margins on trade flows, using a
gravity equation approach in order to identify the contribution of preferential policy to deviations
from ‘normal’ trade levels.
Our results show robust estimates for the impact of EU preferences on bilateral trade flows. We
control for possible biases in three dimensions: measurement of the intensity of the (relative)
21
preference margins, impact on the extensive as well as on the intensive margins of trade, distinction
between preferential and MFN trade flows.
Methodologically, our study confirms that there is little support for the use of aggregated data and
that when using disaggregated data, the estimations should be conducted on a sector-by-sector
basis. Comparison of sector estimates with estimates for the overall agricultural sector, shows that
the latter is likely to be underestimated due to the assumption of common impacts of trade costs
across sectors.
Working at the most detailed level allowed by the data increases the problem of zero trade flows. In
line with the most recent evidence, we deal with this problem by applying a Heckman correction
approach and controlling for selection bias due to the presence of zeros.
We quantify the intensity of the preference margins, rather than relying on a simple dummy. In
order to emphasize the advantage granted with respect to other importers, preferential margins are
computed for each product, as the difference between the highest tariff applied by EU and the actual
duty paid by each exporter.
From a policy perspective, preferential tariff rates for exports to the EU are aimed at enabling DCs
to participate more fully in international trade and to generate additional export revenues to support
the development of industry and jobs and to reduce poverty. In this paper, we investigate whether
the EU’s trade preferences in the area of agri-food trade have been effective in stimulating
additional exports from recipients eligible for preferential duties. The issue is contentious, and
widely debated in the literature, and this paper provides new evidence showing that preferential
schemes have a significant impact on trade. First, preferences influence the extensive margins of
trade since we show that there is a significant increase in the probability of registering a positive
trade flow. This implies that countries benefiting from preferential schemes export a larger set of
goods; also, some recent work points to the contribution of export variety to growth (Broda and
Weinstein, 2006). This impact ranges from 2% for dairy to 18% for tobacco. In terms of the impact
22
on trade volumes, we find that EU agricultural imports increased as a consequence of preference
margins, by more than €2 billion, or almost 14% of preferential trade flows.
The results for different commodity groups may have some implications for policy, although they
should be used with caution since trade negotiations assume a lot more than just the magnitudes of
some of the coefficients. DCs may be concerned about the consequences of preference erosions,
either in terms of the negative impact on trade – in the case of tropical and other food products, and
especially fruit and vegetables – or loss of rents – in the case of animal products, beverages and
tobacco. On the other hand, there is room for a deepening of the current schemes, given that a
significant share of EU imports from DCs still incur positive duties. From this perspective,
negotiations to increase preference margins are likely to be most effective in the case of cereals,
other food products, and fruit and vegetables, while additional preferences may not increase exports
in those sectors, and especially in animal products and dairy, where technical, sanitary,
phytosanitary standards and traceability requirements, set by public or private bodies, are very high.
23
References
Agostino M. R., Aiello F., Cardamone P. (2007), Analysing the Impact of Trade Preferences in
Gravity Models. Does Aggregation Matter?, TradeAG WP 07/4.
Alexandraki K., Lankes H. P. (2004), The Impact of Preference Erosion on Middle-Income
Developing Countries, IMF WP 04/169, International Monetary Fund: Washington DC.
Amurgo-Pacheco A. (2006), Preferential Trade Liberalization and the Range of Exported
Products: The Case of the Euro-Mediterranean FTA. HEI WP 18/2006: Geneva.
Anderson J. E., van Wincoop E. (2003), “Gravity With Gravitas: A Solution to the Border
Puzzle”, American Economic Review 93(1) 170-192.
Anderson J. E., van Wincoop E. (2004), Trade Costs, NBER WP 10480.
Anson J., Cadot O., Estevadeordal A., de Melo J., Suwa-Eisenmann A., Tumurchudur B. (2005),
“Rules of Origin in North–South Preferential Trading Arrangements with an Application to
NAFTA”, Review of International Economics 13(3) 501–517.
Baier S. L., Bergstrand J. H. (2001), “The Growth of World Trade: Tariffs, Transport Costs and
Income Similarity”, Journal of International Economics 53 1-27.
Baldwin R. E., Skudelny F., Taglioni D. (2005), Trade effects of the euro evidence from sectoral
data, European Central Bank WP 446.
Bergstrand J. H. (1985), “The gravity equation in international trade: some microeconomic
foundation and empirical evidence”, Review of Economics and Statistics 67 474– 481.
Bergstrand J. H. (1989), “The Generalized Gravity Equation, Monopolistic Competition, and the
Factor Proportions Theory in International Trade”, Review of Economic and Statistics 71 143-53.
Borchert I. (2009), Trade Diversion under Selective Preferential Market Access, World Bank
Policy Research WP 4710.
Boumelassa H., Laborde D., Mitaritonna C. (2009), A consistent picture of the protection across
the world in 2004: MAcMapHS6 version 2. CEPII WP 2009-22, September.
24
Bouët A., Jean S., Fontagné L. (2005), Is erosion of preferences a serious concern?, in
Agricultural Trade Reform and the Doha Development Agenda, Chapter 6; pp. 161-192, edited by
K. Anderson and W. Martin, The World Bank: Washington, DC.
Brenton P., Ikezuki T. (2005), The Impact of Agricultural Trade Preferences, with Particular
Attention to the Least Developed Countries, in Global Agricultural Trade and Developing
Countries, Chapter 4, pp. 55-73, edited by M. Aksoy and J. Beghin, The World Bank: Washington,
DC.
Broda C., Weinstein D. (2006), “Globalization and the Gains from Variety”, Quarterly Journal of
Economics 121(2) 541-85.
Bureau J. C., Bernard F., Gallezot J., Gozlan E. (2004), The Measurement of Protection on the
Value Added of Processed Food Products in the EU, the US, Japan and South Africa. A Preliminary
Assessment of its Impact on Exports of African Products, The World Bank, Final Report, July 26.
Bureau J. C., Chakir R., Gallezot J. (2007), “The Utilization of trade Preferences for Developing
Countries in the Agri-Food Sector”, Journal of Agricultural Economics 58(1) 1–24.
Candau F., Jean S. (2005), What Are EU Trade Preferences Worth for Sub-Saharan Africa and
Other Developing Countries?, TradeAG WP 05/09.
Cardamone P. (2007), A survey of the assessments of the effectiveness of Preferential Trade
Agreements using gravity models, TradeAG WP.
Cardamone P. (2008), Preferential trade agreements and European Union imports of apples,
pears and grapes, AgFood WP 2008-01.
Chevassus-Lozza E., Latouche K., Majkovic D., Unguru M. (2008), “The importance of EU-15
borders for CEECs agri-food exports: The role of tariffs and non-tariff measures in the pre-
accession period”, Food Policy 33 (6) 595-606.
de Frahan H., Vancauteren M. H. (2006), “Harmonization of food regulation and trade in the
single market: evidence from disaggregated data”, European Review of Agricultural Economics 33
(3) 337–360.
25
De Maria, F., Drogue, S. and Matthews, A. (2008). “Agro-Food Preferences in the EU’s GSP
Scheme: An Analysis of Changes between 2004 and 2006”, Development Policy Review 26 (6)
693-712.
Dean J. M., Wainio J. (2006), Quantifying the Value of U.S. Tariff Preferences for Developing
Countries, World Bank Policy Research WP 3977.
Desta M.G. (2008), “EU sanitary standards and sub-Saharan African agricultural exports: a case
study of the livestock sector in East Africa”, The Law and Development Review, 1 (1), Article 6.
Disdier A. C., Head K. (2008), “The Puzzling Persistence of the Distance Effect on Bilateral
Trade”, The Review of Economics and Statistics 90(1) 37-48.
Disdier A. C., Fontagné L., Mimouni M. (2008), “The impact of regulations on agricultural
trade: evidence from the SPS and TBT agreements”. American Journal of Agricultural Economics
90 (2) 336-350.
Eaton J., Kortum S. (2002), “Technology, Geography and Trade”, Econometrica 70(5) 1741-
1779.
Emlinger C., Jacquet F., Chevassus-Lozza E. (2008), “Tariffs and other trade costs: assessing
obstacles to Mediterranean countries’ access to EU15 fruit and vegetable markets”, European
Review of Agricultural Economics 35(4) 409-438.
Estevadeordal, A. and Suominen, K., (2005). Mapping and measuring Rules of Origin around the
world. In: O. Cadot, A. Estevadeordal, A. Suwa, and T. Verdier, eds. The origin of goods: rules of
origin in regional trade agreements. Oxford University Press, New York, Chap. 3, 69-113.
Feenstra R. C. (2002), “Border Effects and the Gravity Equation in International Economics:
Theory and Evidence”, Scottish Journal of Political Economy 49(5) 491-506.
Gallezot J. (2005), Data Base on EU Preferential Trade TRADEPREF, TradeAG WP 05/08.
Gallezot J., Bureau J. C. (2004), The utilisation of trade preferences by OECD countries: the
case of agricultural and food products entering the European Union and United States, OECD,
Paris.
26
García-Alvarez-Coque J. M., Marti Selva M. L. (2006), A gravity approach to assess the effects
of Association Agreements on Euromediterranean Trade of Fruit and Vegetables, TradeAG WP
2006/15.
Heckman J. (1979), Sample Selection Bias as a Specification Error, Econometrica 47(1): 153-
161.
Helpman E., Melitz M., Rubinstein Y. (2007), Estimating trade flows: Trading Partners and
Trading Volumes, NBER WP 12927.
Iimi A. (2007), Infrastructure and Trade preferences for the livestock sector: empirical evidence
from the beef industry in Africa, World Bank Policy Research WP 4201.
Lai H., Trefler D. (2002), The gains from trade with monopolistic competition: specification,
estimation, and mis-specification, NBER WP 9169.
Lai H., Trefler D. (2004), On estimating the welfare gains from trade liberalization. Working
paper, University of Toronto.
Lai H., Zhu S. C. (2004), “The determinants of bilateral trade”, Canadian Journal of Economics
37 (2) 459–483.
Manchin M. (2005), Preference Utilisation and Tariff Reduction in EU Imports from Africa,
Caribbean, and Pacific Countries, World Bank Policy Research WP, 3688.
Martin W., Pham C. (2008), Estimating the Gravity Model When Zero Trade Flows Are
Frequent, mimeo, The World Bank.
Nielsen C. P. (2003), Regional and Preferential Trade Agreements: a Literature Review and
Identification of Future Steps. Report 155, Fodevareokonomisk Institut, Copenhagen.
Nilsson L. (2002), “Trading relations: is the roadmap from Lomé to Cotonou correct?” Applied
Economics 34 439-452.
Nilsson L. (2005), Comparative effects of EU and US trade policies on developing country
exports, European Commission, TRADE Directorate General, WP.
27
Nilsson L. (2008), Truths and myths about the openness of EU trade policy and the use of EU
trade preferences, paper presented at the European Trade Study Group Tenth Annual Conference,
Warsaw, September.
Olper A., Raimondi V. (2008), “Agricultural market integration in the OECD: a gravity-border
effect approach”, Food Policy 33 165–175.
Panagariya A. (2002), “EU Preferential Trade Arrangements and Developing Countries”, The
World Economy 25(10) 1415-1432.
Persson M., Wilhelmsson F. (2005), Revisiting the Effects of EU Trade Preferences, WP, Lund
University, Sweden
Pusterla F. (2007), Regional Integration Agreements: impact, Geography and Efficiency. IDB-
SOE WP, January 2007.
Romalis J. (2003). "Would Rich Country Trade Preferences Help Poor Countries Grow?
Evidence from the Generalized System of Preferences", mimeo, Chicago GSB.
Rose A. K. (2004a), “Do We Really Know that the WTO Increases Trade?”, American
Economic Review 94 98-114.
Rose A. K. (2004b), Does the WTO Make Trade More Stable?, NBER WP 10207.
Santos Silva J. M. C., Tenreyro S. (2005), The Log of Gravity, CEPR Discussion Paper 5311.
Siliverstovs B., Schumacher D. (2007), Estimating gravity model: To log or not to log,
Discussion Papers 739, German Institute for Economic Research, DIW Berlin.
Subramanian A., Wei S. J. (2005), The WTO promotes trade, strongly but unevenly. CEPR
Discussion Paper No 5122.
Tangermann S., Josling T. (1999), The Interests of Developing Countries in the Next Round of
WTO Agricultural Negotiations, study prepared for UNCTAD (Göttingen: Institute of Agricultural
Economics).
Verdeja L. (2006), EU’s Preferential Trade Agreements With Developing Countries Revisited.
Unpublished, University of Nottingham, School of Economics.
28
Yamazaki F. (1996), “Potential Erosion of Trade Preferences in Agricultural Products”, Food
Policy, Vol. 21 409–18.
World Bank, 2008. Development Report 2008: Agriculture for Development, Washington, DC.
Washington, DC
FIGURES
Figure 1. Share of EU agricultural imports by type of tariff regime (2003-2005)
29
Figure 2. Compositions of EU agricultural imports from DCs (2003-2005)
TABLES
Table 1. Share of EU agricultural tariff lines by type of tariff regime (period 2003-2005)
15 EU members % of MFN duty-free % of MFN duty
(no preference)
% of Preferential duty-free % of Preferential duty
Potential (Used)a Potential (Used)a
All Agricultural Sectors 30 5 25 (17) 40 (20)
Animal products 25 8 11 (8) 56 (12)
Beverages 42 2 16 (10) 40 (16)
Cereals & cereal preparation 6 5 16 (11) 74 (25)
Animal and vegetable oils & fats 15 45 19 (14) 21 (11)
Tobacco 17 5 45 (29) 33 (16)
Tropical products 48 4 34 (21) 14 (6)
Fruit & vegetables 17 5 25 (18) 53 (30)
Dairy 11 26 16 (11) 47 (15)
Other food products 17 7 28 (21) 48 (25)
Data refer to tariff lines with positive trade flows;. a The numbers in parenthesis indicate the percentage of preferential tariff lines that enter in EU
under a preferential scheme.
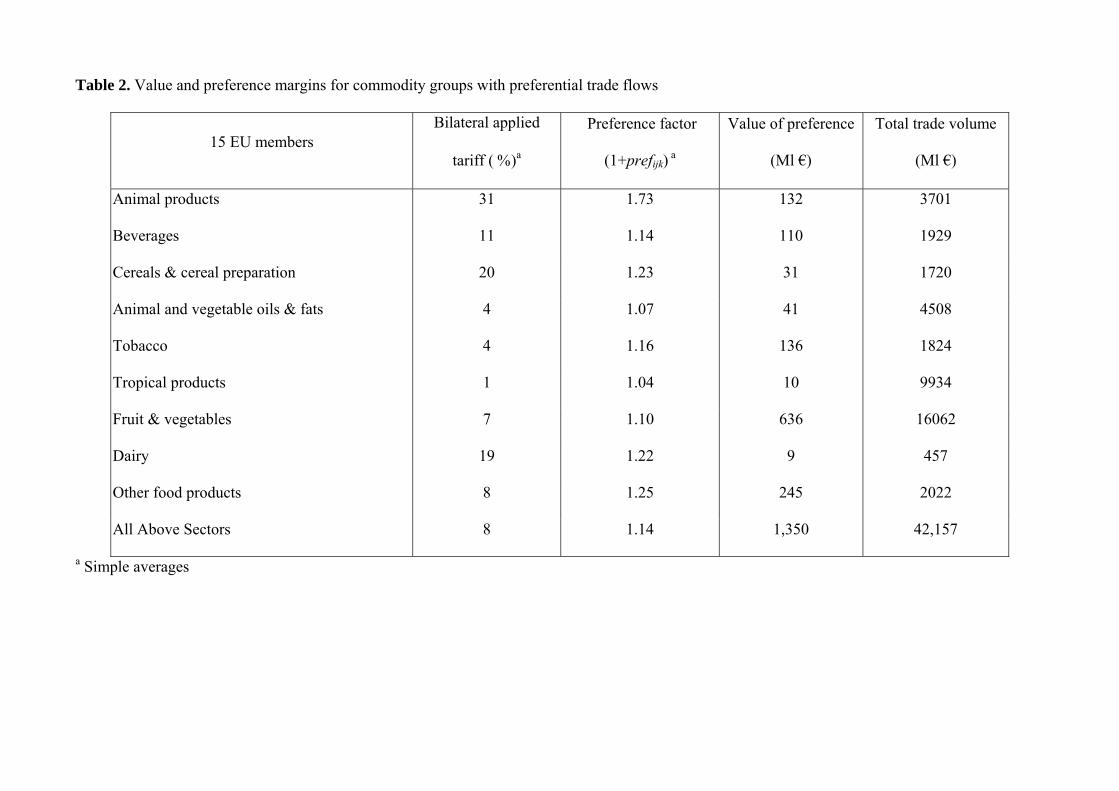
Table 2. Value and preference margins for commodity groups with preferential trade flows
15 EU members Bilateral applied
tariff (a
Preference factor
(1+prefijk) a
Value of preference
(Ml €)
Total trade volume
(Ml €)
Animal products 31 1.73 132 3701
Beverages 11 1.14 110 1929
Cereals & cereal preparation 20 1.23 31 1720
Animal and vegetable oils & fats 4 1.07 41 4508
Tobacco 4 1.16 136 1824
Tropical products 1 1.04 10 9934
Fruit & vegetables 7 1.10 636 16062
Dairy 19 1.22 9 457
Other food products 8 1.25 245 2022
All Above Sectors 8 1.14 1,350 42,157
a Simple averages
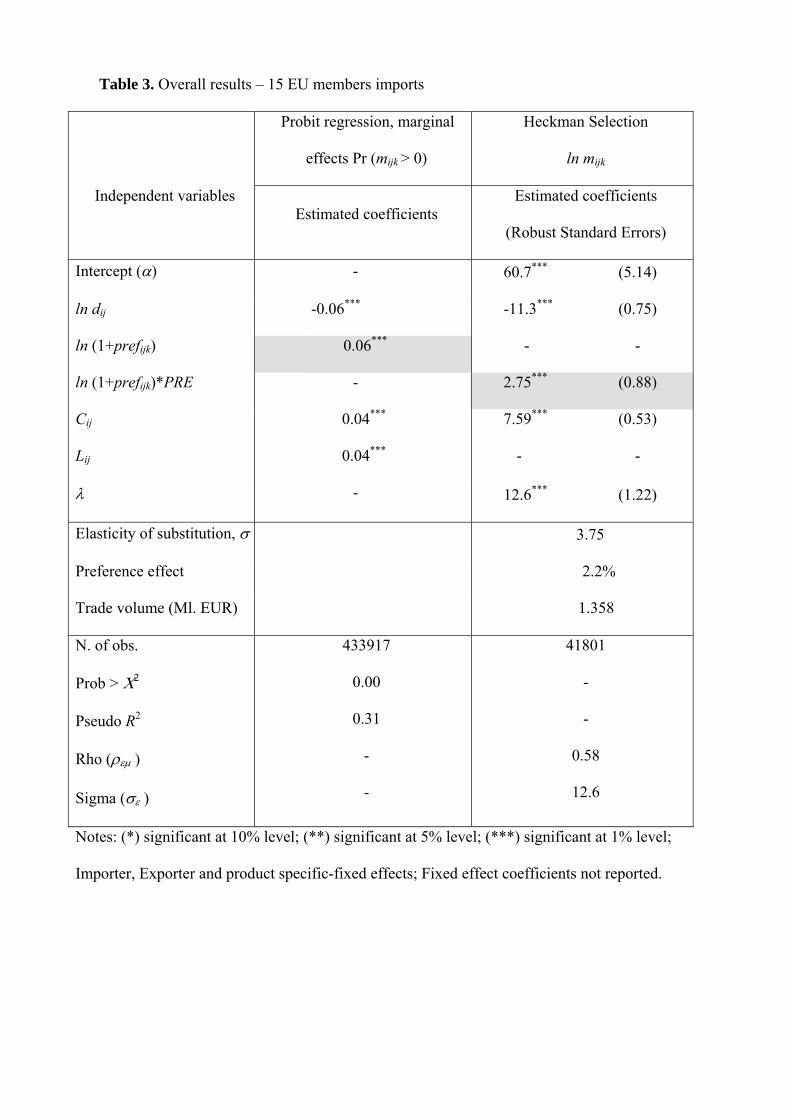
Table 3. Overall results – 15 EU members imports
Probit regression, marginal
effects Pr (mijk > 0)
Heckman Selection
ln mijk
Independent variables Estimated coefficients
Estimated coefficients
(Robust Standard Errors)
Intercept () - 60.7*** (5.14)
ln dij -0.06*** -11.3*** (0.75)
ln (1+prefijk) 0.06*** - -
ln (1+prefijk)*PRE - 2.75*** (0.88)
Cij 0.04*** 7.59*** (0.53)
Lij 0.04*** - -
- 12.6*** (1.22)
Elasticity of substitution, 3.75
Preference effect 2.2%
Trade volume (Ml. EUR) 1.358
N. of obs.
Prob >
Pseudo R2
Rho (
Sigma (
433917
0.00
0.31
-
-
41801
-
-
0.58
12.6
Notes: (*) significant at 10% level; (**) significant at 5% level; (***) significant at 1% level;
Importer, Exporter and product specific-fixed effects; Fixed effect coefficients not reported.
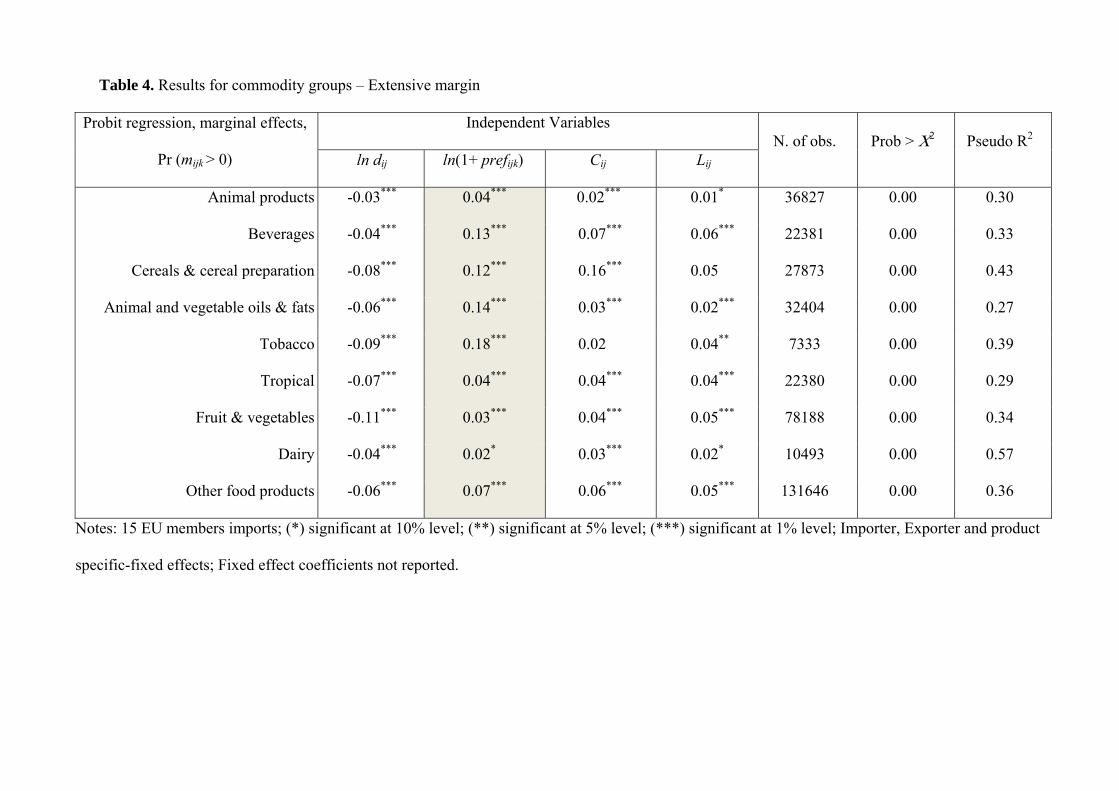
Table 4. Results for commodity groups – Extensive margin
Probit regression, marginal effects,
Pr (mijk > 0)
Independent Variables N. of obs. Prob > Pseudo R2
ln dij ln(1+ prefijk) Cij Lij
Animal products -0.03*** 0.04*** 0.02*** 0.01* 36827 0.00 0.30
Beverages -0.04*** 0.13*** 0.07*** 0.06*** 22381 0.00 0.33
Cereals & cereal preparation -0.08*** 0.12*** 0.16*** 0.05 27873 0.00 0.43
Animal and vegetable oils & fats -0.06*** 0.14*** 0.03*** 0.02*** 32404 0.00 0.27
Tobacco -0.09*** 0.18*** 0.02 0.04** 7333 0.00 0.39
Tropical -0.07*** 0.04*** 0.04*** 0.04*** 22380 0.00 0.29
Fruit & vegetables -0.11*** 0.03*** 0.04*** 0.05*** 78188 0.00 0.34
Dairy -0.04*** 0.02* 0.03*** 0.02* 10493 0.00 0.57
Other food products -0.06*** 0.07*** 0.06*** 0.05*** 131646 0.00 0.36
Notes: 15 EU members imports; (*) significant at 10% level; (**) significant at 5% level; (***) significant at 1% level; Importer, Exporter and product
specific-fixed effects; Fixed effect coefficients not reported.
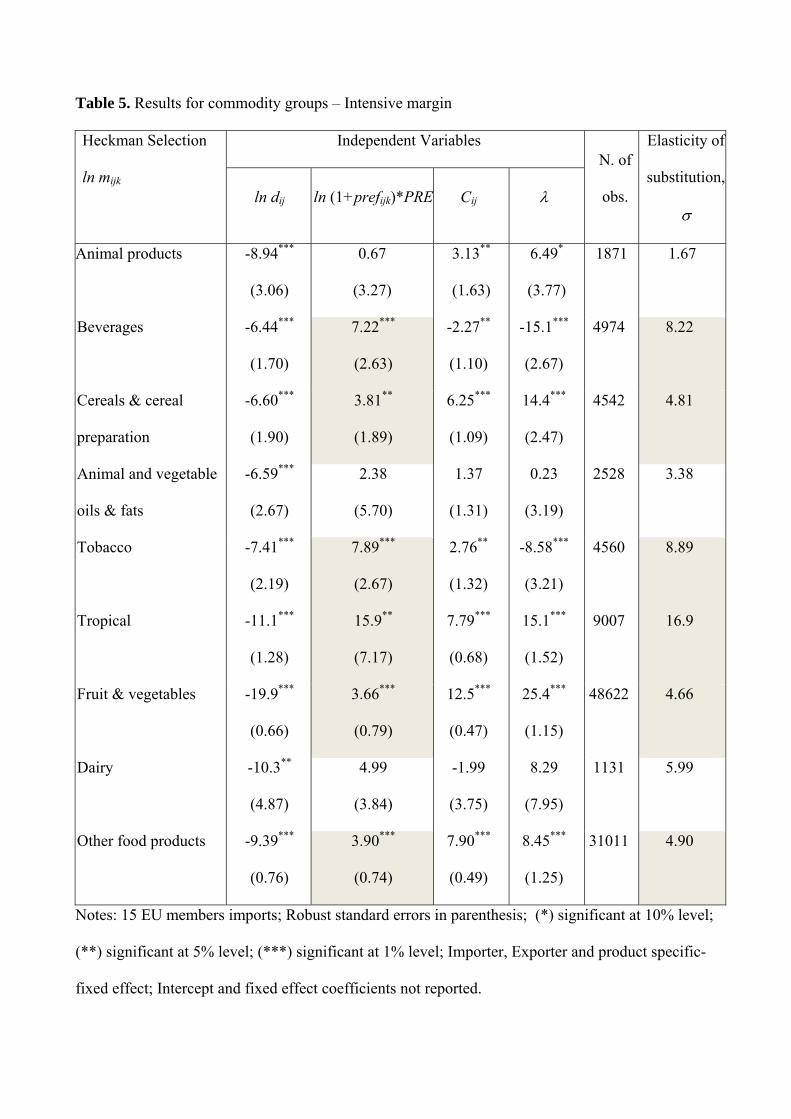
Table 5. Results for commodity groups – Intensive margin
Heckman Selection
ln mijk
Independent Variables N. of
obs.
Elasticity of
substitution,
ln dij
ln (1+prefijk)*PRE Cij
Animal products -8.94***
(3.06)
0.67
(3.27)
3.13**
(1.63)
6.49*
(3.77)
1871
1.67
Beverages -6.44***
(1.70)
7.22***
(2.63)
-2.27**
(1.10)
-15.1***
(2.67)
4974
8.22
Cereals & cereal
preparation
-6.60***
(1.90)
3.81**
(1.89)
6.25***
(1.09)
14.4***
(2.47)
4542
4.81
Animal and vegetable
oils & fats
-6.59***
(2.67)
2.38
(5.70)
1.37
(1.31)
0.23
(3.19)
2528
3.38
Tobacco -7.41***
(2.19)
7.89***
(2.67)
2.76**
(1.32)
-8.58***
(3.21)
4560
8.89
Tropical -11.1***
(1.28)
15.9**
(7.17)
7.79***
(0.68)
15.1***
(1.52)
9007
16.9
Fruit & vegetables -19.9***
(0.66)
3.66***
(0.79)
12.5***
(0.47)
25.4***
(1.15)
48622
4.66
Dairy -10.3**
(4.87)
4.99
(3.84)
-1.99
(3.75)
8.29
(7.95)
1131
5.99
Other food products -9.39***
(0.76)
3.90***
(0.74)
7.90***
(0.49)
8.45***
(1.25)
31011
4.90
Notes: 15 EU members imports; Robust standard errors in parenthesis; (*) significant at 10% level;
(**) significant at 5% level; (***) significant at 1% level; Importer, Exporter and product specific-
fixed effect; Intercept and fixed effect coefficients not reported.
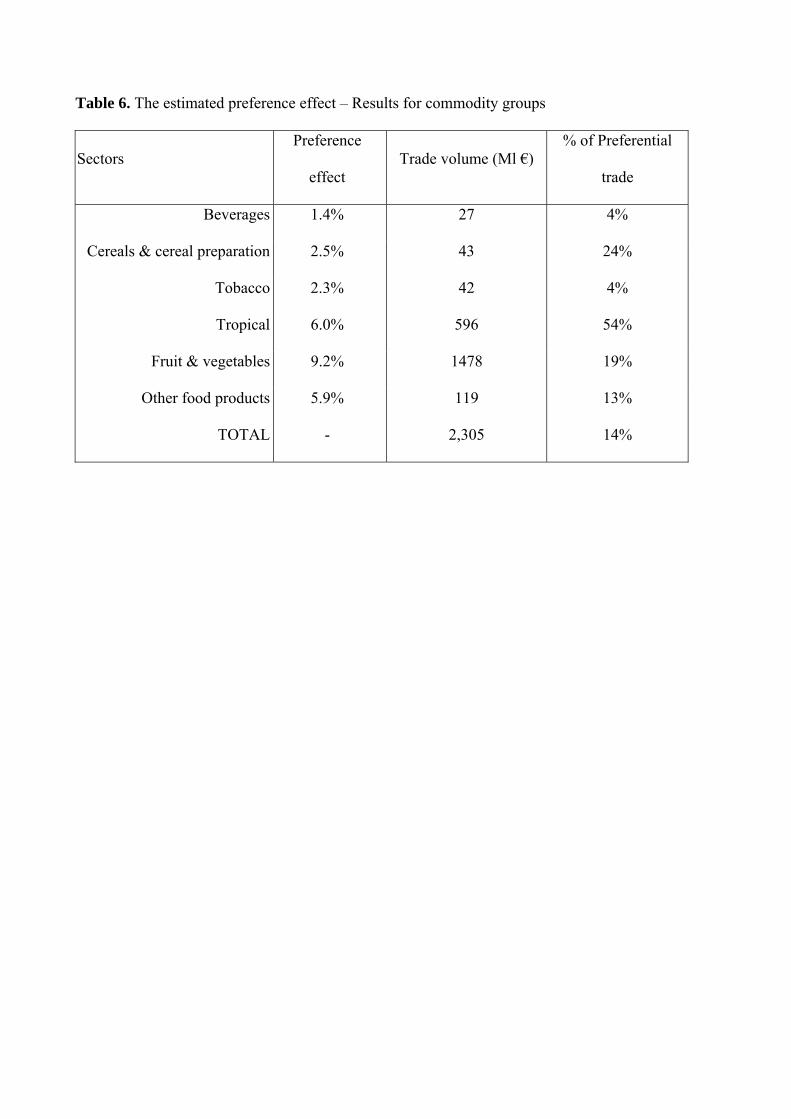
Table 6. The estimated preference effect – Results for commodity groups
Sectors Preference
effect Trade volume (Ml €)
% of Preferential
trade
Beverages 1.4% 27 4%
Cereals & cereal preparation 2.5% 43 24%
Tobacco 2.3% 42 4%
Tropical 6.0% 596 54%
Fruit & vegetables 9.2% 1478 19%
Other food products 5.9% 119 13%
TOTAL - 2,305 14%