the three-mile island nuclear accident and business...
TRANSCRIPT

THE THREE MILE ISLAND NUCLEAR ACCIDENT ANDBUSINESS INTERRUPTION LOSSES: TWO CASE STUDIES
by
Robert C. Posatko*
I. Introduction
This paper presents a discussion of two cases of business interruption losses, whichwere a consequence of the nuclear accident in March of 1979 at the Three Mile Island (TMI)generating plant near Middletown, Pennsylvania. The TMI event spurred a variety of classaction lawsuits on behalf of a number of groups allegedly affected by the incident, includingpersonal injury and death claims, wage losses during work stoppage, evacuation costs,property value losses, and claims by firms suffering losses in business profits, and in somecases bankruptcy. Litigation resulted in a lump sum settlement between the utility companyand the combined plaintiff groups, excluding the injury and death cases, which have beenlitigated separately.I Each of the affected groups then "competed" for recovery of lossesand damages, and each individual plaintiff was evaluated according to criteria for therespective groups as established by the court and its representatives. The two casesdiscussed in this paper fall within the last group identified above, namely, claims ofcommercial-type damages.
In general, commercial loss plaintiffs were routinely awarded the equivalent of twoweeks of gross profits on the assumption that this was the maximum duration and extent oflosses by the average area firm. In many cases, however, particularly those of fn-ms in ornear Middletown itself, it was evident that damages were more complex and longer-term innature. For a number of these, expert analyses and appraisals were conducted and reportspresented in support of individual claimants’ cases.
The two cases presented herein are that of a new car dealership, and a large, family-owned grocery store, both located within the immediate TMI geographic area (within 5 milesof the plant). In the car dealership case, the evidence suggested that losses occurred overa several year period, but appeared to have largely diminished by the time this analysis wascompleted in 1984. In the case of the grocery store, for which business volume is heavilylinked to population levels in the Middletown area, annual earning losses were seen asextending beyond the date of the loss appraisal, at least to the year 1989, and conceivablybeyond that year as the long-term appeal of this area as a place of residence appeared to havebeen affected.
* Robert C. Posatko is Professor of Economics in the John L. Grove College of Business,Shippensburg University of Pennsylvania, Shippensburg, Pennsylvania 17257
A modicum of controversy still surrounds the question of public health effects frompossible radiation emissions from the plant at the time of the incident. Approximately 2000personal injury and death cases continue in litigation at present, some 19 years after theincident.

136 Posatko
II. The Forecast Model
The methodology employed in calculating the economic losses of the two fh-msfollowed the general lines of analysis and estimation commonly used in business interruptioncases of this type.2 This involves, first, the forecasting of incremental revenue over theaffected period (weeks, months or years, depending on circumstances) that would have beenrealized had the busniess interference not occurred. Available data on the sales determinantsof the affected fn’ms were examined for this purpose. Second, the associated incrementalcosts are evaluated and quantified. Since both cases involved retail sales activity, the costof goods sold was the major variable cost, along with other selling expenses, including forexample, commissions of the auto dealer’s sales force. Third, consideration is given to anyextraordinary costs (such as emergency advertising) that are motivated by the interruptionitself. Finally, then, profit losses are the lost revenues, minus the avoided variable costs plusany added expenses prompted by the business interruption. For both of the cases presented,a fairly rich supply of historic operating data were available as a basis upon which to develop"but-for" estimates of revenues and costs, and useful external data sources were able to bedeveloped for purposes of formulating the appraisals.
Business interruptions are commonly typed as "closed," "open," or "infmite" interms of the duration of damages experienced? The closed category of losses includes thosefor which the episode of damage has ended by the time the appraisal of losses is performed.In such cases, normal sales data fxom before and after the interruption are available for usein developing the estimate of losses in the intervening period. Open losses are those forwhich the farm’s sales performance has not returned to normal by the time of the appraisal,but the finn continues to operate. The two cases discussed herein fall approximately withinthese first two categories of losses. By the time of final hearing of the auto dealership casein 1984, the interruption had largely diminished, though a full resumption of its "normal"sales path was not yet evident. The grocery sales case had the markings of an open, orcontinuing loss of business volume well beyond the appraisal and f’mal settlement date.
Both cases illustrate the fact that analysts frequently are challenged as much byhaving to project the end of the loss episode as by having to project the size of losses.Furthermore, as noted by experienced practitioners in this field, the question of how far intothe future to compute profit losses is often a legal issue as much as an economic one? Inthe case of the TMI damages, the court initially imposed three to four year time limits (i.e.to 1981 or 1982) on damages, but subsequently did consider evidence on losses occurringup to the time of hearings which were largely completed by the end of 1984. Thus, whilein a few select cases triggered by the TMI incident, actual damages might well havecontinued beyond 1984 (due to the longer-term harm to a business location) the courtarbitrarily set a time limit on damage estimates it would consider?
2 For discussion of forecasting models and methodology frequently used in such businessinterruption cases, see Foster, Trout and Gaughan (1993) or Plummer and McGowin (1993 3 See Trout and Foster (1993), pp. 154-155.4 See Dunn (1989).s See Case 2 below.

LITIGATION ECONOMICS DIGEST 137
III. Case 1: Auto Sales, Inc.
A. Background
Case 1 involves a new and used car dealership ("Auto Sales, Inc.") in thecommunity near TMI, which primarily sold a very popular foreign make, referred to in thispaper as "ForCar," along with a make from one of the U.S. Big Three automakers, referredto as "Amercar." This dealership had been a successfully run enterprise for some 20 yearsas of the mid-1970’s. In 1972 it began selling ForCar, augmenting its long-standingdealership in AmerCar. As shown in Table 1 and Figure 1, the firm’s sales of ForCar hadrisen briskly from 1973 through 1978, roughly matching the sales path of its counterpartnational average dealer. Unit sales by the average dealer nationwide, for the ForCar makeof automobile, was derived from figures provided in the trade publication, AutomotiveNews, Market Data Book. While not an exact replication of nationwide dealer growth ratesover the 1973 to 1978 period, the plaintiff’s sales record reasonably matches that of thenational counterpart. Hence, the national average dealer growth rate was used as abenchmark in projecting the finn’s sales, had the TMI incident not occurred.
Following the incident, the plaintiff’s unit sales for 1979 dropped sharply, andremained offthe pace for the next 4 to 5 years. (It was management’s strongly held view thatthroughout this several year period following the March 1979 incident, sales and profits werehurt because many potential customers from outside the immediate vicinity were reluctantto buy from this dealership and return for subsequent service visits due to imagined negativehealth consequences in the area near the plant.)
Table 1Auto Sales, Inc.
ForCar Unit Sales
Year National Average Dealer* Auto Sales. Inc.(Annual Growth Rate) (Actual) (Projected-- Absent TMI Incident)
1973 132 571974 104 751975 214 1271976 252 2341977 339 2901978 396 2951979 488 23.23% 1721980 496 1.60% 1831981 470 (5.24%) 2241982 455 (3.19%) 1441983 494 8.57% 2211984 610 23.48% 328
363368349338367453
* Source: Automotive News, Market Data Book, (annual, 1973-1984) published Crain Communications, Inc.

13 8 Posatko
T
Sales ofAmerCar, a product of one of the U.S. Big Three, which had been very stable priorto 1979, dropped sharply in the accident year and appeared to have been moderatelydampened over the next 4 years as well. AmerCar sales appear in Table 2.

LITIGATION ECONOMICS DIGEST 139
B. Estimation of Lost Sales and Profits -- ForCar
The estimate developed for the firm’s losses in new car sales of both ForCar andAmerCar vehicles was based on the sales performance of dealers nationwide selling thesetwo makes of automobiles. This benchmark, or "yardstick", represented by national averagedealer unit sales, had applicability in this case as other market factors, including the numberof competing dealers in the area, were constant during the affected period? Use of thismuki-year benchmark was particularly valuable in the present case since it appeared that theimpact on the company extended for several years beyond 1979 due to the apparent,lingering tendency on the part of many residents of the greater Harrisburg region to avoidthe Middletown area if they could do so. The period of impact thus included the 1981-1982recession period, and it was assumed that this dealership would have suffered the samedegree and timing of lost sales during that recession as the counterpart national averagedealer. In recent decades, the state of Pennsylvania had experienced economic fluctuationsof quite similar duration and amplitude as those of the nation as a whole. During the mostsignificant recession period prior to the TMI incident, the 1973-1975 contraction, thePennsylvania unemployment rate tracked very closely with that of the U.S. economyoverall.7 Within the more proximate Harrisburg region, recession period data, including the
1981-1982 episode, indicate a strong correlation of the region’s unemployment rate with thatof the national economy.8
6 For a discussion of other yardstick or benchmark indicators, see Foster, Trout and
Gaughan, (1993), p. 189.7 In the U.S. as a whole, the unemployment rate rose from some 4.8% in 1973 to 5.6% in
1974 and peaked at 8.6% in early 1975; correspondingly, in Pennsylvania the unemploymentrate was 4.8% in 1973, 5.3% in 1974 and 8.4% in 1975 (See Choices for Pennsylvanians,December 1980, p. 16)
s See: Regional Economic Update, "Unemployment Rate Characteristics of Metropolitan
Area Economies," (Autumn 1995).

140 Posatko
Table 2
Auto Sales, Inc.
Year National Average Dealer*(Annual Growth Rate) (Actual)
1974 158 361975 192 791976 272 1041977 294 1021978 302 1141979 286 (5.30%) 721980 251 (12.24%) 601981 263 4.78% 881982 254 (3.42%) 601982 320 25.98% 145
Auto Sales. Inc.ProjectedAbsentIncident)
10895100
96121
TMI
*Source: Automotive News, Market Data Book (annual, 1974-1983), published Crain Communications, Inc.
The utilization of the unit sales record of the national average dealership wasstraight- forward. The annual rates of change of the average dealer from 1978 onward wereapplied to the plaintiffs pre-TMI (1978) unit sales, generating projections of annual salesof the ForCar make for the years 1979 through 1984. Making direct use in this way of theactual year-to-year volume of the average dealer to estimate "but-for" sales of the damagedfirm seemed especially appropriate for two reasons: 1) as noted above, it preserved theeffects of the 1981-1982 recession on projected sales for the plaintiff; and, 2) it captured theparticular timing of the growing appeal and profitability of this increasingly popular makeof automobile. Figure 1 thus includes the projected sales levels of the car over the 1979 to1984 period, the time-frame affected by the nuclear incident.
Table 3 summarizes the loss calculations for this make of car for the period of 1979through 1983.9 Subtracting actual units sold from projected levels yields lost sales, in units.Multiplying by the average price of cars actually sold each year, and by the average grossprofit per unit from actual sales, produced estimates of lost sales revenue and lost grossprofits, respectively. Gross profit per car earned on the ForCar make varied substantiallyover the 1979 to 1983 period from 13 percent to 19 percent of sales, reflecting changes infeatures provided as standard equipment, sticker prices, and the mix of models sold.
A detailed examination of the finn’s accounting records indicated that the likelyadded variable costs that would accompany such additional sales ranged from about 5
9 As noted above, the court established a more-or-less fixed end point on business loss
recovery, which in the present case meant to the end of 1983. As suggested by Figure 1,actual losses for this fn-m appear to have continued into 1984, and may have extendedbeyond.

LITIGATION ECONOMICS DIGEST 141
percent to 6 percent of gross sales, the bulk of which was commissions of 4percent, andadvertising of about ½ percent. Netting out these additional sales costs (using 5.5 percentof gross sales) from the unrealized gross profit yielded the losses in net profit on the ForCarmake over the five-year period.
C. Estimation of Lost Sales and Profits -- AmerCar, Used Cars, and Parts and Service
An estimation of the firm’s losses on the American make of auto it sold wassimilarly developed for the 1979 to 1983 period. Based also on a comparison with thenational average dealer sales performance, annual sales of this make declined following theTMI incident, but were less dramatically reduced than were sales of the foreign-madevehicle. This differential effect was attributed to the fact that the clientele of the Americanmake of car consisted more heavily of local residents of the vicinity of TMI, as opposed tocustomers from outside this vicinity who tended to avoid doing business in the area of theTMI plant,l°
ForCar:
Table 3Auto Sales, Inc.
Lost Sales. Revenues. and Net Profit
For Car Units Lost Lost Lost
Actual Projected Lost Gross Gross Net
Year Sales Sales Sales Revenue Profit Profit
1979 172 363 191 $1,045,077 $161,096 $103,617
1980 183 368 185 1,369,837 260,269 184,928
1981 224 349 125 1,287,177 197,244 126,449
1982 144 337 194 1,463,662 190,885 110,384
1983 221 367 146 1,241,427 170,075 101,797
Losses in business volume and profit reductions were also evaluated for used caras well as service and parts sales by the dealership. The historical pattern for all three ofthese components of dealership business indicated a very strong linkage to new car sales.In the five years prior to 1979 the ratio of used car sales to total new car sales averaged 28.7percent and in three of those five years, the percentages were consistently in the 28.0 percent
~o Sales records of the firm indicated that for the three-year period prior to the accident
approximately twice as many purchasers of ForCar automobiles resided outside ofMiddletown and the three contiguous boroughs to that of the sales location as did purchasersof the American make of automobile.

142 Posa~o
to 28.5 percent range. Using the mid-point value in this range, or 28.25 percent, estimatesof the lost used car sales volume (absent TMI) were generated from the lost ForCar andAmerCar sales, developed above. Netting out variable costs associated with used caractivity yielded estimates of annual losses in net profit from this component of operations.Similarly, parts and service department losses were computed on the basis of their havingaveraged some 5.1 percent of total company sales in the 5 years before the 1979 incident.With variable costs in these two departments exhibiting a steady relationship with sales,
losses in net profit were then computed in straight-forward fashion.
IV. Case 2: Frank’s Foods, Inc.
A. Background
Frank’s Foods, a successful, family-owned, retail grocery business, is located in themain shopping district of Middletown, Pennsylvania. By the mid 1970% with a size of some30,000 square feet, the f’mn had established itself as offering the full range of food andrelated items on a par with stores of the major chains. Annual sales revenue had beengrowing continuously, at an average of some 12.5 percent per year, in the four years priorto the nuclear accident. In the immediate period of the TMI incident and brief closing of thestore, damages amounted to some three days of net profit losses, and spoilage of inventoryof perishable and other items. These very short-run losses were estimated by the f’nm’sownership itself in collaboration with the firm’s accountant, and totaled to some $20,300.
This author’s involvement in the case was enlisted to assess the longer-term impacton the grocery fh’m. As a result of the nuclear incident, the image of Middletown,Pennsylvania as a place to live, had certainly been adversely affected. A study sponsoredby the Nuclear Regulatory Commission in early 1980 showed that 30 percent of the residentswithin a 5 mile radius of the plant had considered moving because of the accident. Thoughout-migration of this scale did not occur, the survey was indicative of a strong change insentiment on the part of local residents. Also, those relocating within the Harrisburg regionas well as those newly-moving to the region were now more likely to avoid the Middletownarea as a place of residence. General information fi’om real estate firms with offices servingMiddletown indicated a significant decline was experienced in referrals from other areas,following the accident.
Data on residential building permits indicated a reluctance to place new homes(including mobile homes) in the Middletown area. Figures were collected on permits issuedfor many of the major municipalities in Dauphin County (including Middletown Borough),and for the county as a whole. Annual averages from these data were calculated for eachmunicipality for the pre-accident period of 1970-78, and for the three available post-accidentyears of 1979-81. While every municipality experienced a slowdown in construction in linewith national trends, the decline by Middletown Borough, from an average of 123 permitsper year prior to 1979 to 11 per yea~from 1979 on, was by far the most dramatic. (SeeAppendix A.)
In sum, there were numerous indications of resistance to the immediate TMI area,including Middletown, as a place of residence. This municipality is the principal source ofcustomers for Frank’s Foods, Inc. To the extent that the population in the borough wassmaller over time than it would have been had the accident at TMI not occurred, the firm

LITIGATION ECONOMICS DIGEST 143
experienced longer-term economic losses due to the incident. In 1982, at the time of thisevaluation, all indications were that business interruption losses would thus continue beyondthe time of appraisal, constituting an "open" type of loss, as defined above. Population datafor Middletown and for comparison areas, which are presented below, suggested long-termlosses of this nature.
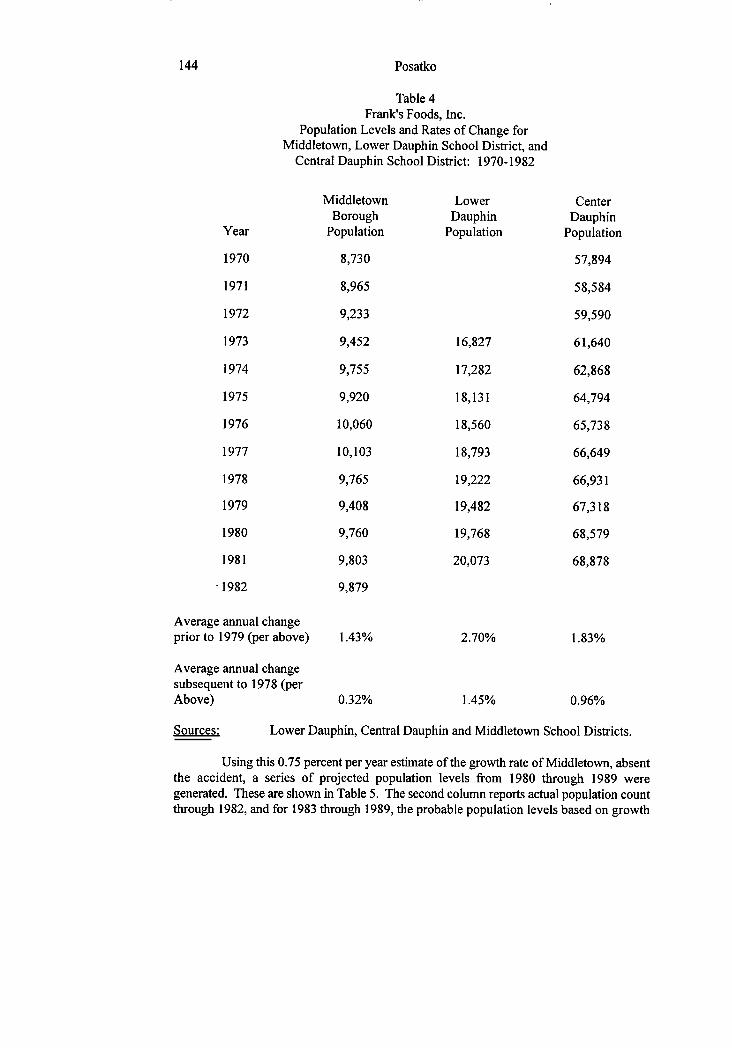
B. Population Trends for Middletown and Comparison Areas: 1970-78 and 1979-82
Table 4 provides population data for Middletown Borough for the period 1970through 1982. These data, as well as those for two other comparable areas, were drawn fromannual springtime census tabulations conducted by school districts throughout Pennsylvania.For the period of 1970 to 1978 (pre-TMI), Middletown experienced growth in populationaveraging 1.43 percent annually. After 1978 the average annual rate of change in populationfell to 0.32 percent. In the same table, comparable population data are shown for the LowerDauphin and Central Dauphin School Districts. All three of these districts serve the functionof being bedroom communities for individuals employed in the greater Harrisburg area, andtheir per capita income levels are similar. For the 1970-78 period, population growth in theCentral Dauphin district averaged 1.83 percent per year, and it averaged 0.96 percent peryear between 1978 and 1981 (1981 was the most recent data year available for the Centraland Lower Dauphin districts at the time of this report). For Lower Dauphin, the data, whichwere available only from 1973 on, indicated 2.71 percent average annual growth from 1973to 1978, and 1.45 percent average growth from 1978 to 1981. Though both districtsexperienced a slowing of population growth, neither exhibited an absolute decline andsubsequent near-leveling as did Middletown. While these two otherwise similar districts after1979 had population growth averaging some 53 percent of pre-TMI levels, Middletown’sgrowth rate after 1979 was initially negative, then positive but minuscule after 1980.Therefore, it was reasonable to estimate that were it not for the TMI accident, Middletown’sgrowth after 1978 would have been about the same 53 percent of its pre-TMI rate. Thisimplies an average population growth of approximately 0.75 percent per year.
144 Posatko
Table 4Frank’s Foods, Inc.
Population Levels and Rates of Change forMiddletown, Lower Dauphin School District, and
Central Dauphin School District: 1970-1982
Middletown Lower CenterBorough Dauphin Dauphin
Year Population Population Population
1970 8,730 57,894
1971 8,965 58,584
1972 9,233 59,590
1973 9,452 16,827 61,640
1974 9,755 17,282 62,868
1975 9,920 18,131 64,794
1976 10,060 18,560 65,738
1977 10,103 18,793 66,649
1978 9,765 19,222 66,931
1979 9,408 19,482 67,318
1980 9,760 19,768 68,579
1981 9,803 20,073 68,878
1982 9,879
Average annual changeprior to 1979 (per above) 1.43% 2.70% 1.83%
Average annual changesubsequent to 1978 (perAbove) 0.32% 1.45% 0.96%
Sources: Lower Dauphin, Central Dauphin and Middletown School Districts.
Using this 0.75 percent per year estimate of the growth rate of Middletown, absentthe accident, a series of projected population levels from 1980 through 1989 weregenerated. These are shown in Table 5. The second column reports actual population countthrough 1982, and for 1983 through 1989, the probable population levels based on growth

LITIGATION ECONOMICS DIGEST 145
rates after the accident (0.32 percent per year). The third column then represents theestimated loss in population in Middletown due to the accident, which served as the basisfor computing the sales loss to Frank’s Foods. At the time of this analysis, officials at TMIestimated that it would be 1988 or 1989 before the work of clean-up and repair of thedamaged reactor was completed. Thus, the appeal of Middletown as a residential locationwas assumed to be impaired at least until that point in time, and therefore sales losses wereestimated through the year 1989.
C. Sales and Profit Losses to Frank’s Foods: 1980-1989
As shown in Appendix B, a computation was made of the annual number of storecustomers per person living in Middletown. For the years 1978 through 1981 this ratioremained relatively constant, and averaged 66.46. Thus, this figure was utilized inprojecting the magnitude of customer losses over the period of 1982 to 1989. For the years1980 and 1981 slightly different values, reflecting the actual ratios for these years, wereused. Certainly not all customers of Frank’s Foods were Middletown residents. Based onoccasional surveys and personal knowledge of their clientele, ownership estimated that 40percent of the store’s customers came from outside of the borough. Hence, the above ratiowas adjusted (multiplied) by a factor of 60 percent. The resulting number (66.46 x .6 39.87) provides the number of customer visits by Middletown residents per person in theborough of Middletown. This suggests that for a family of 4, approximately 160 visits weremade to the store per year, or about I visit every 2.3 days. This is a reasonable frequencyin view of Frank’s proximity to the population and the large amount of "walk-in" trade thestore had experienced.
The next step was to place a dollar value on the sales which would have beenrealized from the additional population. Average purchases per customer for 1980 and 1981were $13.18 and $12.97, respectively. For the years 1982 through 1989 a rounded $13 percustomer transaction was used in forming the loss computation. Thus, the yearly impactsof the TMI accident on gross sales at Frank’s beginning with the first full year after theaccident (1980), were calculated as shown in Table
Accounting records of the finn indicated that gross profit as a percentage of grosssales had averaged 21.14 percent over the period of 1978 to 1982, and presumably was notaffected by the TMI incident. It was assumed that this same gross profit percentage wouldhave been realized on the lost sales due to TMI. In turn, virtually all of the added grossprofit would have accrued as net(pre-tax) profit to the finn. This is the case because suchmodest additional volumes of business (representing about 1 percent of sales in 1980)would not have triggered significant added costs; the firm’s labor, utility, advertising, andother operating costs would remain essentially unchanged. Thus, the resulting loss of netprofit to Frank’s Foods was estimated at 20 percent of the loss in yearly gross sales. For thetwo years prior to completion of this report in late 1982 (1980 and 1981) the lost profit was$33,883. For the years 1982 through 1989 losses in net profit were effectively computedin present value terms as of 1982 (see Table 6 note) and sum to $281,442.

146 Posatko
Table 5
Frank’s Foods, Inc.Projections of Middletown Population
Population ofProjected Population Middletown - as Affected Population Loss
of Middletown - by TMI Accident Due to TMIYear Absent TMI Accident (actual population )* Accident
1979 9,838 9,408
1980 9,912 9,760 152
1981 9,986 9,803 183
1982 10,061 9,879 182
1983 10,137 9,910 (est.) 227
1984 10,213 9,942 (est.) 271
1985 10,289 9,974 (est.) 315
1986 10,367 10,006 (est.) 361
1987 lO,444 1o,038 (est.) 406
1988 10,532 10,070 (est.) 453
1989 10,602 10,102 (est.) 500
Population figures for 1983 through 1989 are based on a 0.32 percent per year growthrate, the average growth rate in the post accident period through the year 1982, the lastyear for which data were available at the time of this analysis.

LITIGATION ECONOMICS DIGEST 147
Table 6Frank’s Foods, Inc.
Losses in Population and Sales
Year
# of MiddletownMiddletown Customer VisitsPopulation Per Year Per Average Loss inDifferential Middletown Expenditure Per GrossDue to TMI Resident Customer Sales*
1980 -152 x 38.30 x $13.18 $76,729
1981 -183 x 39.05 x 12.97 92,685
1982 -182 x 39.87 x 13.00 94,332
1983 -227 x 39.87 x 13.00 117,656
1984 -271 x 39.87 x 13.00 140,462
1985 -315 x 39.87 x 13.00 163,268
1986 -361 x 39.87 x 13.00 187,110
1987 -406 x 39.87 x 13.00 210,434
1988 -453 x 39.87 x 13.00 243,794
1989 -500 x 39.87 x 13.00 259,155
Total Loss in Gross Sales $1,576,625
Future dollar values in this column (for the years 1983 through 1989) were neitheradjusted upward for the inflation in product prices which would occur, nor discountedto factor out the time value of money (i.e., the interest rate). It was assumed these twofactors would approximately offset each other.
IV. Conclusions
The conventional and widely-used business interruption model served well as ageneral framework for determining losses in the two cases described above. In each case,however, relatively unique data sources were drawn upon for estimating the most difficultcomponent of such business loss appraisals, namely, the "but-for" estimate of revenue. Inthe auto dealership case, the yardstick measure derived from average national dealer salesproved to be a credible predictor for this purpose. Such trade association data mayconstitute a fruitful source of information for forensic economists undertaking similarforecasts in other retail, wholesale or production activities. The author also notes that theuse of a large visual exhibit of the actual vs. projected sales, shown in Figure 1, served quite

148 Posatko
effectively in the courtroom presentation of this case.Damages to the grocery store (beyond the immediate closing and spoilage losses)
were seen as longer-term and "open," in effect constituting a delayed and cumulatingconsequence of the accident, as reduced population growth affected sales. Projection of lostsales in this case was by nature more speculative than that of the first case. Both the qualityand time-length of school census population data used for estimating lost revenue were ofsome concern. Ultimately, the estimate of a 500 person, or 5 percent, dampening in thepopulation of Middletown by a point ten years after the accident seemed within the boundsof reasonableness.
A related issue was whether there might be continuing, though perhaps diminishing,losses which extended beyond the damages described in this paper, generating some loss ingoing concern value for the subject firms. In the TMI litigation, the court in most casesruled out consideration of losses beyond 1983, and thus effectively denied compensation forloss in value resulting from future earnings losses. Aside from the calculation of grocerystore losses over the 1982 to 1989 period, no loss in value from future profit reductions wasdeveloped in this author’s work. If, prior to settlement, either of the firms had been sold, orwas under sales negotiations, loss in value would have been raised as an issue and givenconsideration by the court. Speculation about more permanent damage to firms in theMiddletown area (and loss in value) presumably would have hinged on the absence of eventual "decay" in the health concerns and negative image of the Middletown area as aretail location. Both enterprises, of course, had the opportunity in the long run to mitigateany expected longer-term losses through relocation, or the opening of satellite locationsaway from the original places of business.

LITIGATION ECONOMICS DIGEST 149
Appendix AFrank’s Foods, Inc.
Building Permits in Major Municipalities of Dauphin Countyand Dauphin County: 1970-1978 and 1979-1981
Ratio of 1979-Annual Average Annual Average 1981 Average to
Number of Permits Number of Permits 1970-1978Issues 1970-1989 Issues 1979-1981 Average
Derry Township 157.3 64.3 0.41
Harrisburg City 69.0 41.0 0.59
Hummelstown 15.3 10.3 0.67Boro
Lower Paxton 644.2 278.3 0.43Township
Lower Swatara 59.2 39.3 0.66Township
Londonderry 26.4 16.0 0.61Township
South Hanover 53.5 35.6 0.67Township
Steelton Boro 21.8 9.6 0.44
Swatara Township 202.2 90.3 0.45
West Hanover 52.2 33.3 0.64Township
Dauphin County 1837.2 883.3 0.48
Middletown 123.6 11.3 0.09Borough
Source: Tri-County Regional Planning Commission, Harrisburg, Pennsylvania

150 Posatko
Appendix BFrank’s Foods, Inc.
Projections of Customer Visits asRelated to the Population of Middletown
YearNumber of Middletown
Customer Visits Population
Ratio of Numberof Customer Visitsto Population of
Middletown
1978 659,202 9,765 67.50
1979 652,950 9,408 69.40
1980 622,987 9,760 63.83
1981 638,105 9,803 65.09
Average for 66.461978-1981
References
Choices for Pennsylvanians, Technical Report of the Pennsylvania State Planning Board,Harrisburg, PA, December 1980.
Dunn, Robert L., Recovery of Damages for Lost Profits, 3ra ed. Kentfield, CA: Lawpress,1989.
Foster, Carroll B., Robert R. Trout and Patrick A. Gaughan, "Losses in CommercialLitigation;" Journal of Forensic Economics, Fall 1993, 6 (3), 179-196.
Plummer, James and Gerald McGowin, "Key Issues in Measuring Lost Profits," Journal ofForenstc Economics, Fall 1993, 6 (3), 231-239.
Regional Economic Update, "Unemployment Rate Characteristics of Metropolitan AreaEconomies," PNC Bank Corp., Economics Division, Pittsburgh, PA, Autumn 1995.
Trout, Robert R. and Carroll B. Foster, "Economic Analysis of Business InterruptionLosses," in Litigation Economics, edited by Patrick Gaughan and Robert J. Thornton,Greenwich, CN: JAI Press, 1993.