economic analysis of the saginaw bay coastal …whiteheadjc/research/saginaw/sagreport.pdfeconomic...
TRANSCRIPT

Economic Values of Saginaw Bay Coastal Marshes With a Focus on Recreational Values
March 20, 2006
Southwick Associates, Inc. P.O. Box 6435
Fernandina Beach, FL 32035
Authors: John C. Whitehead, Ph.D. and Peter A. Groothuis, Ph.D.
Department of Economics Appalachian State University Boone, North Carolina 28608
Rob Southwick and Pat Foster-Turley, Ph.D.
Southwick Associates, Inc. P.O. Box 6435
Fernandina Beach, FL 32035
Funded by a grant provided by: * Ducks Unlimited, Inc., Great Lakes/Atlantic Regional Office
* National Fish and Wildlife Foundation * U.S. Environmental Protection Agency, Great Lakes National Program Office, Great Lakes
Grants Program * Michigan Department of Environmental Quality
ii
Acknowledgements This project was only possible thanks to the funding, support and information provided by many. A special thank you is extended to David Brakhage of Ducks Unlimited for his significant help with funding, coordination with various state and federal agencies, and assistance in securing many information sources. Major funding for this project was provided by the U.S. Environmental Protection Agency’s Great Lakes National Program Office and Ducks Unlimited. Additional support was provided by the National Fish and Wildlife Foundation, Michigan Department of Environmental Quality’s (DEQ) Coastal Management Program and Land and Water Management Division. Matching funds were provided by Ducks Unlimited. A thank you is extended to Karen Rodriguez and Peg Bostwick for assisting with funding. The authors also wish to thank Robert Page of Ducks Unlimited for his GIS assistance and Carol Bambery of the Michigan Department of Natural Resources for her help and guidance securing survey lists. Special credit also goes to Matt Smar, Cathie Cunningham Ballard, Wil Cwikiel, Jennifer McKay, Jim Bredin, Dave Kenaga, and many others too numerous to list. Regardless of the many contributions of the people mentioned here, the authors remain responsible for the contents herein.

iii
Table of Contents
Page #: Acknowledgements ii Executive Summary iv Overall Findings iv Literature Review Analysis vi Questionnaire Survey Analysis vii Economic Analysis viii Conclusions x Introduction 1 Summary Literature Review 2 Survey Methods 4 Summary 4
Methodology 4 Response Rate 6
Survey Design and Results 7 Summary 7 Introduction 8 Knowledge and Recreation Experience 8
Attitudes about Competing Uses of Coastal Marsh 11 Willingness to Pay 14
Socio-Economic Variables 18 Data Analysis: 22 Summary 22 Introduction 23
What Determines Knowledge and Attitudes? 23 Recreation Demand 25 Willingness to Pay 31
Aggregate Benefits of Coastal Marshes 34 Summary 34 Introduction 34 Aggregation over time 34
Aggregate Benefits 35 Conclusions 38 References 40 Appendix A: Sample of Survey Questionnaire 43 Appendix B: Literature Review 50 Appendix C: Terms Used in this Report 62

iv
Executive Summary
What is the value of Saginaw Bay coastal marshes? If this question is asked of one hundred people in the Bay area, there might be 100 different answers. Those with an ecological perspective would talk about nutrients and productivity, hunters and anglers would talk about migratory bird and fish habitats, and water resource managers would talk about storm water storage and water purification. Others with a more pragmatic bent would talk about the value of good soil and water for agriculture, or the value of waterfront property for urban development. Some would value Saginaw Bay wetlands for purely aesthetic reasons entirely. Although most everyone believes that Saginaw Bay coastal marshes have some sort of value, this study tries to monetarily quantify this value using technically robust economic tools, while explaining the results in a way that is understandable to the public.
Although many researchers study and write about the various biological and ecological contributions of Midwest coastal wetlands, attempts to quantify these in dollar figures are few and far between. This project addresses this gap in information in an effort to help guide efforts related to coastal marsh conservation.
Overall Findings
Results of this project were obtained primarily through a detailed analysis of a mailed questionnaire survey and an extensive literature search of other economic assessments of wetland resources. Overall results tables are presented here, with a more detailed discussion of the analyses used in following sections.
Primarily relying on analysis of a questionnaire survey, this project has shown that, for the general public and licensed anglers and hunters, Saginaw Bay coastal marshes have significant recreational and intrinsic values, summarized in Table E-1. These values represent the personal value people receive from their recreation activities and not the value of their expenditures made in course of their activities. Such retail expenditures can be much higher. Table E-1: Recreation and Passive Use Values of Saginaw Bay Coastal Marshesa
Annual Present Value Scenario Total Per Acre Total Per Acre A. Value of Saginaw Bay coastal marsh
for active recreational use $15.9 million $239 millionb B. Total value of protecting an additional
1,125 acres, based on willingness to make a voluntary contribution for protection of this acreage (includes both recreational use and other values) $207,000 $183 $4.05 million $3,596
Recreational value of protecting an additional 1,125 acres $94,000 $83 $1.83 milliona $1,627
Passive (non-recreational) values of protecting an additional 1,125 acres of marsh $113,000b $100 $2.2 million $1,969
a These values only reflect the personal values derived by recreational use of coastal marshes and the values held by people for the opportunity to use coastal marshes and their ecological services. These do not include the actual values of the various ecological services themselves, such as water filtration, fish production, and more.
bCalculated with a 3% discount rate.
v
As indicated in the summary table, the residents who responded to the questionnaire
believe that Saginaw Bay coastal marshes have an annual recreational use value of $15.9 million dollars; or a lifetime recreational value of $239 million for all of the residents of the region. (See Section A of Table E-1).
Those responding to the questionnaire were also asked what they would be willing to contribute, voluntarily, to the protection of an additional 1,125 acres of coastal marsh, and how much more their recreational experience would be worth given the availability of this additional acreage. By evaluating their responses, the research team was also able to estimate the economic worth of coastal marshes to the public for non-recreational (passive) values. Protection of additional wetlands was perceived as adding $1,627 per acre to the recreational value of the marshes, for each recreational user. However, given that the total additional value was $3,596 per acre, the non-recreational or passive values to the public were estimated to be $1,969 per acre, over the lifetime of the resident. Thus, the “willingness to pay” for additional protection results show that the public places a total value of $2.2 million on Saginaw Bay wetlands for values not associated with their direct recreational use. What these passive values are perceived to be probably differs from person to person, but might include such things as aesthetics, nesting habitat, or shoreline protection, to name a few examples.
The total value of coastal wetlands based on the “willingness to pay” for voluntary
protection is $3,596 per acre, per person, over the lifetime of a resident from this region. Based on this willingness of residents to contribute to wetland protection alone, the passive and recreational values of Saginaw Bay coastal marshes are estimated to be worth $4.05 million. As these marshes are lost, all of these values are lost too.
The value of wetlands for recreational use is the focus of the questionnaire study, but this
only presents a small proportion of the true value of wetlands to area residents and the globe at large. It was beyond the scope of this project to address these ecological values individually in depth, but other researchers have attempted to do so for various wetlands worldwide. Ecologists, governmental officials, conservationists and many members of the public at large recognize that the value of wetlands include many factors such as erosion control, storm and flood protection, climate control, wildlife habitat and spawning grounds, and even aesthetic appeal to those passive users who enjoy watching the sunset over a marsh. Economists, however, have had a uniformly difficult time quantifying these values in cold, hard numbers. Despite the difficulties, however, a number of researchers have tried to assess these values for particular sites. Others have taken these multiple studies and performed detailed analyses to extract useable summary numbers. Results of a number of these summary studies are presented in Table E-2.

vi
Table E-2: Estimated values of freshwater wetlands per acre from academic literature Service Value/unit/yr (base year) Value/acre/yr (yr. 2005 $) Flood * $393/acre $594.16 Quality* $417/acre $630.45 Quantity* $127/acre $192.01 Recreational fishing* $357/acre $539.73 Commercial fishing* $778/acre $1,176.23 Bird Hunting* $70/acre $105.83 Bird Watching* $1,212/acre $1,832.37 Habitat* $306/acre $462.63 Species/habitat protection** $249.44/acre $286.23 Freshwater marsh*** $145/ha+ $67.36 Food production**** $47/ha+ $25.39 Habitat/refugia**** $439/ha+ $237.07 Recreation**** $491/ha+ $265..15 Total ecosystem services**** $19,580/ha+ $10,573.20 Saginaw Bay commercial $114.36 $172.90
Fishing data ^ * Mean values from Woodward and Wui, 2001 (1990 $) ** Mean values from Kazmierczak, 2001a (2000 $) ***Median value for freshwater marshes worldwide from Schuyt & Brander, 2004 (2000 $, per ha) ****Average value for swamps/floodplains from Costanza et al, 1997 (1994 $, per ha) ^ Mean values for commercial fish catch, 1983-85 from Amacher et al (1989) calculated by Woodward and Wui (2001) in 1990 $ + base values in hectares converted to values/acre for 2005 dollars
The numbers in the above table were attained using various valuation techniques and
cannot simply be added to find the total value/acre/year for these wetlands. The analyses of Woodward and Wui (2001), and Schuyt and Brander (2004) for instance, were both “meta-analyses” from scores of different studies using a variety of different economic measures and complex statistical techniques to compare them Similarly, the Kazmierczak ( 2001a) report analyzed many primary data sources that each used a variety of different economic valuation methods to come up with summary numbers. The study by Costanza et al. (1997) took a global overview of different biomes, but also used a variety of different types of data sources, and then held a week long workshop with experts to sort out and summarize the findings. Thus, the numbers in the above table are different versions, synthesizing sometimes the same data sets, and breaking these out in different ways. The complexity and multiplicity of these analyses made them nearly impossible to compare directly, or even to add up in a simple fashion. It is difficult to say how closely any of these figures relate to the particular situation of Saginaw Bay.
Literature Review
The literature search component of this study is highlighted in Table E-2 and presented in its entirety in Appendix B. A summarized version is presented in the main body of this report. Various economic studies of worldwide and Midwest coastal wetlands date back to at least 1978. A number of economists have grappled with various ways of defining the dollar value of coastal wetlands in various locations around the world; and, not surprisingly, depending on the location and the economic tools applied, the results differ widely. Most agree that studies of particular

vii
locations have the most utility for conservation planning activities. Only a spare handful have looked closely at Saginaw Bay wetlands, beginning with a pioneering study of the value of fish, wildlife and recreation of Michigan’s coastal wetlands conducted by a team from Eastern Michigan University for the Michigan Department of Natural Resources (Jaworski and Raphael, 1978). Unfortunately, now, these data are too old to be reliable. More recent Midwest coastal studies include a travel cost analysis for three small hunting sites (van Vuuren and Roy, 1993) and a study of the value for commercial fisheries (Amacher, et al, 1989).
Fortunately, there are a number of studies in the academic literature that attempt to
estimate the value of freshwater wetlands per acre on a national or global scale. Woodward and Wui (2001) performed a meta-analysis of published U.S. wetlands valuation studies for a number of services including flood control, water quantity and quality, hunting, fishing, wildlife watching, amenities, etc. Kazmierczak (2001a) provided similar values per acre for species and habitat protection services. Schuyt and Brander (2004) and Costanza (1997) estimated wetlands values for a number of services from global studies.
Questionnaire Analysis
Because of the difficulties of comparing different studies based on different techniques and from different geographical regions, much of the analysis for this current project came from the results of questionnaire surveys. These surveys were mailed to a randomly chosen sample from two groups: 1) licensed anglers and hunters and 2) the general public residing within the Saginaw Bay watershed, many of whom turned out to be anglers and hunters, themselves. A detailed discussion of the survey method is presented in the full document to follow.
The survey revealed the fact that 60% of the general public and 73% of the licensed anglers and hunters reported visiting the Saginaw Bay or coastal marsh area for outdoor recreation, primarily fishing, but also for other reasons such as boating, beach-going, nature observation, hunting, and a variety of other activities. The general public took an average of 10 trips per year while anglers and hunters took 11.. Bay County was the most important recreation destination for both groups. Despite their visits to the area, about two-thirds of the respondents professed to know little or nothing about the watershed or coastal marshes. Males, members of conservation/environmental groups, shoreline property owners and those in the license sample professed to know the most about the watershed and coastal marshes. Those with higher education also said they knew more about the watershed, but surprisingly not as much about the coastal marsh.
Attitudes towards conservation of Saginaw Bay coastal marshes were fairly uniform for both the general public and for the licensed hunter/angler groups, with most agreeing that recreation and tourism was important, as was agricultural development, and with less than one third agreeing that urban development was important. Both groups felt that water quality improvements provided by coastal marshes were important. Specifically, 79% and 76% of the general population and licensed hunters/anglers felt water quality improvements from coastal marshes were very important. By adding in those who felt water quality improvements were ‘somewhat important,’ the figures increase to 96% for both groups.
viii
One subset of the overall survey group varied significantly from the rest with more positive value given to waterfowl nesting and feeding areas, fish feeding and spawning areas, erosion control and water quality. These respondents identified themselves as belonging to a conservation/environmental group, and made up about a third of the survey sample. Although about 90% of all respondents believed that storm water retention and flood control was, at least, a somewhat important use of coastal marshes, no factor was found to explain the variation in responses on this subject.
Economic Analysis
The concept known as economic value measured the net benefit people receive from an activity, product or service after all expenses are paid. Two variations of the travel cost method were used to estimate the recreation values of Saginaw Bay coastal marshes. The first variation, the single-site travel cost method, estimated the factors that influence the number of recreation trips, such as the costs of travel. The typical recreational trip to coastal marshes in the Saginaw Bay area cost the participant about $90 in travel costs. When the single-site model was used to calculate the economic value of trips, on a county-by-county basis, the lowest value of $26 was found for trips to Bay County and the highest at $51 for trips to Tuscola County. The divergence in values was due to the fact that Bay County is nearer to population centers and Tuscola County is more remote. Recreationists from the population centers who travel to Tuscola County spend more time and money and, therefore, reveal a higher value for those trips.
The second variation, which was the site-selection travel cost method, estimated the
factors that influence the particular recreation site chosen. Using the site-selection model, the value of a Bay County access site was recorded as $14/trip, compared to only a little more than $2 for an access site in Tuscola County. The divergence in values was due to the fact that most of the typical trips occurred in Bay County, due to its close proximity to population centers. As an interesting finding of the project, survey respondents did not value the size of coastal marshes, or any potential increase in the size, nearly as much as access to recreational opportunities on the marsh.
The contingent valuation method was used to estimate the value of coastal marshes with respondents’ avowed “willingness to pay” a one time donation to a hypothetical “Saginaw Bay Coastal Marsh Trust Fund”. In a carefully controlled survey, with multiple questionnaire versions sent to random segments of the study population; 25% of the general public and 27% of the licensed angler/hunters reported that yes, they would contribute, depending on the amount requested. A majority of both study populations would donate $25 but only about 20% would give $150. On average, respondents were willing to make a one-time donation of $72 to protect 1,125 acres of coastal marsh. When asked how much they would be willing to give, without being offered a set dollar amount, the average maximum donation was $64 for the general public and $62 for licensed angler/hunters. People who live further from substitute, or alternate, recreation sites and members of conservation and environment organizations were more willing to pay something to protect coastal marshes.
When these responses were analyzed, an interesting finding emerged. The willingness to pay values, when studied in conjunction with the travel cost variables, indicated that the survey-

ix
takers were willing to pay for concerns other than recreational use of the marsh. Thus, the respondents were motivated by altruistic concerns, such as bequests to future generations, interest in aesthetic values and ecological integrity and other factors not connected to their own direct use of the resource.
All of the information collected during the survey, in addition to data on extent of wetland acreage per county, the number of households in the study region, and Census Bureau population statistics, were evaluated using three different economic methods. Each approach required a specific set of assumptions (defined in the full report); but, those used in the analysis were conservative. So, with this conservative approach, the actual numbers may well be higher than reported here.
Two approaches were used to answer the question of the recreation value of Saginaw Bay marshes. The first method, known as the single site travel cost model, estimated the recreation value of all day trips to the coastal marsh for all counties at $12 million per year, with another $3.7 million in value for overnight trips. The most trips—and the most value—accrued to Bay County, with the other counties that are more distant from population centers providing less value. The discounted present value, which represents the value as of 2005 for all future recreation trips to Saginaw Bay coastal marshes, was $239 million.1
Another method used to measure the recreational value of coastal marshes was the site
selection model. This approach calculated the value held by each recreationist for an increase of 1,000 acres of coastal marsh. By this analysis, each acre of coastal marsh was worth $83 per year to recreationists and far more for all years during the lifetime of the respondents. An increase of 1,125 acres of marsh had a present value of $1.83 million, or $1,627 per acre.1
Another approach was used, the contingent valuation method. This approach measured
the passive, or non-use, values people hold for coastal marshes. These values include the opportunity to use the marsh in future, or knowing others have such opportunities. Passive use values also included value placed on the various ecological and altruistic benefits provided by coastal marshes. The most conservative approach, used to adjust for the low survey response rate and the 51% of respondents willing to donate to coastal marsh conservation, yielded an average value of $710 per acre. The least conservative aggregation rule, though, when 51% of the entire population was considered, yielded a much higher value of $3,227 per acre. The true aggregate value was impossible to know for certain, using this or any other economic tool at present. But the midpoint, $1,969/acre, was our best estimate of the public’s willingness to pay to protect an acre of coastal marsh.
While this study rigorously developed some estimates of values of Saginaw Bay coastal marsh, there are several areas that require further study. First, the aggregate values were limited to the five county area surrounding Saginaw Bay. Residents of the rest of Michigan and elsewhere might have placed additional value on the functions of these coastal marshes. A recreation and passive use valuation survey with a larger geographic focus would illuminate these additional values. Second, our study focused on the recreational and passive use values of coastal marsh using the travel cost and contingent valuation methods. Substantial values might 1 Calculated using a 3% discount rate.

x
have accrued to lakeshore and coastal marsh-adjacent property owners. The hedonic price method, which was used to relate housing and land characteristics to housing prices, could be used to estimate the value of marsh protection to property owners. In addition, the values of the various ecological services provided by coastal marshes have only received limited research attention. A look into the ecological services provided specifically by Saginaw Bay coastal marshes would provide more definitive information.
Conclusions
Residents of Saginaw Bay have been shown to value the coastal marshes not only for the recreational values of hunting, fishing, and various passive uses, but also for other difficult-to-measure intrinsic values. What is not as yet clear is how much the continued loss of wetlands habitat will cost residents in increased energy bills, storm protection needs, water quality deterioration and other associated costs that wetlands help mitigate for those living in surrounding areas. If these wetlands are not protected adequately, millions of more dollars will be needed to replace the ecological services provided by wetlands. The costs of additional waste water treatment facilities, erosion and flood control structures, fish hatcheries and other engineered solutions will be far greater than any money spent in advance to protect the wetlands that now provide these services naturally.

xi
Map E-1: Wetlands in the Saginaw Bay Watershed, Including Coastal Wetlands

1
Introduction
This project quantified the per-acre and per-trip economic values associated with Saginaw Bay coastal marshes. A scientific literature review was initially conducted to provide background information and guidance in the design of this project. A questionnaire survey was then designed, disseminated and thoroughly analyzed using a variety of economic tools. The purpose of this report is to elucidate the values and importance placed on coastal marshes to help guide efforts related to coastal marsh conservation. The following organizations cooperated in making this project happen:
Ducks Unlimited, Inc., Great Lakes/Atlantic Regional Office, the National Fish and Wildlife Foundation the U.S. Environmental Protection Agency, Great Lakes National Program Office, Great
Lakes Grants Program, and the Michigan Department of Environmental Quality
Each section within the main body of the report is also preceded with a summary in layman’s
terms that may help the non-economist to interpret the study. In addition, key terms related to this project, including a number of economic terms that might be unfamiliar to the general reader, are defined in Appendix C.
The overall layout of the report has a number of components. First, the study methodology is
described, including the details of the survey technique. Next, the demographics of the survey respondents, the survey results, and the analysis of a number of independent variables in the survey are reported and discussed. This is followed by a section that presents an in-depth analysis and discussion of the results using a number of economic models for comparison. The next section analyzes and demonstrates the aggregate values of Saginaw Bay wetlands acreage. The concluding section presents summary numbers that we hope will be easily utilized by those who will be referencing this paper.
Copies of the survey instruments used to produce this project’s raw data are presented in
Appendix A, the technical paper review that preceded the survey study is presented in Appendix B and definitions of technical economic terms used in this report are presented in Appendix C.
2
Literature Review Summary
Introduction
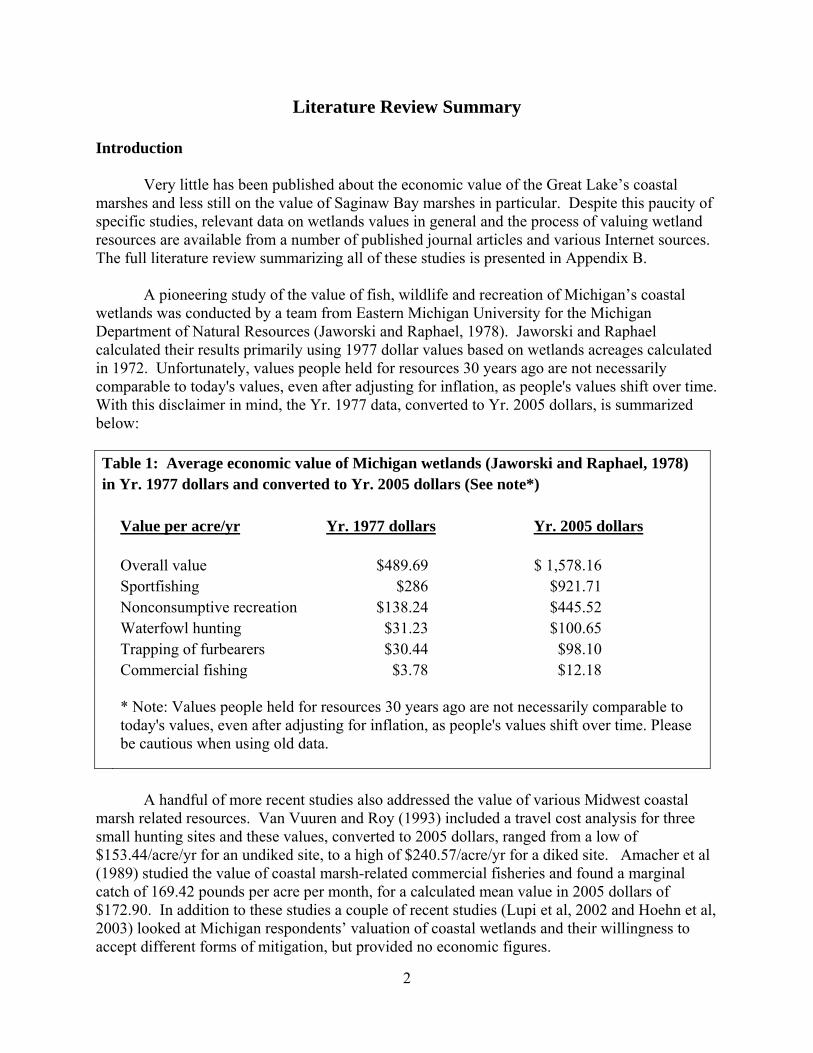
Very little has been published about the economic value of the Great Lake’s coastal marshes and less still on the value of Saginaw Bay marshes in particular. Despite this paucity of specific studies, relevant data on wetlands values in general and the process of valuing wetland resources are available from a number of published journal articles and various Internet sources. The full literature review summarizing all of these studies is presented in Appendix B.
A pioneering study of the value of fish, wildlife and recreation of Michigan’s coastal wetlands was conducted by a team from Eastern Michigan University for the Michigan Department of Natural Resources (Jaworski and Raphael, 1978). Jaworski and Raphael calculated their results primarily using 1977 dollar values based on wetlands acreages calculated in 1972. Unfortunately, values people held for resources 30 years ago are not necessarily comparable to today's values, even after adjusting for inflation, as people's values shift over time. With this disclaimer in mind, the Yr. 1977 data, converted to Yr. 2005 dollars, is summarized below: Table 1: Average economic value of Michigan wetlands (Jaworski and Raphael, 1978) in Yr. 1977 dollars and converted to Yr. 2005 dollars (See note*) Value per acre/yr Yr. 1977 dollars Yr. 2005 dollars Overall value $489.69 $ 1,578.16 Sportfishing $286 $921.71 Nonconsumptive recreation $138.24 $445.52 Waterfowl hunting $31.23 $100.65 Trapping of furbearers $30.44 $98.10 Commercial fishing $3.78 $12.18
* Note: Values people held for resources 30 years ago are not necessarily comparable to today's values, even after adjusting for inflation, as people's values shift over time. Please be cautious when using old data.
A handful of more recent studies also addressed the value of various Midwest coastal marsh related resources. Van Vuuren and Roy (1993) included a travel cost analysis for three small hunting sites and these values, converted to 2005 dollars, ranged from a low of $153.44/acre/yr for an undiked site, to a high of $240.57/acre/yr for a diked site. Amacher et al (1989) studied the value of coastal marsh-related commercial fisheries and found a marginal catch of 169.42 pounds per acre per month, for a calculated mean value in 2005 dollars of $172.90. In addition to these studies a couple of recent studies (Lupi et al, 2002 and Hoehn et al, 2003) looked at Michigan respondents’ valuation of coastal wetlands and their willingness to accept different forms of mitigation, but provided no economic figures.

3
Outside of the Midwest coastal marsh studies described above, scores of studies have
been done trying to assess the economic value of various wetlands worldwide using a myriad of different valuation techniques and addressing many different wetlands components for wetlands with highly varied characteristics. Not surprisingly, the numbers reported in these studies vary widely and are difficult to compare in any meaningful way. Fortunately, despite the inherent difficulties, in recent years a number of economists and ecologists have attempted to summarize the existing wetlands valuation literature and begun to search for commonalities and other attributes that can be more widely applied (Costanza et al, 1997; Heimlich et al, 1998; Woodward and Wui, 1997; Kazmierczak, 2001a; Kazmierczak, 2001b; Schuyt and Brander, 2004). As with the original documents, however, these studies all have taken different approaches to summarizing existing data, and have put different slants on their findings. Relevant general findings from these studies are summarized in Table 2 and converted to 2005 dollars for comparison. Table 2: Estimated values of freshwater wetlands per acre from academic literature
Service Value/unit/yr (base year) Value/acre/yr (yr. 2005 $) Flood * $393/acre $594.16 Quality* $417/acre $630.45 Quantity* $127/acre $192.01 Recreational fishing* $357/acre $539.73 Commercial fishing* $778/acre $1,176.23 Bird Hunting* $70/acre $105.83 Bird Watching* $1,212/acre $1,832.37 Habitat* $306/acre $462.63 Species/habitat protection** $249.44/acre/yr $286.23 Freshwater marsh*** $145/ha/yr+ $67.36 Food production**** $47/ha/yr+ $25.39 Habitat/refugia**** $439/ha/yr+ $237.07 Recreation**** $491/hayr+ $265..15 Total ecosystem services**** $19,580/ha/yr+ $10,573.20 Saginaw Bay commercial $114.36 $172.90
fishing data ^ * Mean values from Woodward and Wui, 2001 (1990 $) ** Mean values from Kazmierczak, 2001a (2000 $) ***Median value for freshwater marshes worldwide from Schuyt & Brander, 2004 (2000 $, per ha)+ ****Average value for swamps/floodplains from Costanza et al, 1997 (1994 $, per ha)+ ^ Mean values for commercial fish catch, 1983-85 from Amacher et al (1989) calculated by Woodward and Wui (2001) in 1990 $ +Note: Base yr values in hectares/yr converted to 2005 value/acre/yr
The present project made use of these findings and techniques to develop a current and more specific set of values for Saginaw Bay coastal marshes.

4
Survey Methods
Summary
Questionnaire surveys were mailed to two samples of the population: randomly selected licensed anglers and hunters and randomly selected members of the general public within the Saginaw Bay watershed. The surveys all contained a variety of uniform questions concerning the respondents’ interest in and knowledge about the Saginaw Bay coastal marshes and watershed. In order to assess the dollar value of marsh acreage each addressee received one of eighteen different versions of the survey, with differing questions relating to the amount they would be willing to pay for coastal marsh protection for acreage of different sizes. A total of 3600 surveys were mailed in each of three mailing rounds. In order to boost the response rate, in the last round of mailing an incentive award of $1,000 was offered for dividing among randomly selected respondents. In the end, 704 usable surveys were obtained for an overall response rate of 22.2%. Adjustments were made in the data analysis process to account for any non-response bias attributable to this low response rate.
Methodology The survey was evenly divided into two major categories, licensed sportsmen (anglers and hunters) and general public. Three rounds of surveys were sent. Names and addresses of all sportsmen living within the Saginaw Bay watershed (Map 1) were obtained under a special use agreement with the Michigan Department of Natural Resources. From this list, names were randomly selected to receive a survey. A list of randomly selected names from the general public within the Saginaw Bay watershed were obtained from a private mail list company, FMP Direct. Map 1: Counties within the Saginaw Bay Watershed

5
Each respondent received a survey that presented a specific amount of funds that could be solicited to conserve a specific amount of coastal marshes. For survey purposes, this approach required 18 different versions of the survey to be distributed among the recipients. Surveys were presented asking if the respondent was willing to give one of the following dollar amounts to protect coastal marshes: $25, $50, $75, $100, $150 and $200. For each of the dollar “bids” presented, the respondent was asked if they would be willing to spend that amount to help protect one of these three volumes of marshes: 1,125 acres, 2,250 acres and 4,500 acres. Eighteen versions of the surveys were then developed to present all possible combinations of dollars and acres. A copy of the survey is presented in Appendix A. A unique code was assigned and printed to each survey to help track which individual received which version of the survey. Otherwise, the surveys would have been returned anonymously, causing difficulties knowing which survey version to send to a specific individual in follow-up mailings, and difficulties knowing who returned a survey twice. Such duplication would have caused a ‘double counting’ of one individual’s response in the final results. It was suspected this code, which was printed in the upper right corner of each survey’s cover page, impacted response rates. This code was left off in the final, third round mailing.
A modified Dillman survey approach was used. The Dillman mail survey approach involved multiple mailings of survey instruments and postcard reminders in order to increase the response rate and representation of the sample. The first round of surveys was sent on February 22nd, 2005. The second round was sent on March 24th to all who did not respond to the first mailing. After the second round of surveys, the low response rate of 15.8 percent, which included adjustments for non-deliverable surveys, necessitated a third round of surveys. The third round was sent May 10th, with a deadline of June 17th. Each survey was accompanied by a cover letter plus a postage-metered return envelope. This cover letter was signed by Ducks Unlimited; and, based on several comments from the first two rounds, was left out of the third round should some recipients have assumed the survey related to duck hunting. None of the questions on the survey form were edited or changed in any way between the multiple rounds. Ten days after each mailing, a reminder card was sent to all survey recipients.
To help boost the response rate, the third round of surveys included an incentive. Survey recipients were notified that $1,000 would be divided among five winners. First place would win $500, 2nd would win $200, and three survey respondents would win $100 each. It was stated that winners would be randomly selected on June 17th, 2005 to encourage faster response. Winners were randomly selected on June 17th and a check was sent to each winner.
In total, 3,600 people received surveys. For each of the 18 versions of surveys sent to sportsmen, 79 names were randomly selected from the DNR list, for a total of 1,422 surveys. For each of the 18 general public surveys, 121 names were randomly selected for a total of 2,178. Based on past survey experience, a lower response rate was expected from the general public, hence the larger number of surveys needed. Care was taken to ensure an individual only received one version of the survey.

6
Response Rate
At the end of the first two mailings, on May 11th, 512 completed surveys had been received. This accounted for returned unusable responses. Returned surveys were deemed unusable if answers to key questions were left blank. As of this date, 356 undeliverable surveys were returned, yielding an overall response rate of 15.8 percent. The third round therefore consisted of 2,732 surveys, sent May 11th. From the third round, an additional 68 surveys were returned as undeliverable, and a net of 192 usable responses were received. All told, 3,600 surveys were attempted, 424 were undeliverable, and 704 usable surveys were received for a response rate of 22.2 percent.
All efforts were made to obtain a fully random sample of names of the general public,
and to randomly select licensed hunters and anglers for the sportsmen’s mailing. Names for the general public mailing were obtained from a mail list service, who reported names were selected using a random number generator process. Sportsmen’s addresses were randomly selected from the State’s license list by first dividing the number of addresses on the license list by the number of surveys to be mailed. The result was a value of X. Then, starting with the very first name on the list, every Xth record was selected for inclusion in the mailing. Regardless of these efforts, sample bias was a potential problem. The level of sample bias was unknown, but recognizing the low response rate, such bias was likely. Adjustments and provisions were made in the data analysis to account for potential non-response bias and are described herein.

7
Survey Design and Results Summary
The questionnaire survey used in this study presented background information on resource allocation issues in Saginaw Bay, then asked people various questions to see how much they know about the coastal marsh and watershed and how much they would be willing to allocate themselves for further efforts to preserve marshes. Results were broken down for the two survey groups, the general public and licensed hunters and anglers. For most questions, very little difference was found between both groups in their responses, and indeed, about three-quarters of the random general public respondents also said they fish, and a third enjoy hunting, so the groups may not have been that different from one another. Background socio-economic information obtained through the survey typified the respondents as primarily male, white, and middle-aged. About a third of the respondents belonged to conservation or environmental organizations, but only a relative handful owned shoreline property.
Although a majority of respondents visited Saginaw Bay or coastal marshes each year for
a variety of recreational reasons, most reported knowing little or nothing about coastal marshes. Nearly two-thirds of the respondents said that agricultural development is important, but only about a third assigned importance to urban development. Those belonging to conservation/environmental groups were different from all others in their knowledge about the importance of coastal marshes for various ecological functions and were also the most likely to support conservation efforts.
Of the Saginaw Bay coastal counties (see Map 2), respondents were more likely to travel
to Bay County, the closest to population centers, for a recreational experience and least likely to travel to Tuscola County. On average, respondents made about ten recreational trips per year to these coastal regions, spending less than $100 per trip, more for an overnight trip.
Map 2. Coastal Counties Included in the Study and Their Associated Wetlands
To determine the amount that respondents would be willing to pay for coastal marsh
conservation, the fictitious “Saginaw Bay Coastal Marsh Trust Fund” was invented. In different
8
questionnaire versions, respondents were asked if they would pay $A dollars in a one-time-only donation to this hypothetical fund, with various values presented for $A dollars on the forms that different people received. They were also given different versions citing a different amount of acreage to be protected. A number of other safeguards were put in place in qualifying statements and follow-up questions to insure that the most reliable responses were obtained. As predicted, the percentage of people who would pay to support conservation of the marsh decreased as the dollar figure requested increased.
For those readers interested in more technical aspects, further details on the survey design and results follow this summary. A sample of the questionnaire survey is found in Appendix A. Introduction
The purpose of this project was to generate data for use in developing economic values for coastal marsh management. In this section, we describe the survey and analysis. We focus our analysis on estimating the economic value of coastal marsh protection.
The survey describes the Saginaw Bay coastal marsh resource allocation issues, elicits information about coastal marsh-related recreation, inquires about attitudes regarding economic development, describes a coastal marsh protection program and elicits willingness to pay and socio-economic information. A copy of the survey is presented in Appendix A.
Knowledge and Recreation Experience
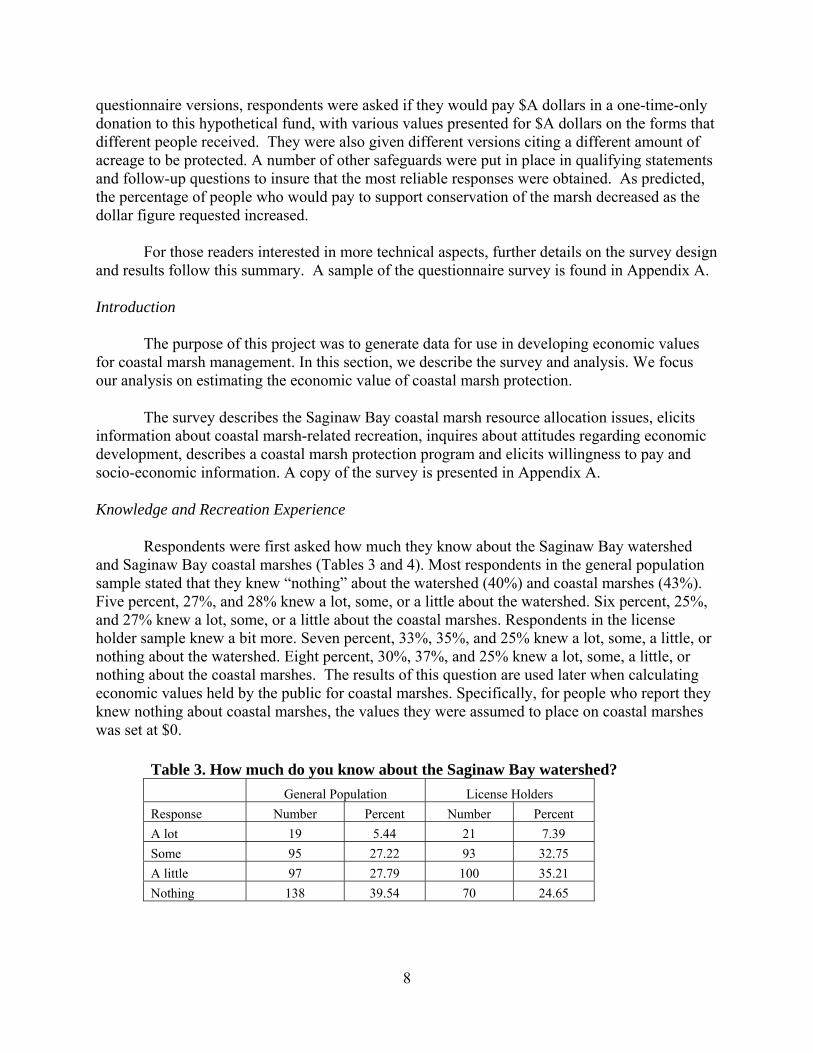
Respondents were first asked how much they know about the Saginaw Bay watershed and Saginaw Bay coastal marshes (Tables 3 and 4). Most respondents in the general population sample stated that they knew “nothing” about the watershed (40%) and coastal marshes (43%). Five percent, 27%, and 28% knew a lot, some, or a little about the watershed. Six percent, 25%, and 27% knew a lot, some, or a little about the coastal marshes. Respondents in the license holder sample knew a bit more. Seven percent, 33%, 35%, and 25% knew a lot, some, a little, or nothing about the watershed. Eight percent, 30%, 37%, and 25% knew a lot, some, a little, or nothing about the coastal marshes. The results of this question are used later when calculating economic values held by the public for coastal marshes. Specifically, for people who report they knew nothing about coastal marshes, the values they were assumed to place on coastal marshes was set at $0.
Table 3. How much do you know about the Saginaw Bay watershed? General Population License Holders Response Number Percent Number Percent A lot 19 5.44 21 7.39 Some 95 27.22 93 32.75 A little 97 27.79 100 35.21 Nothing 138 39.54 70 24.65

9
Table 4. How much do you know about Saginaw Bay coastal marshes?
General Population License Holders Response: Number Percent Number Percent A lot 20 5.71 23 8.1 Some 86 24.57 85 29.93 A little 94 26.86 104 36.62 Nothing 150 42.86 72 25.35
Respondents were then asked about their Saginaw Bay coastal marsh-related recreation activities. These activities were defined as any trip where the respondent was on or near the water including the marshes where the typical plants are cattails, rushes, grasses, and shrubs. Sixty percent and 73% of the general population and license holder samples had visited the Saginaw Bay or Saginaw Bay coastal marsh area for outdoor recreation or leisure (Table 5).
Table 5. Have you ever visited the Saginaw Bay or a Saginaw coastal marsh area for outdoor recreation or leisure?
General Population License Holders Response Number Percent Number Percent Yes 206 60.06 203 73.29 No 137 39.94 74 26.71
Respondents were asked to list all of the types of recreation activities that they pursue. The primary recreation activity for both samples was fishing (Table 6). Seventy-three percent of the general sample and 86% of the license holders fished. Other popular activities for the general sample were boating (56%), beach going (46%), nature observation (38%), hunting (35%), hiking (26%), and camping (25%). Other popular activities for the license holder sample were boating (62%), beach going (43%), nature observation and hunting (36%), and camping (26%).
Table 6. What type of activities did you participate in during your visits to the Saginaw Bay or a Saginaw Bay coastal marsh?
General Population License Holders Activity Number Percent Number Percent Fishing 151 73.30 175 86.21 Hunting 71 34.47 73 35.96 Beach Going 94 45.63 88 43.35 Boating 115 55.83 126 62.07 Nature Observation 78 37.86 73 35.96 Camping 52 25.24 54 26.60 Wildlife Photography 25 12.14 17 8.37 Hiking 53 25.73 45 22.17 Bird Watching 40 19.42 29 14.29 Other 33 16.02 25 12.32

10
The average annual number of recreation trips was 10 and 11 for those in the general and license holder samples (Table 7). For the general sample, 7 of these trips were day trips and 2 were overnight trips. The license holders took an average of 9 day trips and 2 overnight trips. Most trips lasted between 4 and 8 hours (Table 8). The primary recreation activity, as opposed to a list of all activities participated in (Table 4), for both samples was fishing (Table 9). Forty percent and 55% of the general and license holder samples fished. The most popular county for recreation trips was Bay County with almost 50% of both samples visiting there on a typical trip (Table 10). The general population spent an average of $85 on each trip (Table 11). The license holders spent an average of $94 on each trip. The money spent per trip does not include expenditures on equipments and gear used more than once. These expenditures would have actually increased the amount spent quite significantly.
Table 7. Trips to the Saginaw Bay or Saginaw Bay Coastal Marsh Area General Population License Holders
Total Day Overnight Total Day Overnight Mean 9.55 7.42 1.97 10.64 8.89 1.58 Std Dev 15.94 13.57 5.3 17.33 14.52 4.53 Min 0 0 0 0 0 0 Max 120 95 40 120 95 30 Cases 151 151 151 155 155 155
Table 8. During your typical visit to the Saginaw Bay or a Saginaw Bay coastal marsh area, how long do you stay?
General Population License Holders Time Number Percent Number Percent Under 1 hour 2 1.23 3 1.88 1 to 2 hours 12 7.36 10 6.25 2 to 4 hours 30 18.40 31 19.38 4 to 8 hours 58 35.58 55 34.38 The whole day 37 22.70 44 27.50 More than one day 24 14.72 17 10.63
Table 9. What is the main recreational activity on your typical trip?
General Population License Holders Activity Number Percent Number Percent Fishing 63 39.62 86 55.13 Hunting 19 11.95 18 11.54 Beach Going 11 6.92 11 7.05 Boating 11 6.92 11 7.05 Nature Observation 21 13.21 7 4.49 Camping 11 6.92 11 7.05

11
Table 9. What is the main recreational activity on your typical trip? (continued)
Wildlife Photography 3 1.89 0 0 Hiking 8 5.03 3 1.92 Bird Watching 2 1.26 4 2.56 Other 10 6.29 5 3.21
Table 10. What Saginaw Bay coastal county do you most often travel to on your typical trip? General Population License Holders County Number Percent Number Percent Iosco 18 11.39 19 12.18 Arenac 16 10.13 21 13.46 Bay 74 46.84 71 45.51 Tuscola 14 8.86 19 12.18 Huron 36 22.78 26 16.67
Table 11. As best as you can recall, how much money do you spend on a typical trip once you leave home until you return home? General Population License Holders Mean $85.40 $93.73 Std Dev 95.18 165.26 Min 2 2 Max 704 1,800 Cases 157 153
Attitudes about Competing Uses of Coastal Marsh
Respondents were told that economic development has provided jobs and income to residents of the Saginaw Bay region. But this development has led to only one-half, 18,000 acres, of Saginaw Bay’s original coastal marshes remaining. Respondents were then provided with a list of reasons why marsh protection is important.
Respondents were then asked to rate the importance of eight statements related to the uses of coastal marshes (i.e., uses related to economic development and protection). Two of these focused on the importance of development. Sixty-two percent and 61% of the general and license holder samples said that agricultural development was either somewhat important or very important (Table 12). In contrast, only 33% and 32% of the general and license holder samples thought that urban development was somewhat or very important (Table 13). Forty-six percent and 50% of the general population and license holders sampled said that urban development is not important at all.

12
Table 12. How important are the following uses of coastal marshes to you? Agricultural development
General Population License Holders Number Percent Number Percent Very Important 79 24.53 66 24.81 Somewhat Important 120 37.27 96 36.09 Somewhat not important 62 19.25 52 19.55 Not Important at All 61 18.94 52 19.55
Table 13. How important are the following uses of coastal marshes to you? Urban development
General Population License Holders Number Percent Number Percent Very Important 42 12.96 31 11.92 Somewhat Important 66 20.37 52 20.00 Somewhat not important 68 20.99 47 18.08 Not Important at All 148 45.68 130 50.00
Large majorities of both samples thought that the uses of coastal marshes related to
protection are somewhat or very important. Fifty percent and 48% of the general and license holder samples thought that storm water retention and flood control was very important (Table 14). Sixty-nine percent and 76% of the general population and license holder samples thought that waterfowl nesting and feeding areas was very important (Table 15). Fish feeding and spawning areas were very important to 70% and 79% of the general population and license holder samples (Table 16). Sixty-two percent of both samples thought that erosion control was very important (Table 17). Forty-two percent of the general population sample and 44% of the license holder sample thought that recreation and tourism were very important (Table 18). Finally, water quality improvement was thought to be very important by 79% and 76% of the general population and license holder samples (Table 19).
Table 14. How important are the following uses of coastal marshes to you?
Storm water retention and flood control General Population License Holders
Number Percent Number Percent Very Important 167 50.15 134 48.38 Somewhat Important 132 39.64 111 40.07 Somewhat not important 29 8.71 24 8.66 Not Important at All 5 1.5 8 2.89

13
Table 15. How important are the following uses of coastal marshes to you?
Waterfowl nesting and feeding areas General Population License Holders
Number Percent Number Percent Very Important 235 68.71 211 75.63 Somewhat Important 95 27.78 54 19.35 Somewhat not important 11 3.22 11 3.94 Not Important at All 1 0.29 3 1.08
Table 16. How important are the following uses of coastal marshes to you? Fish feeding and spawning areas
General Population License Holders Number Percent Number Percent Very Important 250 69.83 228 79.44 Somewhat Important 81 22.63 46 16.03 Somewhat not important 10 2.79 4 1.39 Not Important at All 2 0.56 2 0.70
Table 17. How important are the following uses of coastal marshes to you? Erosion control
General Population License Holders Number Percent Number Percent Very Important 212 62.35 175 62.50 Somewhat Important 105 30.88 86 30.71 Somewhat not important 20 5.88 15 5.36 Not Important at All 3 0.88 4 1.43
Table 18. How important are the following uses of coastal marshes to you? Recreation and tourism
General Population License Holders Number Percent Number Percent Very Important 143 42.06 124 43.97 Somewhat Important 137 40.29 122 43.26 Somewhat not important 48 14.12 28 9.93 Not Important at All 12 3.53 8 2.84

14
Table 19. How important are the following uses of coastal marshes to you?
Water quality improvement General Population License Holders
Number Percent Number Percent Very Important 274 79.19 216 76.33 Somewhat Important 59 17.05 57 20.14 Somewhat not important 11 3.18 8 2.83 Not Important at All 2 0.58 2 0.71
Willingness to Pay
The next section of the survey elicited the willingness to pay for coastal marsh protection. Respondents were told that 9,000 of 18,000 of Saginaw Bay coastal marshes are currently protected and that the remaining privately owned marshes could be purchased and protected. A hypothetical “Saginaw Bay Coastal Marsh Protection Program” was introduced. Voluntary contributions would go into a “Saginaw Bay Coastal Marsh Trust Fund” to purchase X acres of coastal marsh. The amount X was randomly assigned from three amounts 1,125, 2,500, and 4,500.
Respondents were told “Money would be refunded if the total amount is not enough to purchase and manage X acres. If the amount of donated money is greater than the amount required to purchase and manage X acres, the extra money would be used to provide public access and educational sites at Saginaw Bay coastal marshes.” This is known as the “provision point” survey design (Poe, et al., 2002). The provision point design has been shown to minimize “free riding” bias in willingness to pay responses. Free riding is a common response to requests for donations in which respondents will donate less than they are willing to donate for goods that are consumed collectively.
Then respondents were asked: “Would you be willing to make a one-time donation of money to the Saginaw Bay Coastal Marsh Trust Fund within the next 12 months?” Twenty-five percent of the general population would be willing to make a one-time donation. Forty-nine percent would not be willing to make a donation and 26% did not know (Table 20). For the license holder sample, 27%, 50%, and 23% would, would not, and did not know whether they would make a donation.
Table 20. Would you be willing to make a one-time donation of money to the Saginaw Bay Coastal Marsh Trust Fund within the next 12 months?
General Population License Holders Number Percent Number Percent Yes 88 25.14 76 26.76 No 171 48.86 143 50.35 I don’t know 91 26.00 65 22.89

15
Respondents who would be willing to make a donation were then told that “if about 1% (1 in 100) of all households in Michigan made a one-time donation of $A, the Trust Fund would have enough money to purchase and manage X acres of coastal marshes. Remember, if you made a one-time donation of $A into the Trust Fund, you would have $A less to spend on other things. Also remember that protected marsh would no longer be available for conversion to other uses.” The dollar amount, $A, was randomly assigned from the following amounts: $25, $50, $75, $100, $150, and $200. The dollar amounts were chosen based on revenue streams required to purchase X acres of coastal marsh if 1% of all Michigan households made the donation. The 3 acreage versions and 6 price versions lead to 18 versions of the survey. The sample sizes for each of these 18 versions ranged from 28 to 53 with an average of 36.
Respondents were asked if they “would … make a one-time donation of $A to the Saginaw Bay Coastal Marsh Trust Fund within the next 12 months?” According to economic theory, the percentage of respondents willing to pay $A should decrease as $A increases. This was the pattern of responses found for both the general population and license holder samples (Tables 20-26). In the general sample, 63% were willing to pay $25, 52% were willing to pay $50, 33% were willing to pay $75, 29% were willing to pay $100, 31% were willing to pay $150, and 21% were willing to pay $200. Sixty-two percent, 42%, 36%, 42%, 26%, and 19% of the license holders were willing to pay $25, $50, $75, $100, $150, and $200.
Table 21. Under these conditions, would you make a one-time donation of $A to the Saginaw Bay Coastal Marsh Trust Fund within the next 12 months?
$A = $25
General
Population License Holders Number Percent Number PercentYes 19 63.33 24 80.00 No 1 3.33 0 0.00 I don’t know 10 33.33 6 20.00
Table 22. Under these conditions, would you make a one-time donation of $A to the Saginaw Bay Coastal Marsh Trust Fund within the next 12 months?
$A = $50
General
Population License Holders Number Percent Number PercentYes 17 51.52 11 42.31 No 6 18.18 2 7.69 I don’t know 10 30.30 13 50.00

16
Table 23. Under these conditions, would you make a one-time donation of $A to the Saginaw Bay Coastal Marsh Trust Fund within the next 12 months?
$A = $75
General
Population License Holders Number Percent Number PercentYes 8 33.33 12 36.36 No 4 16.67 5 15.15 I don't know 12 50.00 16 48.48
Table 24. Under these conditions, would you make a one-time donation of $A to the Saginaw Bay Coastal Marsh Trust Fund within the next 12 months?
$A = $100
General
Population License Holders Number Percent Number PercentYes 10 29.41 10 41.67 No 13 38.24 2 8.33 I don’t know 11 32.35 12 50.00
Table 25. Under these conditions, would you make a one-time donation of $A to the Saginaw Bay Coastal Marsh Trust Fund within the next 12 months?
$A = $150
General
Population License Holders Number Percent Number PercentYes 12 30.77 5 26.32 No 14 35.90 8 42.11 I don't know 13 33.33 6 31.58

17
Table 26. Under these conditions, would you make a one-time donation of $A to the Saginaw Bay Coastal Marsh Trust Fund within the next 12 months?
$A = $200
General
Population License Holders Number Percent Number PercentYes 7 20.59 4 19.05 No 12 35.29 11 52.38 I don't know 15 44.12 6 28.57
One problem that has arisen with contingent valuation method surveys is hypothetical bias (Whitehead and Cherry, 2004). Hypothetical bias exists if respondents are more likely to say that they would pay a hypothetical sum of money than they would actually pay if placed in the real situation. Since economic values are based on actual behavior, hypothetical bias leads to economic values that are too high. One method that is used to mitigate hypothetical bias is the certainty rating.
For those respondents who said that they were willing to pay we asked: “On a scale of 1 to 10 where 1 is “not sure at all” and 10 is “definitely sure”, how sure are you that you would make the one-time donation of $A?” Twenty-four percent and 34% of the general population and license holder samples were definitely sure that they would pay (Table 27). Fifty-two percent of the general population survey respondents were very sure (i.e., their rating was 7, 8, or 9) that they would pay. Forty-percent of the license holder sample was very sure that they would pay.
Table 27. On a scale of 1 to 10 where 1 is "not sure at all" and 10 is "definitely sure", how sure are you that you would make a one-time donation of $A?
General Population License Holders Number Percent Number Percent 1 1 1.49% 2 3.13% 2 0 0.00% 0 0.00% 3 2 2.99% 2 3.13% 4 0 0% 1 1.56% 5 3 4.48% 7 10.94% 6 10 14.93% 4 6.25% 7 8 11.94% 8 12.50% 8 16 23.88% 14 21.88% 9 11 16.42% 4 6.25% 10 16 23.88% 22 34.38%

18
We also asked an open-ended willingness to pay question: “Some people who are willing to make the one-time donation of $A might be willing to donate more. Some people who are not willing to make the one-time donation of $A might be willing to donate something less. What is the largest one-time donation that you would be willing to make?” The average donation was $64 and $62 for the general population and license holder samples (Table 28).
Table 28. What is the largest one-time donation that you would be willing to make?
General Population License Holders Mean $63.91 $61.81 Std Dev 94.15 84.18 Min 0 0 Max $1,000 $750 Cases 145 116
To determine how realistic the respondents found the scenario we asked “how likely do
you think it is that 1% of all households in Michigan would make a one-time donation of $A to the Trust Fund within the next 12 months?” Forty-two percent of the general population and 47% of the license holders thought that it would be somewhat likely or very likely (Table 29).
Table 29. How likely do you think it is that 1% of all households in Michigan would make a one-time donation of $150 to the Trust Fund within the next 12 months?
General Population License Holders
Number Percent Number PercentVery likely 12 5.66 9 5.23 Somewhat likely 78 36.79 73 42.44 Somewhat not likely 83 39.15 56 32.56 Not likely at all 39 18.40 34 19.77
Socio-Economic Variables
A number of demographic variables were collected (Table 30). Considering first the general population sample, the typical household had 2.57 people with 0.57 children. The general population sample was 70% male and 92% white. The average age was 52 years. Thirty-three percent were members of conservation and/or environmental organizations and 5% owned Saginaw Bay shoreline property. The average number of years in school was 14.
The typical license holder household had 3 people with 0.82 children. The license holder sample was 79% male and 97% white. The average age was 48 years. Thirty-seven percent were members of conservation and/or environmental organizations and 8% owned Saginaw Bay shoreline property. The average number of years in school was 14.

19
Household income was similar for both samples (Table 31. The most common income category was between $34,000 and $54,000 for the general population (24%) and license holder (23%) samples. A continuous income variable was constructed by assigning dollar values to the categories. We used the midpoint of the interior categories (e.g., $44,000 was assigned to households with income between $34,000 and $54,000), $9000 for the lower income category and $90,000 for the upper income category. The average household income for both samples was $48,000.
Note that the income variable was subject to more item non-response than other demographic questions. In order to keep these few additional cases in the sample we imputed income using a regression model (Whitehead, 1994). The predicted income was assigned to an income category which was then assigned the midpoint income of that category. Six percent and 7% of those in the general population and license holders were assigned incomes. We tested for the impact of income imputation in our regression models below.

20
Table 30. Socioeconomic Variables
General Population License Holders Variable Description Cases Mean Std Dev Min Max Cases Mean Std Dev Min Max People household size 344 2.57 1.36 1 10 282 3.03 1.52 1 8 Minor Number of children 335 0.57 0.94 0 5 275 0.82 1.15 0 5 Male male=1, female=0 358 0.70 0.46 0 1 290 0.79 0.41 0 1 White white=1, nonwhite=0 354 0.92 0.27 0 1 289 0.97 0.17 0 1 Age 2005 - year born 359 51.55 16.17 19 93 291 47.62 15.69 18 87 Member Env/cons org member 356 0.33 0.47 0 1 288 0.37 0.48 0 1 Property Own shoreline property 353 0.05 0.22 0 1 290 0.08 0.27 0 1 School years of schooling 357 14.25 3.36 0 24 284 13.61 2.58 3 24 Income2 income in thousands 331 48.36 28.06 9 90 268 48.99 28.34 9 90 Replace replacement income 23 43.30 23.21 -19 80 19 42.32 13 10 62 Income3 income with imputes 354 48.21 27.68 9 90 287 48.71 27.71 9 90 Table 31. As best as you can recall, please estimate your household's 2004 income before taxes.
General Population License Holders Number Percent Number PercentLess than $18k 52 15.71 44 16.42 Between $18k and $34k 73 22.05 55 20.52 Between $34k and $54k 80 24.17 61 22.76 Between $54k and $86k 61 18.43 55 20.52 More than $86k 65 19.64 53 19.78

21
We next compared some of the characteristics of the sample of the general population with population measures from the U.S. Census Bureau. The sample was slightly more elderly than the population. Nineteen percent of the sample was older than 65 where only 16% of the population was older than 65. The sample was 70% male while the population was 50% male. This difference should not necessarily be attributed to sample bias. If the survey was more salient to males, as expected, then the males of multi-person households would have completed the survey even if the survey was addressed to a female. The sample was 92% white while the population was 97% white.
The sample was better educated than the population. Ninety-three percent of the sample, 25 or more years old, graduated from high school (measured as 12 years of schooling). Only 80% of the population graduated from high school. Thirty-eight percent of the sample, 25 or more years old, graduated from college (measured as 17 years of schooling). Only 12% of the population aged 25 or more graduated from college.
The sample had higher incomes than the population which was consistent with the education results. The median household income was $42 thousand for the population. The median household income for the sample was found by using predicted household income from the regression model used to impute income. The median household income for the sample was $50 thousand. Since income is a theoretically important predictor of economic value we weighted the data on income. All regression results reported below are weighted to mitigate the sample bias.

22
Data Analysis
Summary
This section of the report applies a number of economic tools to the data that was presented in the preceding pages, with a goal of a better understanding of the results. This analysis concerns three main areas: 1) factors that determine knowledge and attitudes, 2) the demand for recreation and 3) the willingness to pay for coastal marsh protection.
Knowledge and attitudes were examined by applying a tool called the ordered probit
regression model. A description of this tool, and the details of its application are found in the text to follow. This analysis highlighted the fact that males, members of conservation/environmental groups and those with shoreline property, higher education and were in the licensed hunter/angler survey group, knew the most about the Saginaw Bay watershed These same factors, except for educational level, explained participants’ knowledge of the coastal marsh. The income level of participants came into play when attitudes towards the use of coastal marshes were considered. Those with higher income and higher education were more likely to believe that urban development was important. Those with higher income, males, and members of conservation/environment organizations were less likely to believe in the importance of agricultural development. Members of conservation/environmental groups were the only ones most likely to believe in the importance of most ecological functions of the coastal marsh. No variable, however, could explain the difference in values held of the importance of storm water retention and flood control.
Recreation demand was determined through use of two variations of the travel cost method: the single-site recreation demand model and the recreation site selection (i.e., random utility) model. The application of these models is described more fully in the text below. Both models analyzed a variety of factors such as travel time involved, distance to the site, number of trips/year, the travel cost to the closest non-coastal substitute recreational site, the extent of coastal marsh in various Bay counties, etc. After these analyses, it was clear that individual trips to close-in Bay County had the least value, while trips to the further-away Tuscola County were valued the most, with the counties of Huron, Iosco and Arenac falling somewhere between. The difference in values was due to the fact that Bay County is nearest to region’s population and Tuscola County is more remote. Recreationists from the population centers who travel to Tuscola County spent more time and money and, therefore, revealed a higher value for those trips. The extent of coastal marsh in these counties did not turn out to be a deciding factor for the choices in recreational sites.
The probability that a site would be chosen decreased as travel costs increased and
increased with overall wetland acres (not necessarily coastal marsh acres) and number of access points. In fact, the much-visited Bay County had a site value to consumers of $14 per trip, and the overall value of an additional access point anywhere in the Saginaw bay counties was $7 per trip. With the site-selection model, the fact that most of the typical trips occurred in Bay County, due to its close proximity to population centers, Bay County would have had the highest value as a destination point.

23
Willingness to pay data from the survey was analyzed using the contingent valuation method. The survey first determined if the respondent was willing to pay anything for coastal marsh protection, and then, how much the respondent was willing to pay for a set number of protected acres. The questionnaire surveys gave the respondents a number of contextual details that helped verify their answers, and their answer to follow-up questions helped gauge the certainty that those surveyed might actually contribute the chosen amount under real circumstances. It was found that those who lived further away from substitute recreation sites, and those who were members of conservation/environmental groups, were most likely to be willing to pay for the protection of 1,125 coastal marsh acres. Their willingness to pay did not increase if more acreage would be protected, but this result is still theoretically valid, unless their willingness to pay actually decreased with further acres, which it did not. The willingness to pay values were found to reflect the respondents’ concern with altruistic and environmental factors other than their own on-site usage. Survey respondents overall were willing to pay $119 for coastal marsh protection if they believed their money would be refunded if not enough money was obtained for the task. This amount dropped to $72 when hypothetical bias was removed by adjusting responses for those saying they were unsure they would actually donate. If respondents thought their money would be wasted if not enough money was collected for the task, they were willing to pay less, $63, falling to only $30 when hypothetical bias was considered.
Introduction
In the previous chapter, we looked at the raw data accruing from the survey and presented these results in a number of tables for each survey question. Initial analyses of these results were compared for the two survey groups of 1) licensed hunters and anglers, and 2) the general public. In this section we take the results further by applying a number of statistical methods. Three aspects of the responses were looked at in depth: what determines knowledge and attitudes, recreation demand, and willingness to pay. Technical terms used in this section are further defined in Appendix C. What Determines Knowledge and Attitudes
In order to attempt to explain the variation in the knowledge and attitudinal results, we used the socioeconomic criteria as the independent variables. These variables are described in Table 28. Due to item non-response and “don’t know” responses, many survey responses were dropped from the analysis. The sample size in each model differs because we used the available responses to each question.
First, we considered the factors that explain the variation in knowledge about the watershed and coastal marsh (Table 30). We used the ordered probit regression model (Long, 1997, see Appendix C). A regression model is a statistical approach that determines the impact of an independent variable (i.e., the left hand side column variables) on the dependent variable (the top row variables). When the probit coefficient (i.e., the numbers in Table 30) is positive, this indicates that an increase (decrease) in the independent variable leads to an increase (decrease) in the dependent variable. The “ordered probit” model takes into account the fact that the dependent variable is measured categorically (e.g., see Tables 3 and 4).
24
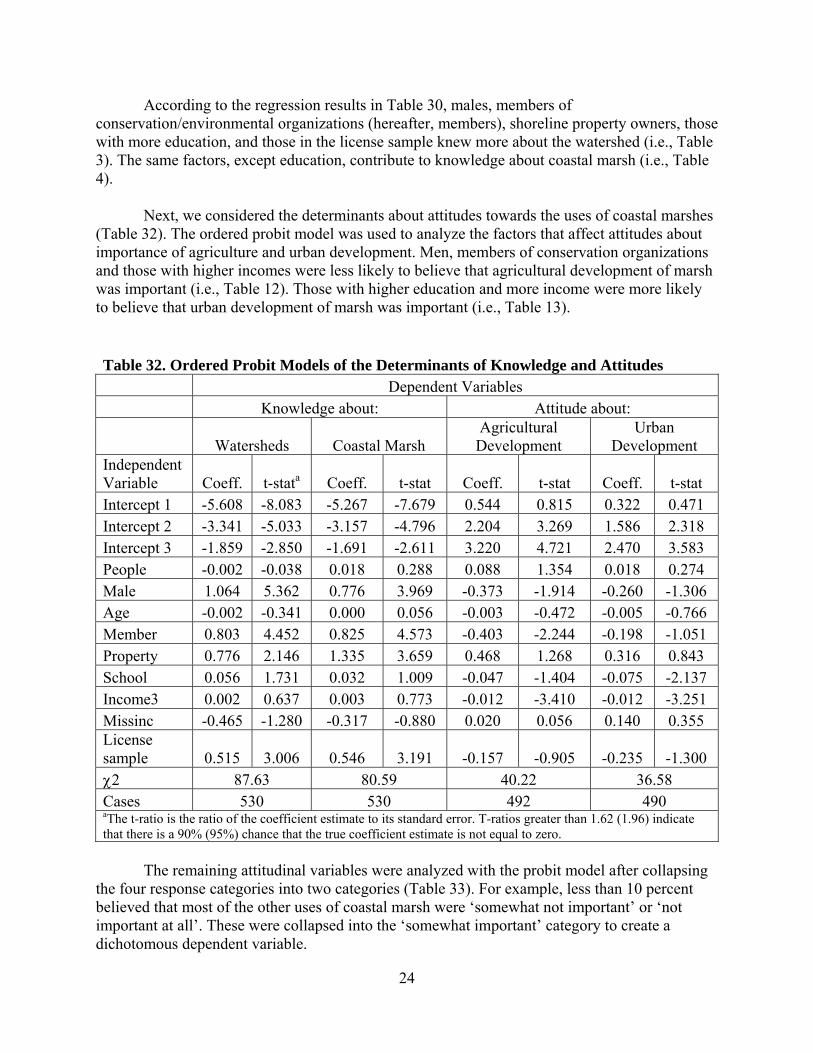
According to the regression results in Table 30, males, members of conservation/environmental organizations (hereafter, members), shoreline property owners, those with more education, and those in the license sample knew more about the watershed (i.e., Table 3). The same factors, except education, contribute to knowledge about coastal marsh (i.e., Table 4).
Next, we considered the determinants about attitudes towards the uses of coastal marshes (Table 32). The ordered probit model was used to analyze the factors that affect attitudes about importance of agriculture and urban development. Men, members of conservation organizations and those with higher incomes were less likely to believe that agricultural development of marsh was important (i.e., Table 12). Those with higher education and more income were more likely to believe that urban development of marsh was important (i.e., Table 13).
Table 32. Ordered Probit Models of the Determinants of Knowledge and Attitudes Dependent Variables Knowledge about: Attitude about:
Watersheds Coastal Marsh Agricultural Development
Urban Development
Independent Variable Coeff. t-stata Coeff. t-stat Coeff. t-stat Coeff. t-stat Intercept 1 -5.608 -8.083 -5.267 -7.679 0.544 0.815 0.322 0.471 Intercept 2 -3.341 -5.033 -3.157 -4.796 2.204 3.269 1.586 2.318 Intercept 3 -1.859 -2.850 -1.691 -2.611 3.220 4.721 2.470 3.583 People -0.002 -0.038 0.018 0.288 0.088 1.354 0.018 0.274 Male 1.064 5.362 0.776 3.969 -0.373 -1.914 -0.260 -1.306 Age -0.002 -0.341 0.000 0.056 -0.003 -0.472 -0.005 -0.766 Member 0.803 4.452 0.825 4.573 -0.403 -2.244 -0.198 -1.051 Property 0.776 2.146 1.335 3.659 0.468 1.268 0.316 0.843 School 0.056 1.731 0.032 1.009 -0.047 -1.404 -0.075 -2.137 Income3 0.002 0.637 0.003 0.773 -0.012 -3.410 -0.012 -3.251 Missinc -0.465 -1.280 -0.317 -0.880 0.020 0.056 0.140 0.355 License sample 0.515 3.006 0.546 3.191 -0.157 -0.905 -0.235 -1.300 χ2 87.63 80.59 40.22 36.58 Cases 530 530 492 490 aThe t-ratio is the ratio of the coefficient estimate to its standard error. T-ratios greater than 1.62 (1.96) indicate that there is a 90% (95%) chance that the true coefficient estimate is not equal to zero.
The remaining attitudinal variables were analyzed with the probit model after collapsing the four response categories into two categories (Table 33). For example, less than 10 percent believed that most of the other uses of coastal marsh were ‘somewhat not important’ or ‘not important at all’. These were collapsed into the ‘somewhat important’ category to create a dichotomous dependent variable.

25
None of the independent variables helped explain the variation in importance of storm water retention and flood control. Members of organizations were more likely to think that all of the other uses of coastal marsh are very important. In fact, membership was the only determinant of the acknowledged importance of coastal marsh for waterfowl nesting and feeding areas, fish feeding and spawning areas, erosion control, recreation and tourism, and water quality improvement.
Table 33. Probit Models of the Determinants of Attitudes
Dependent Variable
Attitude About:
Storm water retention and flood
control Waterfowl nesting and feeding areas
Fish feeding and spawning areas Erosion control
Recreation and Tourism
Water Quality Improvment
Independent Variable Coeff. t-stata Coeff. t-stat Coeff. t-stat Coeff. t-stat Coeff. t-stat Coeff. t-stat
Intercept 0.263 0.377 1.213 1.541 1.359 1.668 0.004 0.006 -0.128 -0.183 1.396 1.666
People -0.001 -0.012 0.003 0.034 0.062 0.738 -0.088 -1.244 0.026 0.370 0.080 0.950
Male -0.179 -0.852 -0.131 -0.562 0.143 0.596 -0.235 -1.070 -0.042 -0.200 -0.172 -0.684
Age 0.003 0.511 -0.007 -0.986 0.000 -0.027 0.004 0.667 0.003 0.545 0.004 0.536
Member 0.080 0.414 1.033 4.303 0.884 3.499 0.565 2.731 0.381 1.957 0.985 3.785
Property 0.107 0.269 -0.012 -0.025 -0.256 -0.553 0.015 0.037 -0.275 -0.667 0.962 1.554
School -0.014 -0.411 -0.021 -0.539 -0.060 -1.464 0.046 1.289 -0.023 -0.660 -0.001 -0.031
Income3 -0.001 -0.249 -0.004 -0.889 -0.004 -0.912 -0.004 -1.072 -0.001 -0.316 -0.006 -1.337
Missinc 0.024 0.062 -0.439 -1.064 0.152 0.309 0.524 1.172 -0.292 -0.735 0.302 0.589 License sample -0.058 -0.307 0.228 1.089 0.230 1.040 0.018 0.094 -0.062 -0.329 -0.346 -1.572
χ2 1.78 24.90 19.58 16.50 5.42 22.43
Cases 511 521 524 520 522 527 a The t-ratio is the ratio of the coefficient estimate to its standard error. T-ratios greater than 1.62 (1.96) indicate that there is a 90% (95%) chance that the true coefficient estimate is not equal to zero.
Recreation Demand
We used the travel cost method to estimate recreation demand models for trips to Saginaw Bay and Saginaw Bay coastal marsh areas. In order to facilitate comparison of the resulting recreation values to the willingness to pay values we used the same sample size for the recreation demand and willingness to pay analysis
The travel cost method (TCM) is a revealed preference approach to environmental valuation that is used to estimate the benefits of outdoor recreation activities. The travel cost method begins with the insight that the major cost of outdoor recreation is the travel and time costs incurred to get to the recreation site (Freeman, 2003). Since individuals reside at varying distances from the recreation site, the variation in travel costs and the number of trips taken are used to trace out a demand curve for the recreation site (Figure 1). The demand curve is then used to derive the economic value (i.e., consumer surplus, CS in Figure 1) associated with using the site.

26
Consumer surplus is the amount that the recreationist would be willing to pay to take the trip over and beyond the expenditures actually made for the trip (i.e., the height of the demand curve above the ‘Current Market Price’ in Figure 1). Since the trip expenditures are less than willingness to pay the recreationist is made better off by the trip (i.e., EXP in Figure 1). The magnitude of the gain in welfare is the economic value of the trip (i.e., “consumer surplus” is the difference between the height of the demand curve and the price).
With data on appropriate independent variables that might influence the number of trips taken (e.g., measures of coastal marsh acreage), the economic benefits (i.e., changes in consumer surplus, ∆CS in Figure 1) associated with changes in the independent variables (i.e., changes in coastal marsh) can be derived. Consumer surplus should be contrasted with recreation expenditures (EXP in Figure 1). Expenditures are used for economic impact analysis. Consumer surplus estimates are used for benefit-cost analysis. Consumer surplus is the measure of economic value that is derived from the travel cost method.
Figure 1. Demand and Consumer Surplus

27
A variation of the travel cost method is the site selection (i.e., random utility, RUM) model (Freeman, 2003). In the random utility model, it is assumed that individuals choose their recreation site based on differences in trip costs and site characteristics (e.g., coastal marsh acreage) between the alternative sites. Analysis of data on recreation site choices using the conditional logit model enables estimation of the monetary benefits of any change in site characteristics.
The dependent variable for a single-site TCM model is the number of recreation trips (Table 7). Data were available for total, day, and overnight trips. The dependent variable for the RUM was the typical county chosen for a recreation trip (Table 10). Data on coastal marsh acreage and wetlands acreage for each Saginaw Bay county were provided by Ducks Unlimited. These data were used as independent variables in both TCM and RUM demand models. Unfortunately, these variables were not found to be determinants of the number of recreation trips. This eliminates the possibility of developing estimates of the economic value of additional coastal marsh protection with the single-site TCM (i.e., ∆CS in Figure 1).
Nevertheless, we proceeded to estimate TCM models to determine baseline estimates of the value of recreation trips (i.e., CS in Figure 1). The dependent variables for the single-site recreation demand models were total trips, day trips, and overnight trips. Recreation participants and non-participants were included. Non-participants were those who took zero trips. Forty-seven percent of the sample took at least one recreation trip. Forty-four percent took at least one day trip and 14% took at least one overnight trip. Including those with zero trips, the average number of trips was 5, 4.02, and .89 for the total, day, and overnight trips.
The independent variables included are guided by economic theory. Demand models should include own-travel costs, substitute travel costs and income. The own-price of a recreation trip is measured by the round trip travel cost. For respondents who took trips, the travel cost is that which is associated with the county of their typical trip. For respondents who did not take trips, the travel cost is associated with the county in closest proximity.
We computed round trip distance traveled from the home zip code of the respondent to the zip code of the most commonly visited city in the county of the typical recreation trip using ZIPFIP software (Hellerstein, 2005). Travel cost per mile was set at $0.37, time costs are valued at one-third of the wage rate, and average miles per hour is 60 to form the travel cost variable. In the TCM model the substitute site travel cost was the minimum of the travel costs to two urban centers of popular recreation areas: Traverse City on Lake Michigan and Alpena on Lake Huron.
The TCM recreation demand models are estimated using the negative binomial distribution (Haab and McConnell, 2002). The negative binomial model is a regression approach that makes adjustments for the fact that trips are not continuous variables but counts (e.g., 0, 1, 2, etc). In each demand model the number of trips decreases with increases in travel costs as predicted by economic theory (Table 34). The coefficient on the substitute site travel cost is only statistically significant in the overnight trips model. The number of total trips and day trips

28
increases with income indicating that day trips are normal goods. The number of trips taken is not different for the general population and license holder samples.
Table 34. Negative Binomial Models of Recreation Demand Number of:
Day and
Overnight Trips Day Trips Overnight Trips Independent Variables Coeff. t-ratioa Coeff. t-ratio Coeff. t-ratio Intercept 1.074 4.049 1.322 4.726 -2.737 -4.205 Travel Cost -0.038 -9.883 -0.039 -9.674 -0.044 -4.547 Substitute site travel cost 0.004 1.390 0.001 0.358 0.022 3.040 Income 0.015 4.446 0.016 4.399 0.004 0.604 Iosco County 1.703 5.180 1.426 4.157 2.673 4.070 Arenac County 1.428 4.250 1.143 3.289 2.175 3.256 Tuscola County 1.920 5.298 2.052 5.481 0.640 0.863 Huron County 1.393 4.883 1.148 3.853 2.064 3.655 License sample -0.062 -0.365 -0.098 -0.555 0.035 0.098 Alpha 3.169 11.676 3.331 11.214 12.350 6.396 LL function -1158.68 -1058.77 -401.16 Cases 570 570 570 Mean Trips 5.00 4.02 0.89 aThe t-ratio is the ratio of the coefficient estimate to its standard error. T-ratios greater than 1.62 (1.96) indicate that there is a 90% (95%) chance that the true coefficient estimate is not equal to zero.
For those respondents who took at least one trip, dummy variables were included for the county where they took their typical trip. For example, if the respondent took their typical trip to Iosco County, the dummy variable took on a value of one. Otherwise, the dummy variable was equal to zero. Four dummy variables were included in the model. In order to avoid statistical problems with the model we excluded Bay County.
Relative to Bay County, more trips were taken to Iosco, Arenac, Tuscola, and Huron Counties in the total trips and day trips models. More trips were taken to Iosco, Arenac, and Huron Counties for overnight trips. This interpretation of differences in trips rests on the assumption that all trips were taken to the typical county. To the extent that this assumption does not hold, differences in trips by county were overstated.
Net economic value (i.e., consumer surplus) estimates were developed from these models using the formulas from Haab and McConnell (2002) (Table 35). The consumer surplus estimates presented were per trip to each county. In the total trips and day trips models, trips to Bay County had the lowest value, $26 in each model. Trips to Tuscola County were valued the highest, $51 and $53 in the total and day trips models. In contrast, the value of overnight trips to
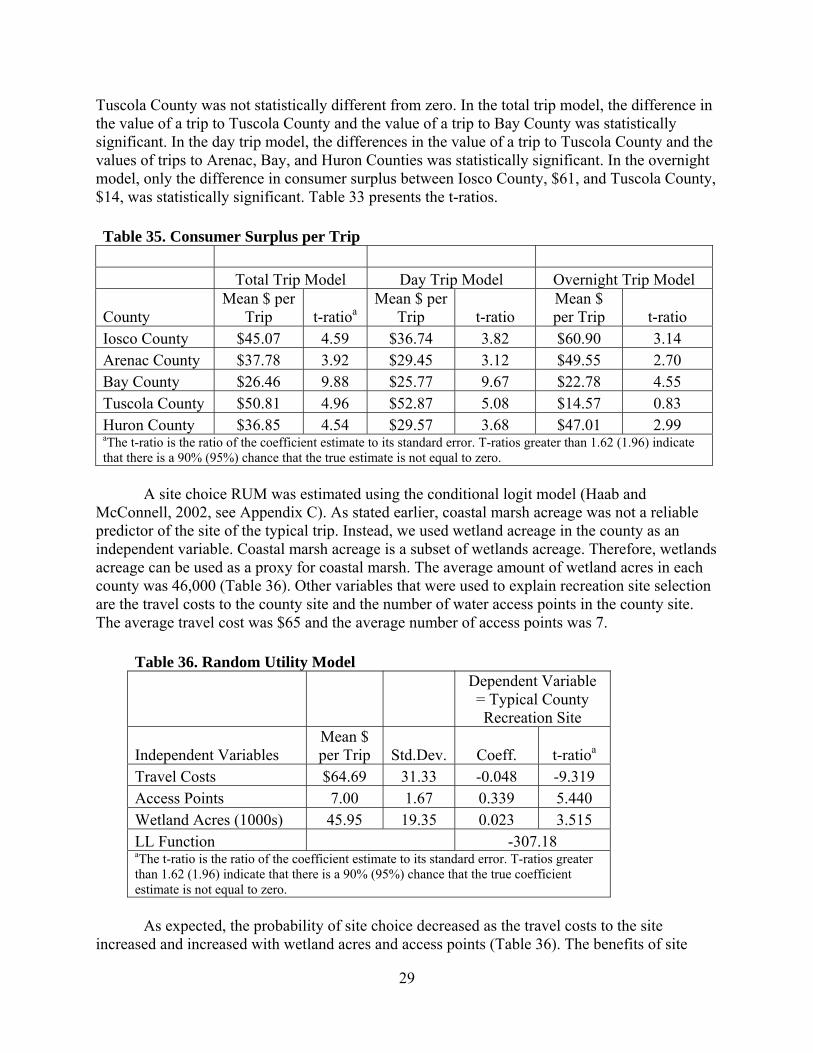
29
Tuscola County was not statistically different from zero. In the total trip model, the difference in the value of a trip to Tuscola County and the value of a trip to Bay County was statistically significant. In the day trip model, the differences in the value of a trip to Tuscola County and the values of trips to Arenac, Bay, and Huron Counties was statistically significant. In the overnight model, only the difference in consumer surplus between Iosco County, $61, and Tuscola County, $14, was statistically significant. Table 33 presents the t-ratios.
Table 35. Consumer Surplus per Trip Total Trip Model Day Trip Model Overnight Trip Model
County Mean $ per
Trip t-ratioa Mean $ per
Trip t-ratio Mean $ per Trip t-ratio
Iosco County $45.07 4.59 $36.74 3.82 $60.90 3.14 Arenac County $37.78 3.92 $29.45 3.12 $49.55 2.70 Bay County $26.46 9.88 $25.77 9.67 $22.78 4.55 Tuscola County $50.81 4.96 $52.87 5.08 $14.57 0.83 Huron County $36.85 4.54 $29.57 3.68 $47.01 2.99 aThe t-ratio is the ratio of the coefficient estimate to its standard error. T-ratios greater than 1.62 (1.96) indicate that there is a 90% (95%) chance that the true estimate is not equal to zero.
A site choice RUM was estimated using the conditional logit model (Haab and McConnell, 2002, see Appendix C). As stated earlier, coastal marsh acreage was not a reliable predictor of the site of the typical trip. Instead, we used wetland acreage in the county as an independent variable. Coastal marsh acreage is a subset of wetlands acreage. Therefore, wetlands acreage can be used as a proxy for coastal marsh. The average amount of wetland acres in each county was 46,000 (Table 36). Other variables that were used to explain recreation site selection are the travel costs to the county site and the number of water access points in the county site. The average travel cost was $65 and the average number of access points was 7.
Table 36. Random Utility Model
Dependent Variable = Typical County Recreation Site
Independent Variables Mean $ per Trip Std.Dev. Coeff. t-ratioa
Travel Costs $64.69 31.33 -0.048 -9.319 Access Points 7.00 1.67 0.339 5.440 Wetland Acres (1000s) 45.95 19.35 0.023 3.515 LL Function -307.18 aThe t-ratio is the ratio of the coefficient estimate to its standard error. T-ratios greater than 1.62 (1.96) indicate that there is a 90% (95%) chance that the true coefficient estimate is not equal to zero.
As expected, the probability of site choice decreased as the travel costs to the site increased and increased with wetland acres and access points (Table 36). The benefits of site

30
access per trip were estimated using the formulas in Haab and McConnell (2002). The value of Bay County site access was $14 (Table 37). The other site access values were less than 30% of the Bay County site access value. This was because the probability of a Bay County visit was four times larger than the probability for the other counties.
Table 37. Value of Lost Site Access (per Trip) Mean t-ratioa IOSCO -2.48 -9.32 ARENAC -2.58 -9.32 BAY -14.14 -9.32 TUSCOLA -2.39 -9.32 HURON -4.05 -9.32 aThe t-ratio is the ratio of the estimate to its standard error. T-ratios greater than 1.62 (1.96) indicate that there is a 90% (95%) chance that the true coefficient estimate is not equal to zero.
The benefits of site quality per trip were estimated using the formulas in Haab and McConnell (2002). Suppose that coastal marsh acreage increased in a county by 1,000. This increase would make that county a more attractive recreation site. More recreationists would choose it for their typical trip. According to the site-selection model, the value of an additional 1,000 acres of coastal marsh was $0.47 per trip. Considering the number of recreationists in the area and the total number of trips taken annually, this figure quickly adds up. Likewise, the value of an additional access point was $7 per person, per trip (Table 38). Again, this figure adds up quickly considering all the trips taken in the area annually.
Table 38. Value of Quality Change (per Trip) Mean t-ratioa Access Points 7.12 5.09 Wetland Acres (1000s) 0.47 4.23 aThe t-ratio is the ratio of the estimate to its standard error. T-ratios greater than 1.62 (1.96) indicate that there is a 90% (95%) chance that the true coefficient estimate is not equal to zero.
The divergence in county level values with the single-site model was due to the fact that Bay County is nearest to the region’s population and Tuscola County was more remote. Recreationists from the population centers who travel to Tuscola County spent more time and money and, therefore, revealed a higher value for those trips. With the site-selection model, the fact that most of the typical trips occurred in Bay County was due to its close proximity to population centers: therefore, Bay County would have the highest value as a destination point. The curious pattern of values, Bay County was lowest with one approach and highest with the other, was not a concern because the alternative travel cost methods were conceptually different. When choosing a site, Bay County was most valuable because more people chose that site. When choosing the number of trips to take, trips to Bay County were least valuable because they were the least scarce.

31
Willingness to Pay
The contingent valuation method is used to estimate the willingness to pay for coastal marsh protection. The contingent valuation method is a stated preference approach that directly elicits willingness (and ability) to pay statements from survey respondents. Respondents are directly asked about their willingness to pay (i.e., change in consumer surplus in Figure 1) for environmental improvement.
The method involves the development of a hypothetical market via household surveys. In the hypothetical situation respondents are informed about the current problem and the policy designed to mitigate the problem. Other contextual details about the policy are provided such as the policy implementation rule (e.g., provision point design) and the payment vehicle (e.g., a special fund). Finally, a hypothetical question presents respondents with a choice about the improvement and increased costs versus the status quo. Statistical analysis of these data leads to the development of willingness to pay estimates.
The hypothetical situation in the coastal marsh survey involved two decisions. First, the respondents must decide if they are willing to pay something and, second, the respondents must decide if they are willing to pay a specific amount of money that would lead to a set number of wetland acres being protected. These decisions were analyzed separately with the probit model (Cameron and James, 1987). The probit model was implemented by recoding “don’t know” responses to the willingness to pay question to “no,” the most conservative approach to dealing with “don’t know” responses (Groothuis and Whitehead, 2002).
The selection of independent variables was guided primarily by theory and the data analysis above (Whitehead, 1995). As the bid ($A) amount increased, the probability of a “yes” response (i.e., willingness to pay) should have decreased. The natural log of the bid ($A) amount was used to improve statistical fit. The travel cost to Saginaw Bay should have been inversely related to willingness to pay. The travel cost to the substitute recreation site should have been positively related to willingness to pay. Income should have been positively related to willingness to pay if marsh protection was a normal good.
The only demographic variable we included in the model was organization membership. This was because it was the only variable that consistently explains the variation in attitudes towards use of coastal marsh. We also included dummy variables equal to one if the respondent did not report their income and if they thought it was likely that enough Michigan residents would make the required donation for the program to be a success. Both variables were equal to zero otherwise. A variable was included to control for the different survey samples in preliminary models. This variable did not help explain the variation in yes responses and it was subsequently dropped.
Respondents who lived further away from the substitute recreation sites and who were organization members were more likely to be willing to donate some positive amount of money for coastal marsh protection (Table 39). Willingness to pay fell with increases in the bid amount;

32
increases with income were lower if the respondent did not report their income, and were higher for organization members and if the respondent believed that enough Michigan respondents would be willing to pay.
Hypothetical bias is a problem where respondents are more likely to say that they are willing to pay in a hypothetical situation than in a real situation (Whitehead and Cherry, 2004). Since economic values are revealed by behavior, correction of hypothetical bias is necessary to develop more accurate willingness to pay estimates. We recoded “yes” responses where the respondent was not sure that they would be willing to pay (these respondents answered less than 7 on the follow-up certainty scale). The determinants of willingness to pay were identical to the standard model.
Table 39. Probit Models of Willingness to Pay
Dependent Variable Would donate a positive amount
of money Would donate $A Very sure that they would donate $A
Independent Variables Coeff. t-ratioa Coeff. t-ratio Coeff. t-ratio Intercept -0.699 -4.18 1.290 2.05 0.626 0.98 Natural log of $A -0.638 -5.09 -0.496 -3.98 Acres protected 0.000 -0.08 0.00003 0.51 Travel cost -0.002 -0.84 -0.005 -1.13 -0.001 -0.31 Substitute travel cost 0.005 2.82 0.004 1.36 -0.0006 -0.18 Income3 0.001 0.27 0.009 2.33 0.010 2.65 Missing income -0.415 -1.81 -1.098 -2.19 -1.275 -2.09 Organization membership 0.394 3.34 0.389 2.30 0.408 2.36 Likelihood of success 0.779 4.68 0.827 4.82 χ2 34.62 82.17 63.94 Cases 570 293 293 aThe t-ratio is the ratio of the coefficient estimate to its standard error. T-ratios greater than 1.62 (1.96) indicate that there is a 90% (95%) chance that the true coefficient estimate is not equal to zero.
An important test of the validity of willingness to pay responses is whether willingness to pay increases with the quantity of the good being purchased. This is known as the scope test (Whitehead, Haab, and Huang, 1998). The Saginaw Bay willingness to pay values did not pass the scope test. However, this did not indicate that the willingness to pay values were invalid. Economic theory only requires that willingness to pay be non-decreasing with quantity. Under this interpretation of the results, respondents were willing to pay for 1,125 acres but their marginal (i.e., additional) willingness to pay for additional acreage was zero.
Neither the Saginaw Bay travel cost variable nor the substitute site travel cost variable were significantly different from zero. Based on the interpretation of these variables provided by

33
Whitehead (1995), recreation behavior would not change as a result of the change in coastal marsh protection. Respondents would take about the same number of trips to Saginaw Bay and to the substitute site. This result was consistent with the results from the recreation demand analysis and indicated that the willingness to pay values for additional acres of coastal marsh were wholly passive use values. Passive use value (i.e., non-use value, existence value) is the willingness to pay for the resource allocation change that is motivated by concerns other than direct, on-site use of the increase in the coastal marsh resource. These concerns may include altruism towards other users, bequests to future generations and ecological integrity. The willingness to pay values included the value of ecological functions and altruistic values or, at least, respondents were doing the best they could to formulate these values and used them when answering the willingness to pay question.
In addition to theoretically important variables, we also considered the role of information. Knowledge about the Saginaw Bay watershed and coastal marsh did not influence willingness to pay. This may have been due to the influence of conservation/environmental organization membership. These members were more likely to know about the watershed and coastal marsh and were more likely to be willing to pay.
Mean willingness to pay values were estimated following the censored regression approach of Cameron and James (1987) and the formulas for mean willingness to pay from the log normal distribution found in Haab and McConnell (2002). The t-statistics were developed using standard errors approximated by the Delta Method (Cameron, 1991). Mean willingness to pay was $63 when hypothetical bias was not addressed and $30 when hypothetical bias was mitigated (i.e., when responses were recoded so that only very sure respondents were counted as being willing to pay).
The provision point design was intended to provide respondents with incentives to reveal their true willingness to pay. One reason why respondents might have stated that they would not donate even if their willingness to pay was above the requested donation was that they believed the money would be wasted if total donations were not sufficient to fund the program. With the provision point design respondents were told that if that occurs, their money would be refunded. Survey respondents who did not believe that the donations would be sufficient were less likely to be willing to pay.
Actual donation behavior was best predicted by the model that evaluated the mean of the “likelihood of success” variable. True willingness to pay, on the other hand, was best predicted when the “likelihood of success” variable was set equal to one; in other words, simulating willingness to pay when respondents did not reduce their donations out of fear that the money would be wasted. When willingness to pay was assessed with all respondents believing that Michigan residents would donate enough money, willingness to pay was $119 with the raw yes/no responses and $72 when hypothetical bias was addressed.

34
Aggregate Benefits of Coastal Marsh
Summary
Building on the analyses in the previous chapter, this chapter factors in the number of residents in the area for population-wide figures. Using the single-site travel cost model, it was found that day trip recreation in the Saginaw Bay coastal marsh area was publicly valued at about $12 million, with another $3.7 million for overnight trips, for a total of nearly $16 million per year. Over the lifetime of the residents, these values increased accordingly. Using the site selection travel cost model, it was determined that one additional acre of coastal marsh had a recreational value of about $83 for a total of $94,000 for an increase in 1,125 acres. Finally, using the contingent valuation method, it was found that people were willing to make a one-time donation of between $710 and $3,227 to protect an acre of coastal marsh. The aggregate present value of 1,125 acres was $2.2 million. Using the midpoints, the aggregate average value of protecting 1,125 acres was $1,969/acre. The aggregate annual value of 1,125 acres of coastal marsh protection was $113,000 with a 3% interest rate and $178,000 with a 7% interest rate. Introduction
This paper has described the survey methodology, presented the survey results and analyzed these results using various economic tools, to show the attitudes, knowledge and value of coastal marshes for individual Saginaw Bay area residents. In this chapter, the value of the marshes for the overall population of the region is presented. These conclusions build on the former analyses and provide numbers than can be of best use to conservationists, legislators and others interested in conserving the valuable Saginaw Bay coastal marsh and watershed resources.
Aggregation over time
The recreation values derived from the travel cost method are annual values. In order to assess the recreation values over time, we calculate the present value (PV) using the following standard formula:
∑= +
×=
T
ttt
rCSn
PV1 )1(
Where n is the population, r is the discount rate, t is time period (i.e., year), T is the number of years, and CS is the consumer surplus. We use discount rates of 3% and 7% and aggregate over 30 years.
The willingness to pay values derived from the contingent valuation method are present values. The annual willingness to pay value, WTPt, over t years that could be received from a lump sum amount, WTP, that earned an interest rate of i percent, is derived from the present value formula above, according to the formula below:

35
Tt iiWTPnWTP −+−
××=
)1(1
Where i is the interest rate. We use interest rates of 3% and 7% and T = 30 years. We refer to these calculations in the next section. Aggregate Benefits
The baseline recreation value of coastal marsh trips was estimated using the single-site TCM model. First, we assumed that all of the respondents’ day trips took place in the county of the typical trip. The product of the consumer surplus per trip and the number of trips was the annual consumer surplus (Table 40). Since the consumer surplus per trip estimates were derived from the demand model that includes recreation non-participants, the aggregate recreation value was the product of the consumer surplus per year and the number of households in the study region, 98,414. The sum of the county level recreation values was the baseline value. The baseline annual value of Saginaw Bay coastal marsh-related recreation was $12.2 million for day trips and another $3.7 million for overnight trips. The discounted present value of the baseline annual value was $239 million and $151 million using 3% and 7% discount rates.
Table 40. Travel Cost Method: Baseline Coastal Marsh Trip Value Day Trips
County
Consumer Surplus per
Trip Number of Day trips
Consumer Surplus per
Year
Annual Aggregate Value
(in millions) Iosco $36.74 0.59 $21.53 $2.12 Arenac $29.45 0.48 $14.26 $1.40 Bay $25.77 2.13 $54.88 $5.40 Tuscola $52.87 0.38 $20.13 $1.98 Huron $29.57 0.44 $13.07 $1.29
Total $12.19
Overnight Trips
Consumer Surplus per
Trip
Number of Overnight
Trips
Consumer Surplus per
Year
Annual Aggregate Value
(in millions) Iosco 60.90 0.23 $14.10 $1.39 Arenac 49.55 0.16 $8.08 $.796 Bay 22.78 0.26 $5.96 $.586 Tuscola 14.57 0.03 $0.49 $.048 Huron 47.01 0.20 $9.24 $.909
Total $3.73

36
The value of a quality improvement per trip was interpreted as the loss in welfare (i.e., well being or happiness) that a recreationist would experience on every trip occasion (Table 41). For example, the respondents who took trips typically took four trips each year. For comparability with the willingness to pay results, we scaled the recreation value of wetland acres from 1,000 acres to 1,125 acres. The individual welfare gain from an increase of 1,125 acres of wetlands was $2.12 (i.e., $0.47/trip × 4.02 annual trips × 1.125 scale factor). Multiplying this value by the product of the percentage of respondents who take trips and the number of households in the five county Saginaw Bay region yielded the aggregate value of an increase in 1,125 acres, $93,589, or about $83/acre/year. These values were for a single year. The aggregate discounted present value of the quality improvement was$1.83 million and $1.16 million using 3% and 7% discount rates.
Table 41. Random Utility Model: Aggregate Recreation Value of Increased Coastal Marsh
Wetland Acres (1000s) $0.47 Total Daytrips 4.02 Individual Value (1,125 acres) $2.12 Population 44,030 Annual Aggregate Value (1,125
acres) $93,589 Aggregate Value/acre/year $83.19
@ 3% = $1.83 million Aggregate Value, Present Value (1,125 acres) @ 7% = $1.16 million
The willingness-to-pay values must be interpreted with caution due to the lack of scope sensitivity. We interpreted the total coastal marsh value as the marginal willingness to pay for 1,125 acres. The marginal value of any additional acreage was zero. The average value per acre could be found with this estimate but this average must not be extrapolated beyond 1,125 acres.
Aggregate willingness to pay for 1,125 acres of protected marsh was the mean (average) willingness to pay multiplied by household population. The willingness to pay estimates were those from the hypothetical bias correction model with the “likelihood of payment” correction (Table 42). In other words, these willingness to pay estimates were higher and better reflected the value of coastal wetlands relative to the amount that might be collected through voluntary donations.
The high household population was the count from the 2000 U.S. Census adjusted for the proportion of respondents who are willing to pay a positive amount, 51%. The low household population was the U.S. Census count multiplied by the survey response rate, 22%, and the proportion of respondents who were willing to pay a positive amount, 51%. This population was based on the assumption that survey non-respondents had a zero willingness to pay.
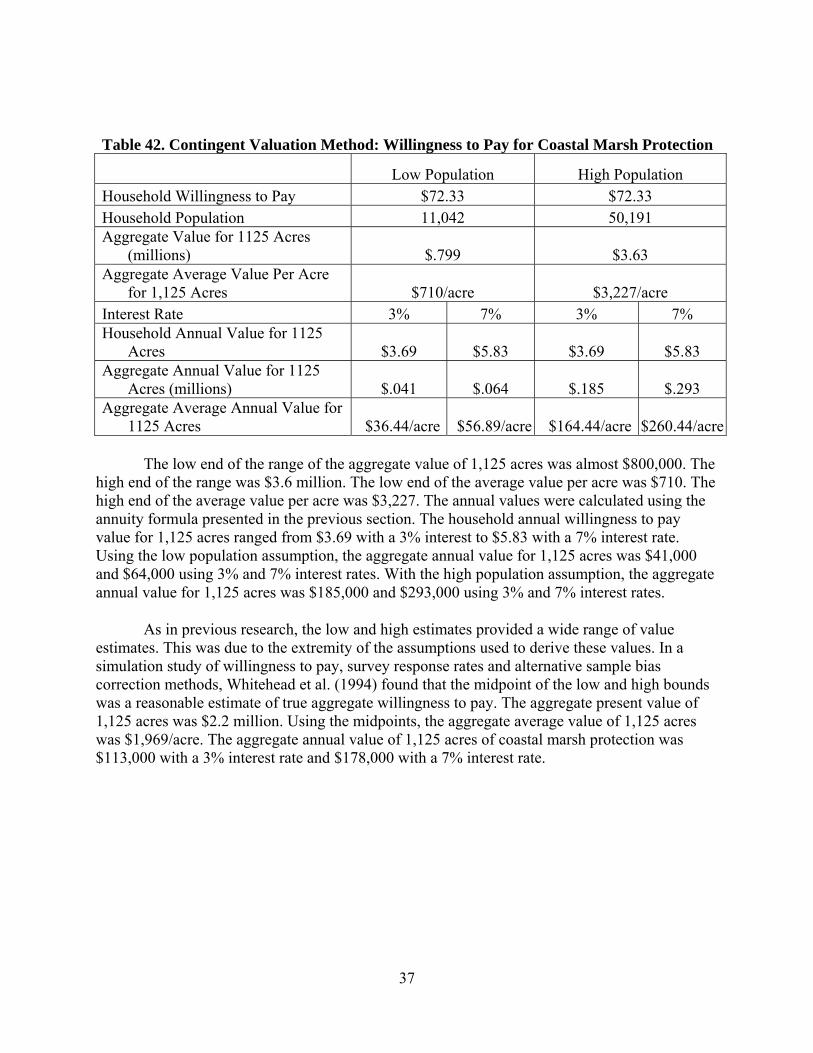
37
Table 42. Contingent Valuation Method: Willingness to Pay for Coastal Marsh Protection
Low Population High Population Household Willingness to Pay $72.33 $72.33 Household Population 11,042 50,191 Aggregate Value for 1125 Acres
(millions) $.799 $3.63 Aggregate Average Value Per Acre
for 1,125 Acres $710/acre $3,227/acre Interest Rate 3% 7% 3% 7% Household Annual Value for 1125
Acres $3.69 $5.83 $3.69 $5.83 Aggregate Annual Value for 1125
Acres (millions) $.041 $.064 $.185 $.293 Aggregate Average Annual Value for
1125 Acres $36.44/acre $56.89/acre $164.44/acre $260.44/acre
The low end of the range of the aggregate value of 1,125 acres was almost $800,000. The high end of the range was $3.6 million. The low end of the average value per acre was $710. The high end of the average value per acre was $3,227. The annual values were calculated using the annuity formula presented in the previous section. The household annual willingness to pay value for 1,125 acres ranged from $3.69 with a 3% interest to $5.83 with a 7% interest rate. Using the low population assumption, the aggregate annual value for 1,125 acres was $41,000 and $64,000 using 3% and 7% interest rates. With the high population assumption, the aggregate annual value for 1,125 acres was $185,000 and $293,000 using 3% and 7% interest rates.
As in previous research, the low and high estimates provided a wide range of value estimates. This was due to the extremity of the assumptions used to derive these values. In a simulation study of willingness to pay, survey response rates and alternative sample bias correction methods, Whitehead et al. (1994) found that the midpoint of the low and high bounds was a reasonable estimate of true aggregate willingness to pay. The aggregate present value of 1,125 acres was $2.2 million. Using the midpoints, the aggregate average value of 1,125 acres was $1,969/acre. The aggregate annual value of 1,125 acres of coastal marsh protection was $113,000 with a 3% interest rate and $178,000 with a 7% interest rate.

38
Conclusions
This final chapter of the report provides legislators, conservationists, and other interested
parties with overall economic assessments of the value of Saginaw Bay coastal marshes to area residents. The concluding figures presented here are derived from the analyses described in the preceding chapters.
To determine these concluding figures, we have estimated three basic forms of value associated with coastal marshes:
a) The value of recreation trips in the Saginaw Bay area, b) The recreational value of an additional 1,125 acres of coastal marsh, and c) Total value (i.e., recreation and other values) of protecting 1,125 acres of coastal
marsh.
In Table 43, we present the most reasonable annual and present value estimates for each of the three main values of coastal marsh.
First, the baseline value of Saginaw Bay coastal marsh recreation is large. Using the
travel cost method (TCM) for single sites, the annual value of day and overnight trips is $15.9 million. Aggregating this value over 30 years and taking the present value yields a capital value (i.e., lump sum value today) of $239 million.
The recreation value of an additional 1,125 acres is estimated with the site selection
travel cost method (TCM). The annual recreation value is $94,000 and the present value is $1.83 million. The contingent valuation method is used to estimate the total value held by the public for protecting 1,125 acres of existing coastal marsh. The annual value is $113,000 and the present value is $2.2 million. The willingness to pay values include the value of ecological functions and altruistic values to respondents.
Each acre of coastal marsh is worth $1,627 over a recreational user’s lifetime. And, over
and above the recreational value are the other values that come to light using the willingness to pay results. These values add $1,969 per acre over a lifetime—no small change. The recreation value and the willingness to pay value can be combined because analysis of the willingness to pay values indicated that they were not associated with increases in recreation trips. They are entirely passive use values. Therefore, the total value of each acre of coastal marsh is $3,596 over the lifetime of a resident of the sampled region.
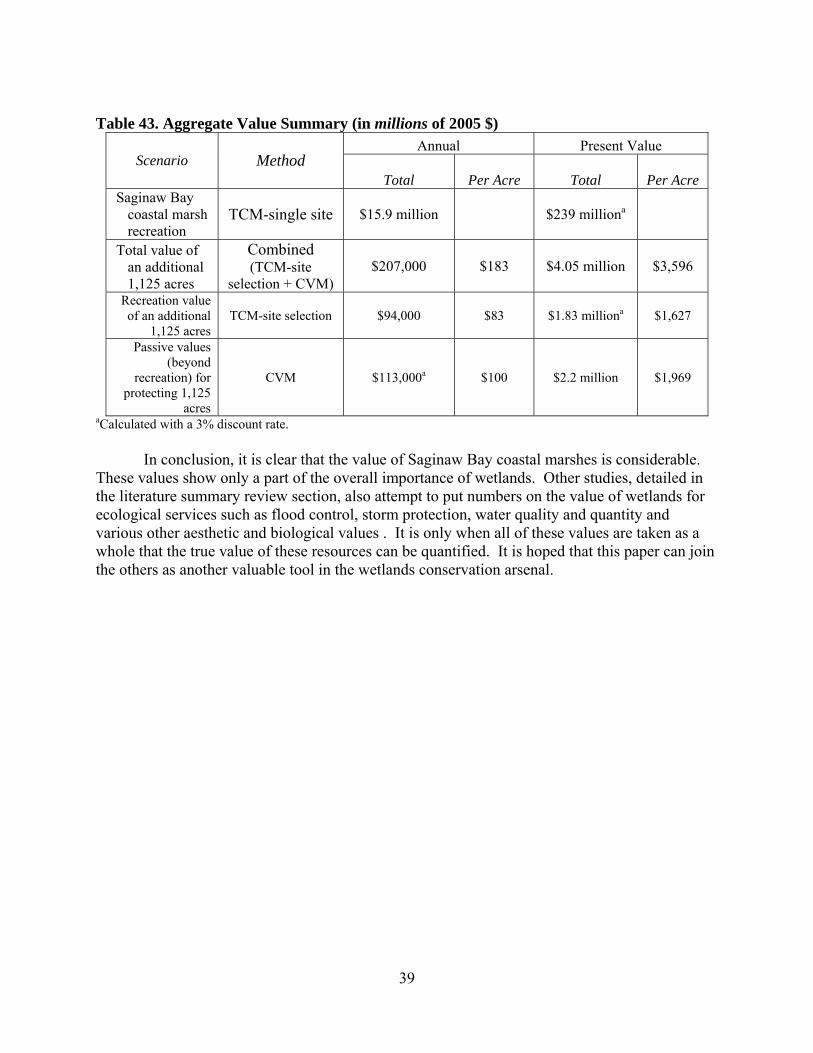
39
Table 43. Aggregate Value Summary (in millions of 2005 $)
Annual Present Value Scenario Method
Total Per Acre
Total Per Acre Saginaw Bay
coastal marsh recreation
TCM-single site $15.9 million $239 milliona
Total value of an additional 1,125 acres
Combined (TCM-site
selection + CVM) $207,000 $183 $4.05 million $3,596
Recreation value of an additional
1,125 acres TCM-site selection $94,000 $83 $1.83 milliona $1,627
Passive values (beyond
recreation) for protecting 1,125
acres
CVM $113,000a $100 $2.2 million $1,969
aCalculated with a 3% discount rate.
In conclusion, it is clear that the value of Saginaw Bay coastal marshes is considerable. These values show only a part of the overall importance of wetlands. Other studies, detailed in the literature summary review section, also attempt to put numbers on the value of wetlands for ecological services such as flood control, storm protection, water quality and quantity and various other aesthetic and biological values . It is only when all of these values are taken as a whole that the true value of these resources can be quantified. It is hoped that this paper can join the others as another valuable tool in the wetlands conservation arsenal.

40
References
Amacher, G.S., Brazee, R.J., Bulkley, J.W. and Moll, R.A. 1988. Interdisciplinary Approach to
Valuation of Michigan Coastal Wetlands. Michigan Institute of Water Research, E. Lansing, Technical Report 88-G1429-02, 101 pp.
Amacher, G.S., Brazee, R.J., Bulkley, J.W. and Moll, R.A. 1989. Application of Wetland
Valuation Techniques: Examples from Great Lakes Coastal Wetlands. Michigan Institute of Water Research, East Lansing, Technical Report 88-G1569-02, 48 pp
American Sportfishing Association, January 2003, “Sportfishing in America, Values of Our
Traditional Pastime.” Alexandria, Virginia.
Cameron, Trudy Ann and Michele James, "Efficient Estimation Methods for 'Closed Ended' Contingent Valuation Surveys," Review of Economics and Statistics, 69, 269-276, 1987.
Cameron, Trudy Ann, “Interval Estimates of Non-market Resource Values from Referendum Contingent Valuation Surveys,” Land Economics, 67, 413-421, 1991.
Costanza, R, R. d’Arge, R. de Groot, S. Farber, m. Grasso, B. Hannon, K. Limburg, S. Naeem, R.V. O;Neill, J. Paruelo, R. G. Raskin, P. Sutton and M. van den Belt, 1997, “The value of the world’s ecosystem services and natural capital”, Nature 387: 253-260.
Dumas, Christopher F., Peter W. Schuhmann, and John C. Whitehead, "Measuring the Economic
Benefits of Water Quality Improvement with the Benefit Transfer Method: An Introduction for Non-Economists," in Larry R. Brown et al., editors, Effects of Urbanization on Stream Ecosystems, Bethesda, MD: American Fisheries Society, forthcoming 2005.
EPA, 2001, “Saginaw River/Bay Area of Concern, http://www.epa.gov/glnpo/aoc/sagrivr.html Fielder, D.G., 2002, “Sources of walleye recruitment in Saginaw Bay, Lake Huron and
recommendations for further rehabilitation,” Michigan Department of Natural Resources fisheries Research Report 2062.
Fielder, D.G., J.E. Johnson, J. R. Weber, M.V. Thomas and R.C. Haas, 2000, Fish population
survey of Saginaw Bay, Lake Huron, 1989-97,” Michigan Dept. of Natural Resources, Fisheries Research Report No. 2052.
Freeman, A. Myrick, The Measurement of Environmental and Resource Values: Theory and Methods, Washington, DC: Resources for the Future, 2003.
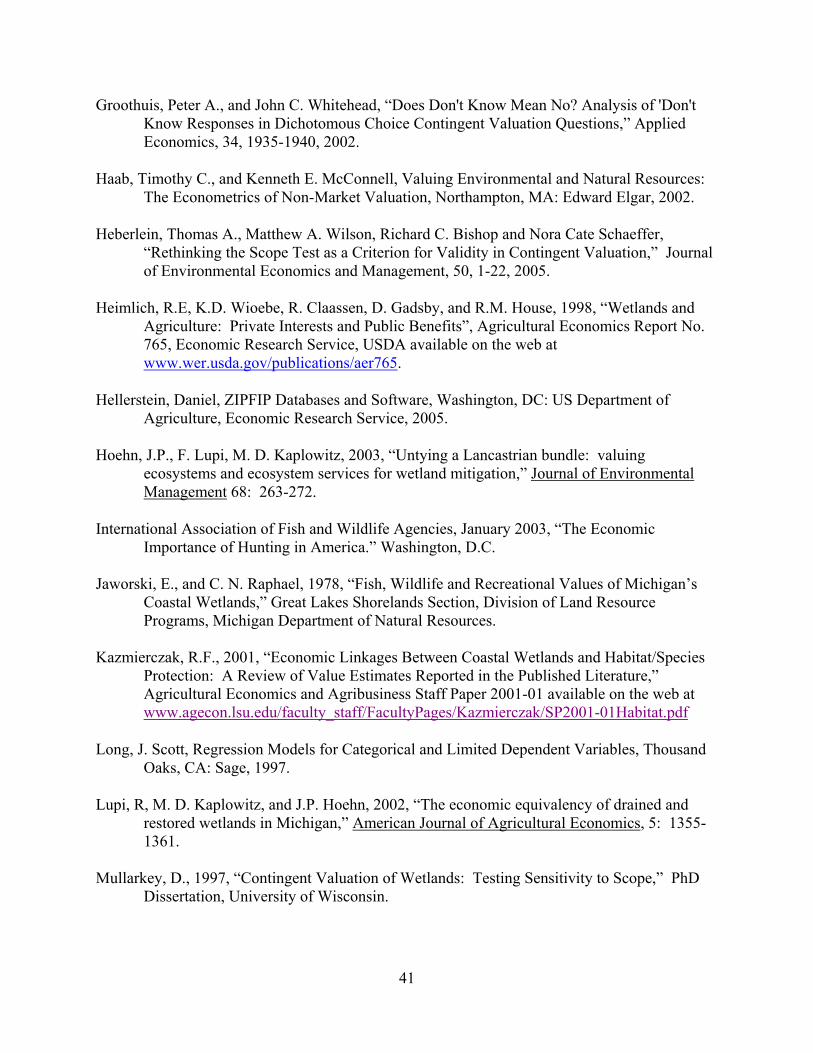
41
Groothuis, Peter A., and John C. Whitehead, “Does Don't Know Mean No? Analysis of 'Don't Know Responses in Dichotomous Choice Contingent Valuation Questions,” Applied Economics, 34, 1935-1940, 2002.
Haab, Timothy C., and Kenneth E. McConnell, Valuing Environmental and Natural Resources: The Econometrics of Non-Market Valuation, Northampton, MA: Edward Elgar, 2002.
Heberlein, Thomas A., Matthew A. Wilson, Richard C. Bishop and Nora Cate Schaeffer, “Rethinking the Scope Test as a Criterion for Validity in Contingent Valuation,” Journal of Environmental Economics and Management, 50, 1-22, 2005.
Heimlich, R.E, K.D. Wioebe, R. Claassen, D. Gadsby, and R.M. House, 1998, “Wetlands and Agriculture: Private Interests and Public Benefits”, Agricultural Economics Report No. 765, Economic Research Service, USDA available on the web at www.wer.usda.gov/publications/aer765.
Hellerstein, Daniel, ZIPFIP Databases and Software, Washington, DC: US Department of Agriculture, Economic Research Service, 2005.
Hoehn, J.P., F. Lupi, M. D. Kaplowitz, 2003, “Untying a Lancastrian bundle: valuing ecosystems and ecosystem services for wetland mitigation,” Journal of Environmental Management 68: 263-272.
International Association of Fish and Wildlife Agencies, January 2003, “The Economic Importance of Hunting in America.” Washington, D.C.
Jaworski, E., and C. N. Raphael, 1978, “Fish, Wildlife and Recreational Values of Michigan’s
Coastal Wetlands,” Great Lakes Shorelands Section, Division of Land Resource Programs, Michigan Department of Natural Resources.
Kazmierczak, R.F., 2001, “Economic Linkages Between Coastal Wetlands and Habitat/Species
Protection: A Review of Value Estimates Reported in the Published Literature,” Agricultural Economics and Agribusiness Staff Paper 2001-01 available on the web at www.agecon.lsu.edu/faculty_staff/FacultyPages/Kazmierczak/SP2001-01Habitat.pdf
Long, J. Scott, Regression Models for Categorical and Limited Dependent Variables, Thousand Oaks, CA: Sage, 1997.
Lupi, R, M. D. Kaplowitz, and J.P. Hoehn, 2002, “The economic equivalency of drained and restored wetlands in Michigan,” American Journal of Agricultural Economics, 5: 1355-1361.
Mullarkey, D., 1997, “Contingent Valuation of Wetlands: Testing Sensitivity to Scope,” PhD
Dissertation, University of Wisconsin.

42
NOAA, 2004, Commercial fishing statistics from: http://www.st.nmfs.gov/commercial/landings/annual_landings.html
Poe, Gregory L., Jeremy E. Clark, Daniel Rondeau, and William D. Schulze, “Provision Point Mechanisms and Field Validity Tests of Contingent Valuation,” Environmental and Resource Economics, 23, 105-131, 2002.
Riffell, S.K., B.E. Keas, T.M. Burton, 2001, “Area and relationships of birds in Great Lakes coastal wet meadows,” Wetlands, 21 (4): 492-507.
Riffell, S.K., B.E. Keas, T.M. Burton, 2003, “Birds in North American Great lakes coastal wet
meadows: Is landscape context important?” Landscape Ecology, 18 (2): 95-111. Schuyt, K. and L. Brander, 2004, “The Economic Value of the World’s Wetlands”, WWF,
Gland, Switzerland. USFWS, 2003, “2001 National and State Economic Impacts of Wildlife Watching”, USFWS
Report 2001-2, Arlington VA. van Vuuren, W. and P. Roy, 1993, “Private and social returns from wetland preservation versus
those from wetland conversion to agriculture,” Ecological Economics, 8: 289-305.
Whitehead, John C., "Item Nonresponse Bias in Contingent Valuation: Should CV Researchers Impute Values for Missing Independent Variables?" Journal of Leisure Research, 26, 296-303, 1994.
Whitehead, John C., "Willingness to Pay for Quality Improvements: Comparative Statics and Theoretical Interpretations of Contingent Valuation Results," Land Economics, 71, 207-215, 1995.
Whitehead, John C., Peter A. Groothuis, Thomas J. Hoban and William B. Clifford, "Sample
Bias in Contingent Valuation: A Comparison of the Correction Methods," Leisure Sciences, 16, 249-258, 1994.
Whitehead, John C., and Todd L. Cherry, “Mitigating the Hypothetical Bias of Willingness to Pay: A Comparison of Ex-Ante and Ex-Post Approaches,” Department of Economics Working Paper #04-21, Boone, NC: Appalachian State University, 2004.
Whitehead, John C., Timothy C. Haab, and Ju-Chin Huang, "Part-Whole Bias in Contingent Valuation: Will Scope Effects Be Detected with Inexpensive Survey Methods?" Southern Economic Journal, 65, 160-168, 1998.
Woodward, R.T. and Y.S. Wui, 2001, “The economic value of wetland services: a meta-
analysis, Ecological Economics, 37: 257-270.

43
APPENDIX A:
SURVEY INSTRUMENT
Eighteen variations of the following survey were distributed. The variations differed in the dollar bid requested and the number of acres offered for protection.

44
Thank you for taking the time to complete this survey! The results of this survey will be available on October 1, 2005. You can read a summary of the results on the internet at http://www.southwickassociates.com. Is there anything else you would like to tell us about your interest in Saginaw Bay coastal marshes? If so, please use this space.
- Prize Drawing -
To be entered into the drawing for $1,000 in cash, please provide your name and contact information. Winners will be randomly selected on June 17th, 2005 and notified by phone or email. First place will win $500, 2nd will win $200, and three survey respondents will win $100 each. If you responded to a similar survey in the past two months, you will be automatically entered into the drawing. A total of 3,600 people have been sent this survey and will be eligible to enter the drawing. Name:_____________________________________________________ Phone:____________________________________________________ Email (optional):______________________________________________
Please indicate your preferred method to be contacted: ? phone or ? email.
Saginaw Bay Coastal Marshes What Do You Think?
Artwork credit: Timothy Knepp, USFWS
This survey is intended to help shape Saginaw Bay area environmental policy. Pleaseanswer all of the questions in this booklet, even if you have never had experience with Saginaw Bay wetlands and marshes. Then return the completed questionnaire inthe enclosed, self-addressed, stamped envelope. This survey is being conducted cooperatively by the:
National Fish and Wildlife Foundation U.S. Environmental Protection Agency, Great Lakes National Program Offic Michigan Department of Environmental Quality Ducks Unlimited, Inc., Great Lakes/Atlantic Regional Office
The information that you provide will be kept strictly anonymous. Your name will never be associated with your answers. The questionnaire contains a hypothetical proposal that is not under consideration by state, local, or federal government. We are not asking you for money. If you have any questions about this survey, please contact Rob Southwick at (904) 277-9765.
If you want to be entered into the $1,000 drawing to be divided among five winners, please write your name, phone number or email on the back cover.
(Back Cover) (FRONT COVER)

45
SAGINAW BAY COASTAL MARSHES
First, we would like to ask questions about your knowledge of Saginaw Bay watershed and coastal marshes.
The Saginaw Bay watershed includes all or part of 22 counties that impact the Saginaw Bay coastal marsh system. Saginaw Bay coastal marshes are located in Iosco, Arenac, Bay, Tuscola, and Huron Counties. There are currently about 18,000 acres of coastal marsh located along the Saginaw Bay shoreline. Most of these are located from the middle of Arenac County to the middle of Huron County. Even if you don’t live in one of these counties, or if coastal marshes are not important to you, we need your survey response
-- 1 --
(22) In what year were you born?
19 __ __
(23) What is your zip code?
__ __ __ __ __
(24) Are you currently a member of, or contribute money to, any environmental or conservation organizations?
Yes No
(25) Do you or anyone in your family own shoreline property on Saginaw Bay?
Yes No
(26) How many years of schooling have you completed?
_______ Years
Some people consider the next question to be very personal. Remember that your answer will be kept strictly anonymous.
(27) As best as you can recall, please estimate your household's 2004 income before taxes?
Less than $18,000 Between $18,000 and $34,000 Between $34,000 and $54,000 Between $54,000 and $86,000 More than $86,000
-- 10 --
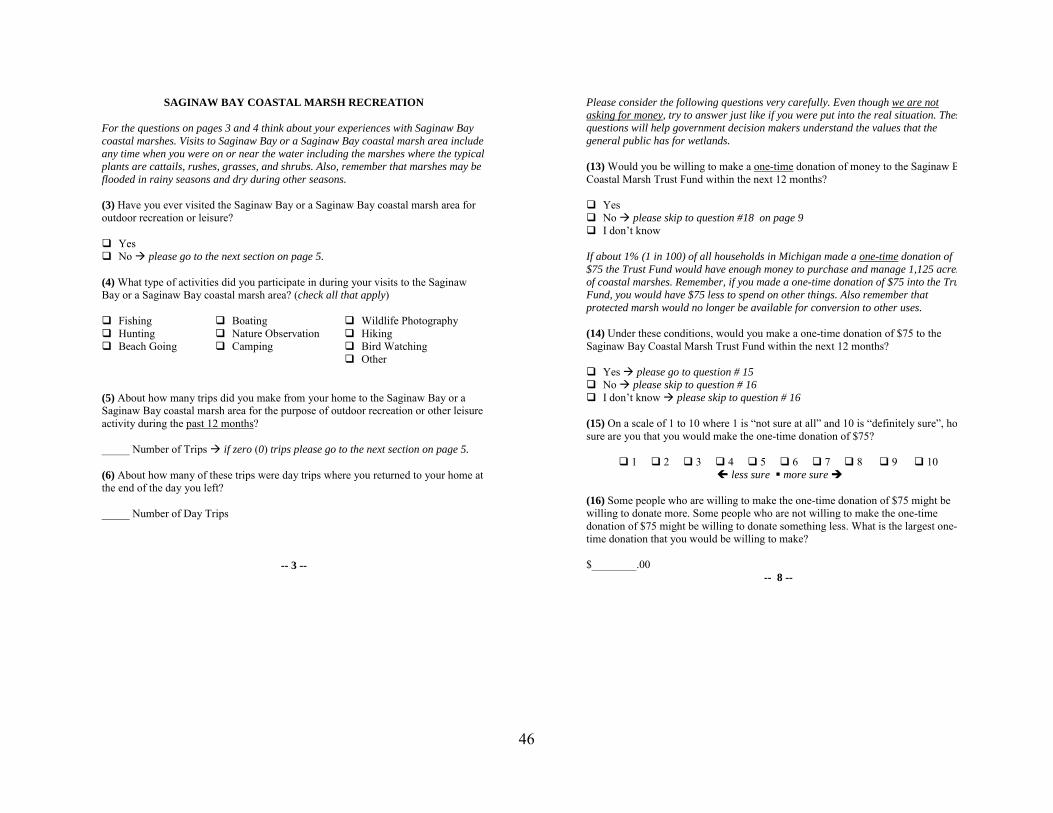
46
SAGINAW BAY COASTAL MARSH RECREATION
For the questions on pages 3 and 4 think about your experiences with Saginaw Bay coastal marshes. Visits to Saginaw Bay or a Saginaw Bay coastal marsh area include any time when you were on or near the water including the marshes where the typical plants are cattails, rushes, grasses, and shrubs. Also, remember that marshes may be flooded in rainy seasons and dry during other seasons.
(3) Have you ever visited the Saginaw Bay or a Saginaw Bay coastal marsh area for outdoor recreation or leisure?
Yes No please go to the next section on page 5.
(4) What type of activities did you participate in during your visits to the Saginaw Bay or a Saginaw Bay coastal marsh area? (check all that apply)
Fishing Hunting Beach Going
Boating Nature Observation Camping
Wildlife Photography Hiking Bird Watching Other
(5) About how many trips did you make from your home to the Saginaw Bay or a Saginaw Bay coastal marsh area for the purpose of outdoor recreation or other leisure activity during the past 12 months?
_____ Number of Trips if zero (0) trips please go to the next section on page 5.
(6) About how many of these trips were day trips where you returned to your home at the end of the day you left?
_____ Number of Day Trips
-- 3 --
Please consider the following questions very carefully. Even though we are not asking for money, try to answer just like if you were put into the real situation. Thesquestions will help government decision makers understand the values that the general public has for wetlands.
(13) Would you be willing to make a one-time donation of money to the Saginaw BCoastal Marsh Trust Fund within the next 12 months?
Yes No please skip to question #18 on page 9 I don’t know
If about 1% (1 in 100) of all households in Michigan made a one-time donation of $75 the Trust Fund would have enough money to purchase and manage 1,125 acresof coastal marshes. Remember, if you made a one-time donation of $75 into the TruFund, you would have $75 less to spend on other things. Also remember that protected marsh would no longer be available for conversion to other uses.
(14) Under these conditions, would you make a one-time donation of $75 to the Saginaw Bay Coastal Marsh Trust Fund within the next 12 months?
Yes please go to question # 15 No please skip to question # 16 I don’t know please skip to question # 16
(15) On a scale of 1 to 10 where 1 is “not sure at all” and 10 is “definitely sure”, hosure are you that you would make the one-time donation of $75?
1 2 3 4 5 6 7 8 9 10 less sure more sure
(16) Some people who are willing to make the one-time donation of $75 might be willing to donate more. Some people who are not willing to make the one-time donation of $75 might be willing to donate something less. What is the largest one-time donation that you would be willing to make? $________.00
-- 8 --
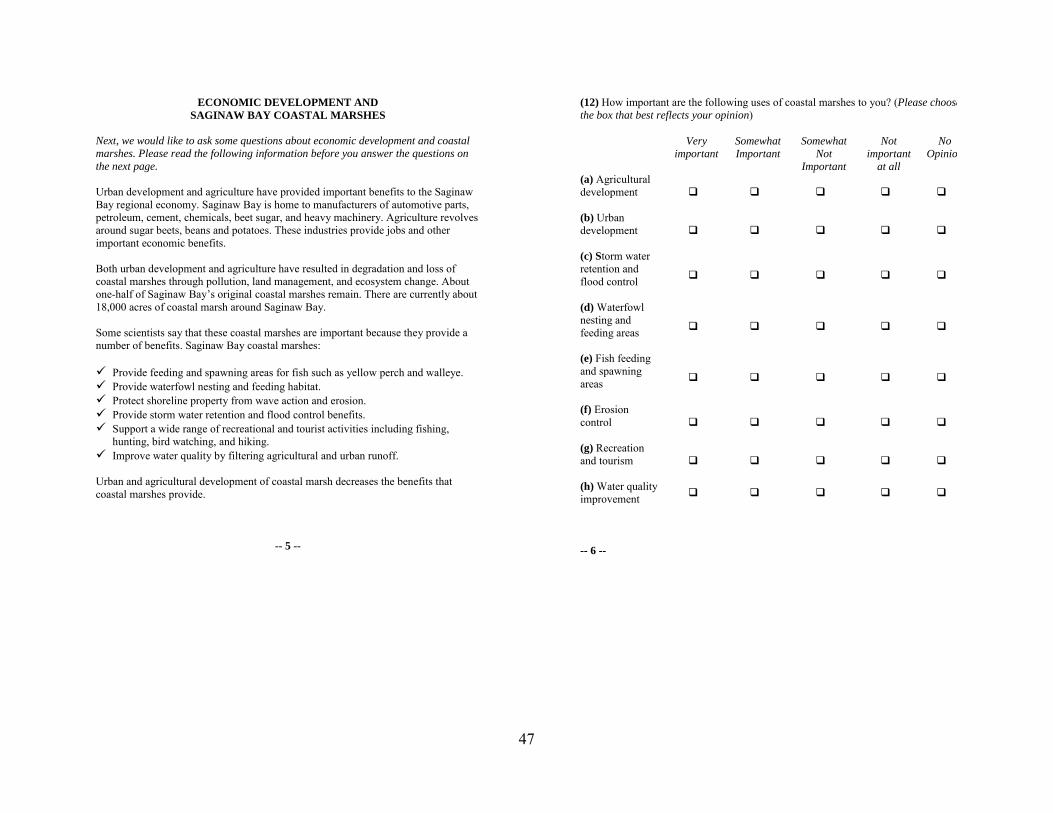
47
ECONOMIC DEVELOPMENT AND SAGINAW BAY COASTAL MARSHES
Next, we would like to ask some questions about economic development and coastal marshes. Please read the following information before you answer the questions on the next page. Urban development and agriculture have provided important benefits to the Saginaw Bay regional economy. Saginaw Bay is home to manufacturers of automotive parts, petroleum, cement, chemicals, beet sugar, and heavy machinery. Agriculture revolves around sugar beets, beans and potatoes. These industries provide jobs and other important economic benefits. Both urban development and agriculture have resulted in degradation and loss of coastal marshes through pollution, land management, and ecosystem change. About one-half of Saginaw Bay’s original coastal marshes remain. There are currently about 18,000 acres of coastal marsh around Saginaw Bay. Some scientists say that these coastal marshes are important because they provide a number of benefits. Saginaw Bay coastal marshes:
Provide feeding and spawning areas for fish such as yellow perch and walleye. Provide waterfowl nesting and feeding habitat. Protect shoreline property from wave action and erosion. Provide storm water retention and flood control benefits. Support a wide range of recreational and tourist activities including fishing,
hunting, bird watching, and hiking. Improve water quality by filtering agricultural and urban runoff.
Urban and agricultural development of coastal marsh decreases the benefits that coastal marshes provide.
-- 5 --
(12) How important are the following uses of coastal marshes to you? (Please choosethe box that best reflects your opinion)
Very
important Somewhat Important
Somewhat Not
Important
Not important
at all
No Opinio
(a) Agricultural development
(b) Urban development
(c) Storm water retention and flood control
(d) Waterfowl nesting and feeding areas
(e) Fish feeding and spawning areas
(f) Erosion control
(g) Recreation and tourism
(h) Water quality improvement
-- 6 --

48
A SAGINAW BAY COASTAL MARSH PROTECTION PROGRAM
What are Saginaw Bay coastal marshes worth to you? Please read the following hypothetical proposal before answering the questions on the next page. This imaginary proposal is not under consideration by state, local, or federal government and we are not asking you for money.
Currently, 9,000 out of 18,000 acres of Saginaw Bay coastal marshes are publicly owned and protected from development. Additional privately owned Saginaw Bay coastal marshes can be protected by purchasing the land from private landowners. Suppose a “Saginaw Bay Coastal Marsh Protection Program” is established. Voluntary contributions to a “Saginaw Bay Coastal Marsh Trust Fund” would be used to purchase and manage 1,125 acres of Saginaw Bay coastal marshes. The Trust Fund would be administered by a board of directors that would include representatives from the federal, state and local governments, conservation and environmental groups, and private landowners.
0
4.5
9
13.5
18
Acres of Saginaw Bay Coastal Marsh
Thou
sand
s
Existing marsh
Protected marsh
Proposed increase inprotected marsh
Money would be refunded if the total amount is not enough to purchase and manage 1,125 acres. If the amount of donated money is greater than the amount required to purchase and manage 1,125 acres, the extra money would be used to provide public access and educational sites at Saginaw Bay coastal marshes. If the “Saginaw Bay Coastal Marsh Protection Program” does not have enough funding to purchase and manage 1,125 acres of coastal marsh, these areas will continue to be lost due to agricultural, urban and other development.
-- 7 --
When you answer the questions on this page, think about your typical Saginaw BaySaginaw Bay coastal marsh area recreation trip.
(7) During your typical visit to the Saginaw Bay or a Saginaw Bay coastal marsh area, how long do you stay? (choose one)
Under 1 hour 4 to 8 hours 1 to 2 hours The whole day 2 to 4 hours More than one day
(8) What is the main recreational activity on your typical trip? (choose one)
Fishing Hunting Beach Going
Boating Nature Observation Camping
Wildlife Photography Hiking Bird Watching Other
(9) What Saginaw Bay coastal county do you most often travel to on your typical trip? (choose one)
Iosco Arenac Bay Tuscola Huron
(10) What is the name of the city or town that is closest to your typical recreation site?
______________________ (City or Town)
(11) As best as you can recall, how much money do you spend on a typical trip oncyou leave home until you return home? (Please include such items as gas for your or boat, food and beverages, and any equipment that can not be used for more thanone trip.)
$_______.00
-- 4 --

49
(17) Consider again the hypothetical proposal. How likely do you think it is that 1% of all households in Michigan would make a one-time donation of $75 to the Trust Fund within the next 12 months?
Very likely Somewhat likely
Somewhat not likely
Not likely at all
INFORMATION ABOUT YOUR HOUSEHOLD
Finally, we would like to ask some questions about you and your household. These questions will help us analyze the results of this study. Your answers will be kept strictly anonymous.
(18) How many people, including yourself, normally live in your household?
_____ People if one (1) person, please skip to question #20
(19) How many of these people are under the age of 18?
_____ People under the age of 18
(20) Are you male or female?
Male Female
(21) What group do you most identify with?
White/Caucasian African-American Latino/Hispanic Asian-American Other
-- 9 --
Coastal marshes include wet meadows, strands, emergent marsh and aquatic marsh.The typical plants in coastal marshes are cattails, rushes, grasses, and shrubs. Coastmarshes may be flooded in rainy seasons and dry during other seasons.
Figure 2. Coastal Marsh
(1) How much do you know about the Saginaw Bay watershed?
A lot Some A little Nothing
(2) How much do you know about Saginaw Bay coastal marshes?
A lot Some A little Nothing
-- 2 --
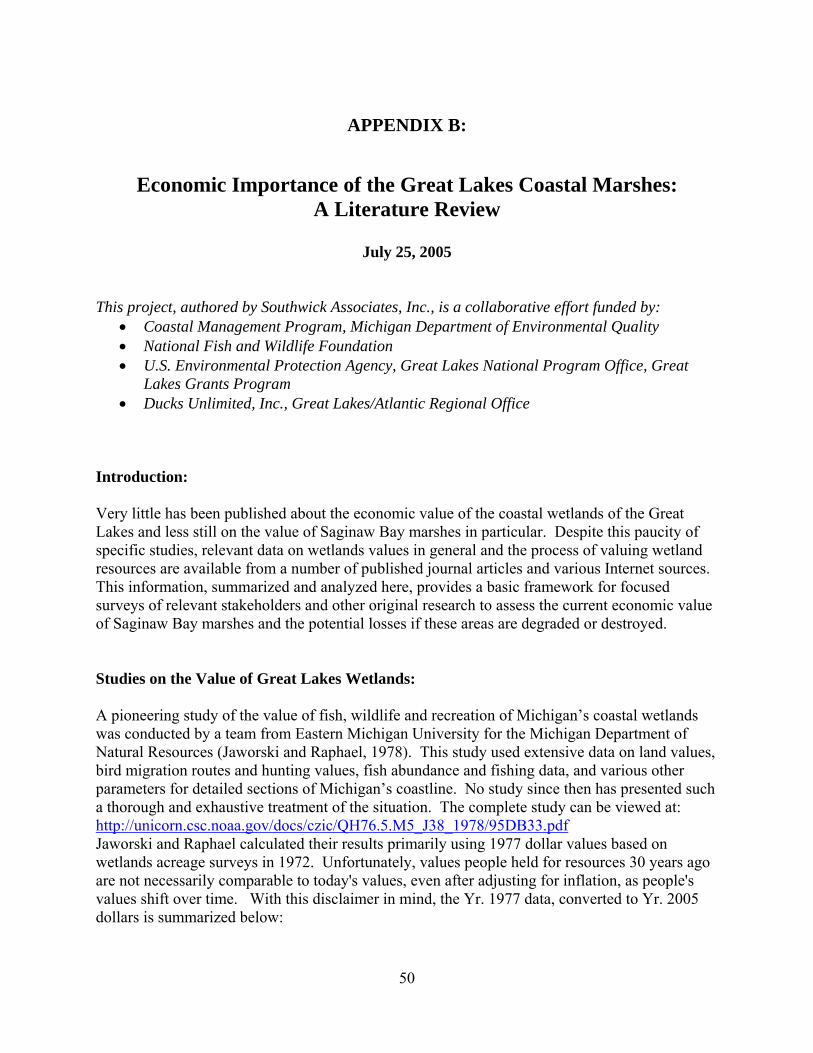
50
APPENDIX B:
Economic Importance of the Great Lakes Coastal Marshes: A Literature Review
July 25, 2005
This project, authored by Southwick Associates, Inc., is a collaborative effort funded by:
• Coastal Management Program, Michigan Department of Environmental Quality • National Fish and Wildlife Foundation • U.S. Environmental Protection Agency, Great Lakes National Program Office, Great
Lakes Grants Program • Ducks Unlimited, Inc., Great Lakes/Atlantic Regional Office
Introduction: Very little has been published about the economic value of the coastal wetlands of the Great Lakes and less still on the value of Saginaw Bay marshes in particular. Despite this paucity of specific studies, relevant data on wetlands values in general and the process of valuing wetland resources are available from a number of published journal articles and various Internet sources. This information, summarized and analyzed here, provides a basic framework for focused surveys of relevant stakeholders and other original research to assess the current economic value of Saginaw Bay marshes and the potential losses if these areas are degraded or destroyed. Studies on the Value of Great Lakes Wetlands: A pioneering study of the value of fish, wildlife and recreation of Michigan’s coastal wetlands was conducted by a team from Eastern Michigan University for the Michigan Department of Natural Resources (Jaworski and Raphael, 1978). This study used extensive data on land values, bird migration routes and hunting values, fish abundance and fishing data, and various other parameters for detailed sections of Michigan’s coastline. No study since then has presented such a thorough and exhaustive treatment of the situation. The complete study can be viewed at: http://unicorn.csc.noaa.gov/docs/czic/QH76.5.M5_J38_1978/95DB33.pdf Jaworski and Raphael calculated their results primarily using 1977 dollar values based on wetlands acreage surveys in 1972. Unfortunately, values people held for resources 30 years ago are not necessarily comparable to today's values, even after adjusting for inflation, as people's values shift over time. With this disclaimer in mind, the Yr. 1977 data, converted to Yr. 2005 dollars is summarized below:

51
Table B-1: Average economic value of Michigan wetlands (Jaworski and Raphael, 1978) in Yr. 1977 dollars and converted to Yr. 2005 dollars (See note*) Value per acre/yr Yr. 1977 dollars Yr. 2005 dollars Overall value $489.69 $1,578.16 Sportfishing $286 $921.71 Nonconsumptive recreation $138.24 $445.52 Waterfowl hunting $31.23 $100.65 Trapping of furbearers $30.44 $98.10 Commercial fishing $3.78 $12.18
* Note: Values people held for resources 30 years ago are not necessarily comparable to today's values, even after adjusting for inflation, as people's values shift over time. Please be cautious when using old data.
Three more recent studies referred to in the literature also attempted to assess the economic value of Great Lakes coastal wetlands (Amacher et al, 1988, Amacher et al, 1989 and van Vuuren and Roy, 1993.) The Amacher et al (1988) paper provides a synthesis and summary of wetlands valuation methods applicable to Great Lakes coastal wetlands, but does not provide numerical estimates of these values. A follow-on paper (Amacher et al, 1989) attempts to provide figures for the fisheries and wetlands of Lake St. Clair and Saginaw Bay. This data is summarized and analyzed in Internet footnotes (http://ageco.tamu.edu/faculty/woodward/paps/WetMetaData.PDF ) from a more recent paper (Woodward and Wui, 2001). Among the sites studied by Amacher et al (1989) was an 8,500 acre coastal wetland site in Saginaw Bay and economic values for this site were calculated for commercial fishing catches from 1983-85. In the Woodward and Wui analyses of the Amacher et al data, the marginal catch pound per acre was 169.42 per month yielding a mean value of $114.36 (yr. 1990 $) per acre. Van Vuuren and Roy (1993) studied the different values of wetland areas of Lake St. Clair (Michigan and Canada) to private duck hunters and public hunters, anglers and trappers using a travel cost analysis method. Three sites were examined: a 49.4 acre diked wetland site, a 370.7 acre diked wetland site and a 741 acre undiked site. The value per acre of these sites in base year 1993 $ and converted to yr. 2000 $ is presented in Table 2.
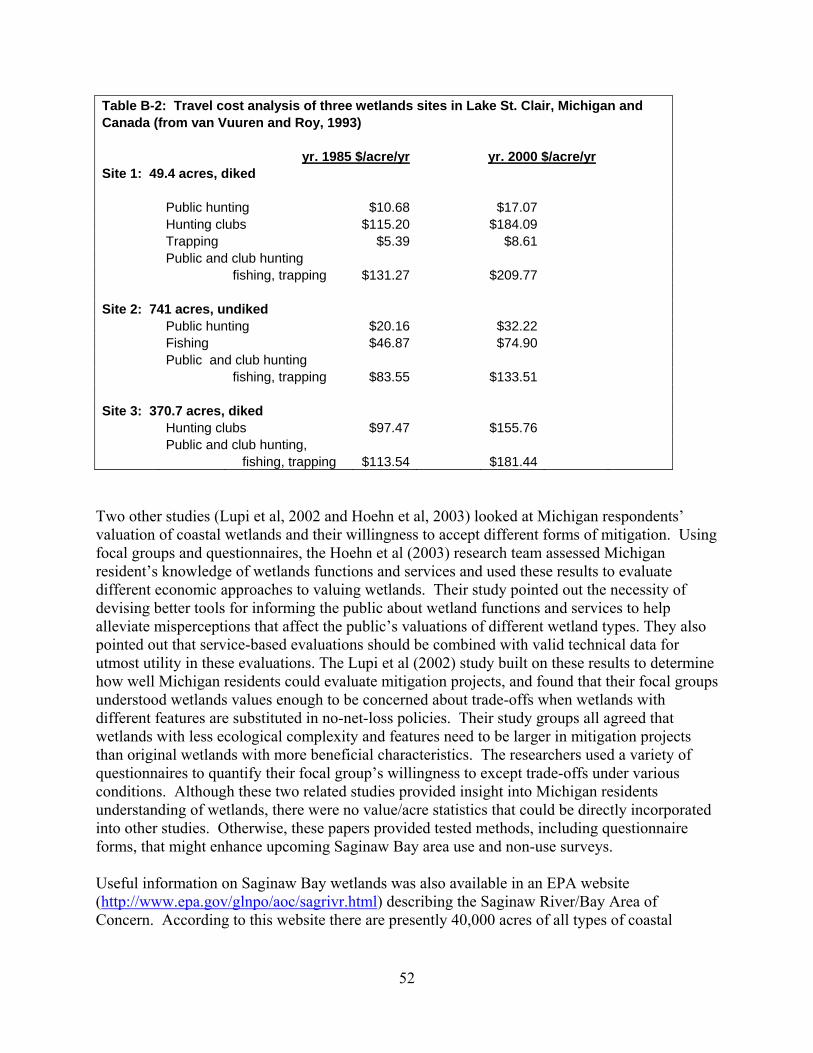
52
Table B-2: Travel cost analysis of three wetlands sites in Lake St. Clair, Michigan and Canada (from van Vuuren and Roy, 1993) yr. 1985 $/acre/yr yr. 2000 $/acre/yr Site 1: 49.4 acres, diked Public hunting $10.68 $17.07 Hunting clubs $115.20 $184.09 Trapping $5.39 $8.61 Public and club hunting fishing, trapping $131.27 $209.77 Site 2: 741 acres, undiked Public hunting $20.16 $32.22 Fishing $46.87 $74.90 Public and club hunting fishing, trapping $83.55 $133.51 Site 3: 370.7 acres, diked Hunting clubs $97.47 $155.76 Public and club hunting, fishing, trapping $113.54 $181.44
Two other studies (Lupi et al, 2002 and Hoehn et al, 2003) looked at Michigan respondents’ valuation of coastal wetlands and their willingness to accept different forms of mitigation. Using focal groups and questionnaires, the Hoehn et al (2003) research team assessed Michigan resident’s knowledge of wetlands functions and services and used these results to evaluate different economic approaches to valuing wetlands. Their study pointed out the necessity of devising better tools for informing the public about wetland functions and services to help alleviate misperceptions that affect the public’s valuations of different wetland types. They also pointed out that service-based evaluations should be combined with valid technical data for utmost utility in these evaluations. The Lupi et al (2002) study built on these results to determine how well Michigan residents could evaluate mitigation projects, and found that their focal groups understood wetlands values enough to be concerned about trade-offs when wetlands with different features are substituted in no-net-loss policies. Their study groups all agreed that wetlands with less ecological complexity and features need to be larger in mitigation projects than original wetlands with more beneficial characteristics. The researchers used a variety of questionnaires to quantify their focal group’s willingness to except trade-offs under various conditions. Although these two related studies provided insight into Michigan residents understanding of wetlands, there were no value/acre statistics that could be directly incorporated into other studies. Otherwise, these papers provided tested methods, including questionnaire forms, that might enhance upcoming Saginaw Bay area use and non-use surveys. Useful information on Saginaw Bay wetlands was also available in an EPA website (http://www.epa.gov/glnpo/aoc/sagrivr.html) describing the Saginaw River/Bay Area of Concern. According to this website there are presently 40,000 acres of all types of coastal
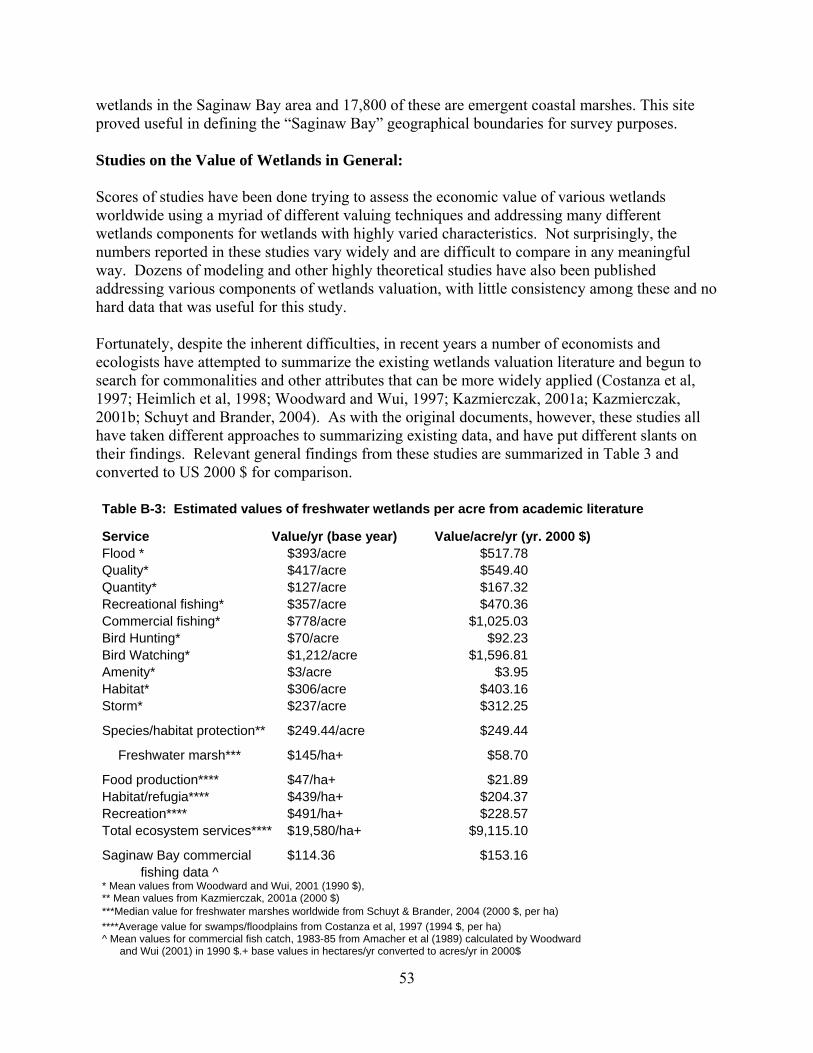
53
wetlands in the Saginaw Bay area and 17,800 of these are emergent coastal marshes. This site proved useful in defining the “Saginaw Bay” geographical boundaries for survey purposes. Studies on the Value of Wetlands in General: Scores of studies have been done trying to assess the economic value of various wetlands worldwide using a myriad of different valuing techniques and addressing many different wetlands components for wetlands with highly varied characteristics. Not surprisingly, the numbers reported in these studies vary widely and are difficult to compare in any meaningful way. Dozens of modeling and other highly theoretical studies have also been published addressing various components of wetlands valuation, with little consistency among these and no hard data that was useful for this study. Fortunately, despite the inherent difficulties, in recent years a number of economists and ecologists have attempted to summarize the existing wetlands valuation literature and begun to search for commonalities and other attributes that can be more widely applied (Costanza et al, 1997; Heimlich et al, 1998; Woodward and Wui, 1997; Kazmierczak, 2001a; Kazmierczak, 2001b; Schuyt and Brander, 2004). As with the original documents, however, these studies all have taken different approaches to summarizing existing data, and have put different slants on their findings. Relevant general findings from these studies are summarized in Table 3 and converted to US 2000 $ for comparison. Table B-3: Estimated values of freshwater wetlands per acre from academic literature
Service Value/yr (base year) Value/acre/yr (yr. 2000 $) Flood * $393/acre $517.78 Quality* $417/acre $549.40 Quantity* $127/acre $167.32 Recreational fishing* $357/acre $470.36 Commercial fishing* $778/acre $1,025.03 Bird Hunting* $70/acre $92.23 Bird Watching* $1,212/acre $1,596.81 Amenity* $3/acre $3.95 Habitat* $306/acre $403.16 Storm* $237/acre $312.25
Species/habitat protection** $249.44/acre $249.44
Freshwater marsh*** $145/ha+ $58.70
Food production**** $47/ha+ $21.89 Habitat/refugia**** $439/ha+ $204.37 Recreation**** $491/ha+ $228.57 Total ecosystem services**** $19,580/ha+ $9,115.10
Saginaw Bay commercial $114.36 $153.16 fishing data ^
* Mean values from Woodward and Wui, 2001 (1990 $), ** Mean values from Kazmierczak, 2001a (2000 $) ***Median value for freshwater marshes worldwide from Schuyt & Brander, 2004 (2000 $, per ha) ****Average value for swamps/floodplains from Costanza et al, 1997 (1994 $, per ha) ^ Mean values for commercial fish catch, 1983-85 from Amacher et al (1989) calculated by Woodward and Wui (2001) in 1990 $.+ base values in hectares/yr converted to acres/yr in 2000$

54
Of these studies, Costanza et al (1997) took the most holistic view, with an attempt to value all ecosystem services for all biomes worldwide and to consolidate these into global figures. Wetlands, divided into saltwater/mangroves and freshwater swamps/floodplains, were among the biomes considered in this assessment. Figures for this study originated in literature reviews in addition to original calculations based on theoretical assumptions made by a team of ecologists during an intensive weeklong workshop. Worldwide studies were considered, with necessary adjustments for currency and GNP. Many of the ecosystem services they analyzed, such as nutrient cycling, gas, climate, water and disturbance regulation, soil formation, pollination, biological control, etc. were values rarely addressed in economic literature, and translate to values far exceeding those for other more pragmatic services valued in other studies. Interestingly, a few of the services they analyzed, including habitat/refugia and recreation do fall in line with similar figures from other more localized wetlands valuation studies. One factor, food production, was much lower than most other studies addressing the value of fish and wildlife harvested from U.S. wetlands. In our opinion, this may in part relate to the additional recreation value associated with public harvesting of fish and wildlife in the U.S. compared to more subsistence-oriented harvests in some other parts of the world. The most comparable parameters to other U.S. studies are included in Table 3. Another globally based analysis, with widely different results was conducted by Schuyt and Brander (2004) for World Wildlife Fund based on 89 studies in the database of the Institute for Environmental Studies in Amsterdam. These figures stem from studies from around the world, but a number of values not relevant to US studies, such as firewood collecting, are included, and others that are of key importance in coastal Great Lakes wetlands, commercial fishing for instance, are not included. In this study, the median wetland economic value calculated for freshwater marshes, at $145/ hectare /year ($57/ acre/yr) was much below the numbers extracted from U.S. summary studies and the Costanza et al (1997) global study. Kazmierczak (2001b) summarized 12 peer-reviewed studies evaluating economic linkages between coastal wetlands and hunting and fishing and found that these figures ranged widely from study to study. Aggregate hunting and fishing (commercial combined with recreational) values ranged from $16.76/acre/year to $1,025.03/acre/year in yr. 2000 US dollars. Willingness-to- pay studies were slightly more consistent between studies, but still ranged from $83.99 to $616.36/acre. He concluded that the value of hunting and fishing among different wetland sites depends on geographic location, the fishery in question, and other factors that differ widely from place to place. No number from this analysis was validly extractable for the purposes of a study of the Great Lakes coastal marshes. In a related study (Kazmierczak, 2001 a) of economic linkages between coastal wetlands and habit/species protection, more consistency was found across the eight peer-reviewed studies that were examined. These values ranged from a low of $168.96/acre/yr (yr. 2000 $$) to a high of $403.16/acre/yr. with a mean of $249.44/acre/yr for species/habitat protection. In conclusion, Kazmierczak stated that “Geographic location and type of marshland appeared to have a relatively minor impact on the estimated values.” Indeed, his overall figure was remarkably

55
close to the figure of $204.37 (yr. 2000$) for habitat/refugia that was obtained from the international economic analysis of Costanza et al (1997). Heimlich, et al (1998) also summarized a number of wetland valuation studies from the United States and Canada and divided the findings into the categories of “marketed goods”, “non-marketed goods” and “ecological functions” with values given in 1992 US dollars per. They considered marketed goods to be fish, shellfish, and fur-bearing animals, and divided non-marketed goods into a variety of categories including “general non-users” and “users” of fishing, hunting, recreation, etc. “Ecological functions” include amenity and cultural uses, and general unspecified uses. A wide range of values are given for all of these categories and many of these categories were unexplained and/or very different from other attempts to quantify these in the literature and were not considered further in this report. Finally, Woodward and Wui (2001) analyzed 46 studies and selected 39 of them with sufficient commonalities to enable viable comparisons. Their “meta-analysis” of these studies showed a wide range of values for all wetlands categories that were examined. Surprisingly, those that they deemed “weak” and “strong” studies had similar ranges in values. Results were reported in yr 1990 $/acre for “single services” wetlands, and the authors stated that these numbers were not additive. Their results are summarized in Table 3 for single service wetlands. The authors pointed out that these numbers cannot validly be totaled up, since many of these services overlap others. Of all the services they studied birdwatching and commercial fishing yielded the highest values by far per acre of wetland. Due to the wide range in figures, the authors concluded that finding summary figures from the literature was not as useful as direct studies of the value of particular sites. Sport Hunting and Fishing in Michigan: Although the Saginaw Bay coastal wetlands are important to duck hunters and the fish produced here are important to sport fisherman catching yellow perch, walleye and other species in the Bay, it is difficult to quantify the economic contribution of these marshes. Little data is available on the economic aspects of duck hunting. Regarding economic impacts, due to a small sample size, results were not available for bird hunting in Michigan in a recent state-by-state hunting economics report (IAFWA, 2003). The overall numbers, based on a national survey conducted by the U.S. Bureau of the Census and the U.S. Fish and Wildlife Service, show that the state has 753,507 hunters, spending $671,670,664 for hunting related goods and services with a total multiplier effect of $1,281,527,914. Most of this accrues from deer hunting, which accounts for 666,801 hunters (or 88.5% of the hunters in the state). A 1991 version of the same report showed migratory bird hunting represented five percent of hunters’ expenditures in Michigan In addition, migratory bird hunting represented 10.8 percent of all national hunting expenditures in 1991, and 11.1 percent in 2001. Recognizing that migratory bird hunting activity in Michigan may not have followed the same trends as national migratory bird hunting activities, this may still be a positive indication that the same percentages between general hunting and migratory bird hunting in 1991 might apply in 2001 for Michigan. There is no breakdown, however, on how much money duck hunters actually spend hunting in the coastal wetlands of Saginaw Bay specifically, and more research is needed to attempt to quantify this.

56
Michigan is one of the top ten states for sport fishing, accounting for $2.17 billion of economic output in 2001 (ASA, 2003). Many of these anglers fish in the Great Lakes. In 2001, Michigan had 680,000 Great Lakes anglers, spending 7,002,122 days fishing. These anglers provided an economic output of $1,115,439,183 and accounted for 11,274 jobs. Saginaw Bay is known for its yellow perch (Perca flavescens) and walleye (Sandor vitreus) sport fisheries with many charter boat operators originating in this area. Fielder et al (2000) reported that there was an annual average of 287,000 angler trips in Saginaw Bay during April-Oct in 1991-97 and that 90% of the fish caught were yellow perch, followed by walleye, then other assorted species. Both yellow perch and walleye are known to sometimes spawn in shallow water of the coastal marshes, as well as offshore reefs. The coastal marshes of Saginaw Bay no doubt contribute stock to both fisheries, although walleye stocks in recent years have also been greatly enhanced with hatchery released fish (Fielder et al, 2002). There is no economic value at present attributable to the Saginaw Bay coastal marsh contribution to sport fishing activities in the Bay but it is likely to be significant. As can be seen in Table 4, the yield (in kilograms) and harvest in numbers times 1000) of sport fish from Saginaw Bay, although not as high as historic commercial levels, continues to be considerable.
Table B-4: The total annual harvest and yield from Saginaw Bay sport fishery 1983-2000, with average annual historic (1891-1944) commercial values for comparison. Sport fishery values include open water, ice fishery and Saginaw/Tittabawassee River harvests as estimated by creel surveys with on-surveyed portions extrapolated from averages of surveyed years (Fielder et al, 2002).

57
Commercial Fishing in Michigan Great Lakes: Data on commercial fishing landings, available from http://www.st.nmfs.gov/commercial/landings/annual_landings.html, are tabulated for each state, including figures for both walleye and yellow perch in Michigan. Michigan is the only state in the country reporting catches of walleye. Table 5 gives a summary of these figures for years 1999-2002, the latest year for which data is available. From the same source as the commercial fisheries data, as with the sportfishing data, it is difficult to determine the contribution of the spawning and nursery grounds of the coastal wetlands of Saginaw Bay to these numbers, but they are likely to have an impact. Amacher et al (1989), using 1983-85 commercial fishing catches attempted such an analysis for Saginaw Bay, however, and determined that the contribution to commercial fishing harvest yielded a mean value of $114.36 (yr. 1990 $) per acre. Converted to yr.2000 dollars, this amounts to $153.16/acre of wetland, providing fish harvests remain at similar levels. Although there is no information available on commercial catches in Saginaw Bay some insight can be obtained by looking at trends in overall catches of all species in Michigan over the years. Commercial catches of all fish in Michigan have declined since 1985 in pounds, but the price of these catches increased. In 1985, for instance, 7 800.1 metric tons of fish were landed in Michigan, for a total value of $7,515,000. In 2002, only 4,290.8 metric tons were landed in Michigan, but these had a similar value of $7,361,985. Given the similarity in the economic value of fish landed in 1985 and in 2002, the number calculated by Amacher et al (1989), converted to yr 2000$ of $153.16 may still be a good estimation of the contribution of Saginaw Bay marshes to commercial fisheries in the Bay. Birdwatching and Nature Viewing in Great Lakes coastal wetlands: The coastal wetlands of Saginaw Bay provide habitat for abundant and diverse bird populations, which attract birdwatchers and nature viewers from around the State. Researchers studying Lake Huron coastal wetlands have found that birds are more abundant and more species are found on larger wetland areas with more structural diversity in the horizontal and vertical planes (Riffel et al, 2001). They have also determined that the landscape context of these wetlands and the character of the surrounding areas also influence the type and numbers of birds to be seen (Riffel et al, 2003). Providing as large a tract possible of the most diverse wetlands creates the best birdwatching conditions. Unfortunately, little data exists on the economic impact of birdwatching and nature viewing in Saginaw Bay’s coastal marshes. A nationwide report on the economic benefits of nature viewing indicated that about 2.7 million people in Michigan participated in nature viewing activities in Michigan in 2001, for a combined expenditure of $692.8 million in 2001, for an output of $1.307 billion (including direct, indirect and induced effects) and accounting for 17,350 jobs in the State (USFWS, 2003.) It is difficult to extrapolate figures specific to Saginaw Bay from these numbers, but they are no doubt considerable.
58
Other activities with economic value: Various anecdotal accounts were also given of the presence of wild rice, cranberries and other products in coastal Great Lakes wetlands that are collected by some local people and native Americans, and likely provide some additional level of economic value for marshes. No references have been found, however, that give the amount harvested or the values this might entail for Saginaw Bay marshes. Other activities and services may also come to light in further research. Recommendations for Further Clarifications: Midwest Wetlands Value The data and literature summarized here gives a good framework for further economic studies of the value of coastal wetlands of Saginaw Bay. This literature has been summarized in a standard “Literature analysis” form in another document. Comments on some issues are italicized in the text above. Based on these two documents, however, further clarifications may be needed in the final study, as follows: (Authors’ note: the literature review presented in this Appendix was conducted prior to the economic analysis. The gaps identified below were then considered when planning the economic study. The Executive Summary includes recommendations about additional research that could be initiated next). • One key paper used in the summary was only available via abstracts and from other analyses
in which it was referred to. van Vuuren, W. and P. Roy, 1993, “Private and social returns from wetland preservation versus those from wetland conversion to agriculture,” Ecological Economics, 8: 289-305.
• Extrapolating from the Amacher et al (1989) estimate of the value of Saginaw Bay marshes for commercial fishing, in the literature analysis summary document, provides a bit of a leap to use it today. Presumably their estimates came from landings of commercial fish in Saginaw Bay, and not statewide. I’ve tried to compare these to statewide landings over the years and justified acceptance of his estimates. Is this fair?
• It may be helpful to have better targeted information, such as:
1. Fish landings in Saginaw Bay for fish that spawn in the marshes 2. Numbers of duck hunters, anglers, birdwatchers, etc. in Saginaw Bay coastal
marshes 3. Value/acre of this land on the real estate market 4. Information on other products (wild rice?) harvested in these wetlands
• The Hoehn (2002) and Lupi (2003) papers identify the level of knowledge Michigan residents have regarding wetlands and their benefits, plus information regarding questionnaire content and design. The results will help strengthen the results. • Existing EPA information regarding Saginaw Bay wetlands may likely define the geographic boundaries of this study.

59
• The results of the literature review define many of the wetland services and functions that can be measured in the general public survey. • The available literature regarding commercial values is old. Newer data specific to Saginaw was not located. If such data is needed, we will contact the DNR to see if more specific data are available. There is no need to include commercial fisheries in the upcoming surveys as their values are derived from the income generated through harvests. • Recreational landing data versus total catch (landings and released) need to be researched on noaa.gov to gain a better idea of release rates and habits among MI Great lakes anglers. Conclusions This review summarizes a number of studies that address the value of Midwest coastal marshes and of wetlands in general. What is not yet clear is the amount of money that it would cost to replace the services that these natural ecosystems provide to human residents nearby. Without wetlands, more human-engineered structures would need to be built to shelter people from storm surges, to filter and treat their drinking water, to control for erosion, to hatch and restock fish and other food sources. All of these services wetlands provide free of charge. A number of authors of wetlands valuation studies try to address these issues, but it is not until the taxpayers actually see the money needed to replace these natural services that people will begin to pay attention to wetlands loss. As inflationary costs for building material and energy sources rise, so too will rise the cost of new construction of erosion and flood control barriers, water treatment plants and other facilities. It is in the public’s best long term interest to protect the wetland resources that exist now, to offset increasingly huge costs to replace the services they presently provide.

60
Bibliography (for Appendix B only)
Amacher, G.S., Brazee, R.J., Bulkley, J.W. and Moll, R.A. 1988. Interdisciplinary Approach to Valuation of Michigan Coastal Wetlands. Michigan Institute of Water Research, E. Lansing, Technical Report 88-G1429-02, 101 pp.
Amacher, G.S., Brazee, R.J., Bulkley, J.W. and Moll, R.A. 1989. Application of Wetland Valuation Techniques: Examples from Great Lakes Coastal Wetlands. Michigan Institute of Water Research, East Lansing, Technical Report 88-G1569-02, 48 pp
American Sportfishing Association, January 2003, “Sportfishing in America, Values of Our Traditional Pastime.” Alexandria, Virginia. Costanza, R, R. d’Arge, R. de Groot, S. Farber, m. Grasso, B. Hannon, K. Limburg, S. Naeem, R.V. O;Neill, J. Paruelo, R. G. Raskin, P. Sutton and M. van den Belt, 1997, “The value of the world’s ecosystem services and natural capital”, Nature 387: 253-260. EPA, 2001, “Saginaw River/Bay Area of Concern, http://www.epa.gov/glnpo/aoc/sagrivr.html Fielder, D.G., 2002, “Sources of walleye recruitment in Saginaw Bay, Lake Huron and recommendations for further rehabilitation,” Michigan Department of Natural Resources fisheries Research Report 2062. Fielder, D.G., J.E. Johnson, J. R. Weber, M.V. Thomas and R.C. Haas, 2000, Fish population survey of Saginaw Bay, Lake Huron, 1989-97,” Michigan Dept. of Natural Resources, Fisheries Research Report No. 2052. Heimlich, R.E, K.D. Wioebe, R. Claassen, D. Gadsby, and R.M. House, 1998, “Wetlands and Agriculture: Private Interests and Public Benefits”, Agricultural Economics Report No. 765, Economic Research Service, USDA available on the web at www.wer.usda.gov/publications/aer765. Hoehn, J.P., F. Lupi, M. D. Kaplowitz, 2003, “Untying a Lancastrian bundle: valuing ecosystems and ecosystem services for wetland mitigation,” Journal of Environmental Management 68: 263-272. International Association of Fish and Wildlife Agencies, January 2003, “The Economic Importance of Hunting in America.” Washington, D.C. Jaworski, E., and C. N. Raphael, 1978, “Fish, Wildlife and Recreational Values of Michigan’s Coastal Wetlands,” Great Lakes Shorelands Section, Division of Land Resource Programs, Michigan Department of Natural Resources.

61
Kazmierczak, R.F., 2001a, “Economic Linkages Between Coastal Wetlands and Habitat/Species Protection: A Review of Value Estimates Reported in the Published Literature,” Agricultural Economics and Agribusiness Staff Paper 2001-01 available on the web at www.agecon.lsu.edu/faculty_staff/FacultyPages/Kazmierczak/SP2001-01Habitat.pdf Kazmierczak, R.F., 2001b, “Economic Linkages Between Coastal Wetlands and Hunting and fishing: A Review of Value Estimates Reported in the Published Literature,” Agricultural Economics and Agribusiness Staff Paper 2001-03, available on the web at www.agecon.lsu.edu/faculty_staff/FacultyPages/Kazmierczak/SP2001-03_Fishing.pdf Lupi, R, M. D. Kaplowitz, and J.P. Hoehn, 2002, “The economic equivalency of drained and restored wetlands in Michigan,” American Journal of Agricultural Economics, 5: 1355-1361. Mullarkey, D., 1997, “Contingent Valuation of Wetlands: Testing Sensitivity to Scope,” PhD Dissertation, University of Wisconsin. NOAA, 2004, Commercial fishing statistics from: http://www.st.nmfs.gov/commercial/landings/annual_landings.html Riffell, S.K., B.E. Keas, T.M. Burton, 2001, “Area and relationships of birds in Great Lakes coastal wet meadows,” Wetlands, 21 (4): 492-507. Riffell, S.K., B.E. Keas, T.M. Burton, 2003, “Birds in North American Great lakes coastal wet meadows: Is landscape context important?” Landscape Ecology, 18 (2): 95-111. Schuyt, K. and L. Brander, 2004, “The Economic Value of the World’s Wetlands”, WWF, Gland, Switzerland. USFWS, 2003, “2001 National and State Economic Impacts of Wildlife Watching”, USFWS Report 2001-2, Arlington VA. van Vuuren, W. and P. Roy, 1993, “Private and social returns from wetland preservation versus those from wetland conversion to agriculture,” Ecological Economics, 8: 289-305. Woodward, R.T. and Y.S. Wui, 2001, “The economic value of wetland services: a meta-analysis, Ecological Economics, 37: 257-270.
62
APPENDIX C:
TECHNICAL ECONOMIC TERMS USED IN THIS REPORT
Conditional logit – A regression model in which the dependent variable is a choice among a set
of alternatives. The independent variables are alternative specific. For example, recreationists choosing among a set of recreation sites might consider the travel costs to each site and the characteristics of each site. The conditional logit model estimates the impact of travel costs and characteristics on the probability that each site is chosen.
Contingent valuation method - The contingent valuation method is a valuation approach that
directly elicits willingness (and ability) to pay statements from survey respondents. In other words, respondents are directly asked about their willingness to pay (i.e., change in consumer surplus) for environmental improvement. The method involves the development of a hypothetical market via in-person, telephone, mail, or other types of surveys. In the hypothetical market respondents are informed about the current problem and the policy designed to mitigate the problem. The state of the environment before and after the policy is described. Other contextual details about the policy are provided such as the policy implementation rule (e.g., majority voting) and the payment vehicle (e.g., increased taxes or utility bills). Finally, a hypothetical question is presented that asks respondents to choose between improved water quality with increased costs, or the status quo.
Consumer surplus - The concept of consumer surplus is the basis for measuring net economic
benefits. Considering a market good, for example a car, the consumer surplus is the difference between what the consumer is willing (and able) to pay and the market price (amount actually spent) for the car. Consumer surplus is also called net willingness to pay (net WTP) since it is willingness to pay net of the costs. The consumer may be willing and able to pay the manufacturer’s suggested retail price of $35,000 for a new Ford Mustang. However, if the agreed-upon price is $31,000 then the consumer surplus is $4,000 – the difference between the consumer’s maximum willingness to pay and the market price. Non-market goods such as wetlands also provide consumer surplus. In the context of wetlands valuation, suppose an angler is willing and able to pay up to $125 for a fishing trip. If the cost of the trip is $25, then his consumer surplus is $125 - $25 = $100. Now suppose that some wetlands are preserved leading to a water quality improvement that, in turn, increases the angler's expected catch per trip. With the increase in expected catch, the angler's willingness to pay might increase to say, $160. If so, the angler's consumer surplus per trip after the wetlands protection is $160 - $25 = $135. The angler's economic gain from the quality improvement is the change is his consumer surplus, or $135 - $100 = $35.
Delta method - An approach for computing standard errors for complex functions of maximum
likelihood coefficient estimates by creating a linear approximation. For example, a probit willingness to pay model estimates the following function: y = α – βA, where y = 1 if the

63
respondent is willing to pay and 0 if the respondent is not willing to pay. A willingness to pay estimate is the ratio of the probit coefficients: WTP = α/β. Both α and β have individual standard errors. The Delta method develops a standard error for WTP.
Dependent variables – Consider a relationship between two or more variables: y = f(x). With this
equation we say that “y is a function of x.” This implies causality: changes in y are caused by changes in x. The dependent variable in this causal relationship is y.
Dillman survey approach – A procedure for conduction mail surveys in which multiple contacts
are made with potential survey respondents. A standard Dillman method would include a survey questionnaire mailing to a sample of respondents followed by a reminder/thank you post card one week later. Those who do not respond are sent a replacement survey about a month later. See http://survey.sesrc.wsu.edu/dillman/tailored%20design.htm.
Hypothetical bias - The most persistently troubling empirical result in the CVM (contingent
valuation method) literature is the tendency for hypothetical willingness to pay to overestimate real willingness to pay in laboratory and field settings. Respondents tend to state that they will pay for a good when in fact they will not, or they will actually pay less, when placed in a similar purchase decision. Hypothetical bias is usually attributed to the presence of passive use values (i.e., values that do not depend on recreation, or other on-site, use) and lack of familiarity of paying for resources that provide passive use value. However, hypothetical bias has been found in a variety of applications including private goods for which no passive use values should exist.
Independent variables – Consider a relationship between two or more variables: y = f(x). With
this equation we say that “y is a function of x.” This implies causality: changes in y are caused by changes in x. The independent variable in this causal relationship is x.
Negative binomial regression model – A regression model that estimates the impact of
independent variables on a count data (i.e., integer) independent variable. For example, survey respondents might be asked to provide an answer to a question about the number of recreation trips. The trip data might include zeros, ones, twos, threes and etc. An ordinary least squares regression model employs a normal distribution and requires that the data is continuous and normally distributed. Count data tends to be censored at zero, with a cluster of responses at zero and skewed. The negative binomial regression model estimates the probability of trips at each integer value.
Ordered probit regression model – A regression model that estimates the impact of independent
variables on an ordered, qualitative independent variable. For example, survey respondents might be asked to provide an answer to an attitudinal question where the provided responses are strongly agree, agree, disagree and strongly disagree. The four choices might be coded strongly agree = 1, agree = 2, disagree = 3 and strongly disagree = 4. A linear regression model would employ the assumption that “agree” is twice as large as “strongly agree” and “disagree” is three times as large as “strongly disagree.” The quantitative distance between items on this qualitative scale are not know. The
64
ordered probit model estimates the probability that each response is chosen and recognizes that there exists an ordinal ranking between items.
Provision point survey design - A type of donation payment rule in contingent valuation surveys
in which the minimum payments required for supply of a good are explicitly stated. Respondents are told that if the total donations are not sufficient to cover the cost of the good, then donations will be refunded in full. The provision point survey design has been shown to reduce free riding behavior by providing incentives for respondents to more truthfully reveal their willingness to pay.
Random utility model - A variation of the travel cost method. Unlike the traditional single-site
travel cost model which focuses on the number of trips taken, a random utility model uses information from multiple recreation sites and explains the site selection decision. Individuals choose a recreation site based on differences in trip costs and site characteristics between the alternative sites. Statistical analysis of the relationship between site characteristics and recreationists' site choices using the conditional logit enables estimation of any consumer surplus changes arising from any changes in site characteristics. In the site-selection travel cost method, yj = f(x1j, x2j), yj is the jth recreation site chosen, x1j is the travel cost to site j and x2j is site characteristics at site j.
Revealed preference approach – A valuation approach uses behavioral data to estimate the ex-
post willingness to pay for various commodities. The major strength of the revealed preference approaches is that they are based on actual observed choices. With revealed preference data, individuals consider the internal costs and benefits of their actions and experience the consequences of their actions. Choices based on the perceived costs and benefits better reflect the values of the population and allow more valid estimates of willingness to pay. The major weakness of revealed preference approaches is their reliance on historical data. By definition, new government policies and new products are beyond the range of historical experience. For example, few Michigan residents have experience with an increased amount of protected Saginaw Bay coastal marsh. Behavior in response to policies designed to protect marsh is nonexistent. In this situation, stated preference methods, such as the contingent valuation method, are useful.
Stated Preference approach – A valuation approach that uses hypothetical data to estimate the ex-
ante willingness to pay for various commodities (e.g., contingent valuation). A strength of the stated preference approaches is its flexibility. Stated preference approaches can be used to construct realistic policy scenarios for most new policies. Oftentimes, hypothetical choices are the only way to gain policy relevant information. Another strength of the stated preference approaches is the ability to measure passive-use values. The major weakness of the stated preference approaches is their hypothetical nature. Respondents are placed in unfamiliar situations in which complete information is not available.
Travel cost method - The travel cost method is a revealed preference method that is most often
used to estimate the benefits of outdoor recreation. The travel cost method begins with the insight that the major cost of outdoor recreation is the travel and time costs incurred

65
to get to the recreation site. Since individuals reside at varying distances from the recreation site, the variation in distance and the number of trips taken are used to trace out a demand curve for the recreation site. The demand curve is then used to derive the consumer surplus associated with using the site. With data on appropriate demand curve shift variables, the economic benefits associated with changes in the shift variables can be derived. In the single-site travel cost method, y = f(x1, x2, x3), y is the number of trips taken to the site, x1 is travel cost, x2 is income and x3 are site characteristics.