the sydney 2000 world weather research … · the sydney 2000 world weather research ... from july...
TRANSCRIPT

1041AUGUST 2003AMERICAN METEOROLOGICAL SOCIETY |
I
AFFILIATIONS: KEENAN, MAY, BALLY, POTTS, AND EBERT—Bureau of Meteorology Research Centre, Melbourne, Victoria,Australia; JOE AND SILLS—Meteorological Service of Canada,Downsview, Ontario, Canada; WILSON, CROOK, CARBONE,ROBERTS, AND MUELLER—National Center for AtmosphericResearch, Boulder, Colorado; COLLIER AND FOX—University ofSalford, Manchester, United Kingdom; GOLDING—Met Office,Braknell, Berkshire, United Kingdom; BURGESS AND EILTS—National Severe Storms Laboratory, Norman, Oklahoma;SEED—Bureau of Meteorology, Hydrology Branch, Melbourne,Victoria, Australia; BERRY—James Cook University, Townsville,
n 1998, the International Science Steering Com-mittee of the World Weather Research Programme(WWRP) established a process for undertaking
Forecast Demonstration Projects (FDPs). These FDPsaim to demonstrate the benefits of disseminating real-time forecasts—based on improved understandingand technology—to users in high impact weather situ-ations. The first WWRP FDP, described herein, fo-
cused on urban nowcasting and very short-term pre-diction of boundary layer conditions and associatedweather. It was held in part during the 2000 Olympicgames in Sydney, Australia.
The Sydney Organising Committee for the Olym-pic Games (SOCOG) and the Sydney ParalympicOrganising Committee (SPOC) required weather ser-vice support for planning and coordination of the
THE SYDNEY 2000 WORLDWEATHER RESEARCH
PROGRAMME FORECASTDEMONSTRATION PROJECT
Overview and Current Status
BY T. KEENAN, P. JOE, J. WILSON, C. COLLIER, B. GOLDING, D. BURGESS, P. MAY, C. PIERCE, J. BALLY,A. CROOK, A. SEED, D. SILLS, L. BERRY, R. POTTS, I. BELL, N. FOX, E. EBERT, M. EILTS, K. O’LOUGHLIN,
R. WEBB, R. CARBONE, K. BROWNING, R. ROBERTS, AND C. MUELLER
Queensland, Australia; BELL—Bureau of Meteorology CentralTraining Centre, Melbourne, Victoria, Australia; O’LOUGHLIN
AND WEBB—Bureau of Meteorology, Sydney, New SouthWales, Australia; BROWNING—University of Reading, Reading,United KingdomCORRESPONDING AUTHOR: Dr. Tom Keenan, Bureau ofMeteorology Research Centre, Melbourne, Victoria, AustraliaE-mail: [email protected]: 10.1175/BAMS-84-8-1041
In final form 20 December 2002©2003 American Meteorological Society
Nine nowcasting systems deployed in part during the 2000 Olympic Games
in Sydney, Australia, demonstrated the capability of modern forecast systems
and quantified the benefits of a real-time nowcast service.

1042 AUGUST 2003|
Sydney 2000 (S2000) games. Important issues con-cerned the effect of weather on individual sports andpotential impacts on the large number of people out-doors and on property. With potential for severeweather, nowcasts were a particularly important com-ponent of the weather service. The Bureau of Meteo-rology (BOM) in Australia was selected as the pro-vider of the S2000 weather services and an enhancedoperational service was mounted to support theseactivities. The WWRP FDP S2000 was built on expe-riences gained during the Atlanta Olympics in 1996described by Rothfusz et al. (1998).
The goal of the S2000 FDP was “to demonstratethe capability of modern forecast systems and to quan-tify the associated benefits in the delivery of a real-timenowcast service.”
The S2000 FDP was not just about providing newand improved systems for forecasters but also aboutdemonstrating the benefits to end users. To this end,the WWRP did and is providing ongoing support forverification and impact studies.
The S2000 FDP emphasized the 0–6-h time frame,employing state-of-the-art observationally basednowcasting systems from the United States, UnitedKingdom, Canada, and Australia. This brought to-gether for the first time a diverse range of operation-ally proven nowcasting systems and applied them toreal-time forecasting for an operational environment.The collocation of researchers and operational fore-casters in a common operational setting was alsounique. Both factors enhanced BOM nowcasting ser-vice to the Olympics and other BOM clients fromSeptember to November 2000.
SYDNEY ENVIRONMENT AND OBSERV-ING NETWORK. The observing network in andaround Sydney (Fig. 1) is in the coastal subtropicalplains 100–150 km east of the Australian Great Di-viding Range (with peaks > 1000 m high). The S2000Olympics were conducted during spring when theweather is usually pleasant with mild to warm maxi-mum temperatures (~20°C) and cool evenings (10°–12°C). However, the weather can be variable with po-tential for thunderstorms, lightning, hail, rain, andwind events primarily during frontal passages and eastcoast lows.
The BOM observational network and associatedsystems were significantly enhanced for this project.A network of automatic weather stations (15 units)was installed in the Sydney metropolitan area includ-ing at Olympic venues. Five portable stations devel-oped by the Bureau of Meteorology Research Centre(BMRC) were deployed specifically for the WWRP.
An additional network of 10 anemometers was in-stalled around Sydney Harbour. During the S2000FDP, rawinsonde soundings were available up to 4times per day depending on the weather.
As shown in Fig. 1, three radars supported theS2000 FDP. Two of these were existing operationalradars located at Wollongong (S-band, 2° beamwidth,reflectivity only) and Kurnell (C-band, 1° beamwidth,Doppler radar). These radars provided BOM standard1-km range resolution products prior to the S2000FDP. As part of the FDP, the Kurnell radar signalprocessor was upgraded to provide 250-m range reso-lution data in over 1000 range bins (to support high-resolution radar data requirements of WWRP sys-tems) and a dual pulse repetition frequency schemedescribed by May (2001) was adopted to avoid veloc-ity aliasing problems in WWRP detection algorithms.
From July 2000, the C-band Polarimetric radar(CPOL) described by Keenan et al. (1998) was locatedat Badgerys Creek some 40 km west of Sydney. CPOLwas deployed to enhance the boundary layer moni-toring of convergence zones shown to be importantby Wilson and Megenhardt (1997). Inland sea-breezepenetration, boundary layer rolls, and outflow bound-aries inland were not readily detectable by thecoastally located Kurnell radar. In addition, the po-larimetric measurements allowed microphysical spe-cies identification (Vivekanandan et al. 1999) andimproved radar-based rainfall estimates (Zrnic andRyzhkov 1996).
As a result of cross-calibration and intercompari-son, radar reflectivities from the three radars weregenerally within 1 dB by the start of the S2000 FDP.
Boundary layer wind profilers installed at Sydneyairport provided additional high-resolution verticalwind structure.
S2000 WWRP SYSTEMS. The following nowcastsystems were deployed as part of the S2000 FDP.
Canadian Radar Decision Systems (CARDS), 0–1.5 h. TheMeteorological Service of Canada CARDS is a Web-based system that assists forecasters in decisions onthe severity of weather (Lapczak et al. 1999). It ingeststhree-dimensional Doppler radar data and estimatesrainfall with automated algorithms and provides di-agnostic information on hail size, mesocyclone, tor-nadoes, downbursts, and other cell properties. Pointforecasts of precipitation occurrence are provided outto 90 min.
Warning Decision Support System (WDSS), 0–2 h. TheNational Severe Storms Laboratory (NSSL) WDSS

1043AUGUST 2003AMERICAN METEOROLOGICAL SOCIETY |
(Eilts et al. 1996) ingests Doppler radar, lightning, andsurface data and numerical weather prediction(NWP) forecasts as available. WDSS includes algo-rithms for tracking cells and detecting mesocyclones,tornadoes, hail, downbursts, and lightning.
Thunderstorm Identification, Tracking, Analysis and Now-casting (TITAN), 0–1 h. The National Center for At-mospheric Research (NCAR)–developed TITAN(Dixon and Weiner 1993) undertakes real-time au-tomated identification, tracking, and short-term fore-casting of thunderstorms based on volume scanweather radar data.
AutoNowcaster (AN), 0–2 h. The NCAR AN (Muelleret al. 2000) is an expert system that provides time- andspace-specific forecasts of thunderstorms. A uniquefeature is the ingest of output from a numerical modeland its adjoint using the Variational Doppler RadarAssimilation System (VDRAS) of Sun and Crook(1994, 1997) and Crook and Sun (2001). The AN au-tomatically detects, extrapolates, and characterizesboundary layer convergence lines and convectivestorms. It forecasts thunderstorm initiation, growth,and dissipation by considering stability, storm motionrelative to convergence lines, low-level shear, stormcharacteristics, and the presence of cumulus cloudsin the vicinity of convergence lines. The AN forecastsprecipitation rate on a 1-km grid every 5 min for 30-and 60-min periods.
CPOL Hydrometeor Classification(CHYD) and Rainfall. The BMRC hasdeveloped a “fuzzy” logic micro-physical classification scheme de-scribed by Keenan (1999). CHYDdeduces 10 hydrometeor species(drizzle, rain, rain/hail mixture,small hail, large hail, dry graupel,wet graupel, dry high density snow,dry low density snow, and wetsnow) and derives rain-rate esti-mates for each by polarimetrictechniques every 10 min.
Generating Advanced Nowcasts forDeployment in Operational Land-Sur-face Flood (GANDOLF) Forecasts,0–3 h. The United Kingdom MetOffice (UKMO) and the Universityof Salford developed GANDOLF(Pierce et al. 2000). Cell develop-ment from one stage to the next
may be instigated using a life cycle model with anobjective method of recognizing cell characteristicsfrom three-dimensional radar data linked to satelliteand mesoscale model data. Every 10 min GANDOLFproduces a 1-h forecast of the precipitation field.
Spectral Prognosis (SPROG), 0–1 h. SPROG (Seed andKeenan 2001) is an advection-based rainfall nowcast-ing system that exploits the observation that rainfieldscommonly exhibit both spatial and dynamic scalingproperties—that is, the lifetime of a feature in the fieldis dependent on the scale of the feature (large featuresevolve more slowly than small features)—and thatfeatures at all scales between the outer and inner ob-served scales are present in the field. Every 5 min,SPROG produced 0–1-h nowcasts at 10-min intervals.
Nimrod, 0–6 h. Nimrod (Golding 1998) is a veryshort-period forecasting system for precipitation,cloud, and visibility that has been operational in theUKMO since 1995. The basic approach is to use lin-ear extrapolation of present features and to incorpo-rate nonlinearities of evolution from the NWPmodel. Forecasts of 0–6 h are made with a 30-minupdate cycle, although a 15-min cycle is possible. ForS2000, only the precipitation component of Nimrodwas employed and NWP data was sourced from theBOM Limited Area Prediction System (LAPS; Puriet al. 1998).
FIG. 1. Sydney area and observational network of the WWRP S2000 FDP.
1044 AUGUST 2003|
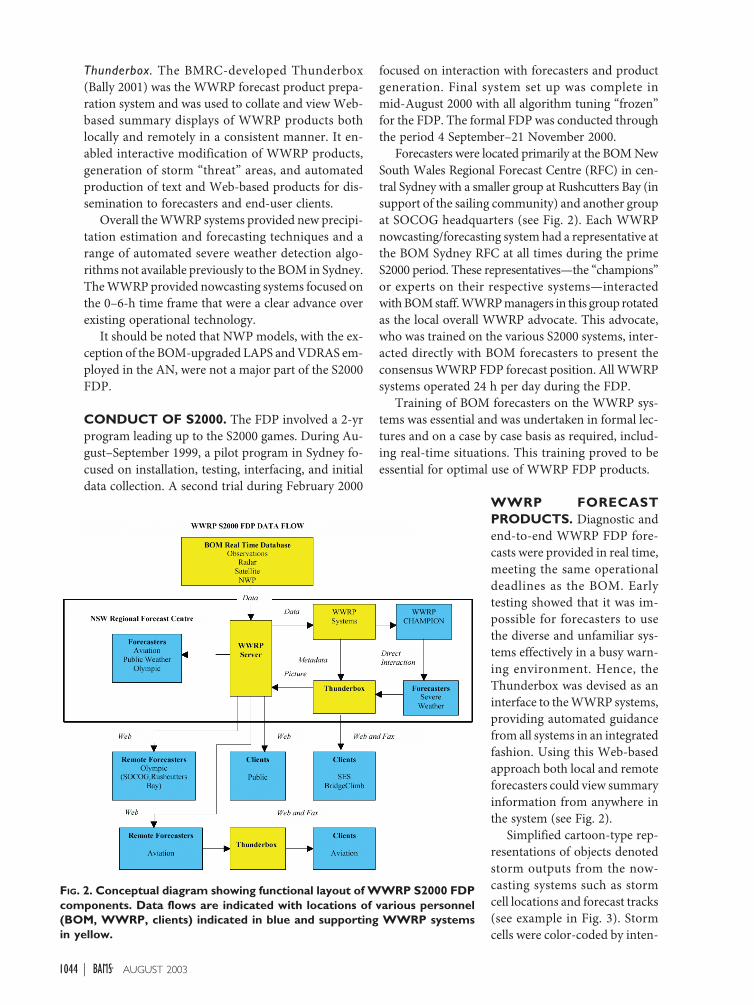
Thunderbox. The BMRC-developed Thunderbox(Bally 2001) was the WWRP forecast product prepa-ration system and was used to collate and view Web-based summary displays of WWRP products bothlocally and remotely in a consistent manner. It en-abled interactive modification of WWRP products,generation of storm “threat” areas, and automatedproduction of text and Web-based products for dis-semination to forecasters and end-user clients.
Overall the WWRP systems provided new precipi-tation estimation and forecasting techniques and arange of automated severe weather detection algo-rithms not available previously to the BOM in Sydney.The WWRP provided nowcasting systems focused onthe 0–6-h time frame that were a clear advance overexisting operational technology.
It should be noted that NWP models, with the ex-ception of the BOM-upgraded LAPS and VDRAS em-ployed in the AN, were not a major part of the S2000FDP.
CONDUCT OF S2000. The FDP involved a 2-yrprogram leading up to the S2000 games. During Au-gust–September 1999, a pilot program in Sydney fo-cused on installation, testing, interfacing, and initialdata collection. A second trial during February 2000
focused on interaction with forecasters and productgeneration. Final system set up was complete inmid-August 2000 with all algorithm tuning “frozen”for the FDP. The formal FDP was conducted throughthe period 4 September–21 November 2000.
Forecasters were located primarily at the BOM NewSouth Wales Regional Forecast Centre (RFC) in cen-tral Sydney with a smaller group at Rushcutters Bay (insupport of the sailing community) and another groupat SOCOG headquarters (see Fig. 2). Each WWRPnowcasting/forecasting system had a representative atthe BOM Sydney RFC at all times during the primeS2000 period. These representatives—the “champions”or experts on their respective systems—interactedwith BOM staff. WWRP managers in this group rotatedas the local overall WWRP advocate. This advocate,who was trained on the various S2000 systems, inter-acted directly with BOM forecasters to present theconsensus WWRP FDP forecast position. All WWRPsystems operated 24 h per day during the FDP.
Training of BOM forecasters on the WWRP sys-tems was essential and was undertaken in formal lec-tures and on a case by case basis as required, includ-ing real-time situations. This training proved to beessential for optimal use of WWRP FDP products.
WWRP FORECASTPRODUCTS. Diagnostic andend-to-end WWRP FDP fore-casts were provided in real time,meeting the same operationaldeadlines as the BOM. Earlytesting showed that it was im-possible for forecasters to usethe diverse and unfamiliar sys-tems effectively in a busy warn-ing environment. Hence, theThunderbox was devised as aninterface to the WWRP systems,providing automated guidancefrom all systems in an integratedfashion. Using this Web-basedapproach both local and remoteforecasters could view summaryinformation from anywhere inthe system (see Fig. 2).
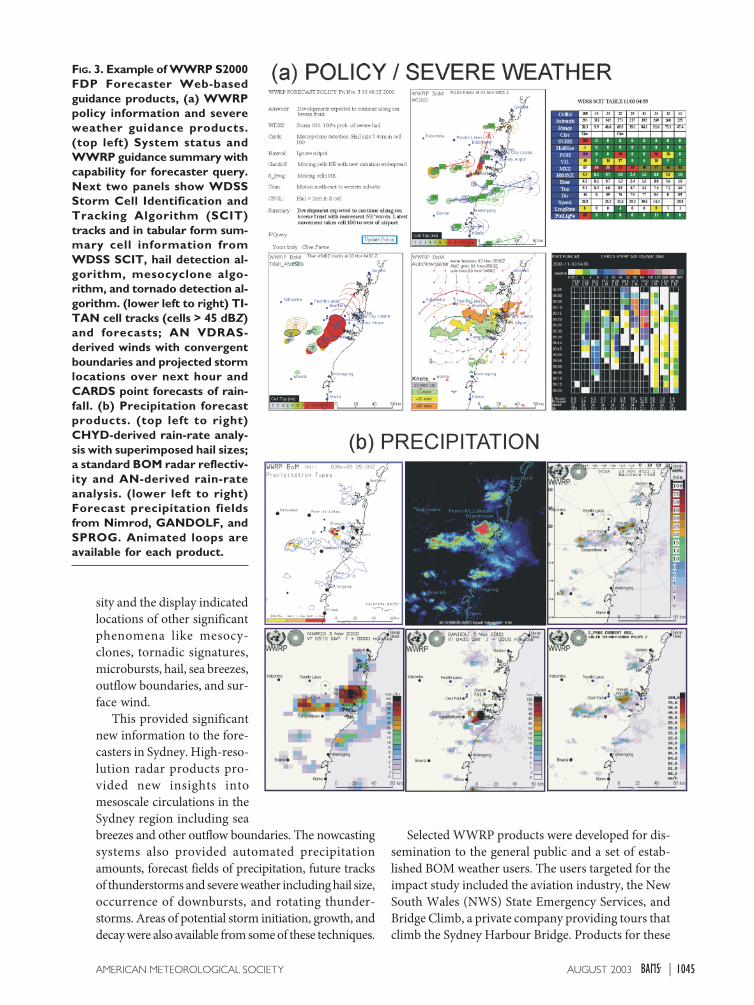
Simplified cartoon-type rep-resentations of objects denotedstorm outputs from the now-casting systems such as stormcell locations and forecast tracks(see example in Fig. 3). Stormcells were color-coded by inten-
FIG. 2. Conceptual diagram showing functional layout of WWRP S2000 FDPcomponents. Data flows are indicated with locations of various personnel(BOM, WWRP, clients) indicated in blue and supporting WWRP systemsin yellow.
1045AUGUST 2003AMERICAN METEOROLOGICAL SOCIETY |
sity and the display indicatedlocations of other significantphenomena like mesocy-clones, tornadic signatures,microbursts, hail, sea breezes,outflow boundaries, and sur-face wind.
This provided significantnew information to the fore-casters in Sydney. High-reso-lution radar products pro-vided new insights intomesoscale circulations in theSydney region including seabreezes and other outflow boundaries. The nowcastingsystems also provided automated precipitationamounts, forecast fields of precipitation, future tracksof thunderstorms and severe weather including hail size,occurrence of downbursts, and rotating thunder-storms. Areas of potential storm initiation, growth, anddecay were also available from some of these techniques.
FIG. 3. Example of WWRP S2000FDP Forecaster Web-basedguidance products, (a) WWRPpolicy information and severeweather guidance products.(top left) System status andWWRP guidance summary withcapability for forecaster query.Next two panels show WDSSStorm Cell Identification andTracking Algorithm (SCIT)tracks and in tabular form sum-mary cell information fromWDSS SCIT, hail detection al-gorithm, mesocyclone algo-rithm, and tornado detection al-gorithm. (lower left to right) TI-TAN cell tracks (cells > 45 dBZ)and forecasts; AN VDRAS-derived winds with convergentboundaries and projected stormlocations over next hour andCARDS point forecasts of rain-fall. (b) Precipitation forecastproducts. (top left to right)CHYD-derived rain-rate analy-sis with superimposed hail sizes;a standard BOM radar reflectiv-ity and AN-derived rain-rateanalysis. (lower left to right)Forecast precipitation fieldsfrom Nimrod, GANDOLF, andSPROG. Animated loops areavailable for each product.
Selected WWRP products were developed for dis-semination to the general public and a set of estab-lished BOM weather users. The users targeted for theimpact study included the aviation industry, the NewSouth Wales (NWS) State Emergency Services, andBridge Climb, a private company providing tours thatclimb the Sydney Harbour Bridge. Products for these

1046 AUGUST 2003|
end users were generated in real time by WWRP butvetted and sourced through the BOM. The Thunder-box system was used to render processed output datafrom WWRP systems—for example, WDSS StormCell Tracking Algorithm or TITAN storm tracks—and then automatically prepare end products in acommon graphics format. The emphasis was on pro-viding more geographic details and time specificationin warnings, site-specific information, text products,and simple pictures not requiring specialist meteoro-logical training for product interpretation. Dissemi-nation of products was via facsimile and the Web withsupport from direct interaction with users. This wasthe first time that these types of high-precisionnowcast products were provided directly to nonme-teorological users.
Examples of these products are shown in Fig. 4. Inthis case the WWRP Web-based product provided tothe NSW State Emergency Services on 3 November2000 during a tornadic storm is shown. Where appro-priate, other significant events were represented inthese products (e.g., a downburst and tornado). Thetornado was diagnosed automatically by the WWRPsystems. It should be noted that the Thunderbox en-abled the forecasters to fully edit the tracks, cells char-
acteristics, threat area, etc. Automated production oftext products conforming to BOM standards followedany such editing. This feature was essential to over-come possible errors in automated product generation,to resolve differences in the algorithm outputs, and tomaintain consistency with other official BOM warnings.
WEATHER AND EXAMPLES OF SIGNIFI-CANT NOWCAST EVENTS. A wide range ofevents required nowcasting during the S2000 FDP, asdescribed by Webb et al. (2001). Challenging nowcastissues included the movement of thunderstorms offthe mountains and into the Sydney basin, sea-breezedevelopment, possible inland motion of coastal show-ers, and pre- and postfrontal precipitation associatedwith southerly wind changes and major east coast lowsoff the coast. Normally the sea breeze moved inlandwithout generating thunderstorm activity. Convectiveevents occurred on some 39 days during the S2000FDP. Severe thunderstorms occurred in Sydney on 12days during the FDP.
Winds. A case in which convection was absent but withcomplex wind changes is shown in Fig. 5. The sea-breeze front (SBF) is clearly evident in the “clear air”
FIG. 4. Example of WWRP S2000 FDP product delivered via Web to NSW State Emergency Service. (a) Stormtrack, coded by storm intensity with projected storm track, and “storm threat area” for next hour. (b) Pointspecific time series for the occurrence of precipitation, color-coded by intensity.

1047AUGUST 2003AMERICAN METEOROLOGICAL SOCIETY |
signature of the radar data as a thin line “bowing” tothe west across the Sydney basin as it moves to thewest at ~3 m s−1. The bowing is thought to be associ-ated with higher terrain to the north and south ofSydney slowing advancement of the SBF. Winds at100-m height derived from the AN VDRAS are su-perimposed on the radar data in Fig. 5 and show on-shore southeasterly flow associated with the sea-breeze circulation behind the SBF. In the convergentwesterlies ahead of the SBF, an east-to-west-orientedfine line is evident. This east–west convergence(EWC) zone was observed on several occasions in theSydney basin and is thought to be associated with theinteraction of westerly flow with the mountains to thewest of Sydney. In this case, a weak southerly windchange was also progressing from the south throughthe Sydney domain and is shown by the AN VDRASwinds in Fig. 5. Enhanced convergence along theEWC zone and the southern part of the SBF results.The AN VDRAS analysis was able to capture the con-vergence along the SBF and the EWC.
Sometimes the establishment of low-level westerlywinds across the domain was evident behind a bow-ing fine line radar echo moving to the east (mirrorimage of the SBF in Fig. 5). Thiscould “overrun” the SBF and beassociated with a late afternoon in-crease in temperature.
Tracking such wind shifts andproviding onset times of frontsgives valuable information to avia-tion authorities. Typically Sydneyairport has 50 slots (take-offs orlandings) per hour, but can loseabout eight slots in an unplannedrunway reconfiguration versus fiveslots in a planned loss. The cost ofkeeping a Boeing 747 in holding forseven minutes at Sydney is typicallyAUD $2000. The ability of theWWRP S2000 FDP systems tomonitor and forecast these windchanges, as on 18 September, isobviously important. With theS2000 FDP, forecasters had un-precedented access to this capabil-ity in Sydney.
Webb et al. (2001) note otherexamples where the FDP made animportant contribution to windchange nowcasting. For instance,forecasts of the timing of wind andtemperature changes are crucial for
fire fighters. Identifying the edge of the gusty west-erly winds, as shown in Fig. 5, in conjunction withmesonet data (Fig. 1) contributed to nowcasts thatenabled fire agencies to reposition personnel prior tothe onset of dangerous conditions. Timing of windand temperature changes associated with southerly“bursters” (Colquhoun et al. 1985) was another im-portant use of S2000 FDP systems.
Severe weather. On 3 November 2000, a severe thun-derstorm event generated several weak tornadoes, hailto 7 cm in diameter, flash floods, and strong surfacewinds in the Sydney metropolitan area. Meteorologi-cal conditions of this storm are described in detail bySills et al. (2001). In this case, within a large-scaletrough, heating in the mountains initiated storms butit was additional lift and shear encountered at the sea-breeze front and forcing from outflow boundaries thatforced the severe thunderstorm. A long-lived stormmoved to the north along the sea-breeze front. At about0400 UTC, the outflow boundary from the main stormintersected a combined gust front/sea breeze. A hookecho ensued (Fig. 6a). A large bounded weak echoregion had echo tops near 19 km. Several short-lived
FIG. 5. Example of the capability of WWRP systems to diagnose windshifts affecting the Sydney area. Kurnell Doppler radar reflectivity at 0626UTC 18 Sep 2000 with superimposed wind vectors at a height of 180 m.The SBF moving to the west is indicated along with a stationary EWCboundary to the west of Sydney.

1048 AUGUST 2003|
tornadoes were observed during the following 30 minbelow a rotating and lowering cloud base (Fig. 6b).There was widespread hail, with whole neighborhoodscovered in some places to a depth of several centime-ters. Large roofs collapsed under the weight of thehail, and wind also destroyed roofs and uprooted andsnapped trees. A damage track survey, compiled inpart by the WWRP representatives (Fig. 6c), showsthree 400-m-wide distinct damage swaths clustered
in an area 6 km wide by 10 km long.One tornado caused F1 damage onthe Fujita (1981) scale over a 6-kmpath and the others caused F0 dam-age.
In WWRP S2000 FDP guidancevalid in the period 0440–0450 UTCprior to the tornado occurrence(Fig. 7), the main storm (denotedA) is evident along the coastal zone.Weaker storms are evident to thenorth, west, and south of the tor-nadic storm A. Analyzed and pro-jected cell locations based onTITAN are represented in sche-matic form in Fig. 7a with severeweather algorithm output from theCARDS overlaid. At this time,TITAN projected the storm tomove across Sydney as was ob-served. The tornadic storm A iscoded severe and at this time theCARDS algorithms indicate it hasa mesocyclone and up to 5-cm hail.Smaller hail is implied in storms tothe west. CHYD (Fig. 7b) impliesthat at 0440 UTC storm A has amixture of rain/hail, small hail, andlarge hail (> 2 cm) and that smallhail with a mixture of rain/hail ispresent in the storm located to thewest. WDSS guidance was consis-tent with the others. During the10 min encompassing 0450 UTC(not shown), WDSS indicated a100% probability of hail of any size,and 80%–100% probabilities of se-vere hail (> 2.5 cm) in storm A.
The WDSS mesocyclone algo-rithm implied rotation in storm Abetween 0440 and 0525 UTC. Atthis time, based on input fromWWRP, BOM forecasters up-graded their severe weather warn-
ing to emphasize the hazard from strong winds. At0525 UTC, at the time the tornado was observed, asshown in Fig. 7c (tornadic storm has CELLID 1),WDSS indicated the presence of a tornadic vortex sig-nature with a mesocyclone (TVSMES). The otherWDSS guidance included a severe convectivedownburst (SEVCNV), a 100% probability of hail ofany size, and a 60% probability of hail > 2.5 cm. TheCARDS guidance suggested the maximum hail size
FIG. 6. (a) Hook echo signature observed by CPOL at 0508 UTC 3 Nov2000. Winds from mesonet stations are overlaid. Note hook echo (HE)at intersection of outflow boundary (OFB), and combined SBF/gust frontconvergence zone. (b) Photograph taken at 0523 UTC of rotating andlowering cloud base associated with the tornadic storm (image courtesyof Matthew Smith). (c) Damage tracks associated with the 3 Nov 2000tornadic storm.

1049AUGUST 2003AMERICAN METEOROLOGICAL SOCIETY |
during the event was 7 cm, andhail this size was observed some5 km south of the tornadoes.
For this event, the severeweather guidance from the vari-ous WWRP S2000 FDP systemswas internally consistent andcorresponded well to observa-tions. In the context of the FDP,this was particularly encourag-ing, supporting the contentionthat the algorithms have the ro-bustness to be operated success-fully in varied climatic regimesand with new and independentdata sources. Additionally, theWWRP systems and “champi-ons” made a significant contri-bution to the real-time nowcast-ing of a rare and importantsevere weather event.
Rainbands. Figure 8 showsWWRP S2000 FDP input tonowcasts as successive rainbandsmoved from the northwest at17.5 m s−1 through the Sydneyarea. All guidance retains a two-band structure evident in theverifying analysis. However, dif-ferences do exist, particularly inthe intensity of precipitation,with Nimrod showing muchmore intense precipitation thanthe others. The precise locationof the bands also varies (withAN and SPROG moving the bands too rapidly to theeast). In this case, use of GANDOLF was probably in-appropriate, given it was developed for “airmass”thunderstorm activity. The weakening of convectiveprecipitation in SPROG is also consistent with theexpected model behavior.
With a large component of stratiform rain in thiscase, significant differences occur in the guidancewhen considering 30-min point forecasts. The gen-eral pattern considered on a rain/no rain basis is, how-ever, reasonably consistent. Verification studies arepresently assessing the predictability of such point andgridded pattern nowcasts (see below).
IMPACT STUDIES. A societal and economic im-pacts assessment project was a key component of theS2000 FDP. The impact study intended to determine
and measure the uses, benefits, and value of enhancednowcasts, warning systems, and information providedby S2000 FDP. Primary questions were “how is theenhanced S2000 FDP information used to producemore useful nowcasts?” and “are the (enhanced)nowcasts used and acted upon by the end users?”
The impact studies focused attention on
• forecasters responsible for public, severe weather,and aviation forecasting within the NSWRFC—included were a special set of forecasters employedfor the provision of Olympic weather services; and
• end users from the New South Wales State Emer-gency Services (SES), the Air Traffic Control Au-thority (AoA), airlines (Ansett Australia,QANTAS, and United Airlines), BridgeClimb, andthe general public.
FIG. 7. Comparison of WWRP S2000 FDP forecaster guidance informationnear 0440 UTC during the 3 Nov 2000 tornadic storm. (a) TITAN (45-dBZthreshold) observed cell locations and forecast cell locations at 10-min in-tervals. Output from CARDS algorithm superimposed. Main cell generat-ing the tornado is denoted by A. (b) CYHD polarimetric rain-rate analysiswith hail species superimposed. (c) WDSS SCIT summary information onwithin storm rotation (CIRC), downburst (BURST), severe hail (SVRH)probability of hail of any size (inches), and other radar parameters for vari-ous cells. Note CELLID 1 is storm A.

1050 AUGUST 2003|
The overwhelming response from WWRP prod-uct users was positive. All groups, including the gen-eral public, demonstrated utility and potential utilityof the WWRP products.
Direct economic benefits were less well demon-strated, primarily because of the limited duration ofthe trial. However, BridgeClimb was able to reducefinancial loss and inconvenience to the “climbing”
public by minimizing weather-relatedsuspension of operations. Air ServicesAustralia, airlines, and the NSW SESwere able to identify potential cost sav-ing and loss reduction using the high-definition WWRP nowcast products.
Forecasters felt that involvement inthe FDP had given them a unique op-portunity to embrace new technologyand extend their forecasting capabil-ity. As experience, practice, and in-creased interaction with WWRP sys-tem champions reinforced initialtraining, the use of WWRP productsin the forecast process increased.However, WWRP products were notused in isolation by forecasters andthey had access to familiar proceduresand technology. In this sense, now-casting during the FDP employed acombination of existing techniquesand new information from WWRP.The impacts study clearly demon-strated the importance of training andcommunication in establishing newtechnology and processes. Direct in-volvement of the system developersand forecasters in a common opera-tional setting was seen as most benefi-cial to both camps.
The impacts study established agreater awareness to end-user require-ments, raising the level of communi-cation and feedback associated withthe provision of BOM weather ser-vices. This applied to both the fore-casters and end users. During theOlympics, not only was precipitationonset time important for event orga-nizers, but its cessation time wasequally or more important. For theSES, past storm tracks were just asimportant as future tracks, given re-source deployment issues. Duringplanning, potential weather impacts
on exposed spectators and participants became im-portant for Olympic event managers.
Perception of forecast quality depended somewhaton a person’s role. Forecasters generally consideredissues of technical accuracy as most important. Usersconsidered product “effectiveness” in terms of time-liness and comprehensibility and suitability for deci-sion-making. Communication between producers
FIG. 8. Comparison of WWRP 30-min precipitation forecasts of rain-bands occurring at 0130 UTC 7Sep 2001. Forecasts are from (a)Nimrod, (b) GANDOLF, (c) AN,and (d) SPROG with (e) a verify-ing analysis. The rain-rate table isin mm h−1.
1051AUGUST 2003AMERICAN METEOROLOGICAL SOCIETY |
and users often facilitated better nowcasts in terms ofend-user utility.
In terms of overall impact, aviation and severeweather products developed as part of WWRP arenow being developed and integrated into the provi-sion of BOM services.
VERIFICATION STUDIES. An internationalteam assembled by the WWRP from Australia,Canada, Finland, Germany, the United Kingdom, andthe United States is verifying S2000 FDP products.They are considering six areas of nowcasting:
• convective cell nowcasting and prediction of speedand direction;
• accuracy of quantitative precipita-tion nowcasting, including rainrate and occurrence;
• accuracy of nowcasts of boundarylayer convergence;
• accuracy of severe thunderstormwind gust nowcasts;
• accuracy of hail location and sizedetections and nowcasts; and
• improvements by forecasters to au-tomated nowcasts.
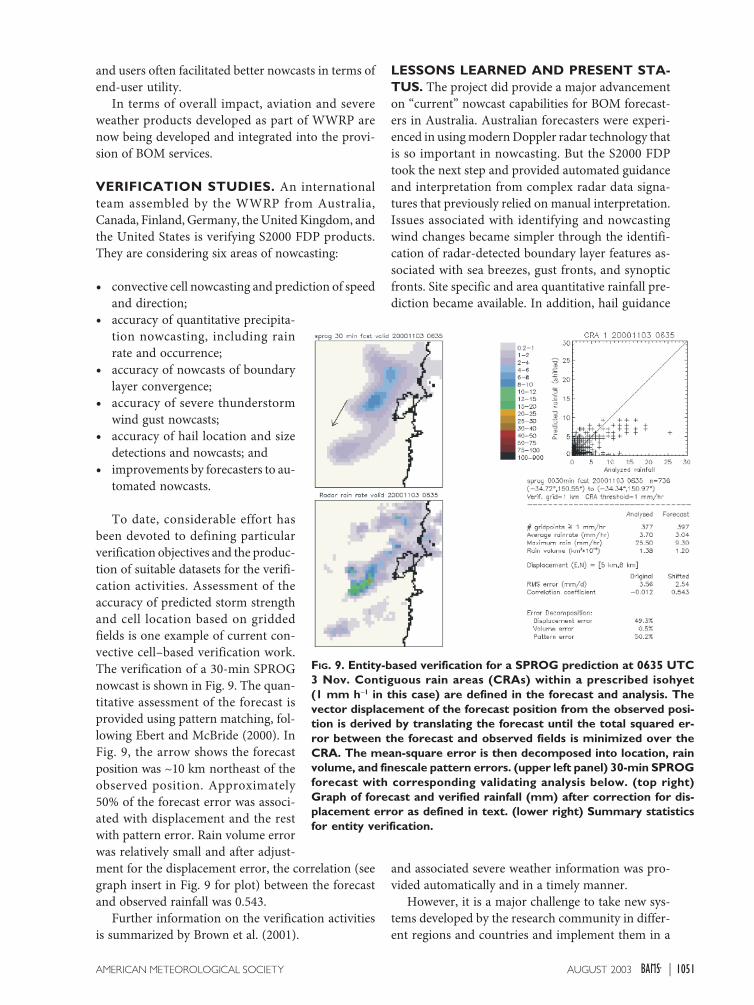
To date, considerable effort hasbeen devoted to defining particularverification objectives and the produc-tion of suitable datasets for the verifi-cation activities. Assessment of theaccuracy of predicted storm strengthand cell location based on griddedfields is one example of current con-vective cell–based verification work.The verification of a 30-min SPROGnowcast is shown in Fig. 9. The quan-titative assessment of the forecast isprovided using pattern matching, fol-lowing Ebert and McBride (2000). InFig. 9, the arrow shows the forecastposition was ~10 km northeast of theobserved position. Approximately50% of the forecast error was associ-ated with displacement and the restwith pattern error. Rain volume errorwas relatively small and after adjust-ment for the displacement error, the correlation (seegraph insert in Fig. 9 for plot) between the forecastand observed rainfall was 0.543.
Further information on the verification activitiesis summarized by Brown et al. (2001).
LESSONS LEARNED AND PRESENT STA-TUS. The project did provide a major advancementon “current” nowcast capabilities for BOM forecast-ers in Australia. Australian forecasters were experi-enced in using modern Doppler radar technology thatis so important in nowcasting. But the S2000 FDPtook the next step and provided automated guidanceand interpretation from complex radar data signa-tures that previously relied on manual interpretation.Issues associated with identifying and nowcastingwind changes became simpler through the identifi-cation of radar-detected boundary layer features as-sociated with sea breezes, gust fronts, and synopticfronts. Site specific and area quantitative rainfall pre-diction became available. In addition, hail guidance
and associated severe weather information was pro-vided automatically and in a timely manner.
However, it is a major challenge to take new sys-tems developed by the research community in differ-ent regions and countries and implement them in a
FIG. 9. Entity-based verification for a SPROG prediction at 0635 UTC3 Nov. Contiguous rain areas (CRAs) within a prescribed isohyet(1 mm h−1 in this case) are defined in the forecast and analysis. Thevector displacement of the forecast position from the observed posi-tion is derived by translating the forecast until the total squared er-ror between the forecast and observed fields is minimized over theCRA. The mean-square error is then decomposed into location, rainvolume, and finescale pattern errors. (upper left panel) 30-min SPROGforecast with corresponding validating analysis below. (top right)Graph of forecast and verified rainfall (mm) after correction for dis-placement error as defined in text. (lower right) Summary statisticsfor entity verification.

1052 AUGUST 2003|
new operational environment in a foreign country,making them work effectively for both forecasters andend users. This was the goal of the S2000 FDP and inthe process many lessons were learned.
Implementing the WWRP system was a big under-taking for the BOM host and the various WWRP par-ticipants. Getting the various systems to operatewithin the BOM infrastructure required upgrades tothe BOM systems with tuning and associated ratio-nalization in the operations of the WWRP systems.The BOM required upgrades to radar signal process-ing, communication, and data servers before theWWRP systems could function adequately. Policydecisions and clarification of the respective roles ofstandard BOM and the enhanced WWRP productswere very important and required before the BOMwould support the FDP. Issues included potentialproblems associated with conflicting information inBOM and WWRP forecast products, responsibilitiesfor products issued via BOM sources, the extent towhich “experimental” WWRP products should beused to enhance “official” BOM products and the roleof WWRP in forecast product evaluation given estab-lished BOM clients were involved.
For the WWRP, the Australian data sources re-quired significant algorithm tuning—for example, C-band versus S-band radar data (Nyquist intervalsmaller, more frequent occurrence of attenuation ef-fects), occurrence of extensive sea clutter, restrictionto hourly satellite data (AN cloud-detection algo-rithms could not be invoked), and a different NWPsource (Nimrod and GANDOLF). As a result, theimplementation required longer lead times and morepreoperation trials than expected.
Earlier implementation of final WWRP productswould probably have resulted in more effective train-ing, quality assurance, real-time verification, and in-creased initial forecaster confidence. More effectiveend-user product design and the associated impactstudy implementation and on-going monitoringwould have occurred. With stable end products, cli-ents would have been more experienced in their in-terpretation and use. Unfortunately, for many reasonsit was not possible to establish new integrated observ-ing networks, nine new and foreign WWRP forecastsystems, and undertake training of forecasters and endusers to an optical extent in the one year allocated.
Hence to a certain degree the three-month evalu-ation period of the FDP was at best minimal and is-sues discussed above were compounded because oftime constraints. More time would have ensured morefrequent and significant weather events and of coursemore use of WWRP systems. The impact of new tech-
nology on the forecast process and ultimately theimpact on end products typically requires severalyears, as indicated in data presented by Crum et al.(1998) for the Next Generation Weather Radar(NEXRAD).
Implementation of more explicit NWP productswould have enhanced our knowledge of dynamicalfactors affecting nowcasting and significantly im-proved guidance for the associated outlook period(say 24 h). This sort of guidance would have beenvaluable in enhancing the production of many BOMproducts, especially during Olympic events that ex-tended beyond the 3-h validity period on whichWWRP systems focused. These longer-term forecastswere often time consuming and based essentially onassessment of NWP information. Although nowcast-ing is often significant for large impact events (e.g.,severe storms, flooding), systems for more routineand regular generic products such as Terminal AreaForecasts can also have significant impact on issuesand work practices directly affecting a forecaster.More FDP contribution to those issues would cer-tainly have made a stronger impact across all forecastactivities.
This FDP did involve state-of-the-art systems andapplications. In many cases the applications per-formed well and were obviously robust for operations.Many participants felt that a store of these applicationsin a more modular, independent form would assistcase-by-case-type nowcast developments under wayin many countries. Under this scenario, full implemen-tation of entire WWRP systems would not be necessary.
SUMMARY AND CONCLUSIONS. The S2000FDP brought together diverse nowcast systems thatfor the first time covering many nowcast timescalesand applications. No single system provided this ca-pability and in totality they provided a glimpse of thefuture. Consistent with its goal, the S2000 FDP dem-onstrated that advanced nowcast systems were robustand transferable to a new location and could be oper-ated successfully in an operational forecastenvironment. The FDP showed that internationalcollaboration can be focused on local problems anddemonstrates that global solutions exist to manynowcasting problems with significant economic andsocietal impact.
The S2000 FDP was very successful in bringingdevelopers, forecasters, and end users together towork on common problems in an operational setting.In this respect it acted as a bridge between all threegroups with significant cross-fertilization of ideas, on-going evaluation of systems and concepts in a way that

1053AUGUST 2003AMERICAN METEOROLOGICAL SOCIETY |
no research workshop environment can ever simulate.This was especially the case for the internationalgroup of researchers involved in the project. The FDPpresented a cost-effective approach to gain in-depthunderstanding and evaluation of the various systemsinvolved in the S2000 FDP. The gains from thisunique and effective approach should be recalledwhen people ask about the possible benefits of par-ticipating in a nowcasting project on the other sideof the planet. All nations involved are building on thelessons learned during S2000.
A unique training workshop (see sidebar) heldduring the S2000 FDP provided the attendees unprec-edented access to the WWRP systems, champions,and to the lessons learned. However, training, a fun-damental issue often not developed and maintainedto the degree required in the implementation of newapproaches, again proved important during S2000FDP. The human role was also important in under-standing why differences appeared in WWRP guid-ance. For the AN, which attempts to forecast thegrowth and decay of storms, human intervention wasemployed routinely to enter and interpret convergentzones in the boundary layer; that is, it employed a mixof machine and man. Hence training of people is in-tegral to nowcasting.
The S2000 FDP has spawned nowcasting impactand verification studies that are continuing. For thefirst time an independent international group is fo-cused on verification of nowcasts using a commondataset generated under operational conditions usingthe latest nowcast approaches. The impact studieshave taken the evaluation beyond the more usual in-house measures relating to forecast office experienceand the system errors. The usage and understandingof information presented to end users is ultimately asimportant as the nowcasting process itself and clearlyneeds to be incorporated in any evaluation process.
Importantly, all involved saw advantages in thecontinuation of the project and many of the WWRPsystems are still being employed by the BOM inSydney.
ACKNOWLEDGMENTS. This project was conductedwith the direct and indirect support of many agencies andindividuals. The BOM, as host, provided considerable on-going and infrastructure support for the FDP and manyindividuals contributed much to ensure the projects suc-cess. The participation of the Autonowcaster and NCARpersonnel was made possible by the U.S. Weather ResearchProgram and NSF base funds to NCAR.
REFERENCESBally, J., 2001: Generating severe weather warnings from
TITAN and SCIT thunderstorm tracks. Preprints,30th Conf. on Radar Meteorology, Munich, Germany,Amer. Meteor. Soc., 489–491.
Brown, B., and Coauthors, 2001: Forecast verificationactivities for the Sydney 2000 Forecast Demonstra-tion Project. Preprints, 30th Conf. on Radar Meteo-rology, Munich, Germany, Amer. Meteor Soc., 500–502.
Colquhoun, J. R., D. J. Sheperd, C. E. Coulman, R. K.Smith, and K. McInees, 1985: The southerly bursterof southeastern Australia: An orographically forcedcold front. Mon. Wea. Rev., 113, 2090–2107.
Crook, N. A., and J. Sun, 2001: Assimilating radar, sur-face, and profiler data for the Sydney 2000 ForecastDemonstration Project. Preprints, 30th Conf. on Ra-dar Meteorology, Munich, Germany, Amer. Meteor.Soc., 480–483.
Crum, T., R. E. Saffle, and J. Wilson, 1998: An updateon the NEXRAD program and future WSR-88D sup-port to operations. Wea. Forecasting, 13, 253–262.
THE S2000 TRAINING WORKSHOPThe operation of these diverse nowcastingsystems in a common operational setting provideda unique opportunity to conduct an internationalWMO-sponsored training workshop in conjunc-tion with the S2000 FDP. The workshop wasaimed at providing training and experience in theuse of modern nowcast systems and proceduresenabling participants to
• further their understanding of the latestnowcasting science;
• assess the current status of advanced nowcast-ing systems;
• assess the potential and value, as well asrelative strengths and weaknesses, of thevarious nowcasting methods; and
• be aware of the issues involved in the develop-ment and deployment of various nowcastingsystems.
The workshop involved introductory theory,lectures focused on understanding the FDPsystems, familiarization with Sydney weather, andgaining an appreciation of the aims and operationof the FDP, including the verification and impactstudies. Hands-on experience followed using“canned” Sydney-based nowcast case studies withthe various S2000 FDP systems, and when pos-sible, real-time cases as they evolved.

1054 AUGUST 2003|
Dixon, M., and G. Wiener, 1993: TITAN: Thunder-storm identification, tracking, analysis, and nowcast-ing—A radar-based methodology. J. Atmos. OceanicTechnol., 10, 785–797.
Ebert, E. E., and J. L. McBride, 2000: Verification of pre-cipitation in weather systems: Determination of sys-tematic errors. J. Hydrol., 239, 179–202.
Eilts, M., and Coauthors, 1996: Severe weather warningdecision support system. Preprints, 18th Conf. onSevere Local Storms, San Francisco, CA, Amer. Me-teor. Soc., 536–540.
Fujita, T. T., 1981: Tornadoes and downbursts in thecontext of generalized planetary scales. J. Atmos. Sci.,38, 1511–1534.
Golding, B. W., 1998: Nimrod: A system for generatingautomated very short range forecasts. Meteor. Appl.,5, 1–16.
Keenan, T., 1999: Hydrometeor classification with a C-Band polarimetric radar. Preprints, 29th Int. Conf. onRadar Meteorology, Montreal, QC, Canada, Amer.Meteor. Soc., 184–187.
——, K. Glasson, F. Cummings, T. Bird, J. Keeler, and J.Lutz, 1998: The BMRC/C-band polarimetric (CPOL)radar system. J. Atmos. Oceanic Technol., 15, 871–886.
Lapczak, S., and Coauthors, 1999: The Canadian Na-tional Radar Project. Preprints, 29th Int. Conf. onRadar Meteorology, Montreal, QC, Canada, Amer.Meteor. Soc., 327–330.
May, P., 2001: Mesocyclone and microburst signaturedistortion with dual PRT radars. J. Atmos. OceanicTechnol., 18, 1229–1233.
Mueller, C. K., T. Saxen, R. Roberts, and J. Wilson, 2000:Evaluation of the NCAR thunderstorm Auto-Nowcast system. Preprints, Ninth Conf. on the Avia-tion, Range and Aerospace Meteorology, Orlando, FL,Amer. Meteor. Soc., J40–J45.
Pierce, C. E., P. J. Hardaker, C. G. Collier, and C. M.Haggett, 2000: GANDOLF: A system for generatingautomated nowcasts of convective precipitation.Meteor. Apps., 7, 341–360.
Puri, K., G. S. Dietachmayer, G. A. Mills, N. E. Davidson,R. A. Bowen, and L. W. Logan, 1998: The new BMRCLimited-Area Prediction System: LAPS. Aust. Me-teor. Mag., 47, 203–223.
Rothfusz, L. P., M. R. McLaughlin, and S. K. Rinard,1998: An overview of NWS support to the XXVIOlympiad. Bull. Amer. Meteor. Soc., 79, 845–860.
Seed, A., and T. Keenan, 2001: A dynamic and spatialscaling approach to advection forecasting. Preprints,30th Conf. on Radar Meteorology, Munich, Germany,Amer. Meteor. Soc., 492–494.
Sills, D., J. Wilson, C. Mueller, N. Fox, D. Burgess, P. Joe,P. Dunda, and R. Webb, 2001: Meteorological aspectsof the 3 November 2000 severe storms in Sydney,Australia. Preprints, 30th Conf. on Radar Meteorology,Munich, Germany, Amer. Meteor. Soc., 495–497.
Sun, J., and A. Crook, 1994: Wind and thermodynamicretrieval from single-Doppler measurements of agust front observed during Phoenix II. Mon. Wea.Rev., 122, 1075–1091.
——, and ——, 1997: Dynamical and microphysical re-trieval from Doppler radar observations using acloud model and its adjoint. Part I: Model develop-ment and simulated data experiments. J. Atmos. Sci.,54, 1642–1661.
Vivekanandan, J., D. S. Zrnic, S. M. Ellis, R. Oye, A. V.Ryzhkov, and J. Straka, 1999: Cloud microphysicsretrieval using S-Band dual polarization radar mea-surements. Bull. Amer. Meteor. Soc., 80, 381–388.
Webb, R. M., A. Treloar, J. Colquhoun, R. Potts, J. Bally,T. Keenan, and P. May, 2001: Overview of Sydneyweather during the Forecast Demonstration Project.Preprints, 30th Conf. on Radar Meteorology, Munich,Germany, Amer. Meteor. Soc., 477–479.
Wilson, J. W., and D. L. Megenhardt, 1997: Thunder-storm initiation, organization, and lifetime associ-ated with Florida boundary layer convergence lines.Mon. Wea. Rev., 125, 1507–1525.
Zrnic, D. S., and A. Ryzhkov, 1996: Advantages of rainmeasurements using specific differential phase. J.Atmos. Oceanic Technol., 13, 454–464.